Abstract
Access to renewable energy is vital for rural development and climate change mitigation. The intermittency of renewable sources necessitates efficient energy storage, especially in off-grid applications. This study evaluates the technical, economic, and environmental performance of an off-grid hybrid system for the rural settlement of Soma, Turkey. Using HOMER Pro 3.14.2 software, a system consisting of solar, wind, battery, and hydrogen components was modeled under four scenarios with Cyclic Charging (CC) and Load Following (LF) control strategies for optimization. Life cycle assessment (LCA) and hydrogen leakage impacts were calculated separately through MATLAB R2019b analysis in accordance with ISO 14040 and ISO 14044 standards. Scenario 1 (PV + wind + battery + H2) offered the most balanced solution with a net present cost (NPC) of USD 297,419, with a cost of electricity (COE) of USD 0.340/kWh. Scenario 2 without batteries increased hydrogen consumption despite a similar COE. Scenario 3 with wind only achieved the lowest hydrogen consumption and the highest efficiency. In Scenario 4, hydrogen consumption decreased with battery reintegration, but COE increased. Specific CO2 emissions ranged between 36–45 gCO2-eq/kWh across scenarios. Results indicate that the control strategy and component selection strongly influence performance and that hydrogen-based hybrid systems offer a sustainable solution in rural areas.
1. Introduction
Electricity is an essential form of energy for sustaining critical infrastructure, such as healthcare, communication, transportation, and water supply, which are indispensable services of modern societies. However, as the majority of electricity generation still relies on fossil fuels, the energy sector remains a major source of global greenhouse gas emissions [1]. Since the mid-20th century, increasing CO2 emissions have posed a significant obstacle in the fight against climate change [2]. In Turkey, as of 2024, coal-fired power plants account for more than 35% of electricity generation, resulting in approximately 552.2 million tons of CO2 emissions annually across the country [3,4,5]. According to the projections by the International Energy Agency (IEA), meeting the growing electricity demand sustainably will require the rapid deployment of energy storage systems in conjunction with renewable energy resources [6,7,8,9].
The inherent intermittency of renewable energy production is one of the main problems threatening the security of supply. At this point, hydrogen stands out as a promising energy carrier thanks to its high specific energy density, long-term storage capacity, and the solutions it offers in sectors that are difficult to decarbonize [10,11,12,13]. “Green hydrogen” obtained from renewable resources through electrolysis makes strategic contributions to the energy transition by offering zero carbon emissions not only from production but also after use. The integrated use of hydrogen, especially in transportation, heavy industry, and off-grid settlements, offers significant advantages in terms of environmental sustainability. However, the environmental impacts of hydrogen are not limited to the emission values at the moment of end-use. It needs to be evaluated from a wide life cycle perspective, from production processes to storage and even atmospheric leakage possibilities [14]. In particular, it is emphasized in the literature that hydrogen leakage can extend the lifetime of greenhouse gases, such as methane and ozone, by reducing OH radicals in the atmosphere, thus creating indirect emission effects [15]. Therefore, the environmental impacts of hydrogen-based systems throughout their life cycle should be comprehensively analyzed. In Turkey, despite the increase in renewable energy capacity, the systematic integration of hydrogen in emission-intensive sectors, such as industry and transportation, is still in its infancy [16,17,18]. According to Sabanci University IICEC’s 2022 analysis, Turkey has the potential to produce 3.4 million tons of green hydrogen per year [16]. On the other hand, the targets set in the National Hydrogen Technologies Strategy have not yet been fully reflected in field applications; studies on hydrogen-based off-grid system designs, especially in rural areas, have remained very limited in the literature [19,20,21,22]. As shown in Table 1, recent studies examining the technical, economic, and environmental performances of hydrogen-based hybrid energy systems are presented in the literature.

Table 1.
Literature table.
Recent studies highlight the importance of optimization and storage strategies in distributed generation and microgrid planning [35,36]. Based on these insights, this study investigates hybrid solar–wind–hydrogen systems to meet rural off-grid energy demand. While the studies summarized above show that hybrid systems are technically and environmentally promising, applications to rural areas and comprehensive evaluations of the environmental impacts of hydrogen are still scarce.
This study aims to design a low-carbon energy system based on PV–wind–hydrogen integration for a rural, off-grid village in Manisa, Turkey. The novelty of the research lies in (i) the integration of hydrogen leakage into technology, economics and environmental optimization, (ii) the simultaneous assessment of the carbon and life cycle impacts of hydrogen production, storage and leakage, and (iii) the analysis according to local resource and demand scales in rural areas of Turkey. This approach fills an important gap in the literature for carbon neutral energy planning and sustainable use of hydrogen.
In this context, Section 2 presents the methodology, including the study area, load profile, system components, simulation tool, carbon calculation method, and scenario analysis. Section 3 includes the findings and discussion, covering energy performance, emission results, sensitivity analysis, and literature comparisons.
2. Materials and Methods
In this study, the technical, economic, and environmental performance of an off-grid hybrid PV–wind–hydrogen energy system is analyzed on a scenario basis. Simulation and optimization processes were performed with HOMER Pro 3.14.2 software [37]. The system components include photovoltaic panels, wind turbines, electrolyzer, hydrogen tank, fuel cell, converter, and lithium-ion battery, and the capacity ranges for each component are optimized within certain limits.
As part of the economic assessment, net present cost (NPC), levelized cost of energy (COE), investment, and annual operating costs were calculated for each scenario. In the technical analysis, indicators, such as energy production, consumption, unmet load, capacity deficiency, and over generation rate were analyzed.
In the environmental analysis, in addition to the direct carbon emissions calculated by HOMER Pro, hydrogen production, storage, and consumption processes were evaluated with a life cycle analysis (LCA) approach. In addition, the carbon footprint of system components due to production and the impact of hydrogen leakage on indirect global warming potential were calculated and compared on a scenario basis [38]. These analyses reveal that environmental sustainability should be addressed not only with direct emissions but also with the indirect impacts of component lifetimes, production processes, and hydrogen infrastructure. The flowchart of the steps followed in this study is given in Figure 1.
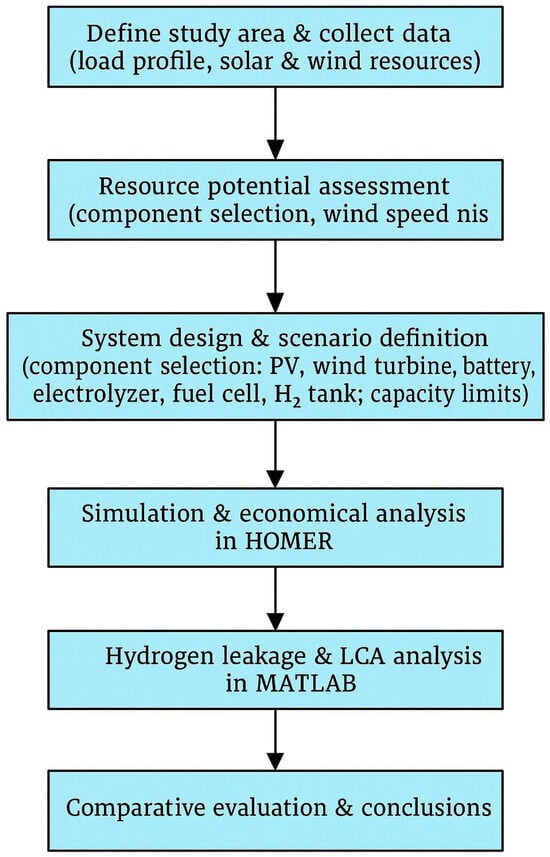
Figure 1.
Methodological flowchart for the off-grid hybrid PV–wind–hydrogen system analysis.
2.1. Modeling and Optimization
In this study, a scenario-based analysis of hydrogen-based energy storage components (electrolyzer, fuel cell, hydrogen tank) and battery systems integrated into a hybrid generation system based on solar and wind resources is performed. The modeling and optimization process was performed using HOMER Pro software developed by the National Renewable Energy Laboratory (NREL) [37,39]. HOMER Pro simulates the energy balance on an hourly basis for an entire year by integrating (i) meteorological inputs (solar radiation from Solar Global Atlas and wind speed from Wind Global Atlas), (ii) community load profiles scaled with TurkStat household consumption data, and (iii) technical and cost parameters of PV modules, wind turbines, electrolyzers, fuel cells, hydrogen tanks, batteries, and converters. Default cost and efficiency values from the HOMER database were applied unless more specific values were reported in the literature.
The software models electricity generation, storage, hydrogen production and consumption, and economic outcomes to determine the most efficient system configuration. In this study, the hydrogen related components available in HOMER, namely the PEM electrolyzer, hydrogen storage tank, and fuel cell, are explicitly included to evaluate the long-term storage capacity and ensure supply reliability in different operational scenarios. During the optimization, HOMER varied the component capacities in user-defined ranges to minimize the Net Present Cost (NPC), while also calculating the Levelized Cost of Energy (COE), renewable rate, and operational feasibility. In this way, the methodology provides a transparent and reproducible framework for scenario-based comparisons of technical feasibility and economic sustainability. Figure 2 shows the overall energy flow of the hybrid system with PV-wind generation and hydrogen and battery storage infrastructure and highlights the control logic between the main components.
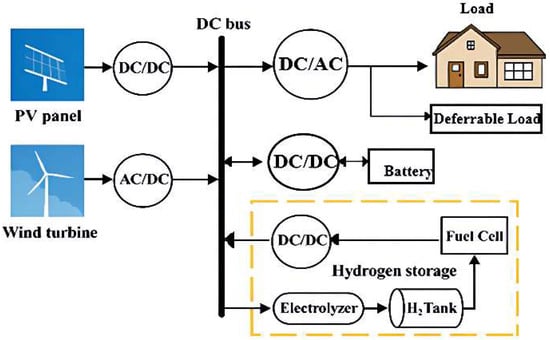
Figure 2.
Block diagram of a hybrid renewable energy system.
2.1.1. Load Profile Assessment
The load profile used in this study is based on the energy demand of a rural settlement of approximately 40 households. According to TurkStat data, the average annual electricity consumption per household in Turkey is 2000–2500 kWh, which corresponds to approximately 3–4 kWh per day in rural areas [40]. Accordingly, for a settlement of 40 households, only residential consumption can be calculated in the range of approximately 120–160 kWh/day. However, not only residential consumption but also agricultural irrigation, common area lighting, small-scale commercial activities (e.g., grain milling, cold storage), and public services (school, health center, mosque, etc.) are taken into account in the model. In line with this expanded scope, the total daily load is defined as 165.29 kWh/day and modeled through the community type load profile. The base load profile was selected from HOMER Pro 3.14.2’s built-in Community Load template, specifically the “January peak” scenario. This generic profile was scaled to match the estimated daily energy demand of the case study area [39].
Küçük Güney Neighborhood of Soma district of Manisa province, selected as a pilot site, offers suitable conditions for off-grid system design in terms of both solar and wind potential and limited grid access.
The load profile was modeled with annual hourly data in HOMER Pro 3.14.2 software; the load factor was determined as 0.29 and the peak load as 23.7 kW. In addition, time-flexible energy demands (agricultural irrigation, hydrogen production, etc.) were modeled as Deferrable Load and contributed to the utilization of renewable generation surpluses. The load profile for Küçük Güney (Manisa, Soma) settlement is presented in Figure 3.
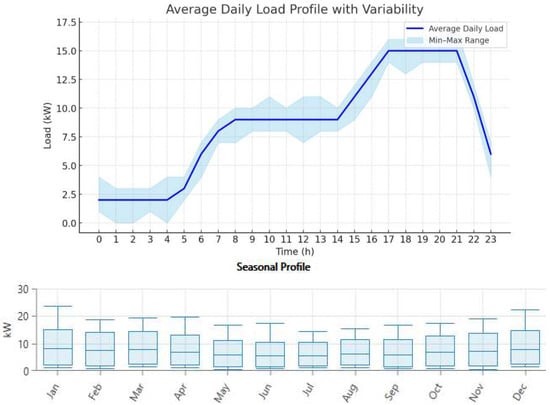
Figure 3.
Load profile created to meet the needs of Küçük Güney in Manisa Soma district.
2.1.2. Deferrable Load
In order to adapt to the intermittent generation characteristic of renewable energy resources and to increase system flexibility, some consumption items with time flexibility are defined as Deferrable Load. In this context, deferrable energy requirements, such as hydrogen production, water pumping, and agricultural irrigation, are modeled under a separate load category through HOMER Pro 3.14.2 software [39].
According to the profile presented in Figure 4, the annual average value of this flexible load is 58.33 kWh/day and varies seasonally. The maximum value is defined as 110 kWh/day in summer (June–August) and the minimum value is defined as 0 kWh/day in winter (January and December). This flexible load is limited by 10 kW peak power and 100 kWh short-term storage capacity in the system.
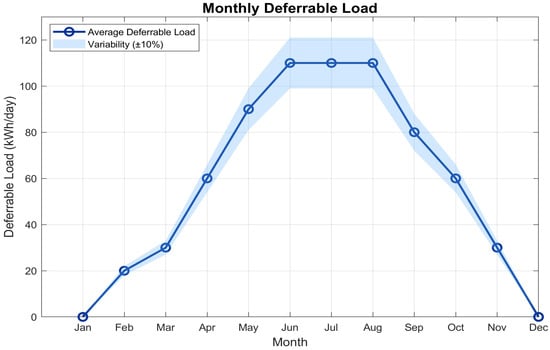
Figure 4.
Deferrable Load profile.
This approach aims to improve overall system performance by enabling the efficient use of surplus energy, especially during periods of high solar and wind generation, and the deferral of non-critical consumption to appropriate times.
2.1.3. Solar Panel and Wind Turbine Selection
A hybrid PV–wind–hydrogen energy system is planned to be installed in the area located in Soma district of Manisa province at coordinates 39°15′09″ N 27°38′02″ E. The site layout of the planned system is shown in Figure 5.
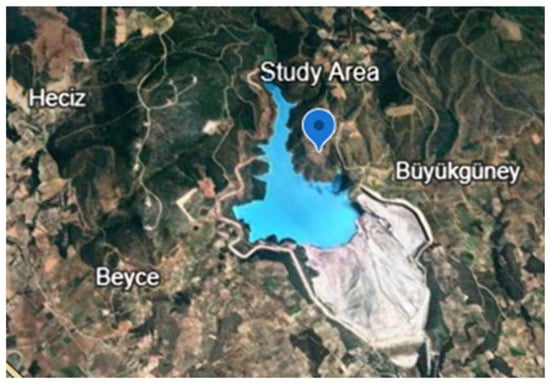
Figure 5.
Location of the hybrid system to supply Küçük Güney in Manisa Soma district [41].
As shown in Figure 5, the geographical location of the proposed hybrid energy system is illustrated using a satellite image from Google Earth Web. The installation site is marked with a blue pin and the surrounding villages are labeled for spatial reference. The area was measured using Google Earth’s built-in tools and confirmed to be a total area of approximately 2595.65 m2, which is sufficient for the system placement. The selected area is characterized by low topographical barriers, sparse vegetation, and barren terrain.
It was also found to be suitable for system installation in terms of parameters such as sunshine duration and access to water resources. Insolation and wind data were integrated into HOMER Pro 3.14.2 software from Solar Global Atlas and Wind Global Atlas platforms. Figure 6 shows the annual average solar radiation and aperture index values for the region under study.
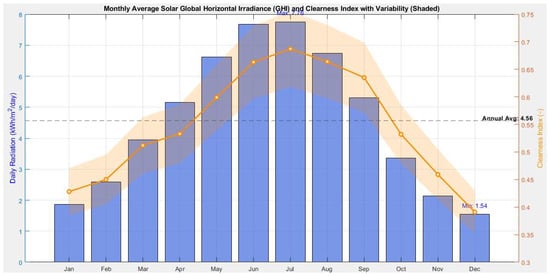
Figure 6.
Monthly mean Global Horizontal Irradiance (GHI) with monthly variability for the study site (kWh m−2 day−1). Source: Solar Global Atlas.
The annual average daily radiation for the area is 4.56 kWh/m2/day. The highest daily radiation is observed in June and the lowest in December. The Sun Power E20-327 model was chosen as the photovoltaic panel due to its technical advantages such as high efficiency, long lifespan, and widespread availability in the market. With its low maintenance and reliable performance, this panel offers a suitable choice for rural off-grid applications. The selected PV panel has a nominal capacity of 1 kW, with an investment cost of USD 800 and a replacement cost of USD 700. The annual operation and maintenance cost is relatively low at USD 10 [42]. The panel provides an efficiency of 20.4% and a lifetime of 25 years, while a derating factor of 88% was considered to account for dust, temperature, and inverter and cable losses.
Figure 7 shows the wind speed variation graph.
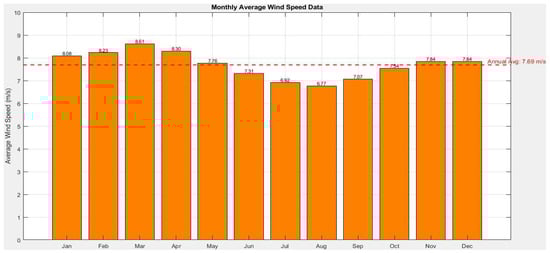
Figure 7.
Monthly average wind speed for the study site (m s−1). Source: Wind Global Atlas.
The annual average wind speed at the identified site is 7.69 m/s, which is a prerequisite for wind energy potential. The information shown in Figure 7 indicates that March has the fastest wind speed, while August has the lowest wind speed. Wind turbine selection was based on the criteria of low installation and operational complexity and long-term reliability for small-scale and budget constrained rural energy systems. In this context, Bergey Excel 10-R model was preferred. The selected wind turbine has a nominal capacity of 10 kW and can operate efficiently at low to medium wind speeds with a cut-in speed of 2.5 m/s and a start-up speed of 3.4 m/s. This makes it a suitable choice for small-scale rural settlements [43]. The unit investment cost of the turbine is USD 25,000, the replacement cost is USD 20,000, and the annual operation and maintenance cost is USD 300 [42]. Its lifetime is assumed to be 20 years and the installation hub height was set at 30 m to ensure reliable performance.
These components were selected to ensure sustainability, reliability, and economic viability. Their technical and economic specifications were entered into HOMER Pro to simulate and optimize system performance under realistic conditions. Both solar and wind datasets provided only monthly averages. Clearness index values allowed for partial seasonal variability in the solar data (Figure 6), while there was no such variability in the wind data (Figure 7). Therefore, the HOMER Pro simulations used deterministic average inputs for both sources.
2.1.4. Hydrogen Energy Storage System Components
In this study, a hydrogen-based energy storage system is designed to store the excess energy obtained from renewable energy sources in the long term. The system consists of three main components: electrolyzer, hydrogen tank, and fuel cell. The technical and economic parameters of these components were optimized using HOMER Pro 3.14.2 software.
- Hydrogen is preferred because of its ability to flexibly balance seasonal production–consumption imbalances and its long-term storage capability. In the system, the electrolysis of water is carried out by means of an electrolyzer powered by excess electricity obtained from solar and wind resources and the hydrogen obtained is stored in tanks under certain pressure conditions [44].
- In this study, a proton exchange membrane (PEM) electrolyzer, the default model of HOMER Pro 3.14.2, was used. PEM technology is more suitable than alkaline electrolyzers due to its rapid response to variable production profiles of renewable energy sources, compact design, and high purity hydrogen production. The capital cost for the electrolyzer is defined as USD 1000/kW, with a replacement cost of USD 800/kW and an annual maintenance cost of USD 15/year. This value is in line with the recommended range of USD 900–1500/kW for commercial scale PEM electrolyzers reported by the International Energy Agency [45].
- For hydrogen tanks, capital cost is taken as USD 700/kg, replacement cost as USD 600/kg, and annual operating cost as USD 30/tank. These values correspond to the average of the estimates reported by IRENA [46] and a conservative approach has been adopted, taking into account regional cost differences and supply uncertainties.
- The capital cost of the fuel cell is USD 3000/kW, the refurbishment cost is USD 2400/kW, and the hydrogen cost is USD 3.5/kg. These costs are in line with the center range of values reported by the International Energy Agency [47]. This choice aimed to provide a balanced assumption for the study region, without extremes.
Lithium-ion batteries with a capacity of 1 kWh (95% efficiency) are integrated into the system to compensate for short-term power imbalances. These batteries serve to ensure system stability during transient load fluctuations.
Based on the HOMER simulations, the optimum system configuration was determined to have an electrolyzer capacity of 50 kW and a hydrogen tank capacity of 80 kg. The average annual hydrogen consumption is approximately 1800 kg/year, which corresponds to an average daily consumption of 4.93 kg. Based on this data, the hydrogen tank capacity was selected to be approximately 16 times the daily requirement and the backup time of the system was increased [46].
The electrolyzer capacity was sized considering the energy requirement of 50–55 kWh for 1 kg of hydrogen production [48]. The 270–275 kWh/day energy amount required for 4.93 kg of hydrogen production per day requires an electrolyzer capacity of 50–55 kW during the average 5-h period when solar production is intense [13].
Thanks to this structure, the system converts excess PV production into hydrogen during daytime hours and provides uninterrupted energy supply through the fuel cell at night and during low production hours. This results in a sustainable and off-grid energy system at a rural scale.
2.1.5. Converter
In hybrid energy systems, inverter and rectifier units are used to provide energy conversion between direct current (DC) powered components (PV panels, batteries) and alternating current (AC) powered loads. HOMER Pro software models the bidirectional conversion capability of these components and calculates their impact on system performance through efficiency values.
In this study, the nominal efficiency value of inverter and rectifier systems is defined as 95%, economic life as 15 years, and unit installation and renewal costs as USD 300/kW [42]. Thus, the conversion strategy that will maximize the total energy efficiency and economic performance of the system is obtained on the basis of scenarios.
2.2. System Architecture
The structure of the hybrid system developed to meet the monthly and hourly load demand is presented in Figure 8. The system, which is powered by PV panels and a wind turbine, includes a lithium-ion battery for short-term energy needs and a hydrogen infrastructure consisting of an electrolyzer, hydrogen tank, and fuel cell for long-term storage. Excess energy from solar and wind sources is converted to DC through converters and used to produce hydrogen in the electrolyzer. The hydrogen produced is stored in tanks, and when needed, it is utilized again in the fuel cell to generate electricity. All converter capacities and control parameters used in the system are optimized via HOMER Pro 3.14.2 software.
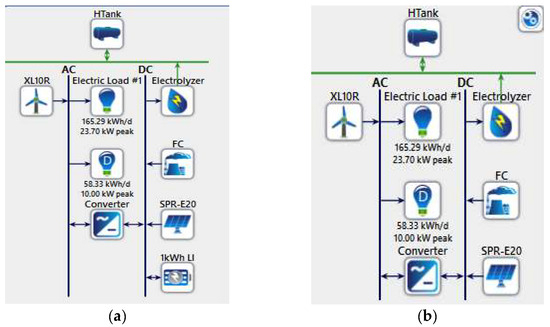
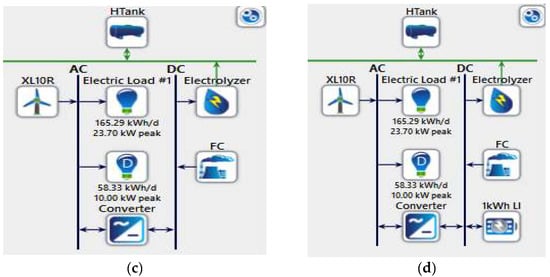
Figure 8.
Off-grid system scenarios: (a) PV–Wind–Battery–Electrolyzer–Fuel Cell, (b) PV–Wind–Electrolyzer–Fuel Cell, (c) Wind–Electrolyzer–Fuel Cell, and (d) Wind–Battery–Electrolyzer–Fuel Cell.
The scenarios in Figure 8 are evaluated based on criteria such as NPC, COE, investment, and operating costs. The contribution of the battery and hydrogen components is analyzed on a scenario basis, as well as the environmental impacts due to hydrogen leakage and the sustainability of the system. These scenarios provide a technical and environmental framework for the viability of renewable energy systems in rural areas.
2.3. Life Cycle Assessment (LCA) and Impact Analysis of Hydrogen Leakage
Although hydrogen does not generate carbon emissions in its direct use, it can lead to indirect greenhouse gas effects through leaks in the atmosphere. As emphasized in the literature, leaking hydrogen consumes hydroxyl (OH) radicals in the atmosphere, extending the lifetime of potent greenhouse gases, such as methane and tropospheric ozone, which in turn, creates an indirect radiative forcing and increases the global warming potential (GWP) [49,50]. Therefore, a comprehensive life cycle analysis (LCA) was conducted in this study, considering both embedded emissions from infrastructure and indirect impacts from hydrogen leakage. The analysis was conducted in accordance with ISO 14040 and ISO 14044 standards, and the system boundaries were defined as “cradle-to-use” [51,52]. Recycling and disposal phases were excluded due to a lack of data and long-term uncertainties. Emissions from the production, installation, and refurbishment stages of the components in the system, such as PV panels, wind turbines, electrolyzer, fuel cell, hydrogen tank, and battery, are calculated based on the embedded carbon (EF) values presented in the literature. For example, approximately 50 g CO2-eq/kWh for PV panel production, 12 g CO2-eq/kWh for wind turbines, approximately 10–15 kg CO2-eq/kW for electrolyzers, and 6–8 kg CO2-eq/kg H2 for hydrogen tanks [53,54]. Total emissions from infrastructure were calculated using the following expression:
where,
Installed capacity or mass of component i (kW or kg).
: Life-cycle emission factor of component i (kg CO2-eq/kW or kg CO2-eq/kg).
Installed capacity data is taken from HOMER Pro and multiplied by these coefficients to calculate total GHG emissions from infrastructure. In addition, the indirect climate impact of hydrogen leakage is also included in the model. According to the literature, 1 kg of leaked hydrogen has a global warming potential of approximately 33 kg CO2-equivalent [11,55]. Emissions from leakage are calculated with the following formula:
where,
: Total annual hydrogen generation (kg).
: Considered as 1%, 5%, and 10%.
: 33 kg CO2-eq/kg H2.
The choice of hydrogen leakage rates in this study is based on the literature. Reference [11] analyzed leakage scenarios of 1%, 3%, and 10%. The extended discussion paper in Reference [15] and the report in Reference [55] indicate a wider uncertainty range of 1–10%. Reference [50] analyzed a much wider range of 1–100% to test the theoretical maximum values. In practical terms, leakage values above 10% are not considered realistic for operational systems and are mainly used in sensitivity analysis. Therefore, three representative cases are considered in the present study: 1% (optimistic/low leakage), 5% (intermediate scenario in the 1–10% range), and 10% (worst case scenario). The upper bound of 10% represents a pessimistic but reasonable assumption and is consistent with the approach taken in mainstream atmospheric modeling studies [11,15,55]. This scenario-based approach provides results that are both robust and comparable to existing research on the climate impacts of hydrogen leakage.
Finally, all emissions are normalized to the annual electricity production of the system and the environmental performance is calculated per kWh:
This method reveals the true environmental footprint of the system, including not only operational emissions but also embedded emissions from infrastructure and indirect impacts of hydrogen leakage.
Annual hydrogen production and consumption data obtained from HOMER Pro outputs were evaluated for different leakage rates and the total climate impact of the system was calculated. In the calculations, leakage-induced GHG impacts are normalized per 1 kWh and thus the environmental performance of the scenarios is presented in a comparable way. All analyses were performed through the MATLAB R2019b-based parametric model developed within the scope of this study; component-based emission factors and scenario-specific hydrogen consumption values were integrated in accordance with ISO 14040 and ISO 14044 standards.
3. Results and Discussions
As shown in Figure 8, four different PV–wind–hydrogen hybrid energy system scenarios were modeled using HOMER Pro 3.14.2 software. In each scenario, the capacities of the system components are varied and accordingly, indicators, such as NPC, COE, annual operating costs, and hydrogen consumption, are evaluated. In all scenarios, the renewable energy ratio is set to 100% and the systems are assumed to operate off-grid.
Scenario 1 consists of PV, wind, hydrogen, and battery components and operates with a Cyclic Charging (CC) strategy. With an NPC of USD 297,419 and a COE of USD 0.340/kWh, it stands out as the most balanced structure, with a limited hydrogen consumption of 1841 kg/year thanks to the battery.
Scenario 2 has a similar generation structure, but does not include a battery and, therefore, hydrogen consumption increases to 2011 kg/year with a loss of flexibility. The NPC is USD 301,126 and the COE is USD 0.345/kWh. This shows that the battery is effective not only in load balancing but also in saving hydrogen.
Scenario 3 has only wind and hydrogen components and operates with a Load Following (LF) strategy. At 1535 kg/year, it achieves one of the lowest hydrogen consumptions, but COE increases to USD 0.350/kWh due to the non-utilization of surplus production.
Scenario 4 operates with LF strategy and includes a battery. The lowest hydrogen consumption (1380 kg/year) was achieved, but costs increased due to the capacity increase.
As a result, the CC strategy with battery support provides advantages in reducing costs and hydrogen consumption, while the LF strategy saves hydrogen but does not utilize the surplus production sufficiently. The control strategy and battery integration directly shape the system performance.
3.1. Energy Production and Supply Reliability
The four different scenarios examined in this study are structured to evaluate the performance of a stand-alone hybrid energy system in terms of different control strategies, battery availability, and generation resource allocation. The system performance indicators are summarized in Table 2, and the scenarios are analyzed comparatively in terms of technical parameters.
Table 2.
Technical and economic performance results of the off-grid system according to different scenarios.
Table 3 presents the annual energy production, resource contribution rates, and operational efficiency metrics of the scenarios in a comparative manner. The scenarios are designed with different combinations of PV, wind, battery, and hydrogen components, and control strategies. These differences have been decisive on the generation–consumption balance, excess energy ratio, and system efficiency.
Table 3.
Annual energy production and performance indicators by scenarios.
Scenario 1 which includes PV, wind, battery, and hydrogen components, provides the most balanced result. System efficiency was kept high with 4.6% over generation, 0.94% unmet load, and 1.82% capacity deficit.
Scenario 2 increased generation with its non-battery structure, but its excess generation increased to 8.61% and its load balancing capability decreased. This shows that the battery system is critical not only for energy storage but also for providing flexibility in off-grid systems.
Scenario 3 relied solely on wind and hydrogen components, with more than 90% of generation coming from wind. However, this structure created an imbalance in the summer months, resulting in a 13.6% overproduction.
Scenario 4 shows a high surplus generation rate of 16.6% due to low resource diversity despite battery integration. However, it performed better than Scenario 3 in terms of unmet load and capacity gap.
As a result, resource diversity and battery integration play an important role in achieving generation consumption balance in off-grid systems. In this context, Scenario 1 stands out as the most successful configuration in terms of energy continuity, economic efficiency, and rural viability.
3.2. Hydrogen Storage Performance and System Continuity
The cyclical change between storage and consumption of hydrogen throughout the year is presented in detail in Figure 9 with data on hydrogen tank level and frequency of use.
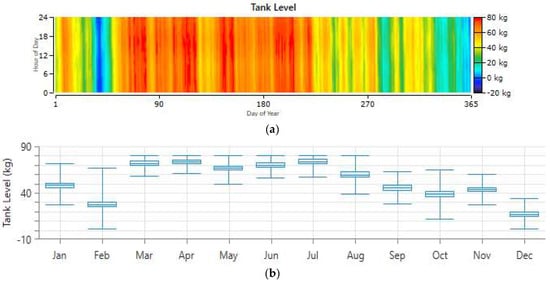
Figure 9.
Variation in hydrogen storage levels in the system: (a) daily tank level profile throughout the year showing seasonal patterns, and (b) monthly distribution of tank levels presented as box plots.
Hydrogen tank capacity was determined as 80 kg in the system design. During the annual system operation, the hydrogen level varied depending on the production consumption balance. Especially in the March–July period, hydrogen production through the electrolyzer intensified due to increased renewable production and the tank level frequently reached 80% fullness. On the other hand, the tank level dropped in October–December due to decreased production and increased consumption, reaching a critical level of 1.22 kg at the end of the year.
The histogram results show that the hydrogen level is mostly concentrated in the 64–80 kg range and the storage unit is effectively utilized by the system. However, the low level observed at the end of the year indicates that the 80 kg capacity offers limited operational flexibility. Figure 10 shows the short-term production–consumption dynamics of the system and the relationship between renewable resources and electrolyzer output.
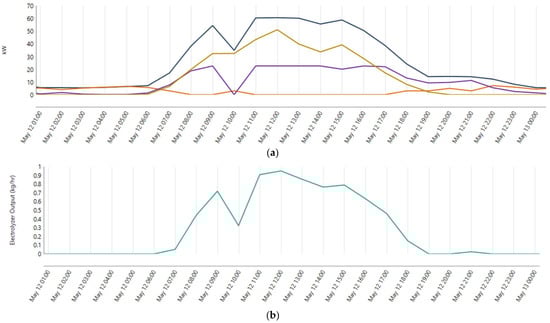
Figure 10.
(a) System power generation and load curves (May 12). Dark blue: total load met power. Orange: hydrogen fuel cell output power. Purple: Bergey Excel 10-R wind turbine output power. Brown: Sun Power E20-327 photovoltaic panel output power. (b) Electrolyzer hydrogen production rate (kg/h) time series (May 12).
As shown in Figure 10a, during daytime hours, PV generation (brown line) reached its maximum in the middle of the day, while wind generation (purple line) contributed mainly in the morning and late afternoon. This combined renewable energy generation often exceeded the load demand (dark blue line) and the excess energy was diverted to hydrogen production as shown in Figure 10b. The electrolyzer output (light blue line) followed the availability of excess renewable energy, peaking at 0.9 kg/h at midday. At night, when there was no PV production and wind output is low, the electrolyzer is off-line. Backup electricity was provided by the fuel cell (orange line), which converted the stored hydrogen into power to meet the load. This condition highlights the role of hydrogen storage. Importantly, the fuel cell and electrolyzer did not run simultaneously, ensuring a time-dependent but bidirectional energy conversion. The maximum hydrogen production rate (0.9 kg/h ≈ 21.6 kg/day, equivalent to 720 kWh) demonstrates the system’s capacity to support residential and agricultural energy demand in small-scale, off-grid rural contexts. These results highlight the effectiveness of the Power-to-Hydrogen strategy in utilizing surplus renewable resources.
3.3. Comparative Energy Efficiency Analysis of Hybrid Systems
In the performance evaluation of hybrid energy systems, a detailed analysis was carried out by taking into account the energy production, storage capacity, and in-system losses of the system components. These analyses were carried out to determine the efficiency of the systems and the effectiveness of hydrogen utilization. Table 3 compares the total generation, fuel cell output, hydrogen flow, and power electronics losses for four different hybrid system scenarios.
According to Table 4, the highest electricity generation was achieved in Scenario 2, where PV and wind resources were supplemented by a hydrogen system. Since there is no battery, the surplus generation is directly utilized in hydrogen production, resulting in a hydrogen efficiency of 36.1%. However, an increase in inverter and rectifier losses was observed due to the CC strategy.
Table 4.
Comparison of energy efficiency and hydrogen utilization in hybrid renewable energy systems.
Scenario 1 offered a more balanced and flexible structure thanks to battery integration. With 34.5% hydrogen efficiency despite a lower generation level of 187,538 kWh, it has a balanced performance in terms of system losses and energy management.
Scenario 3 is based on wind and hydrogen sources only. The highest hydrogen efficiency of 36.7% is achieved, which is attributed to the reduction in power electronics losses with the LF strategy.
Scenario 4 is based on wind and hydrogen, similar to Scenario 3, but with additional battery integration. Battery support reduces inverter and rectifier losses. However, it limits the use of hydrogen in the energy flow, reducing efficiency to 35.7%.
In general, system performance should not be limited to hydrogen efficiency alone but should be evaluated based on multidimensional criteria such as load availability, surplus generation, and component coordination.
3.4. Impact of H2 Leakage on Carbon Equivalent Emissions: A Scenario Based Analysis
In this study, CO2-equivalent leakage emissions based on scenario-based hydrogen consumption are calculated separately, although the HOMER Pro 3.14.2 software assumes zero operational emissions. In Table 5, the annual emissions from hydrogen leakage according to the scenarios and their variation according to leakage rates are presented comparatively.
Table 5.
CO2 equivalent emissions from H2 leakage according to scenarios.
According to the findings presented in Table 5, CO2-equivalent emissions from hydrogen leakage vary significantly depending on the annual hydrogen consumption in the scenarios and the assumed leakage rate. In particular, at 10% leakage rate, the highest emission value is recorded in Scenario 2 with 6636 kg/year and the lowest in Scenario 4 with 4554 kg/year. This reveals that the level of hydrogen consumption is a determinant of the environmental impacts due to leakage. This trend was similarly observed at lower leakage rates of 1% and 5%, with emission levels increasing proportionally. This suggests that hydrogen should be considered not only as a clean energy carrier, but also for its secondary environmental impacts due to leakage potential. In this context, integrating the leakage parameter into LCA studies will allow for more realistic and holistic environmental analysis.
3.5. Life Cycle (LCA) Emission Analysis of the System
In this part of the study, the environmental impact of the hybrid energy system was examined for both its production and operation stages through a life cycle analysis (LCA). Annual carbon emissions of individual components were calculated using emission factors reported in previous studies. Hydrogen leakage was also taken into account to estimate total yearly emissions and specific CO2 values (g CO2-eq/kWh). For this purpose, a parametric LCA model was created in MATLAB R2019b. The model combines annual capacity and generation data obtained from HOMER Pro 3.14.2 with emission factors and leakage parameters from the literature. The resulting values for the four scenarios are presented in Table 6.
Table 6.
Annual LCA results and specific carbon emissions by scenarios.
According to Table 6, the presence of components, such as PV and batteries in the system, contributed to the reduction in hydrogen leakage while increasing annual carbon emissions. In Scenarios 1 and 2, the presence of PV systems increased total emissions. However, with the increase in renewable generation, the carbon intensity of the system was balanced and the specific emission remained around 44.7 g CO2-eq/kWh. Scenario 1 with battery integration slightly reduced emissions from leakage due to more balanced hydrogen utilization.
In Scenarios 3 and 4, only wind and hydrogen components are used and the absence of PV eliminates the emission burden from panel generation. This led to a reduction in total emissions and specific emissions to 36.05 and 37.64 g CO2-eq/kWh, respectively. Scenario 3, especially without batteries, stands out as the most environmentally advantageous with the lowest carbon emissions.
The results show that hydrogen production and storage infrastructure should be carefully managed in terms of environmental impacts. In addition, although the presence of components, such as PV and batteries, increases the energy security and functionality of the system, they can have significant impacts on the total carbon footprint.
3.6. Literature Comparison
This study is benchmarked against the literature examining similar hybrid systems. The comparison is based on technical and environmental performance indicators such as COE, excess generation rate, and specific carbon emissions. In addition, its position in the literature is also discussed in terms of its focus on rural and off-grid scenario. Table 7 summarizes the technical and environmental comparisons for selected studies.
Table 7.
Comparison of selected literature and this study at technical, environmental, and implementation level.
This comparison highlights the distinct contribution of this study to the literature. Most of the studies that have been conducted so far look at grid-connected, large-scale, or transportation-oriented systems that benefit from economies of scale and grid-assisted balancing [24,25,30,32]. This study, on the other hand, looks at a completely off-grid rural setting where these benefits are not available. The proposed system has a COE of USD 0.340/kWh in this scenario. This is higher than certain large-scale, grid-connected cases (USD 0.146–0.189/kWh) but much lower than the highest range documented for off-grid systems (up to EUR 1/kWh) [25]. The technical benefits of optimal component sizing and a surplus generation rate of <10% compared to >25% in many studies showing balanced supply-demand matching make up for the difference in cost. From an environmental point of view, the system has specific emissions of 44.74 g CO2-eq/kWh, which is in line with the 2.02 kg CO2-eq/kg H2 lifecycle potential of green hydrogen [60]. It also includes a life cycle assessment (LCA) of the effects of hydrogen production, storage, and leakage, which is something that is not often looked at in similar research [24,27]. Beyond these techno-economic and environmental considerations, our results show that hydrogen storage provides significant improvements in flexibility and reliability for rural off-grid systems. This is consistent with previous evaluations of storage solutions in microgrids [61] and extends the findings to hydrogen-based applications.
Overall, although the proposed design has a higher COE than grid-supported systems, it provides a technically efficient and environmentally robust pathway for sustainable energy access in remote rural communities.
3.7. Critical Evaluation and Limitations of the Study
The results show that the integration of hydrogen based storage into a PV-wind hybrid system is technically feasible and economically sustainable. However, some limitations need to be considered. Firstly, the HOMER Pro 3.14.2 software does not directly consider hydrogen leakage, so an additional MATLAB R2019b based model was developed, adding an additional layer of uncertainty to the calculations. Furthermore, the hourly time resolution cannot reflect short-term fluctuations and dynamic responses of critical components, which may lead to optimistic performance and cost estimates. Second, cost parameters for critical components, such as electrolyzers and fuel cells, are highly sensitive to market dynamics, which may affect the accuracy of long-term projections. Third, hydrogen storage tanks were modeled without considering pressurization and thermodynamic losses, resulting in an underestimation of energy and costs. Fourth, the analysis focused only on a single rural region in Western Anatolia, so it may not be possible to generalize directly to regions with different climatic or socioeconomic conditions. Furthermore, field-based implementation costs, such as security and regulatory compliance, were excluded. Finally, life cycle analysis (LCA) excluded recycling and end-of-life phases due to a lack of data, which may lead to an underestimation of the environmental burden of some components. Future research that includes dynamic cost modeling, site-specific analyses, simulations with higher time resolution, and extended LCA boundaries will contribute to more robust and generalizable results.
4. Conclusions
The applicability of renewable energy technologies in rural areas is critical not only for expanding energy access but also for achieving sustainable development goals. In this study, four different off-grid hybrid energy system scenarios consisting of PV, wind turbine, electrolyzer, hydrogen tank, fuel cell, and battery are evaluated from a technical, economic, and environmental perspective.
Scenario 1 (PV + wind + battery + hydrogen) stood out as the most balanced configuration under the CC strategy with a Net Present Cost (NPC) of USD 297,419, Cost of Energy (COE) of USD 0.340/kWh, and hydrogen consumption of 1841 kg/year and specific emissions of 44.74 g CO2-eq/kWh. The other scenarios showed a balance between battery integration, hydrogen efficiency, and surplus generation. These findings highlight the critical role of component selection and control strategy in optimizing system performance.
The validity and reliability of the findings are supported by hourly simulations of HOMER Pro 3.14.2, verified source data, and scenario-based comparisons. Hydrogen leakage was measured and included in the Life Cycle Analysis (LCA), resulting in realistic emission estimates in line with benchmarks in the literature. However, due to current limitations of HOMER Pro 3.14.2, hydrogen leakage could not be incorporated directly into the optimization stage. Instead, it was calculated after the optimization using scenario-based annual hydrogen consumption data and then integrated into the LCA, ensuring realistic environmental impact estimates under existing software constraints. Economic estimates were based on HOMER Pro 3.14.2’s cost database and manufacturer data, providing a reasonable basis. However, cost assumptions remain sensitive to market dynamics and regional variability, which may affect economic credibility.
Despite the comprehensive scope of this study, certain limitations need to be considered. Analyses based on HOMER Pro 3.14.2’s hourly time-step resolution and optimization framework may not accurately reflect short-term operational fluctuations. Furthermore, the study was conducted on a specific site and performance indicators may vary in different climatic conditions, load profiles, or economic contexts. Furthermore, cost assumptions for hydrogen production and system components have the potential to be directly affected by future market dynamics and technological developments.
Future studies should include dynamic cost modeling and sensitivity analysis to improve economic accuracy. Optimizing electrolyzer capacity according to seasonal production and load variability can improve system efficiency. Temperature and pressure dependent modeling of hydrogen leakage will improve the accuracy of LCA results. AI-based forecasting and real-time control systems could strengthen energy management under variable production conditions. Multi-objective optimization approaches can balance cost, emissions, and reliability. Moreover, the integration of hydrogen into sectors, such as agricultural irrigation or cooking, could increase the system’s versatility in rural applications. These conclusions should be considered together with the methodological limitations discussed above, which provide context for the interpretation of the results.
Author Contributions
Conceptualization, M.R.T.; methodology, A.O. and M.R.T.; software, A.O.; validation, A.O. and M.R.T.; formal analysis, A.O.; investigation, A.O.; resources, A.O.; data curation, A.O.; writing—original draft preparation, A.O.; writing—review and editing, M.R.T.; visualization, A.O.; supervision, M.R.T.; project administration, M.R.T. All authors have read and agreed to the published version of the manuscript.
Funding
This research received no external funding.
Institutional Review Board Statement
Not applicable.
Informed Consent Statement
Not applicable.
Data Availability Statement
The data presented in this study are available on request from the corresponding author.
Acknowledgments
Minor language refinements were made using ChatGPT (OpenAI, GPT-4) to improve clarity and readability. The authors take full responsibility for the final content.
Conflicts of Interest
The authors declare no conflicts of interest.
Abbreviations
The following abbreviations are used in this manuscript:
| AC | Alternating Current |
| CC | Cycle Charging |
| CO2 | Carbon dioxide |
| COE | Cost of Energy |
| DC | Direct Current |
| EF | Emission Factor |
| GHG | Greenhouse Gas |
| GHI | Global Horizontal Irradiance |
| GWP | Global Warming Potential |
| H2 | Hydrogen |
| HOMER | Hybrid Renewable and Distributed Generation System Design Software |
| IEA | International Energy Agency |
| IICEC | International Center for Energy and Climate |
| LCA | Life Cycle Analysis |
| LCE | Life Cycle Emission |
| LF | Load Following |
| NPC | Net Present Cost |
| NREL | National Renewable Energy Laboratory |
| OH | Hydroxyl |
| PV | Photovoltaic |
References
- Osman, A.I.; Chen, L.; Yang, M.; Msigwa, G.; Farghali, M.; Fawzy, S.; Rooney, D.W.; Yap, P.S. Cost, environmental impact, and resilience of renewable energy under a changing climate: A review. Environ. Chem. Lett. 2023, 21, 741–764. [Google Scholar] [CrossRef]
- IEA. Global Energy Review 2025; IEA: Paris, France, 2025; Available online: https://www.iea.org/reports/global-energy-review-2025 (accessed on 29 June 2025).
- T.C. Ministry of Energy and Natural Resources. Turkey Electricity Generation Report 2024; Ministry of Energy and Natural Resources Publications: Ankara, Turkey, 2024. Available online: https://enerji.gov.tr/bilgi-merkezi-enerji-elektrik (accessed on 30 June 2025).
- Turkish Statistical Institute (TurkStat). Greenhouse Gas Emissions Statistics, 1990–2023; Turkish Statistical Institute. Available online: https://data.tuik.gov.tr/Bulten/Index?p=Sera-Gazi-Emisyon-Istatistikleri-1990-2023-53974 (accessed on 29 June 2025).
- Sabanci University Istanbul Policy Center. Turkey’s Decarbonization Pathway Net Zero in 2050; Sabanci University Publications: Istanbul, Turkey, 2022; Available online: https://ipc.sabanciuniv.edu/Content/Images/CKeditorImages/20240808-10085077.pdf (accessed on 29 June 2025).
- IEA. Renewables 2024; IEA: Paris, France, 2024; Available online: https://www.iea.org/reports/renewables-2024 (accessed on 28 June 2025).
- IEA. Net Zero by 2050; IEA: Paris, France, 2021; Available online: https://www.iea.org/reports/net-zero-by-2050 (accessed on 28 June 2025).
- International Renewable Energy Agency (IRENA). Renewable Capacity Statistics 2024; IRENA: Abu Dhabi, United Arab Emirates, 2024; Available online: https://www.smartenergydecisions.com/wp-content/uploads/2025/04/irena_re_capacity_statistics_2024.pdf (accessed on 28 June 2025).
- Amrouche, S.O.; Rekioua, D.; Rekioua, T.; Bacha, S. Overview of energy storage in renewable energy systems. Int. J. Hydrogen Energy 2016, 41, 20914–20927. [Google Scholar] [CrossRef]
- Yue, M.; Lambert, H.; Pahon, E.; Roche, R.; Jemei, S.; Hissel, D. Hydrogen energy systems: A critical review of technologies, applications, trends and challenges. Renew. Sustain. Energy Rev. 2021, 146, 111180. [Google Scholar] [CrossRef]
- Ocko, I.B.; Hamburg, S.P. Climate consequences of hydrogen emissions. Atmos. Chem. Phys. 2022, 22, 9349–9368. [Google Scholar] [CrossRef]
- IEA. Global Hydrogen Review 2021; International Energy Agency: Paris, France, 2021; Available online: https://www.iea.org/reports/global-hydrogen-review-2021 (accessed on 1 July 2025).
- Staffell, I.; Scamman, D.; Abad, A.V.; Balcombe, P.; Dodds, P.E.; Ekins, P.; Shah, N.; Ward, K.R. The role of hydrogen and fuel cells in the global energy system. Energy Environ. Sci. 2019, 12, 463–491. [Google Scholar] [CrossRef]
- Reiter, G.; Lindorfer, J. Global warming potential of hydrogen and methane production from renewable electricity via power-to-gas technology. Int. J. Life Cycle Assess. 2015, 20, 477–489. [Google Scholar] [CrossRef]
- Ocko, I.B.; Hamburg, S.P. Climate consequences of hydrogen leakage. Atmos. Chem. Phys. Discuss. 2022, 2022, 1–25. [Google Scholar]
- IICEC. Turkey Green Hydrogen Future Report; Sabancı University Istanbul International Energy and Climate Center (IICEC): Istanbul, Turkey, 2022; Available online: https://iicec.sabanciuniv.edu/sites/iicec.sabanciuniv.edu/files/inline-files/IICEC_T%C3%BCrkiye%20Ye%C5%9Fil%20Hidrojen%20Gelece%C4%9Fi.pdf (accessed on 2 July 2025).
- Turkish Electricity Transmission A.Ş. (TEİAŞ). Installed Power Report. 2023. Available online: https://www.teias.gov.tr (accessed on 1 July 2025).
- Republic of Turkey Ministry of Environment, Urbanization and Climate Change. Climate Change Strategy Document. 2023. Available online: https://webdosya.csb.gov.tr/db/iklim/editordosya/iklim_degisikligi_stratejisi_EN(2).pdf (accessed on 2 July 2025).
- Republic of Turkey Ministry of Energy and Natural Resources. Turkey National Hydrogen Technologies Strategy and Roadmap. 2021. Available online: https://www.enerji.gov.tr (accessed on 2 July 2025).
- Arat, H.T.; Baltacıoğlu, M.K. A perspective on hydrogen energy research, development and innovation activities in Turkey. Int. J. Energy Res. 2020, 44, 588–593. [Google Scholar] [CrossRef]
- SHURA. Priority Areas for a National Hydrogen Strategy for Turkey; Sabancı University: Istanbul, Turkey, 2022. [Google Scholar]
- Dincer, I.; Javani, N.; Karayel, G. The Role of Hydrogen in the Energy Mix: A Scenario Analysis for Turkey Using OSeMOSYS. Energies 2021, 17, 6348. [Google Scholar]
- Barlaz, F.; Akıl, Y.; Haydaroglu, C.; Kılıç, H. Renewable energy and hydrogen storage system analysis for carbon neutral campuses with Homer. Türk Doğa Fen Derg. 2025, 14, 136–145. [Google Scholar] [CrossRef]
- Yadav, S.; Kumar, P.; Kumar, A. Techno-economic assessment of hybrid renewable energy system with multi energy storage system using HOMER. Energy 2024, 297, 131231. [Google Scholar] [CrossRef]
- Ogarek, P.; Stec, A.; Słyś, D. Technical and economic analysis of an autonomous hybrid photovoltaic-hydrogen energy system for academic buildings with the focus on energy Independence–A case study for Poland. Appl. Energy 2025, 392, 125985. [Google Scholar] [CrossRef]
- Al-Ghussain, L.; Ahmad, A.D.; Abubaker, A.M.; Mohamed, M.A. An integrated photovoltaic/wind/biomass and hybrid energy storage systems towards 100% renewable energy microgrids in university campuses. Sustain. Energy Technol. Assess. 2021, 46, 101273. [Google Scholar] [CrossRef]
- Singh, A.; Baredar, P.; Gupta, B. Techno-economic feasibility analysis of hydrogen fuel cell and solar photovoltaic hybrid renewable energy system for academic research building. Energy Convers. Manag. 2017, 145, 398–414. [Google Scholar] [CrossRef]
- Zhang, W.; Maleki, A.; Rosen, M.A.; Liu, J. Optimization with a simulated annealing algorithm of a hybrid system for renewable energy including battery and hydrogen storage. Energy 2018, 163, 191–207. [Google Scholar] [CrossRef]
- Okonkwo, P.C.; Islam, M.S.; Taura, U.H.; Barhoumi, E.M.; Mansir, I.B.; Das, B.K.; Ali Sulaiman, M.M.B.; Agyekum, E.B.; Bahadur, I. A techno-economic analysis of renewable hybrid energy systems for hydrogen production at refueling stations. Int. J. Hydrogen Energy 2024, 78, 68–82. [Google Scholar] [CrossRef]
- Gökçek, M.; Kale, C. Techno-economical evaluation of a hydrogen refuelling station powered by Wind-PV hybrid power system: A case study for İzmir-Çeşme. Int. J. Hydrogen Energy 2018, 43, 10615–10625. [Google Scholar] [CrossRef]
- Komninos, N. Net zero energy districts: Connected intelligence for carbon-neutral cities. Land 2022, 11, 210. [Google Scholar] [CrossRef]
- Li, Y.; Liu, F.; Chen, K.; Liu, Y. Technical and economic analysis of a hybrid PV/wind energy system for hydrogen refueling stations. Energy 2024, 303, 131899. [Google Scholar] [CrossRef]
- Okonkwo, P.C.; Barhoumi, E.M.; Mansir, I.B.; Emori, W.; Uzoma, P.C. Techno-economic analysis and optimization of solar and wind energy systems for hydrogen production: A case study. Energy Sources Part A Recovery Util. Environ. Eff. 2022, 44, 9119–9134. [Google Scholar] [CrossRef]
- Barhoumi, E.M. Optimal design of standalone hybrid solar-wind energy systems for hydrogen-refueling station Case study. J. Energy Storage 2023, 74, 109546. [Google Scholar] [CrossRef]
- Oymak, A.; Tur, M.R. A Short Review on the Optimization Methods Using for Distributed Generation Planning. Int. J. Smart Grid-IJSMARTGRID 2022, 6, 54–64. [Google Scholar]
- Tur, M.R. Reliability assessment of distribution power system when considering energy storage configuration technique. IEEE Access 2020, 8, 77962–77971. [Google Scholar] [CrossRef]
- Lambert, T.; Gilman, P.; Lilienthal, P. Micropower system modeling with HOMER. In Integration of Alternative Sources of Energy; National Renewable Energy Laboratory (NREL): Golden, CO, USA, 2006. [Google Scholar]
- International Renewable Energy Agency. World Energy Transitions Outlook 2022: 1.5 °C Pathway; IRENA: Abu Dhabi, United Arab Emirates, 2022; Available online: https://www.spr.pe/wp-content/uploads/2022/04/IRENA_World_Energy_Transitions_Outlook_2022.pdf (accessed on 1 July 2025).
- HOMER Energy. HOMER Pro User Manual, 2021; HOMER Energy: Boulder, CO, USA, 2021. [Google Scholar]
- Turkish Statistical Institute (TurkStat). Energy Consumption Statistics—Household 2022. Available online: https://data.tuik.gov.tr (accessed on 1 July 2025).
- Google Earth. Geospatial Location of the Proposed Hybrid Energy System Site near Soma, Manisa, Türkiye [Satellite Imagery]. Available online: https://earth.google.com/web/search/Geospatial+Location+of+the+Proposed+Hybrid+Energy+System+Site+near+Soma,+Manisa%E3%80%82Turkey/@39.191523,27.637724,137.41467887a,637.42123316d,35y,0h,0t,0r/data=CskBGpoBEpMBCiUweDE0Yjc2MTU0MDcyN2YwNGY6MHg2NGIyZTRhMTdhMGYxOTVmGRUZHZCEmENAIeu3wC8_oztAKlhHZW9zcGF0aWFsIExvY2F0aW9uIG9mIHRoZSBQcm9wb3NlZCBIeWJyaWQgRW5lcmd5IFN5c3RlbSBTaXRlIG5lYXIgU29tYSwgTWFuaXNh44CCVHVya2V5GAIgASImCiQJMKZ5vfin4b8RChSr3J40JcAZ1F-qwHo8ZUAhHzaD7tU8ZcBCAggBOgMKATBCAggASg0I____________ARAA?authuser=0 (accessed on 1 July 2025).
- International Renewable Energy Agency. Renewable Power Generation Costs in 2023; IRENA: Abu Dhabi, United Arab Emirates, 2024. [Google Scholar]
- Bergey Wind Power, Excel 10-R Product Specifications. Available online: https://bergey.com/products/wind-turbines/excel-10/ (accessed on 1 July 2025).
- International Renewable Energy Agency. Global Hydrogen Trade: Geopolitical and Market Implications of Emerging Hydrogen Economies; IRENA: Abu Dhabi, United Arab Emirates, 2022. [Google Scholar]
- International Energy Agency (IEA). Electrolysers. Energy System—Low-Emission Fuels, 2025. Available online: https://www.iea.org/energy-system/low-emission-fuels/electrolysers (accessed on 6 July 2025).
- International Renewable Energy Agency. Green Hydrogen: A Guide to Policy Making; IRENA: Abu Dhabi, United Arab Emirates, 2022. [Google Scholar]
- International Energy Agency. Global Hydrogen Review 2023; IEA: Paris, France, 2023. [Google Scholar]
- Buttler, A.; Spliethoff, H. Current status of water electrolysis for energy storage, grid balancing and sector coupling via power-to-gas and power-to-liquids: A review. Renew. Sustain. Energy Rev. 2018, 82, 2440–2454. [Google Scholar] [CrossRef]
- Skeie, R.B.; Sandstad, M.; Krishnan, S.; Myhre, G.; Sand, M. Sensitivity of climate effects of hydrogen to leakage size, location, and chemical background. EGUsphere 2024, 2024, 1–22. [Google Scholar] [CrossRef]
- Field, R.A.; Derwent, R.G. Global warming consequences of replacing natural gas with hydrogen in the domestic energy sectors of future low-carbon economies in the United Kingdom and the United States of America. Int. J. Hydrogen Energy 2021, 46, 30190–30203. [Google Scholar] [CrossRef]
- ISO 14040; Environmental Management—Life Cycle Assessment—Principles and Framework. International Organization for Standardization (ISO): Geneva, Switzerland, 2006.
- ISO 14044; Environmental Management—Life Cycle Assessment—Requirements and Guidelines. International Organization for Standardization (ISO): Geneva, Switzerland, 2006.
- Ardente, F.; Beccali, M.; Cellura, M.; Lo Brano, V. Energy performances and life cycle assessment of an Italian wind farm. Renew. Sustain. Energy Rev. 2008, 12, 200–217. [Google Scholar] [CrossRef]
- Valente, A.; Iribarren, D.; Dufour, J. Life cycle assessment of hydrogen energy systems: A review of methodological choices. Int. J. Life Cycle Assess. 2017, 22, 346–363. [Google Scholar] [CrossRef]
- Warwick, N.; Griffiths, P.; Keeble, J.; Archibald, A.; Pyle, J.; Shine, K. Atmospheric Implications of Increased Hydrogen Use. 2022. Available online: https://assets.publishing.service.gov.uk/government/uploads/system/uploads/attachment_data/file/1067144/atmospheric-implications-of-increased-hydrogen-use.pdf (accessed on 7 July 2025).
- International Energy Agency. Life Cycle Assessment of Electricity Generation Technologies; IEA-PVPS: Paris, France, 2020; Available online: https://iea-pvps.org (accessed on 8 July 2025).
- Wei, X.; Sharma, S.; Waeber, A.; Wen, D.; Sampathkumar, S.N.; Margni, M.; Maréchal, F. Comparative life cycle analysis of electrolyzer technologies for hydrogen production: Manufacturing and operations. Joule 2024, 8, 3347–3372. [Google Scholar] [CrossRef]
- Clemente, M.; Maharjan, P.; Salazar, M.; Hofman, T. Meta-analysis of Life Cycle Assessments for Li-Ion Batteries Production Emissions. arXiv 2025, arXiv:2506.05531. [Google Scholar]
- Gandiglio, M.; Marocco, P.; Bianco, I.; Lovera, D.; Blengini, G.A.; Santarelli, M. Life cycle assessment of a renewable energy system with hydrogen-battery storage for a remote off-grid community. Int. J. Hydrogen Energy 2022, 47, 32822–32834. [Google Scholar] [CrossRef]
- Maniscalco, M.P.; Longo, S.; Cellura, M.; Miccichè, G.; Ferraro, M. Critical review of life cycle assessment of hydrogen production pathways. Environments 2024, 11, 108. [Google Scholar] [CrossRef]
- Oymak, A.; Demirel, I.H.; Tur, M.R. Evaluation of Energy Storage Solutions in Microgrids: A Comparison in Terms of Flexibility and Economics. In 2024 Global Energy Conference (GEC); IEEE: New York, NY, USA, 2024; pp. 299–303. [Google Scholar]


Disclaimer/Publisher’s Note: The statements, opinions and data contained in all publications are solely those of the individual author(s) and contributor(s) and not of MDPI and/or the editor(s). MDPI and/or the editor(s) disclaim responsibility for any injury to people or property resulting from any ideas, methods, instructions or products referred to in the content. |
© 2025 by the authors. Licensee MDPI, Basel, Switzerland. This article is an open access article distributed under the terms and conditions of the Creative Commons Attribution (CC BY) license (https://creativecommons.org/licenses/by/4.0/).