Abstract
The growing demand for food and the environmental impact of conventional agriculture have prompted the search for sustainable alternatives. Phycocyanin (PC) and total phenolic compounds (TPC) extracted from Spirulina platensis have shown potential for the biological control of phytopathogens. The extraction method directly influences the yield and stability of these compounds. This study aimed to establish an efficient extraction protocol for PC and TPC and to evaluate their antimicrobial efficacy in vitro against Colletotrichum orchidearum, Fusarium nirenbergiae, and Alternaria sp. isolated from hydroponically grown lettuce. The phytopathogens were identified based on phylogenetic analyses using sequences from the ITS, EF1-α, GAPDH, and RPB2 gene regions. This is the first report of C. orchidearum in hydroponic lettuce culture in Brazil, expanding its known host range. Extracts were obtained using hydroalcoholic solvents and phosphate buffer (PB), combined with ultrasound-assisted extraction (bath and probe). The extracts were tested for in vitro antifungal activity. Data were analyzed by ANOVA (p < 0.05), followed by Tukey’s test. The combination of the PB and ultrasound probe resulted in the highest PC (95.6 mg·g−1 biomass) and TPC (21.9 mg GAE·g−1) yields, using 10% (w/v) biomass. After UV sterilization, the extract retained its PC and TPC content. The extract inhibited C. orchidearum by up to 53.52% after three days and F. nirenbergiae by 54.17% on the first day. However, it promoted the growth of Alternaria sp. These findings indicate that S. platensis extracts are a promising alternative for the biological control of C. orchidearum and F. nirenbergiae in hydroponic systems.
1. Introduction
Intensive agricultural practices, such as the indiscriminate use of chemical agents for disease control and fertilizers, have contributed to environmental pollution and reinforced the urgent need to minimize the negative impacts on human health and the environment resulting from the widespread use of these inputs [1]. In this context, there is increasing interest in developing more sustainable alternatives such as biocontrol products and biofertilizers capable of improving plant nutrition and acting against phytopathogens [2].
Microalgae have been explored as an innovative approach with which to promote plant growth, enhance productivity, and mitigate biotic and abiotic stresses [3]. Spirulina platensis, a blue-green cyanobacterium, contains a wide range of pigments, such as carotenoids, chlorophyll, and phycobiliproteins (e.g., phycocyanin), which capture approximately 50% of the light required for photosynthesis [4].
There is growing interest in the use of algal-derived compounds for plant health management [5,6]. The weekly application of aqueous extracts of S. platensis in hydroponically grown lettuce (Lactuca sativa L.) led to earlier plant maturity compared to the control group, highlighting its potential as a biostimulant in horticulture [2]. Furthermore, the inhibitory activity of S. platensis against Fusarium oxysporum was demonstrated by a 45% reduction in disease incidence in pepper plants following foliar applications three times per week, using a suspension containing 107 spores·mL−1 [7].
Lettuce, widely cultivated in hydroponic systems, is susceptible to several fungal diseases that compromise crop productivity and quality [8]. Despite the reduced contact with soil, hydroponic cultivation does not ensure plant health or microbiological safety [9]. Pathogens spread rapidly in these systems due to the recirculation of the nutrient solution, affecting all plants within the setup [10]. Among the primary pathogens associated with hydroponically grown lettuce, the F. oxysporum species complex (FOSC) is particularly concerning, as it causes vascular wilt, leading to chlorosis, collapse of the aerial parts, and ultimately plant death [11,12].
Colletotrichum spp. also infects various crops, including lettuce, and is responsible for anthracnose, which can result in yield losses exceeding 50% in agricultural production [13,14]. Among the Colletotrichum species known to infect lettuce, this study is the first to report on the isolation of C. orchidearum from hydroponically grown lettuce in Brazil. Originally described in 2018 and mostly associated with ornamental plants [15], this finding expands on the known host range of this pathogen and highlights a new challenge for disease management in hydroponic systems. In addition, Alternaria spp. may be associated with lettuce seeds and, in mature plants, can cause Alternaria leaf spot—characterized by necrotic lesions on leaves, petioles, flowers, and inflorescences—which may lead to plant lodging and death [16,17].
Phycocyanin (PC) is a natural blue pigment with applications in food, nutraceutical, and biotechnological industries [18,19,20]. The efficient extraction of bioactive compounds is a key factor for the utilization of biomolecules with industrial and biotechnological value. Among the most relevant compounds, total phenolic compounds (TPC) and PC present important functional properties such as antioxidant activity and antimicrobial potential. The extraction method directly influences the yield and stability of these compounds. Aqueous solvents, such as phosphate buffer, are commonly used to preserve the integrity of water-soluble proteins and pigments, while hydroalcoholic mixtures are more effective for extracting TPCs of different polarities [4,21].
The extraction of bioactive compounds from microalgal biomass involves mixing dried biomass with solvents such as ethanol, dimethyl sulfoxide, or phosphate buffer solutions [21,22,23]. To enhance the release of intracellular compounds, technologies, such as ultrasonic bath and/or ultrasound probe application, have proven effective [24,25]. However, few studies have applied these technologies to the extraction of bioactive compounds with potential use in agriculture, particularly in plant disease management.
Therefore, this study aimed to develop an extraction method for PC and TPC from S. platensis biomass and to evaluate their in vitro application for the biological control of C. orchidearum, F. nirenbergiae, and Alternaria sp. isolated from hydroponically grown lettuce, contributing to the development of sustainable alternatives for plant disease management.
2. Materials and Methods
2.1. Materials and Chemicals
All solvents, reagents, and chemicals used in this study were of analytical grade. The S. platensis biomass used in this study was commercially obtained from Mocó Agropecuária (Fazenda Tamanduá, Santa Teresinha, PB, Brazil), batch number 91, with a declared purity of 100%. The phosphate buffer was prepared using monobasic sodium phosphate (NaH2PO4, PA grade, Neon, Diadema, SP, Brazil) and dibasic sodium phosphate (Na2HPO4, PA grade, Neon, Diadema, SP, Brazil). Absolute ethanol (99.8% PA) was obtained from Dinâmica (Indaiatuba, SP, Brazil) and used in the preparation of hydroalcoholic extracts. Streptomycin sulfate (PA grade, Dinâmica, Indaiatuba, SP, Brazil) was added to the culture media to inhibit bacterial growth. Bovine serum albumin (BSA, ≥98%, Sigma-Aldrich, St. Louis, MO, USA) was used to prepare the standard curve for protein quantification. Carbohydrate content was determined using anhydrous glucose (PA grade, Neon, Diadema, SP, Brazil) as the standard.
For total phenolic compound (TPC) analysis, hexane (PA grade, Neon, Diadema, SP, Brazil) was used for extract purification, followed by treatment with barium hydroxide (PA grade, Neon, Diadema, SP, Brazil) and zinc sulfate heptahydrate (PA grade, Neon, Diadema, SP, Brazil). The Folin–Ciocalteu reagent, and gallic acid standard (GAE) (Sigma-Aldrich, St. Louis, MO, USA) were used for TPC quantification.
The culture medium used for fungal growth was potato dextrose agar (PDA, Kasvi, Pinhais, PR, Brazil). For DNA extraction, the Wizard® Genomic DNA Purification Kit and the ReliaPrep™ DNA Clean-Up and Concentration System were obtained from Promega (Madison, WI, USA). PCR products were purified using the ReliaPrep™ DNA Clean-Up and Concentration System. Sequencing was performed in both directions using the same PCR primers by ATCGene molecular analysis (Campinas, SP, Brazil) on an AB-3500 automatic sequencer (Applied Biosystems, Waltham, MA, USA). A 1 kb molecular weight marker was purchased from Qiagen (Germantown, MD, USA), and blue-green loading dye was obtained from LGC (Cotia, SP, Brazil).
Spectrophotometric measurements were performed using a UV-1600 spectrophotometer (Pro-Tools, São Paulo, SP, Brazil), and DNA concentrations were determined with a NanoDrop 2000 (Thermo Scientific, Waltham, MA, USA). Electrophoresis gels were visualized using the Safe Imager Blue Light Transilluminator (Invitrogen, USA). The ultrasonic probe system used for sonication was the DES500 (Unique, Linhares, ES, Brazil); and the ultrasonic bath was the P60H (Elma Ultrasonic, Singen, Germany). Homogenization was performed using an Ultra-Turrax T25 (IKA, Campinas, SP, Brazil); centrifugation was conducted using a CIENTEC CT-5000 centrifuge (Porto Alegre, RS, Brazil). Ethanol removal from the extracts was carried out using a rotary evaporator (TE-211, TECNAL, Piracicaba, SP, Brazil).
2.2. Isolation and Identification of Phytopathogens
Phytopathogens were isolated from lettuce plants grown in hydroponic systems that showed visible symptoms of root diseases. A large number of diseased lettuce roots were collected for the isolation procedure. The diseased roots were washed with detergent and water to remove debris and/or substrate; symptomatic tissues were cut into 1 cm sections [26].
The fragments were disinfected with a 1% (v/v) sodium hypochlorite solution, prepared by diluting commercial bleach containing 2% (w/v) sodium hypochlorite with sterile distilled water. The fragments were immersed in this solution for 1 min, rinsed twice with sterile distilled water, and dried on paper towels in a laminar flow cabinet for 5 min. Approximately five fragments were transferred to each of ten Petri dishes (90 mm × 15 mm) containing potato dextrose agar (PDA) supplemented with streptomycin sulfate (0.20 g·L−1) to prevent bacterial growth. The plates were incubated at 25 °C under a 12 h photoperiod and monitored for hyphal growth. Hyphal tips were subcultured onto fresh PDA plates supplemented with streptomycin sulfate until pure cultures were obtained [26].
For identification, a 5 mm diameter mycelial disc from each pure culture was transferred to a Petri dish containing PDA medium. The plates were incubated for 5 days at 25 °C under a 12 h photoperiod. The microorganisms were sent for identification to Agronômica Laboratory—Plant Health Diagnostic and Consulting Laboratory, located in Porto Alegre, Rio Grande do Sul, Brazil.
The initial examination was based on the observation of characteristic pure colonies under a light microscope. Then, microscope slides were prepared from the formed mycelium, stained with modified Amann’s blue stain, and observed under a light microscope to confirm the identity of the fungi at the genus level [27,28].
For DNA extraction, fungal material from each isolate was collected and ground into a fine powder in liquid nitrogen using a pestle and pre-chilled 1.5 mL microtubes. Total genomic DNA was extracted from 100 mg of the homogenized material using the Wizard® Genomic DNA Purification Kit, following the manufacturer’s instructions. After extraction, the DNA concentration was quantified using a spectrophotometer by measuring absorbance at 260 nm and 280 nm. The DNA concentration was adjusted to 50 ng·μL−1 using ultrapure water.
The molecular identity of the isolates was determined through PCR amplification and sequencing of the internal transcribed spacer (ITS) regions of ribosomal DNA, elongation factor 1-alpha (EF), glyceraldehyde-3-phosphate dehydrogenase (GAPDH), and the second largest subunit of DNA-dependent RNA polymerase II (RPB2) using the following primers: V9G-F (5′-TTACGTCCCTGCCCTTTGTA-3′) and LR5-R (5′-ATCCTGAGGGAAACTTC-3′) [29,30]; EF1-728F (5′-CATCGAGAAGTTCGAGAAGG-3′) and EF1-986R (5′-TACTTGAAGGAACCCTTACC-3′) [31]; GDF (5′-GCCGTCAACGACCCCTTCATTGA-3′) and GDR (5′-GGGTGGAGTCGTACTTGAGCATGT-3′) [31]; 7cR (5′-CCCATRGCTTGYTTRCCCAT-3′) and 5F2 (5′-GGGGWGAYCAGAAGAAGGC-3′) [32]. PCR reaction mixtures and thermal cycling conditions for each gene are summarized in Table 1.

Table 1.
Composition of PCR reaction mixtures (total volume 15 μL) and thermal cycling conditions used for the amplification of ITS, EF, GAPDH, and RPB2 genes.
The PCR product was subjected to electrophoresis on a 1.5% (w/v) agarose gel prepared with 0.5× Tris–Borate–EDTA (TBE) buffer, run at 90 V for 80 min. A loading buffer containing blue-green dye (LGC) was used, and bands were visualized under ultraviolet light using a gel imaging system (Safe Imager Blue Light Transilluminator, Invitrogen). Fragment size was estimated by comparison with a 1 kb molecular weight marker.
PCR products were purified using the ReliaPrep™ DNA Clean-Up and Concentration System. Sequencing was performed in both directions using the same PCR primers by ATCGene molecular analysis (Porto Alegre, RS, Brazil).
The resulting sequences were edited using BioEdit software (version 7.0.5.3). Consensus sequences were analyzed with molecular evolutionary genetics analysis (MEGA X, version 10.2.6) software [33], aligned using the MUSCLE algorithm, and compared with sequences from the NCBI GenBank database. Sequence similarity for ITS, EF, GAPDH, and RPB2 genes was assessed using the Basic Local Alignment Search Tool (BLAST, version 2.14.0). Phylogenetic analyses were conducted using the maximum likelihood method in MEGA X with 1000 bootstrap replicates. Reference sequences corresponding to each gene, previously deposited in GenBank, were also included in the analyses.
2.3. Characterization of Spirulina platensis Biomass and Extract Production
To determine the protein and carbohydrate concentrations of S. platensis, the biomass was suspended at a concentration of 0.5 mg·mL−1 and subjected to sonication using an ultrasound probe for 10 min (1 min on, 1 min off) at maximum power [24]. Protein content was determined using the method of Lowry et al. (1951) [34], based on a bovine serum albumin standard curve. Carbohydrate content was quantified using the method of DuBois et al. (1956) [35], based on a standard curve prepared with anhydrous glucose.
S. platensis extracts prepared using different methods were produced at a concentration of 1% (w/v) for those involving phosphate buffer (pH 7.0, 0.15 mol·L−1), which was prepared using monobasic sodium phosphate (NaH2PO4) and dibasic sodium phosphate (Na2HPO4) salts [22] and 5% for treatments using hydroalcoholic extraction (1:1 absolute ethyl alcohol and distilled water) [21]. For better homogenization, the extracts were subjected to Ultra-Turrax at 25,000 rpm for 5 min. After this initial homogenization, the extracts were further processed using either an ultrasonic probe (5 min at 100% power) [24] or an ultrasonic bath (37 Hz, 30 min at 30 °C) [25]. Table 2 presents the extraction methods used. All treatments were performed in triplicate.
Table 2.
Methods used for the extraction of compounds from Spirulina platensis biomass and their abbreviations.
The extracts obtained using the methodologies described in Table 2 were evaluated for their PC and TPC contents. Hydroalcoholic extracts (C, C+UP, and C+UB) were evaporated at 77 °C using a rotary evaporator to remove ethanol and subsequently resuspended in water to reach the initial concentration (5% w/v) [21].
To determine the PC concentration, the extracts were centrifuged (3600× g for 15 min) and then diluted in water to ensure that the absorbance remained between 0.200 and 0.800. Absorbance was measured at wavelengths of 615 and 652 nm using a spectrophotometer. The PC concentration was calculated using Equation (1) proposed by Bennett and Bogorad (1973) [37] and expressed as mg of PC per gram of S. platensis:
where
PC = [A620 − (0.474 × A652)] ÷ 5.34
- PC = phycocyanin concentration (mg·mL−1);
- A620 = absorbance at 620 nm;
- A652 = absorbance at 652 nm.
For TPC analysis, the extracts were purified with hexane to remove nonpolar compounds. The lower phase was treated with barium hydroxide (0.1 mol L−1) and zinc sulfate heptahydrate (5% w/v) to eliminate interfering substances [38]. The purified extracts were then centrifuged (3600× g for 15 min).
TPC was quantified based on a redox reaction with the Folin–Ciocalteu reagent, which reacts with hydroxyl groups in polyphenols. The procedure followed the method described by Correia et al. (2004) [39], with modifications proposed by Sousa and Correia (2012) [40]. Absorbance was measured at 765 nm using a spectrophotometer (UV-1600, Pró-Tools, Brazil). A calibration curve was previously established using gallic acid equivalents (GAE) as the standard (Y = 8.461X − 0.1386), with a determination coefficient (R2) of 0.9977. Results were expressed as a GAE per gram of S. platensis.
After identifying the extraction method that resulted in the highest contents of PC and TPC, extracts were prepared at concentrations of 5, 10, and 15% (w/v) to study the effect of increasing the initial biomass concentration. The extracts were prepared using the A+UP and B+UP methods (Table 2). The abbreviations assigned to these extracts were: A+UP.5%, A+UP.10%, A+UP.15%, B+UP.5%, B+UP.10%, and B+UP.15%. All treatments were performed in triplicate.
2.4. In Vitro Assay for Phytopathogen Inhibition
For the in vitro control assays, the phytopathogens Colletotrichum orchidearum 37083, Fusarium nirenbergiae 37084, and Alternaria sp. 37085 were used, previously isolated as described in Section 2.2. The S. platensis extract used in the tests was obtained under the best experimental condition identified in Section 2.3. To prevent contamination during the in vitro assay, the extract was subjected to two sterilization methods (autoclaving at 121 °C for 20 min and UV light exposure for 1 h) and was then characterized for PC and TPC.
The treatments tested were as follows: PDA (Kasvi, Brazil) medium without extract, used as a negative control (C1); PDA supplemented with phosphate buffer (0.15 mol·L−1, pH 7.0), autoclaved at 121 °C for 20 min, representing the solvent control used in the extraction procedures (C2); PDA supplemented with S. platensis extract at 10% concentration, previously autoclaved under the same conditions as control C2 (A+UP.10%Autoclave); and PDA supplemented with S. platensis extract at 10% concentration, sterilized by UV light exposure for 1 h (A+UP.10%UV).
The assay consisted of applying 100 μL of each treatment onto 30 mL of PDA medium in 100 × 20 mm Petri dishes [41]. Treatments were pipetted and evenly spread using a Drigalski spatula. For treatment A+UP.10%UV, after the extract was applied to the plates, they were kept open under UV light for 1 h.
After complete absorption of the biocontrol agents, a 5 mm mycelial disc from each fungal colony isolated was placed at the center of the plate. Mycelial growth (mm) of each colony was measured along orthogonal axes on days 1, 3, 5, and 7 of incubation. Radius measurements were converted into areas using the equation A = πr2; inhibition percentages were calculated. All treatments were conducted in quadruplicate, representing technical replicates of the same isolate.
The percentage of inhibition (PI) of the pathogens was determined using Equation (2), which considers the difference in colony diameter in the presence of biocontrol agents compared to the control [42]. For the calculations, the control used in the equation was C2 (Table 2). PI was calculated using the average colony area of the replicates for each day, and then the mean inhibition was obtained as follows:
where
PI = [(PC − PE) ÷ PC] × 100
- PC = pathogen growth on the control plate (mm);
- PE = pathogen growth on the plate containing biocontrol agents (mm).
2.5. Data Processing and Statistical Analysis
This section includes all statistical analyses performed in the manuscript, including pathogen growth assays, yields of bioactive compound extractions, and other evaluations. When necessary, data were transformed using the Box-Cox method (when applied, the λ value is reported in Section 3). Most analyses were conducted using the ExpDes.pt package (version 1.2.2) in R [43], which provides tools for experimental design and analysis in Portuguese. The Shapiro–Wilk test was used to assess the normality of residuals (p > 0.05); Bartlett’s test was used to assess the homogeneity of variances (p > 0.05). For the analysis of inhibition percentages over time, a completely randomized design in a factorial scheme (two factors: treatment and time) was adopted. These analyses were performed using Statistica software, version 10 (StatSoft Inc., USA). Phylogenetic analysis was performed using MEGA X molecular evolutionary genetics analysis across computing platforms [33].
3. Results
3.1. Identification of Phytopathogens
The images illustrating the fungal growth characteristics on the plates are shown in Figure 1. Figure 1a,d,g shows the fungus Alternaria sp. 37085, a phytopathogen that reproduces exclusively through conidia formed at the tips of conidiophores [14]. It exhibits mycelial growth with coloration ranging from pale to olive brown, a smooth to slightly verrucose surface, and septate conidia [44,45]. The conidia observed in the images conform to the described morphological pattern, forming branched chains. They display obclavate, ellipsoidal, or oval shapes and are septate [44,45]. The phylogenetic clade of Alternaria sp. 37085 is shown in Figure 1g, where the isolate clustered with reference strains of Alternaria sp. based on ITS region primers and the maximum likelihood method (sequence available in Appendix A).
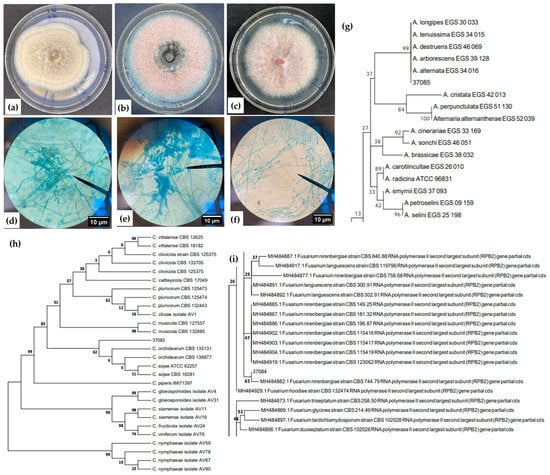
Figure 1.
Macroscopic and microscopic structures (hyphae and spores) and phylogenetic clades of phytopathogenic fungi isolated from the roots of hydroponically grown lettuce: (a,d,g) Alternaria sp. 37085; (b,e,h) Colletotrichum orchidearum 37083; and (c,f,i) Fusarium nirenbergiae 37084.
Figure 1b,e,h refers to the phytopathogen C. orchidearum 37083. In the microscopic image, typical fungal structures can be identified such as smooth-walled conidia with a rounded apex. In the macroscopic image, pink fungal growth with black spots is observed; these small black structures are known as acervuli [14]. In Figure 1h, the isolate was grouped based on GAPDH (Appendix A) region primers and the maximum likelihood method, clustering with reference strains of C. orchidearum. C. orchidearum is a taxonomically recently described species, first identified in 2018, and belongs to the C. gloeosporioides species complex [15].
Figure 1c,f,i represents the phytopathogen F. nirenbergiae 37084. The macroscopic image shows a fungus with pink coloration and a velvety appearance, while the microscopic image reveals short monophialides with microconidia typical of this genus [46,47]. Phylogenetic analysis using RPB2 region primers and the maximum likelihood method showed that the isolate clustered with reference strains of F. nirenbergiae (Figure 1i). Additionally, BLAST (version 2.14.0) comparison of the EF (Appendix A) gene showed 100% similarity with the same species.
3.2. Spirulina platensis Biomass Characterization and Extract Yields
The biomass of S. platensis exhibited a high protein content (54.41 g·100 g−1), while the carbohydrate content was 15.61 g·100 g−1. The extraction methods had a significant effect (p < 0.05) on the extraction of PC and TPC.
The PC extraction is presented in Figure 2. The A+UP and B+UP methods resulted in the highest extraction yields (76 mg of PC extracted per gram of S. platensis), with no significant difference between them. Hydroalcoholic mixture-based methods (C, C+UB, and C+UP) led to significantly lower PC extraction yields from S. platensis biomass.
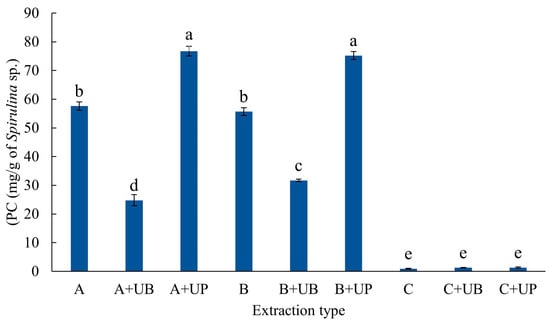
Figure 2.
Phycocyanin (PC) concentration extracted from the microalga Spirulina platensis using each extraction method presented in Table 2. Treatments were as follows: A corresponds to 1% (w·v−1) biomass homogenized in phosphate buffer for 21 h at 4 °C. A+UB underwent the same procedure as A, followed by ultrasonic bath treatment, while A+UP was treated as A, followed by ultrasound probe treatment; B corresponds to 1% (w·v−1) biomass homogenized in phosphate buffer for 4 h at 25 °C; B+UB and B+UP followed the same initial procedure as B, followed by ultrasonic bath and ultrasound probe treatment, respectively; C refers to 5% (w/v) biomass homogenized in a hydroalcoholic solvent, followed by shaking at 150 rpm for 60 min at 25 °C.; C+UB was treated as C, followed by ultrasonic bath and subsequent shaking, while C+UP underwent the same as C, followed by ultrasound probe treatment and shaking at 150 rpm for 60 min at 25 °C. Data are expressed as means ± standard deviation (n = 3). Different letters indicate significant differences between treatments according to Tukey’s test (p < 0.05). Data were transformed using the Box-Cox method (λ = 0.2626).
The extracts obtained using phosphate buffer, whether by homogenization (methods B and A) or by ultrasound (bath and probe), showed the highest concentrations of total TPC (20.95 mg GAE·g of S. platensis−1), with no significant differences between them. In contrast, treatments using hydroalcoholic mixtures resulted in lower concentrations of TPC (Figure 3).
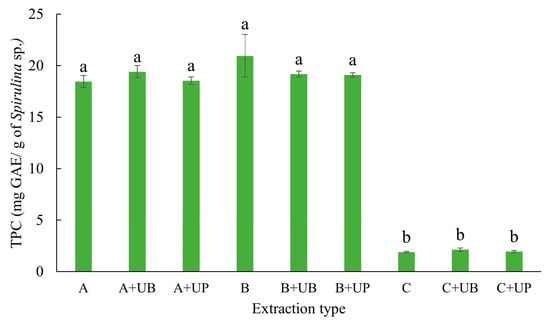
Figure 3.
Total phenolic compound (TPC) concentration extracted from the microalga Spirulina platensis using each extraction method presented in Table 2. Treatments were as follows: A corresponds to 1% (w/v) biomass homogenized in phosphate buffer for 21 h at 4 °C. A+UB underwent the same procedure as A, followed by ultrasonic bath treatment, while A+UP was treated as A, followed by ultrasound probe treatment; B corresponds to 1% (w/v) biomass homogenized in phosphate buffer for 4 h at 25 °C; B+UB and B+UP followed the same initial procedure as B, followed by ultrasonic bath and ultrasound probe treatment, respectively; C refers to 5% (w/v) biomass homogenized in a hydroalcoholic solvent, followed by shaking at 150 rpm for 60 min at 25 °C.; C+UB was treated as C, followed by ultrasonic bath and subsequent shaking, while C+UP underwent the same as C, followed by ultrasound probe treatment and shaking at 150 rpm for 60 min at 25 °C. Data are expressed as means ± standard deviation (n = 3). Different letters indicate significant differences between treatments according to Tukey’s test (p < 0.05).
The extracted concentrations of TPC (20.95 mg GAE·g−1) and PC (76 mg PC·g−1) using phosphate buffer (0.15 mol·L−1, pH 7.0) followed by sonication after 21 or 4 h of extraction (methods A+UP and B+UP, respectively) stood out in our study. Sonication with an ultrasonic probe was particularly effective, resulting in the highest yields for both target compounds.
The ultrasonic probe is known for its ability to disrupt microalgal cell walls, efficiently releasing intracellular compounds [24,25]. This is consistent with the results obtained in our study, where ultrasonic treatments significantly enhanced extraction efficiency (Figure 2 and Figure 3). During the process, ultrasonic waves generate microcavitation in the liquid medium. The collapse of these bubbles causes mechanical rupture of the cells, facilitating the release of TPC and other bioactive metabolites [21]. Thus, the combination of phosphate buffer and sonication enhances the extraction efficiency, improving both the yield and quality of the extracted compounds.
Based on the results obtained in the previous stage, extractions were performed using phosphate buffer (0.15 mol·L−1, pH 7.0) at three different concentrations—5, 10, and 15% (w/v)—using the A+UP and B+UP treatments. The two-way analysis of variance was significant (p < 0.05). The mean comparisons analyzed by Tukey’s test are presented in Figure 4a for PC and Figure 4b for TPC.
Figure 4.
Phycocyanin (PC) and total phenolic content (TPC) of sonicated Spirulina platensis extracts at different concentrations (5, 10, and 15% w/v): (a) phycocyanin (PC); and (b) total phenolic content (TPC). Treatment A+UP corresponds to biomass homogenized in phosphate buffer for 21 h at 4 °C, and treatment B+UP corresponds to biomass homogenized in phosphate buffer for 4 h at 25 °C. All extracts were subjected to ultrasound probe treatment after the extraction period in buffer solution. Extracts were formulated at concentrations of 5, 10, and 15% (w/v). Data are expressed as means ± standard deviation (n = 3). Different letters indicate significant differences between treatments according to Tukey’s test (p < 0.05).
The graphical representations of PC (Figure 4a) and TPC (Figure 4b) extractions show that the A+UP.10% method resulted in the highest yields, reaching 95.6 mg g−1 for PC and 21.9 mg GAE·g−1 for TPC. Using the same biomass concentration, the B+UP 10% method yielded significantly lower amounts for both compounds. Additionally, the A+UP 15% method outperformed B+UP 15% in the PC extraction, indicating that longer extraction times favor PC release. However, extracts obtained with 15% biomass showed lower values than those with 10%, suggesting that higher concentrations may lead to suspension saturation, hindering pigment release. Under such conditions, the extracting solvent has less individual access to the cells, limiting PC diffusion and resulting in incomplete extraction and a lower yield per gram of biomass [48]. These findings demonstrate that both biomass concentration and extraction time significantly influence the extraction efficiency of PC and TPC from S. platensis, supporting previous studies that emphasize the importance of balancing these factors to optimize the recovery of proteins and pigments from cyanobacteria [25].
The S. platensis extract used for the in vitro control assays was prepared using 10% biomass and 21 h of extraction in phosphate buffer (0.15 mol·L−1, pH 7.0) at 4 °C, in the dark. The analysis of variance regarding the effect of the sterilization method (autoclaving and UV light) of the PC and TPC extraction was significant (p < 0.05). The mean comparisons are presented in Figure 5a and Figure 5b, respectively.
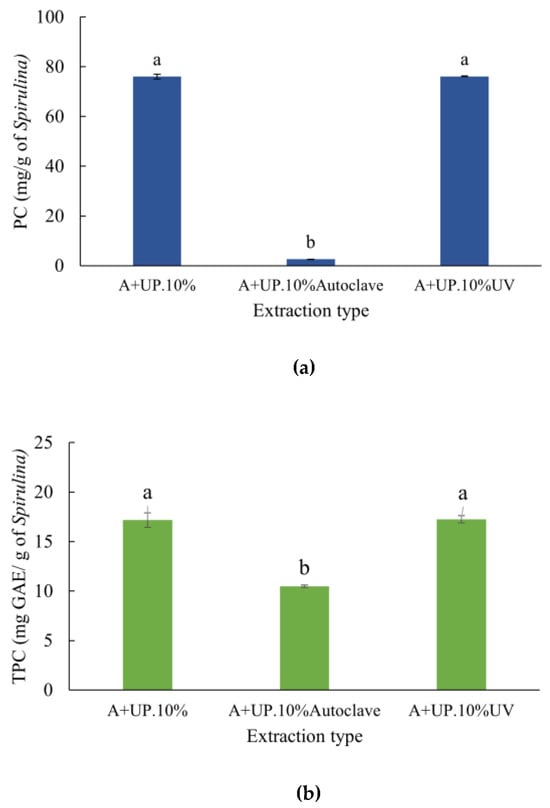
Figure 5.
Phycocyanin (PC) and total phenolic compounds (TPC) in Spirulina platensis extracts after different sterilization methods: (a) PC; and (b) TPC. The treatment A+UP.10% refers to the S. platensis extract at a concentration of 10% (w/v), obtained by extraction in phosphate buffer for 21 h at 4 °C, followed by ultrasound probe sonication without any sterilization method. A+UP.10%Autoclave refers to the same extract sterilized by autoclaving, and A+UP.10%UV refers to the extract sterilized by UV light for 1 h. Data are expressed as means ± standard deviation (n = 3). Different letters indicate significant differences between treatments according to Tukey’s test (p < 0.05).
The non-sterilized extract (A+UP.10%) and the extract exposed to UV light for one hour (A+UP.10%UV) both showed 76 mg of PC·g−1 of S. platensis, with no significant difference between them (Figure 5a). However, the extract subjected to autoclaving (A+UP.10%Autoclave) showed a significant reduction in PC concentration, resulting in 2.62 mg PC·g−1 of S. platensis. Regarding TPC content, both extracts A+UP.10% and A+UP.10%UV exhibited statistically sim ilar values (17.25 mg GAE.g S. platensis−1) (Figure 5b). In contrast, the autoclaved extract showed a significant reduction in TPC content, reaching 10.49 mg GAE·(g of S. platensis)−1.
3.3. Efficacy of Extracts in Controlling Phytopathogens In Vitro
Figure 6 presents the antifungal activities against the isolated phytopathogens. Figure 6a–c refer to C. orchidearum, Figure 6d–f to F. nirenbergiae, and Figure 6g–i to Alternaria sp. Panels a, d, and g show the inhibition percentages over seven days. Panels b, e, and h depict the radial growth progression; and panels c, f, and i show the fungal growth on day seven.
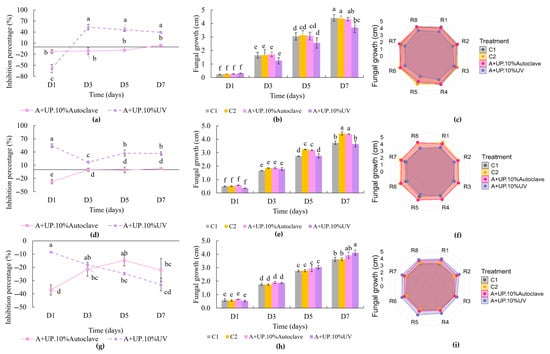
Figure 6.
Inhibition percentages of phytopathogens over seven days of treatment with Spirulina platensis extracts, fungal radial growth over time, and radial visual representation of phytopathogens on the seventh day: (a–c) Colletotrichum orchidearum 37083; (d–f) Fusarium nirenbergiae 37084; and (g–i) Alternaria sp. 37085 in response to controls and S. platensis extracts. Figures (a,d,g) show the inhibition percentages resulting from extract treatments after subtracting the phosphate buffer control (C2), while figures (c,f,i) show the radial growth of the fungi in response to the extracts compared to the controls. Figures (b,e,h) illustrate the radial growth of the phytopathogens throughout the seven-day period. Treatment A+UP.10%Autoclave refers to the S. platensis extract at 10% (w/v), extracted in phosphate buffer for 21 h at 4 °C, sonicated with an ultrasound probe, and sterilized by autoclaving. Treatment A+UP.10%UV refers to the same extract sterilized by UV light for 1 h. Data are expressed as means ± standard deviation (n = 4). Means followed by the same letter do not differ significantly according to Tukey’s test at 5% probability.
The antifphenoungal effects observed in this study reinforce the idea that the activity of microalgal extracts is highly specific and depends on the combination between the target microorganism and the type of microalga used [49]. For the phytopathogen C. orchidearum (Figure 6a), the A+UP.10%UV treatment showed the highest inhibition on the third day of the experiment, reaching 53.52% inhibition, with no significant variation observed until the end of the trial. Although the radial growth trends over time shown in Figure 6b do not reveal a clear separation between treatments and controls throughout the entire experimental period, a marked difference becomes evident on the seventh day. This is further supported by Figure 6c, which shows the final colony diameters and highlights the pronounced inhibitory effect of the A+UP.10%UV treatment.
The performance of the extracts on the inhibition of the phytopathogen F. nirenbergiae 37084 is shown in Figure 6d. The A+UP.10%UV extract exhibited the highest inhibition, with the best result observed on the first day of the experiment (54.17%), showing no statistical difference compared to the seventh day. Both the A+UP.10%UV extract and the control C1 (PDA only) showed lower mycelial growth than the other treatments starting from the fifth day, as shown in Figure 6e, suggesting that the phosphate buffer facilitated fungal growth. Fungal growth on the seventh day can be observed in Figure 6f. Similar to the previous phytopathogen, radial growth was reduced following the application of the A+UP.10%UV extract. Treatments involving the autoclaved extract (A+UP.10%Autoclave) showed much lower effectiveness, with the highest inhibition recorded on the seventh day at only 2.51%.
Figure 6g–i shows the inhibition levels of the extracts against the phytopathogen Alternaria sp. The treatments resulted in fungal growth promotion, which is the opposite effect compared to the other phytopathogens studied. The lowest inhibition percentages were observed with the A+UP.10%Autoclave extract on the first day (−37.02%), while the A+UP.10%UV extract resulted in −32.96% inhibition. The ineffectiveness of the extracts against Alternaria sp. is also evident in Figure 6h, where mycelial growth was higher in the treatments compared to the controls on the seventh day of the experiment. This can also be visually observed in the radial representation (Figure 6i). These results suggest a potential fungal growth-promoting effect of the extracts against Alternaria sp.
4. Discussion
The phytopathogens C. orchidearum, F. nirenbergiae, and Alternaria sp., isolated in this study from the roots of hydroponically grown lettuce, are known to cause diseases in various plant species, significantly affecting crop yields. Their identification in lettuce underscores the growing phytosanitary challenges associated with soilless cultivation systems such as hydroponics.
Notably, C. orchidearum was identified for the first time in lettuce. To the best of our knowledge, there are no prior reports in the literature of this species being isolated from lettuce. C. orchidearum is a recently described species in taxonomic terms, primarily associated with ornamental plants, such as orchids (Cattleya sp., Dendrobium sp., Oncidium sp., and Phalaenopsis sp.), Cordyline terminalis, and Monstera deliciosa, with most records originating from Asian countries [13,14,50]. Its detection in this study extends the known host range of the species and represents the first report of C. orchidearum associated with lettuce in Brazil, raising an important alert for hydroponic production systems.
The isolation of F. nirenbergiae, another recently described species (taxonomically) within the F. oxysporum species complex (FOSC), is also noteworthy. This pathogen has been associated with vascular wilts in crops such as passion fruit [11] and saffron [12]. Its occurrence in hydroponic lettuce highlights the need for preventive measures and regular monitoring, even in soilless systems, given that members of the FOSC are cosmopolitan, asexual, and often transmitted through plant debris or contaminated water.
The application of sonication, including ultrasonic bath and probe treatments, was effective in enhancing the extraction action of intracellular compounds such as phycocyanin. As this pigment is located within phycobilisomes attached to thylakoid membranes [51], cell wall disruption is necessary for its efficient release. Ultrasonic probe treatment facilitates this through acoustic cavitation, generating localized high pressures and shear forces that rupture cells [24,25]. Importantly, shorter extraction times at room temperature yielded PC amounts comparable to those obtained under longer, colder conditions, indicating a potentially more efficient and economical process.
TPC are structurally diverse secondary metabolites found in microalgae, including phenolic acids, flavonoids, and tannins [51,52]. Their concentration in S. platensis biomass is known to vary depending on environmental and cultivation factors. These findings reinforce the importance of selecting appropriate extraction conditions. When using phosphate buffer combined with ultrasonication, higher TPC yields were observed compared to hydroalcoholic extraction methods, indicating that the former may be more suitable for recovering phenolics from S. platensis [23]. This observation aligns with previous studies highlighting the enhanced efficiency of sonication-based methods when optimized for solvent composition and extraction parameters [21].
A comparative summary of extraction conditions and yields for PC and TPC, including data from this study and previous publications, is presented in Table 3 to enhance clarity and facilitate comparison.
Table 3.
Summary of phycocyanin and total phenolic compound extraction results from literature and current study.
Phycocyanin stability is affected by multiple factors such as production method, storage, temperature, and pH [53]. The use of phosphate buffer at a pH of 7.0 with sonication illustrates the importance of mild extraction conditions to preserve compound integrity [21,22]. Our data indicate that simultaneous extraction of PC and TPC can be efficiently achieved using 10% biomass in 0.15 mol L−1 phosphate buffer (pH 7.0) at 4 °C for 21 h, in the dark, assisted by sonication—a process that is both technically and economically viable.
Regarding sterilization, autoclaving significantly reduced the stability of the bioactive compounds, likely due to the thermosensitive nature of PC, which is known to degrade substantially at temperatures as low as 70 °C [53]. Conversely, sterilization by ultraviolet (UV) radiation better preserved both PC and TPC. This finding supports the use of UV radiation as a suitable alternative to thermal sterilization, also ensuring extract sterility, as previously demonstrated in studies applying UV–C light to eliminate microbial contamination in S. platensis cultures [54].
The antifungal potential of microalgal extracts is supported by the literature. Scaglioni et al. (2019) [55] reported that crude extracts from Nannochloropsis sp. and S. platensis were more effective against the Fusarium graminearum complex than purified fractions. Additionally, TPC from S. platensis have been shown to reduce fungal biomass markers, such as ergosterol and glucosamine, and inhibit ergosterol synthesis in vitro [56].
Schmid et al. (2022) [49] evaluated microalgal extracts against several phytopathogens, including Alternaria alternata. Their results indicated that Alternaria was not inhibited by any extracts tested, including those from Spirulina, Nannochloropsis, and Scenedesmus, with Spirulina extract even promoting growth of Sclerotium rolfsii. This underscores the species- and extract-specific nature of microalgal bioactivity and highlights the importance of testing each pathogen–extract combination individually.
In contrast, the S. platensis extract (A+UP.10%UV) in this study inhibited Colletotrichum spp. growth by up to 53%, demonstrating significant antifungal activity. Sacramento et al. (2025) [57] similarly reported fungistatic effects of Conticribra weissflogii against Colletotrichum gloeosporioides at a minimum inhibitory concentration of 1.5 mg/mL. However, while Sacramento’s results were based on purified compounds, our study achieved substantial inhibition using crude extracts, highlighting the practical potential of S. platensis for sustainable fungal control.
These findings demonstrate the potential of microalgal extracts—especially those sterilized by UV radiation—as selective antifungal agents. The results emphasize that crude S. platensis extracts, still underexplored for antifungal activity, can inhibit fungal growth without the need to isolate specific compounds. Additionally, the growth-promoting effect observed on Alternaria sp. highlights the complexity of these interactions and the importance of evaluating each pathogen–extract combination individually. Altogether, our results provide a promising foundation for future in vivo studies and support the integration of S. platensis extracts into sustainable disease management strategies, particularly in hydroponic and soilless systems.
5. Conclusions
The extraction performed with phosphate buffer (0.15 mol·L−1, pH 7.0) combined with sonication, using 10% biomass for 21 h at 4 °C, proved to be the most efficient condition for the simultaneous extraction of PC and TPC from Spirulina platensis. The obtained extracts demonstrated promising in vitro antifungal activity against the phytopathogens Colletotrichum orchidearum 37083 and Fusarium nirenbergiae 37084, with this being the first report of C. orchidearum isolation from lettuce crops in Brazil. This finding broadens the knowledge of the host range of this species and highlights the importance of efficient control of this pathogen in hydroponic systems.
Conversely, the extracts promoted the growth of the phytopathogen Alternaria sp., indicating that the antifungal activity is highly specific and underscoring the need for detailed evaluations for practical applications. These results suggest that S. platensis algal extracts represent a viable and sustainable alternative for the biological management of C. orchidearum and F. nirenbergiae in agricultural systems.
Author Contributions
Formal analysis, L.E.B. and L.M.C.; funding acquisition, L.M.C.; investigation, L.E.B. and E.d.L.M.; methodology, L.E.B. and E.d.L.M.; supervision, J.L.T.C. and L.M.C.; writing—original draft, L.E.B.; writing—review and editing, J.L.T.C. and L.M.C. All authors have read and agreed to the published version of the manuscript.
Funding
This study was financed by the Coordination for the Improvement of Higher Education Personnel (CAPES) (finance code 001).
Data Availability Statement
Data are contained within the article.
Acknowledgments
The authors are pleased to acknowledge the Coordination of Improvement of Higher Education Personnel (CAPES), and the University of Passo Fundo for financial support.
Conflicts of Interest
The authors declare no conflicts of interest.
Appendix A
| Glyceraldehyde-3-phosphate dehydrogenase (GAPDH) gene sequences Sample 37083 CCCTTCATTGAGACCAAGTACGCTGTGAGTAGCACCCCTCCAAGCTCGCCGCGATATCACGCCCGCCACCCCTCAATCGCGAACGCCAGCTTCTGGCTGCCGATCAGACGCCAAAATCAATCAGGCTCTGATACAGCGAGCGATTGATGGGGCCGGCGCGGCGGGGTCGAACATAGCCTCAATGGTTTCGGTTGCTGATACGCCATCCGCAGGCCTACATGCTCAAGTACGACTC Elongation factor (EF) gene sequences Sample 37084 CACGGTGACCGGGAGCGTCTGAGTGATGTTAGTACGAAGAGAAGTAGAATGAAGCATGAGCGACAACATACCAATGACGGTGACATAGTAGCGAGGAGTCTCGAACTTCCAGAGAGCAATATCGATGGTGATACCACGCTCACGCTCGGCCTTGAGCTTGTCAAGAACCCAGGCGTACTTGAAGGAACCCTTACCGAGCTCAGCGGCTTCCTATTGTTGAATGGTTAGTGACTGCTTGACACGTGACGACGCACTCATTGAGGTTGTGAGAATGGTTAAGAGGGCAAACGCTCCCGTCGCTCAAGTGGCGGGGTAAGTGCCCCACCAAAAAAAATTACAGTCATATTGCAAAATTTTTGGTCTCGAGCGGGGTAGCGGGCACGTTTCGAGTCGTAGGGGAAATCGATGGGCAAAGGACGCGCGATCGAAGGGAAAGTGACTAACCTTCTCGAACTTCTCGATGGTTCGCTTATCGATACCACCGCACTGGTAGATCAAGTGACCGGTCTGTGAAACGATGTCAGTATGTTGACTTTGAGAAATACCCCACCAGGTCTTGGTCGGGATTGACGATGGCAGATAAGCTCATTGTCGAGGAGAGTACTCACAGTG Second largest subunit of DNA-directed RNA polymerase II (RPB2) gene sequences Sample 37084 TCTTTCACATTTGCGTCGAACCAATACTCCCATCGGACGAGATGGTAAATTGGCCAAGCCTCGACAGCTTCACAACACTCACTGGGGTTTGGTGTGTCCTGCCGAAACACCTGAGGGTCAAGCTTGTGGTCTGGTCAAAAACTTGTCTCTGATGTGTTACGTCAGTGTCGGCTCTCCAGCCGATCCTCTGATTGAATTCATGATCAACAGAGGTATGGAAGTCGTTGAGGAGTACGAGCCGACAAGATACCCCCACGCTACAAAGATTTTCGTCAACGGTAGCTGGGTTGGTGTTCATGCCGACCCCAAGCATCTCGTGAATCAGGTCTTGGACACAAGACGAAAGTCTTACGTGCAGTTCGAAGTATCACTTGTTCGTGATATCCGAGACCGTGAATTCAAGATTTTCTCAGACGCTGGCCGTGTCATGAGACCCGTCTTTACAGTTCATCAGGAGGATGACTATGAGAACAACATCACCAAGGGACAACTAGTGTTGACAAAGGACCATGTCAATAGGCTAGCCCAAGAACAGGCAGAGCCTCCTGCCAACCCAGCGGACAAGTTTGGATGGGATGGCTTGATCCGCGAAGGAGCTGTCGAGTATCTCGATGCTGAGGAAGAAGAGACAGCCATGATTTGCATGACGCCAGAGGATCTCGAACTTTACCGTGAGCAAAAGAATGATGAAGCTACACTCACAGAAGAAGAGAAACGGGCCAAGCAAGAGGCAGAGAAGAGAGAACAAGAGGAGGACCGCAACAAGCGATTGAAGACAAAGGTGAACCCCACAACTCACATGTACACACATTGTGAGATTCACCCCAGTATGATTCTCGGTATCTGTGCCAGTATCATTCCTTTCCCCGATCACAACCAGGTATGTATGTCCTATGACC Internal transcribed spacer (ITS) region sequences Sample 37085 GCAACGACCACCTCAAGCCGGAAAGTTCGTCAAACTCGGTCATTTAGAGGAAGTAAAAGTCGTAACAAGGTCTCCGTAGGTGAACCTGCGGAGGGATCATTACACAAATATGAAGGCGGGCTGGAACCTCTCGGGGTTACAGCCTTGCTGAATTATTCACCCTTGTCTTTTGCGTACTTCTTGTTTCCTTGGTGGGTTCGCCCACCACTAGGACAAACATAAACCTTTTGTAATTGCAATCAGCGTCAGTAACAAATTAATAATTACAACTTTCAACAACGGATCTCTTGGTTCTGGCATCGATGAAGAACGCAGCGAAATGCGATAAGTAGTGTGAATTGCAGAATTCAGTGAATCATCGAATCTTTGAACGCACATTGCGCCCTTTGGTATTCCAAAGGGCATGCCTGTTCGAGCGTCATTTGTACCCTCAAGCTTTGCTTGGTGTTGGGCGTCTTGTCTCTAGCTTTGCTGGAGACTCGCCTTAAAGTAATTGGCAGCCGGCCTACTGGTTTC |
References
- López Mejía, N.; Martínez Correa, H.A.; Lobatón García, H.F. Biostimulating Activity of Biomass Extracts and Supernatants from a Culture of Arthrospira platensis Enriched with L-Tryptophan. J. Appl. Phycol. 2024, 36, 1875–1884. [Google Scholar] [CrossRef]
- Varia, J.; Kamaleson, C.; Lerer, L. Biostimulation with Phycocyanin-Rich Spirulina Extract in Hydroponic Vertical Farming. Sci. Hortic. 2022, 299, 111042. [Google Scholar] [CrossRef]
- Braun, J.C.A.; Colla, L.M. Use of Microalgae for the Development of Biofertilizers and Biostimulants. Bioenergy Res. 2023, 16, 289–310. [Google Scholar] [CrossRef]
- Brião, V.B.; Sbeghen, A.L.; Colla, L.M.; Castoldi, V.; Seguenka, B.; Schimidt, G.d.O.; Costa, J.A.V. Is Downstream Ultrafiltration Enough for Production of Food-Grade Phycocyanin from Arthrospira platensis? J. Appl. Phycol. 2020, 32, 1129–1140. [Google Scholar] [CrossRef]
- Righini, H.; Francioso, O.; Di Foggia, M.; Prodi, A.; Quintana, A.M.; Roberti, R. Tomato Seed Biopriming with Water Extracts from Anabaena minutissima, Ecklonia maxima and Jania adhaerens as a New Agro-Ecological Option against Rhizoctonia solani. Sci. Hortic. 2021, 281, 109921. [Google Scholar] [CrossRef]
- Toribio, A.J.; Jurado, M.M.; Suárez-Estrella, F.; López-González, J.A.; Martínez-Gallardo, M.R.; López, M.J. Application of Sonicated Extracts of Cyanobacteria and Microalgae for the Mitigation of Bacterial Canker in Tomato Seedlings. J. Appl. Phycol. 2021, 33, 3817–3829. [Google Scholar] [CrossRef]
- Attia, M.S.; Elsayed, S.M.; Abdelaziz, A.M.; Ali, M.M. Potential Impacts of Ascophyllum nodosum, Arthrospira platensis Extracts and Calcium Phosphite as Therapeutic Nutrients for Enhancing Immune Response in Pepper Plant against Fusarium Wilt Disease. Biomass Convers. Biorefin. 2023, 14, 19613–19622. [Google Scholar] [CrossRef]
- Yadav, D.R.; Adhikari, M.; Kim, S.W.; Kim, H.S.; Lee, Y.S. Suppression of Fusarium Wilt Caused by Fusarium oxysporum f. sp. Lactucae and Growth Promotion on Lettuce Using Bacterial Isolates. J. Microbiol. Biotechnol. 2021, 31, 1241–1255. [Google Scholar] [CrossRef]
- Sela Saldinger, S.; Rodov, V.; Kenigsbuch, D.; Bar-Tal, A. Hydroponic Agriculture and Microbial Safety of Vegetables: Promises, Challenges, and Solutions. Horticulturae 2023, 9, 51. [Google Scholar] [CrossRef]
- Hultberg, M.; Holmkvist, A.; Alsanius, B. Strategies for Administration of Biosurfactant-Producing Pseudomonads for Biocontrol in Closed Hydroponic Systems. Crop Prot. 2011, 30, 995–999. [Google Scholar] [CrossRef]
- Aiello, D.; Fiorenza, A.; Leonardi, G.R.; Vitale, A.; Polizzi, G. Fusarium nirenbergiae (Fusarium oxysporum Species Complex) Causing the Wilting of Passion Fruit in Italy. Plants 2021, 10, 2011. [Google Scholar] [CrossRef]
- Mirghasempour, S.A.; Studholme, D.J.; Chen, W.; Cui, D.; Mao, B. Identification and Characterization of Fusarium nirenbergiae Associated with Saffron Corm Rot Disease. Plant Dis. 2022, 106, 486–495. [Google Scholar] [CrossRef] [PubMed]
- Jumpathong, W.; Intra, B.; Euanorasetr, J.; Wanapaisan, P. Biosurfactant-Producing Bacillus velezensis PW192 as an Anti-Fungal Biocontrol Agent against Colletotrichum gloeosporioides and Colletotrichum musae. Microorganisms 2022, 10, 1017. [Google Scholar] [CrossRef] [PubMed]
- Shonde, A.T.; Adekunle, A.A.; Samuel, T.O.; Adeogun, O.O.; Ebabhi, A.M.; Kanife, U.C. Isolation, Identification and Effect of Fungi from Rhizosphere of Diseased Amaranthus hybridus L., Solanum lycopersicum L., Lactuca sativa L. and Allium fistulosum L. Vegetable Crops in Selected Farms in Lagos State, Nigeria. J. Appl. Sci. Environ. Manag. 2023, 27, 989–994. [Google Scholar] [CrossRef]
- Dutta, S.; Basu, A.; Maji, P.K. New Anthracnose Disease Caused by Colletotrichum orchidearum on Cattleya sp. Orchid in India. Braz. J. Dev. 2024, 10, e67401. [Google Scholar] [CrossRef]
- Muniz, P.H.P.C.; Marques, M.G.; Peixoto, G.H.S.; Simão, K.G.; Carvalho, D.D.C. Morphological characterization of Alternaria alternata associated on iceberg lettuce seeds cv. “Astra”. Rev. Agric. Neotrop. 2018, 5, 82–86. Available online: https://www.cabidigitallibrary.org/doi/full/10.5555/20193512866 (accessed on 10 July 2025). [CrossRef]
- Töfoli, J.G.; Domingues, R.J.; Ferrari, J.T. Alternaria spp. Em Oleráceas: Sintomas, Etiologia, Manejo e Fungicidas. O Biológico 2015, 77, 21–34. [Google Scholar]
- Faresin, L.d.S.; Devos, R.J.B.; Reinehr, C.O.; Colla, L.M. Development of Ice Cream with Reduction of Sugar and Fat by the Addition of Inulin, Spirulina platensis or Phycocyanin. Int. J. Gastron. Food Sci. 2022, 27, 100445. [Google Scholar] [CrossRef]
- Guarienti, C.; Bender, L.E.; Frota, E.G.; Bertolin, T.E.; Costa, J.A.V.; dos S. Richards, N.S.P. Effects of Microencapsulation on the Preservation of Thermal Stability and Antioxidant Properties of Spirulina. J. Food Meas. Charact. 2021, 15, 5657–5668. [Google Scholar] [CrossRef]
- Dranseikienė, D.; Balčiūnaitė-Murzienė, G.; Karosienė, J.; Morudov, D.; Juodžiukynienė, N.; Hudz, N.; Gerbutavičienė, R.J.; Savickienė, N. Cyano-Phycocyanin: Mechanisms of Action on Human Skin and Future Perspectives in Medicine. Plants 2022, 11, 1249. [Google Scholar] [CrossRef]
- Tavakoli, S.; Hong, H.; Wang, K.; Yang, Q.; Gahruie, H.H.; Zhuang, S.; Li, Y.; Liang, Y.; Tan, Y.; Luo, Y. Ultrasonic-Assisted Food-Grade Solvent Extraction of High-Value Added Compounds from Microalgae Spirulina platensis and Evaluation of Their Antioxidant and Antibacterial Properties. Algal Res. 2021, 60, 102493. [Google Scholar] [CrossRef]
- Chen, C.-Y.; Kao, P.-C.; Tan, C.H.; Show, P.L.; Cheah, W.Y.; Lee, W.-L.; Ling, T.C.; Chang, J.-S. Using an Innovative PH-Stat CO2 Feeding Strategy to Enhance Cell Growth and C-Phycocyanin Production from Spirulina platensis. Biochem. Eng. J. 2016, 112, 78–85. [Google Scholar] [CrossRef]
- Martí-Quijal, F.J.; Ramon-Mascarell, F.; Pallarés, N.; Ferrer, E.; Berrada, H.; Phimolsiripol, Y.; Barba, F.J. Extraction of Antioxidant Compounds and Pigments from Spirulina (Arthrospira platensis) Assisted by Pulsed Electric Fields and the Binary Mixture of Organic Solvents and Water. Appl. Sci. 2021, 11, 7629. [Google Scholar] [CrossRef]
- Rempel, A.; de Souza Sossella, F.; Margarites, A.C.; Astolfi, A.L.; Steinmetz, R.L.R.; Kunz, A.; Treichel, H.; Colla, L.M. Bioethanol from Spirulina platensis Biomass and the Use of Residuals to Produce Biomethane: An Energy Efficient Approach. Bioresour. Technol. 2019, 288, 121588. [Google Scholar] [CrossRef]
- Lupatini, A.L.; de Oliveira Bispo, L.; Colla, L.M.; Costa, J.A.V.; Canan, C.; Colla, E. Protein and Carbohydrate Extraction from S. platensis Biomass by Ultrasound and Mechanical Agitation. Food Res. Int. 2017, 99, 1028–1035. [Google Scholar] [CrossRef]
- Le, D.; Tran, L.T.M.; Cao, L.T.; Pham, T.N.; Dinh, A.Q.; Nguyen, U.K. Diversity and Pathogenicity of Fungal Species Associated with Lettuce Wilt and Root Rot in Vietnam. J. Plant Pathol. 2024, 107, 351–363. [Google Scholar] [CrossRef]
- Barnett, H.L.; Hunter, B.B. Illustrated Genera of Imperfect Fungi, 4th ed.; American Phytopathological Society (APS Press): St. Paul, MN, USA, 1998; Available online: https://l1nk.dev/Ddh6B (accessed on 10 July 2025).
- Leslie, J.F.; Summerell, B.A. The Fusarium Laboratory Manual; John Wiley& Sons: Hoboken, NJ, USA, 2008. [Google Scholar]
- de Hoog, G.S.; van den Ende, A.H.G.G. Molecular Diagnostics of Clinical Strains of Filamentous Basidiomycetes. Mycoses 1998, 41, 183–189. [Google Scholar] [CrossRef]
- Vilgalys, R.; Hester, M. Rapid Genetic Identification and Mapping of Enzymatically Amplified Ribosomal DNA from Several Cryptococcus Species. J. Bacteriol. 1990, 172, 4238–4246. [Google Scholar] [CrossRef]
- Carbone, I.; Kohn, L.M. A Method for Designing Primer Sets for Speciation Studies in Filamentous Ascomycetes. Mycologia 1999, 91, 553–556. [Google Scholar] [CrossRef]
- O’Donnell, K.; Sarver, B.A.J.; Brandt, M.; Chang, D.C.; Noble-Wang, J.; Park, B.J.; Sutton, D.A.; Benjamin, L.; Lindsley, M.; Padhye, A.; et al. Phylogenetic Diversity and Microsphere Array-Based Genotyping of Human Pathogenic Fusaria, Including Isolates from the Multistate Contact Lens-Associated U.S. Keratitis Outbreaks of 2005 and 2006. J. Clin. Microbiol. 2007, 45, 2235–2248. [Google Scholar] [CrossRef]
- Kumar, S.; Stecher, G.; Li, M.; Knyaz, C.; Tamura, K. MEGA X: Molecular Evolutionary Genetics Analysis across Computing Platforms. Mol. Biol. Evol. 2018, 35, 1547–1549. [Google Scholar] [CrossRef] [PubMed]
- Lowry, O.H.; Rosebrough, N.J.; Farr, A.L.; Randall, R.J. Protein Measurement with the Folin Phenol Reagent. J. Biol. Chem. 1951, 193, 265–275. [Google Scholar] [CrossRef] [PubMed]
- DuBois, M.; Gilles, K.A.; Hamilton, J.K.; Rebers, P.; Smith, F. Colorimetric Method for Determination of Sugars and Related Substances. Anal. Chem. 1956, 28, 350–356. [Google Scholar] [CrossRef]
- Silveira, S.T.; Burkert, J.F.M.; Costa, J.A.V.; Burkert, C.A.V.; Kalil, S.J. Optimization of Phycocyanin Extraction from Spirulina platensis Using Factorial Design. Bioresour. Technol. 2007, 98, 1629–1634. [Google Scholar] [CrossRef]
- Bennett, A.; Bogorad, L. Complementary Chromatic Adaptation in a Filamentous Blue-Green Alga. J. Cell Biol. 1973, 58, 419–435. [Google Scholar] [CrossRef]
- Colla, L.M.; Furlong, E.B.; Costa, J.A.V. Antioxidant Properties of Spirulina (Arthospira) platensis Cultivated under Different Temperatures and Nitrogen Regimes. Braz. Arch. Biol. Technol. 2007, 50, 161–167. [Google Scholar] [CrossRef]
- Correia, R.T.P.; McCue, P.; Magalhães, M.M.A.; Macêdo, G.R.; Shetty, K. Production of Phenolic Antioxidants by the Solid-State Bioconversion of Pineapple Waste Mixed with Soy Flour Using Rhizopus oligosporus. Process Biochem. 2004, 39, 2167–2172. [Google Scholar] [CrossRef]
- Sousa, B.A.; Correia, R.T.P. Phenolic Content, Antioxidant Activity and Antiamylolytic Activity of Extracts Obtained from Bioprocessed Pineapple and Guava Wastes. Braz. J. Chem. Eng. 2012, 29, 25–30. [Google Scholar] [CrossRef]
- Tortelli, B.; Cappellaro, S.; de Macedo Nava, F.F.; Tonial, F.; Huzar-Novakowiski, J.; Milanesi, P.M.; Chiomento, J.L.T. Bioactivity of an Extract from the Endophyte Diaporthe infecunda on Soybean Seeds Inoculated with Colletotrichum truncatum and Sclerotinia sclerotiorum. Eur. J. Plant Pathol. 2023, 166, 509–520. [Google Scholar] [CrossRef]
- Quiroga, E.N.; Sampietro, A.R.; Vattuone, M.A. Screening Antifungal Activities of Selected Medicinal Plants. J. Ethnopharmacol. 2001, 74, 89–96. [Google Scholar] [CrossRef]
- Ferreira, E.B.; Cavalcanti, P.P.; Nogueira, D.A. ExpDes.Pt: Pacote Experimental Designs (Portugues) 2021. Available online: https://cran.r-project.org/package=ExpDes.pt (accessed on 10 July 2025).
- Cho, H.S.; Kim, B.R.; Yu, S.H. Taxonomic Studies on Alternaria in Korea. Mycobiology 2001, 29, 27–42. [Google Scholar] [CrossRef][Green Version]
- Simmons, E.G. Alternaria Taxonomy: Current Status, Viewpoint, Challenge. In Alternaria Biology, Plant Diseases and Metabolites; Elsevier Science Publishers: Amsterdam, The Netherlands, 1992; pp. 1–35. Available online: https://l1nq.com/aEY0V (accessed on 10 July 2025).
- Lestari, A.; Henri, H.; Sari, E.; Wahyuni, T. Microscopic Characterization of Fusarium sp. Associated with Yellow Disease of Pepper (Piper Nigrum L.) in South Bangka Regency. PLANTA Trop. J. Agrosains (J. Agro Sci.) 2021, 9, 1–9. [Google Scholar] [CrossRef]
- Summerell, B.A.; Salleh, B.; Leslie, J.F. A Utilitarian Approach to Fusarium Identification. Plant Dis. 2003, 87, 117–128. [Google Scholar] [CrossRef] [PubMed]
- Sarada, R.; Pillai, M.G.; Ravishankar, G.A. Phycocyanin from Spirulina platensis: Influence of Processing of Biomass on Phycocyanin Yield, Analysis of Efficacy of Extraction Methods and Stability Studies on Phycocyanin. Process Biochem. 1999, 34, 795–801. [Google Scholar] [CrossRef]
- Schmid, B.; Coelho, L.; Schulze, P.S.C.; Pereira, H.; Santos, T.; Maia, I.B.; Reis, M.; Varela, J. Antifungal Properties of Aqueous Microalgal Extracts. Bioresour. Technol. Rep. 2022, 18, 101096. [Google Scholar] [CrossRef]
- Damm, U.; Sato, T.; Alizadeh, A.; Groenewald, J.Z.; Crous, P.W. The Colletotrichum dracaenophilum, C. magnum and C. orchidearum Species Complexes. Stud. Mycol. 2019, 92, 1–46. [Google Scholar] [CrossRef]
- Lee, S.-H.; Lee, J.E.; Kim, Y.; Lee, S.-Y. The Production of High Purity Phycocyanin by Spirulina platensis Using Light-Emitting Diodes Based Two-Stage Cultivation. Appl. Biochem. Biotechnol. 2016, 178, 382–395. [Google Scholar] [CrossRef]
- Alara, O.R.; Abdurahman, N.H.; Ukaegbu, C.I. Extraction of Phenolic Compounds: A Review. Curr. Res. Food Sci. 2021, 4, 200–214. [Google Scholar] [CrossRef]
- Tran, L.-D.; Kuhnholz, J.; Siebecke, V.; Noke, A. Augmentation of the Stability of Phycocyanin from Arthrospira maxima (Spirulina) by the Addition of Food Preservatives and Influence of PH on Extracts Obtained with Different Extraction Procedures. J. Appl. Phycol. 2025, 37, 1933–1949. [Google Scholar] [CrossRef]
- Pradana, Y.S.; Nugraha, B.A.; Sari, W.; Sadewo, B.R.; Dewayanto, N. Application of Low-Dose UV-C for Microalgae Spirulina platensis Sterilization. In AIP Conference Proceedings; AIP Publishing: Yogyakarta, Indonesia, 2023. [Google Scholar] [CrossRef]
- Scaglioni, P.T.; Pagnussatt, F.A.; Lemos, A.C.; Nicolli, C.P.; Del Ponte, E.M.; Badiale-Furlong, E. Nannochloropsis sp. and Spirulina platensis as a Source of Antifungal Compounds to Mitigate Contamination by Fusarium graminearum Species Complex. Curr. Microbiol. 2019, 76, 930–938. [Google Scholar] [CrossRef]
- Rajamanickam, K.; Sudha, S.S.; Francis, M.; Sowmya, T.; Rengaramanujam, J.; Sivalingam, P.; Prabakar, K. Microalgae Associated Brevundimonas sp. MSK 4 as the Nano Particle Synthesizing Unit to Produce Antimicrobial Silver Nanoparticles. Spectrochim. Acta A Mol. Biomol. Spectrosc. 2013, 113, 10–14. [Google Scholar] [CrossRef]
- Sacramento, R.V.; Deegan, K.R.; Vitória, M.K.M.; Barbosa, C.d.J.; Lima, S.T.d.C. Antifungal Potential of Eukaryotic Microalgae against the Fungus Colletotrichum gloeosporioides. Res. Soc. Dev. 2025, 14, e6814148071. [Google Scholar] [CrossRef]
Disclaimer/Publisher’s Note: The statements, opinions and data contained in all publications are solely those of the individual author(s) and contributor(s) and not of MDPI and/or the editor(s). MDPI and/or the editor(s) disclaim responsibility for any injury to people or property resulting from any ideas, methods, instructions or products referred to in the content. |
© 2025 by the authors. Licensee MDPI, Basel, Switzerland. This article is an open access article distributed under the terms and conditions of the Creative Commons Attribution (CC BY) license (https://creativecommons.org/licenses/by/4.0/).