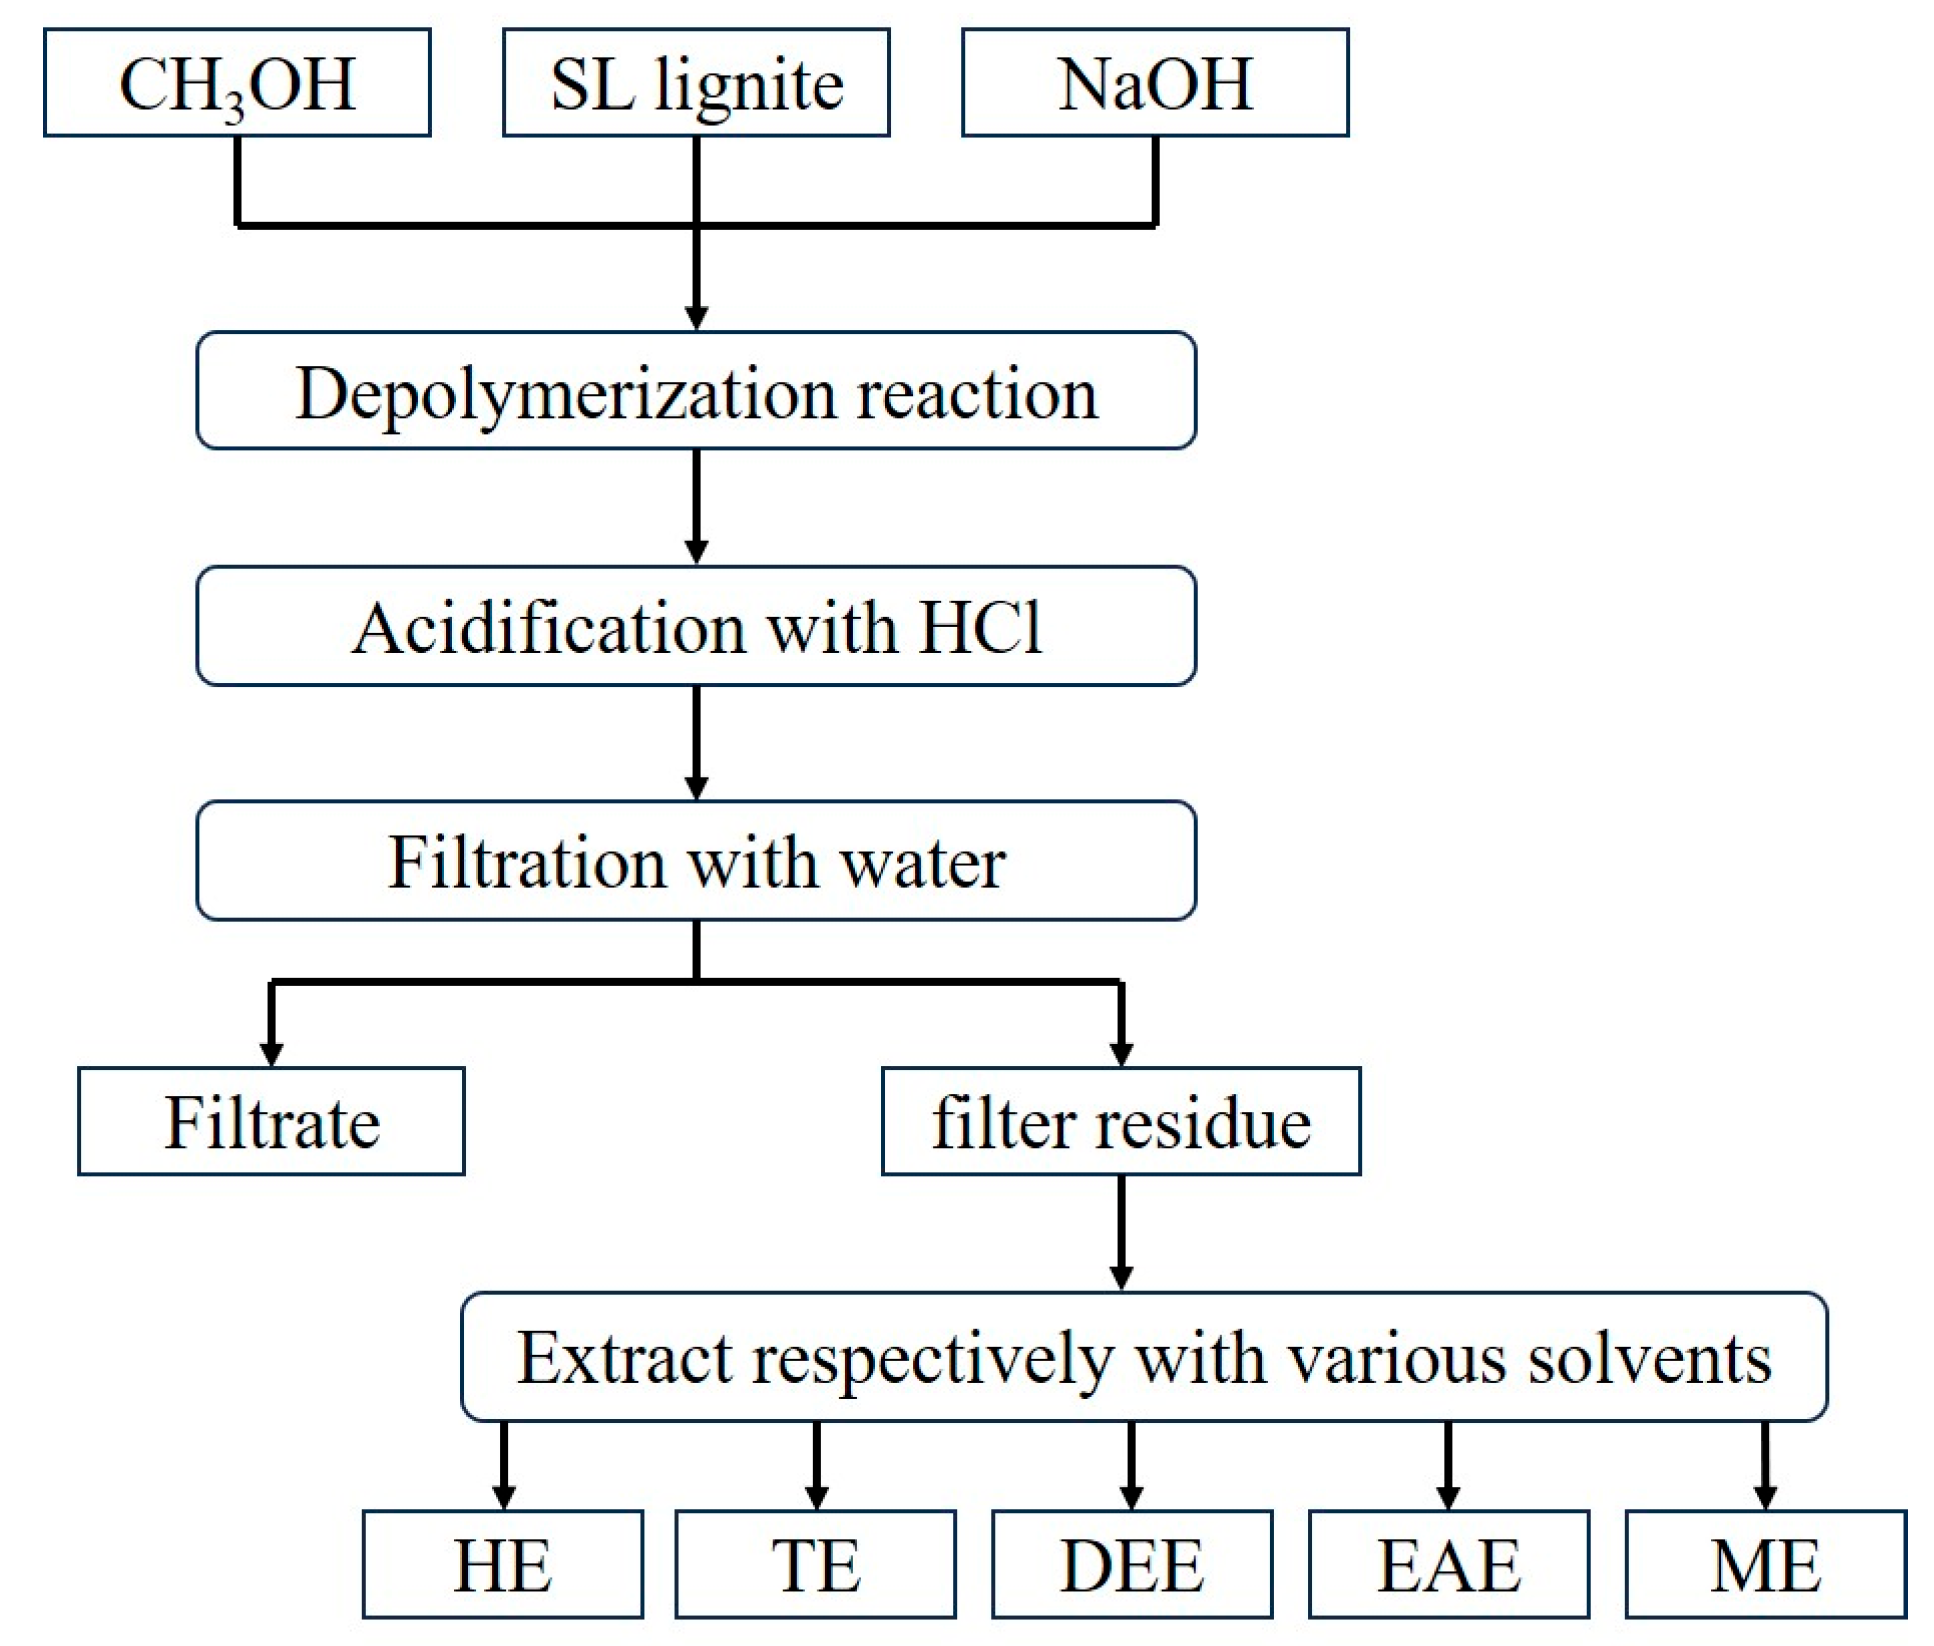
3.1. Extraction Yields of HPCD
Figure 3 shows the yields of HPCD extracts obtained using various solvents. The solvents differ markedly in structure and properties:
n-hexane is an alkane, toluene is an aromatic hydrocarbon, and diethyl ether, ethyl acetate, and methanol contain different oxygen-containing functional groups—ether, ester, and hydroxyl, respectively. As shown in
Figure 3, the extraction yields
YHE,
YTE,
YDEE,
YEAE, and
YME are 7.1%, 25.0%, 27.9%, 46.1%, and 60.5%, respectively, and increase with the polarity of the solvent. The higher extraction yields of HPCD in oxygen-containing solvents suggest that HPCD contains a substantial number of polar functional groups, particularly oxygen-containing groups, capable of forming hydrogen bonds. These bonds may be disrupted or released by polar solvents, resulting in increased solubility. The fact that
YTE is more than three times
YHE further suggests that HPCD contains a considerable proportion of aromatic structures and relatively few aliphatic alkyl structures.
To further investigate the relation between extraction yield (
Y) and solvent polarity,
Figure 4 shows the variation in extraction yield with the dipole moment (
μ) of each solvent. The extraction yield increases nearly linearly from 7.4% (
YHE) to 60.5% (
YME) as the
μ value increases from 0 (
n-hexane) to 2.87 (methanol). This linear trend suggests that the extraction yield of HPCD is primarily governed by solvent polarity.
3.2. Elemental Analysis of HPCD Extracts
The elemental compositions of the HPCD extracts are listed in
Table 5. The carbon content (C%) decreases from 79.98% in HE to 70.11% in ME as the solvent polarity increases, indicating that the proportion of heteroatoms in the extracts rises while the proportion of the carbon framework decreases. Since the oxygen content (O%) is substantially higher than that of sulfur (S%) and nitrogen (N%) in all extracts, the polar functional groups present are primarily oxygen-containing. Both the O% and the O/C ratio increase from 8.78% and 0.082 (HE) to 21.15% and 0.226 (ME), respectively, further confirming the enrichment of oxygen-containing functional groups in the extracts as solvent polarity increases.
Table 5 also shows that both H% and the H/C ratio of the extracts decrease with increasing solvent polarity. HE exhibits the highest H% and H/C ratio (9.66% and 1.45, respectively), while ME shows the lowest values (6.39% and 1.09, respectively). These trends suggest that the content of aliphatic structures—characterized by higher H/C ratios—decreases, whereas the aromatic structures—characterized by lower H/C ratios—increase with solvent polarity.
Figure 5 presents the variation in H/C and O/C ratios with extraction yield. The O/C ratio increases from 0.082 (HE) to 0.226 (ME) as the extraction yield increases from 7.1% to 60.5%. Notably, the O/C ratios of DEE, EAE, and ME are considerably higher than those of HE and TE, and the corresponding extraction yields (
YDEE, YEAE, and
YME) are also markedly higher. These results suggest that HPCD contains a considerable number of oxygen-containing functional groups such as ethers, esters, and hydroxyls. According to the “like-dissolves-like” principle, the high extraction yields in polar solvents reflect better solubility of these functional groups. In particular, the highest yield obtained with methanol (
YME) may be attributed to its ability to disrupt existing hydrogen bonds in HPCD and form new hydrogen bonds with polar moieties in the extract. In contrast to the O/C ratio, the H/C ratio decreases from 1.45 (HE) to 1.09 (ME) with increasing extraction yield. This inverse relation suggests that molecules with lower H/C ratios (i.e., more aromaticity) also have higher O/C ratios, indicating that these molecules are rich in oxygen-containing functional groups.
3.3. FTIR Spectra of the Extracts
The FTIR spectra of the extracts are shown in
Figure 6. All extracts exhibit a broad and intense O–H stretching band in the range of 3700–3100 cm
−1, indicative of the presence of hydroxyl groups involved in hydrogen bonding. The peak near 1700 cm
−1 in all extracts corresponds to carbonyl (C=O) stretching vibrations. The absorption bands between 1300 and 1000 cm
−1 are attributed to C–O stretching in phenols, C
ar–O–C
ar linkages, alcohols, and C
ar–O–C
al structures. These features confirm the presence of phenolic, alcoholic, and ether groups, which align with the high oxygen content observed in elemental analysis. The absorption peaks in the range of 3000–2800 cm
−1 correspond to aliphatic C–H stretching vibrations, suggesting the presence of –CH, –CH
2, and –CH
3 groups. The peaks at 1385 and 1450 cm
−1 are assigned to the in-plane bending vibrations of –CH
3 and –CH
2, respectively. These aliphatic groups likely exist as bridge structures between aromatic nuclei or as substituents on aromatic rings. All extracts display aromatic C=C stretching vibrations at 1610 and 1510 cm
−1 as well as aromatic C–H out-of-plane bending vibrations between 900 and 700 cm
−1, indicating the presence of aromatic ring structures in all extracts.
FTIR spectroscopy can be used for the semiquantitative structural evaluation of the HPCD extracts. To gain deeper insights into the structure of these extracts, several relative structural parameters were calculated according to Equations (6)–(9) [
23,
24,
25].
In Equations (6)–(9),
Am−n represents the integrated area between
m and
n cm
−1. The region 3000–2800 cm
−1 includes the aliphatic C–H stretching vibrations, such as CH
2 symmetric stretching (SyCH
2), CH
3 symmetric stretching (SyCH
3), CH asymmetric stretching (AsyCH), CH
2 asymmetric stretching (AsyCH
2), and CH
3 asymmetric stretching (Asy CH
3).
A2920 and
A2950 correspond to the areas under the peaks at 2920 and 2950 cm
−1, attributed to the asymmetric stretching of the CH
2 and CH
3 groups, respectively. These were determined by fitting the FTIR spectra in the 3000–2800 cm
−1 range using Gaussian functions. Similarly,
A1610, associated with aromatic C=C stretching, was obtained by curve fitting in the 1850–1550 cm
−1 region. An example of the fitting process for the DEE extract is shown in
Figure 7. The OH/HC ratio reflects the relative abundance of hydroxyl groups compared to hydrocarbon structures. The parameter
I indicates the relative abundance of aromatic versus aliphatic functional groups. The degree of condensation (DOC) is used to evaluate the size of the aromatic nuclei—higher DOC values imply smaller aromatic nuclei [
26]. The CH
2/CH
3 intensity ratio provides information about the length and branching degree of aliphatic side chains.
Figure 8,
Figure 9,
Figure 10 and
Figure 11 show the variation of OH/HC,
I, DOC, and CH
2/CH
3 as a function of the solvent dipole moment (
μ) and extraction yield.
As shown in
Figure 8a, the OH/HC ratio increases linearly with increasing solvent polarity (
μ). This trend is consistent with the observations in
Figure 6, where the peaks corresponding to O–H, carbonyl, and C–O vibrations become broader and more intense with increasing polarity. This is also in agreement with the O% and O/C ratios presented in
Table 5. These findings suggest that higher-polarity solvents extract more oxygen-containing functional groups from HPCD.
Figure 8b shows that OH/HC also increases linearly with extraction yield, indicating that HPCD is rich in hydroxyl groups. This result implies that HPCD—particularly the ME and EAE fractions—may serve as promising feedstocks for the production of oxygen-containing compounds.
Figure 9a shows that the
I ratio of the extracts increases with increasing solvent polarity (
μ), indicating a relative increase in aromatic structures and a decrease in aliphatic structures as solvent polarity increases. This trend is consistent with the H/C ratios presented in
Table 5. Similarly,
Figure 10a demonstrates that the DOC values of the extracts decrease with increasing
μ, suggesting that the size of the aromatic nuclei increases with solvent polarity. Although it is generally understood that aromatic hydrocarbons are more readily soluble in aromatic rather than polar solvents, this apparent contradiction implies that the extracted species with larger aromatic nuclei also contain more hydroxyl groups. This interpretation is supported by the similar trends observed in the OH/HC ratio (
Figure 8) and the
I ratio (
Figure 9).
Figure 9b and
Figure 10b further support this conclusion, showing that the
I ratio increases and the DOC values decrease with increasing extraction yield. These results indicate that HPCD contains a notable proportion of components with large aromatic systems, particularly in the fractions with higher extraction yields.
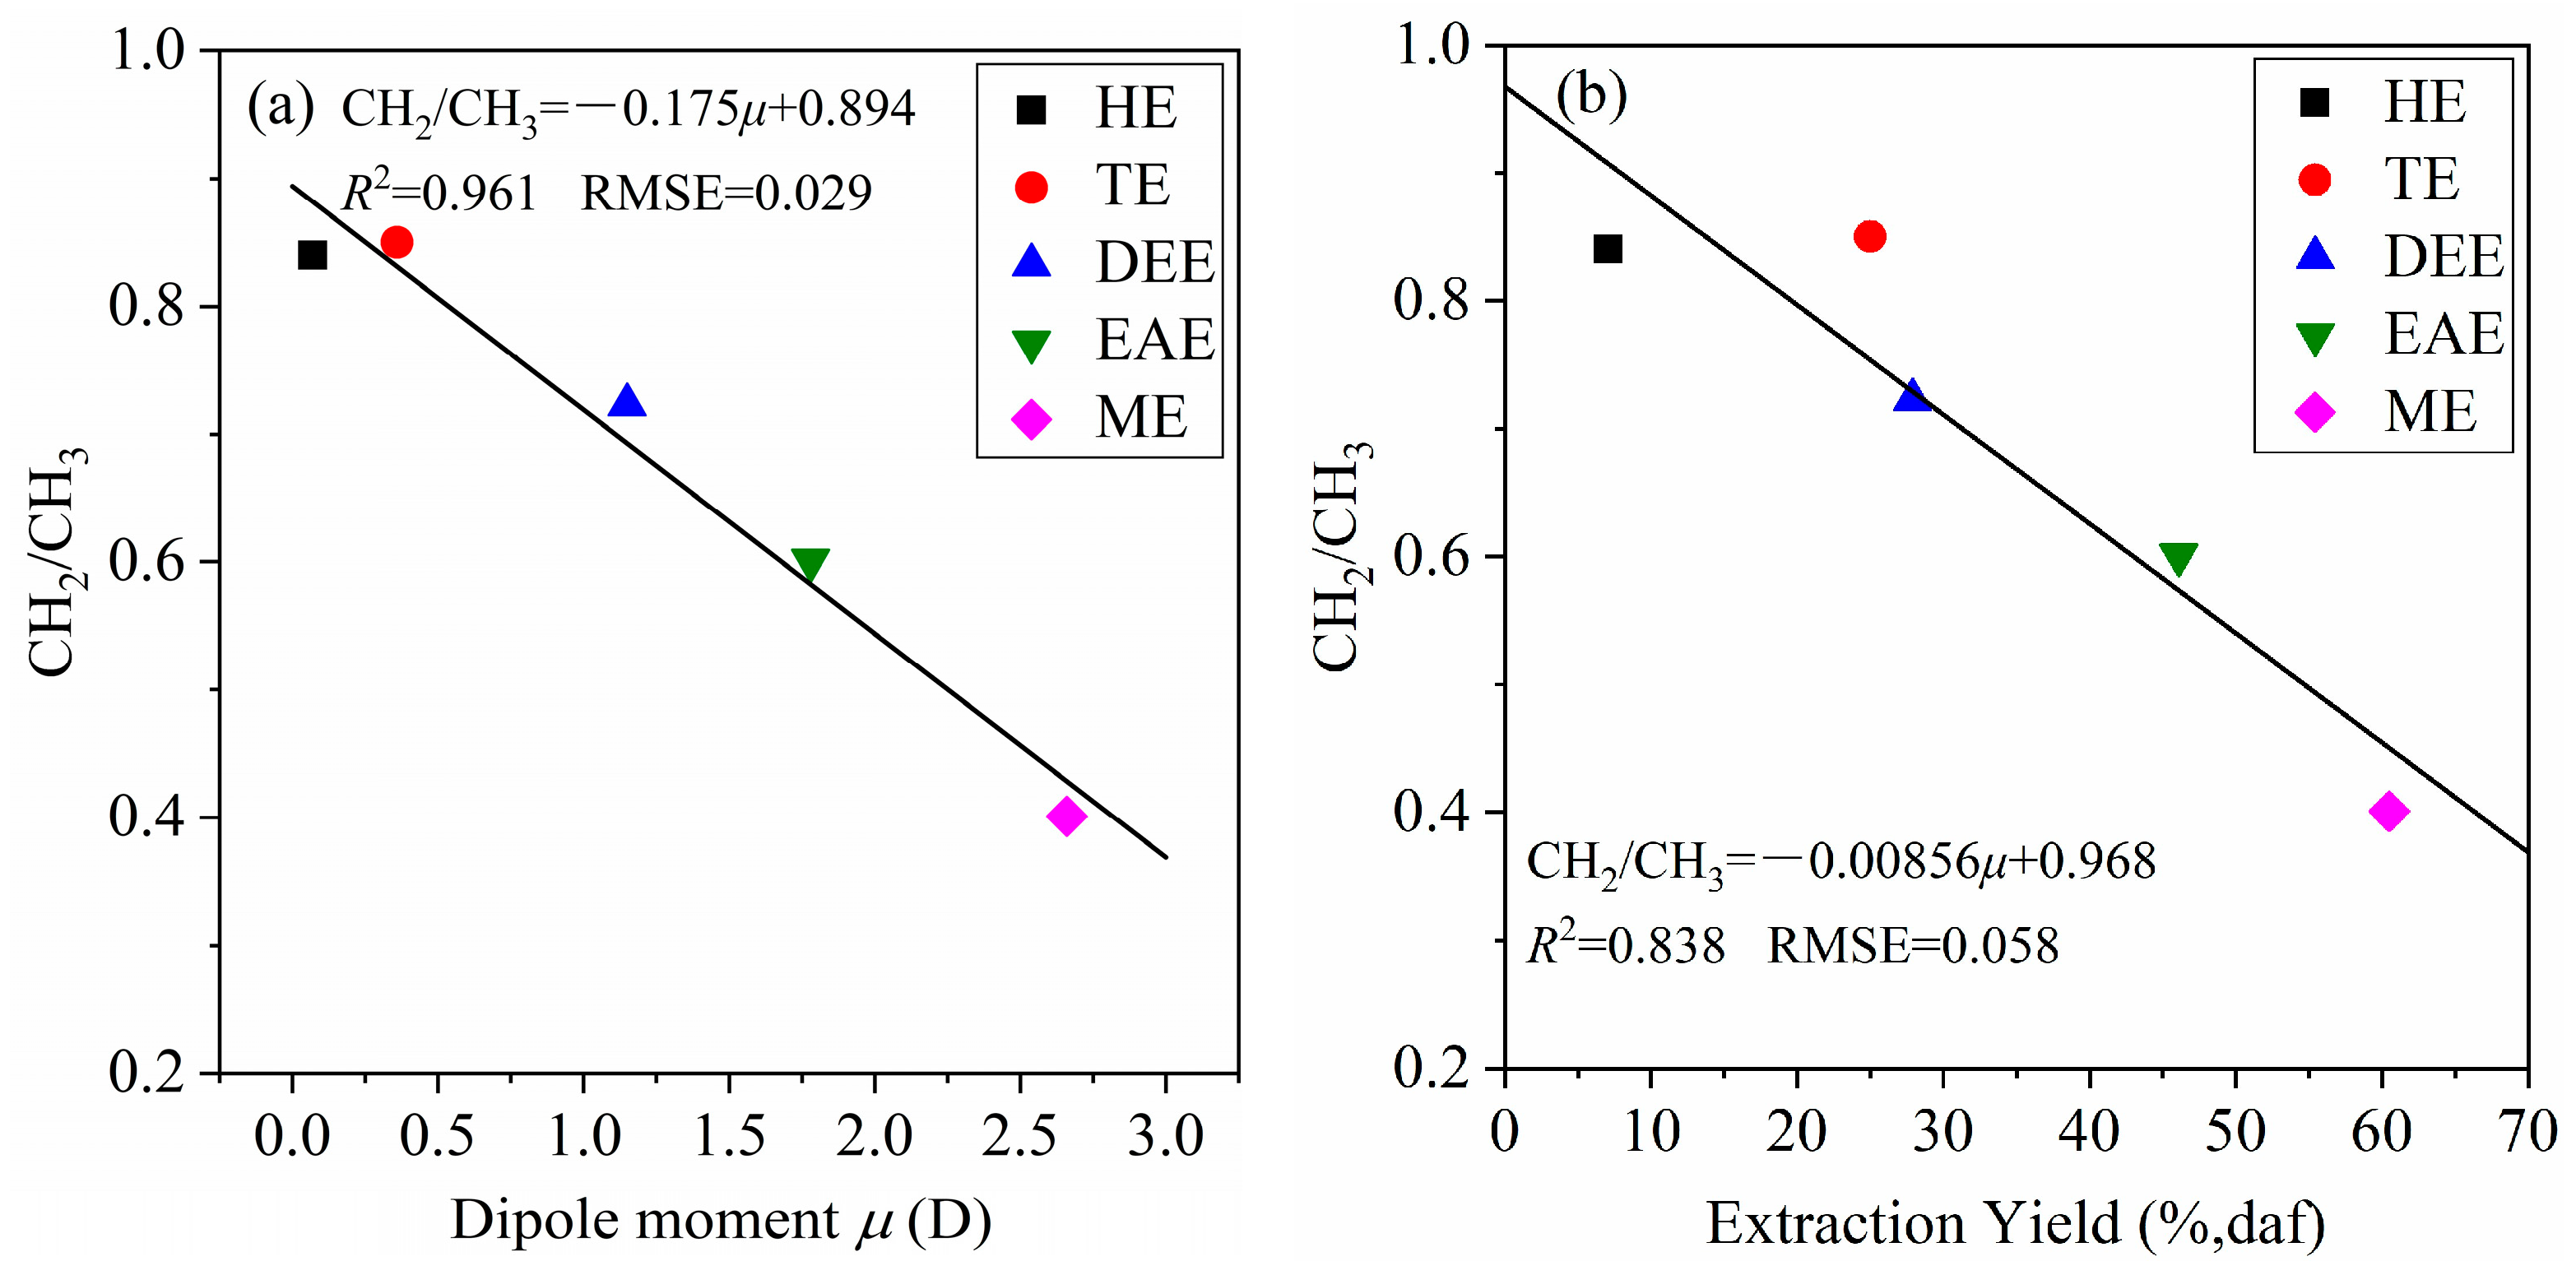
Figure 11a shows that the CH
2/CH
3 ratio of the extracts decreases as solvent polarity (
μ) increases, indicating a shortening of the alkyl chains in the extracts. Likewise,
Figure 11b reveals that the CH
2/CH
3 ratio decreases with increasing extraction yield, suggesting that HPCD contains a larger proportion of components with shorter alkyl side chains. These observations imply that HPCD is less suited for the production of long-chain hydrocarbons such as fuel oils and is more suitable as a feedstock for manufacturing aromatic hydrocarbon–derived chemicals.
3.4. GPC Molecular Weight of the Extracts
Figure 12 presents the GPC curves of the HPCD extracts, and
Table 6 summarizes their number-average molecular weight (
Mn), weight-average molecular weight (
Mw), and polydispersity (
d), calculated from the GPC data. As shown in
Table 6, with the exception of HE, the
Mn and
Mw values of all extracts exceed 500 amu, indicating that the extracts comprise relatively large molecular species. This suggests that the efficient conversion of HPCD into valuable chemicals will require breaking specific covalent bonds within these macromolecular structures. Both
Mn and
Mw increase with solvent polarity, indicating that polar solvents tend to extract larger molecular species from HPCD. Similarly, the polydispersity index (
d) increases with solvent polarity, suggesting that the molecular composition of the extracts becomes increasingly complex as solvent polarity rises. Interestingly, although DEE is more polar than toluene, the
Mw of TE (857 amu) is higher than that of DEE (717 amu). This indicates that TE contains a greater proportion of large molecules as these have a disproportionate influence on
Mw. Among all of the extracts, TE exhibits the highest polydispersity (1.66) and the broadest GPC distribution. As shown in
Figure 12, the lower molecular weight limit of the TE curve is comparable to that of HE, while its upper limit exceeds that of EAE, reflecting a wide range of molecular sizes in TE.
Toluene is commonly used to extract asphaltenes from DCL products. Although asphaltenes are not expected to form under the experimental conditions used here, it is speculated that the TE extract contains both weakly polar HPCD components and native asphaltene-like substances present in the coal [
27]. This dual contribution may account for the unusually high
Mw and the largest
d observed for TE.
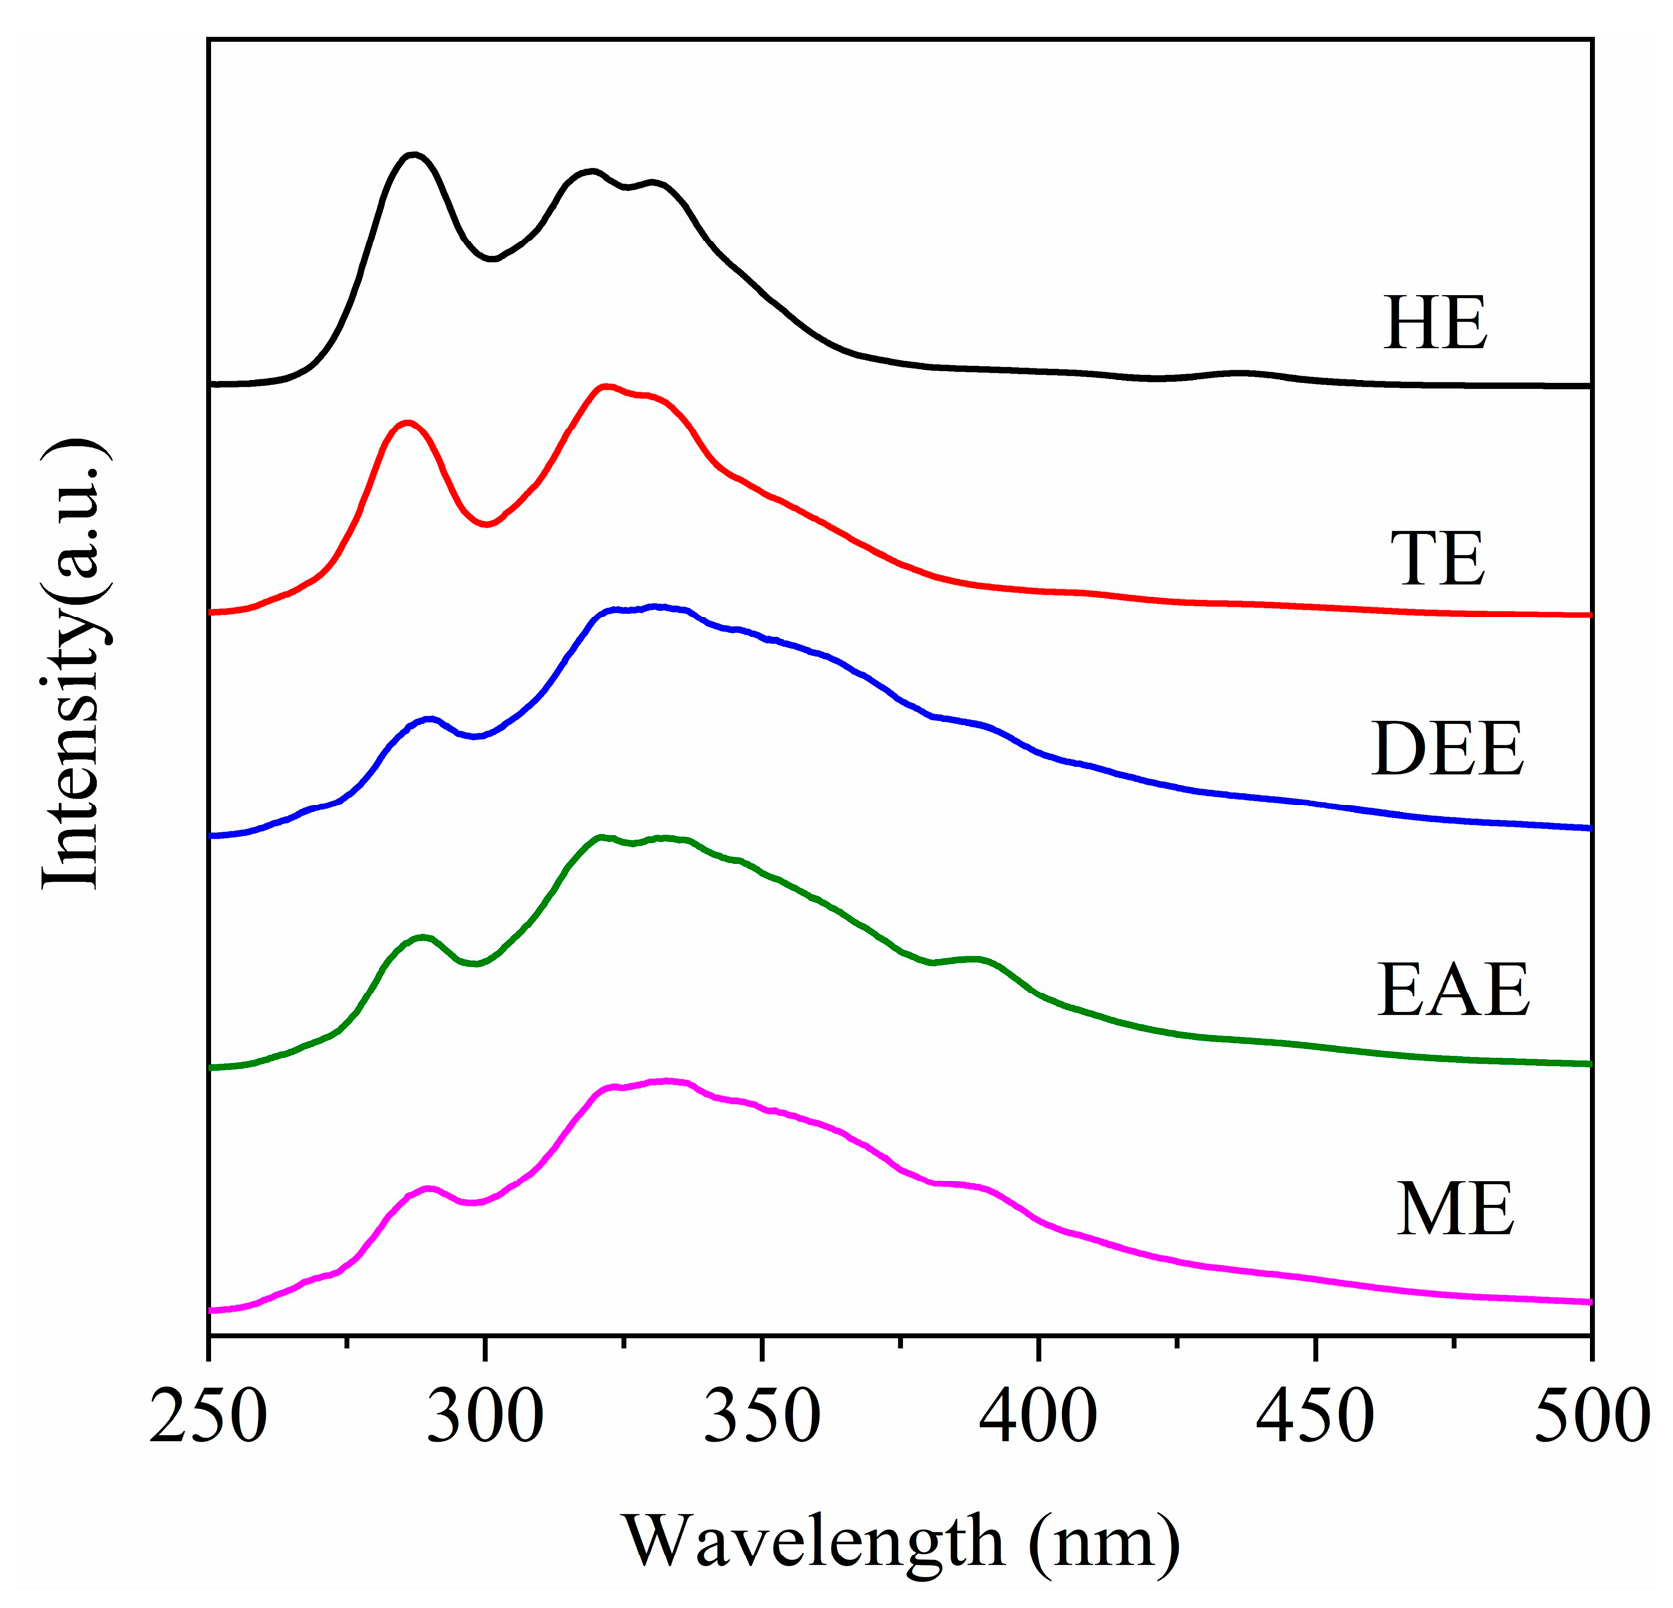
3.5. SF Spectra of the Extracts
Figure 13 shows the SF spectra of the HPCD extracts. SF spectroscopy is a valuable technique for characterizing the size distribution of fused aromatic nuclei in coal derivatives such as heavy oil, asphaltene, and preasphaltene. It is generally accepted that the fluorescence peaks in the ranges of 270–300, 300–340, 340–400, and 400–425 nm correspond to aromatic systems containing one, two, three, and four fused rings, respectively [
22]. As shown in
Figure 13, all extracts display considerable spectral overlap, reflecting the complex molecular composition of these mixtures. The fluorescence intensity is primarily concentrated in the 270–340 nm range. Considering the “redshift” effect of substituents such as alkyl and hydroxyl on the SF spectrum [
28], the extracts mainly comprise one- to three-ring aromatic structures. This distribution is similar to that found in lignite, suggesting that the aromatic cores of SL lignite are largely preserved during the preparation of HPCD. The molecular weights of typical one- to three-ring aromatics such as benzene (78 amu), naphthalene (128 amu), and anthracene (178 amu) are notably lower than the molecular weights reported in
Table 6, implying that the extract molecules are either heavily substituted or comprise multiple aromatic units connected via aliphatic linkages. Therefore, the selective cleavage of these bridge bonds offers a potential pathway for producing valuable aromatic chemicals.
To study the aromatic structure of the extracts in detail, the SF spectra were fitted by peaks, taking HE as an example, and the results are shown in
Figure 14a. The content distribution of the different aromatic nuclei in the extracts is shown in
Figure 14b.
Figure 14b shows that with increasing solvent polarity, the relative content of monocyclic and bicyclic aromatic nuclei in the extracts decrease, while the content of tricyclic and above aromatic nuclei gradually increase. These variations indicate that more polar solvents tend to extract molecules with larger aromatic systems, which is consistent with the DOC trends observed in
Figure 10. In addition, when correlated with the O/C ratios in
Table 5 and the OH/HC ratios in
Figure 8, it is evident that the extracts containing larger aromatic cores also possess more oxygen-containing functional groups, enhancing their solubility in polar solvents. Based on the structural characteristics of the extracts, the high-polarity extracts are suitable for the preparation of oxygen-containing aromatic hydrocarbon derivatives. For example, ME and EAE may be suitable for the preparation of aromatic carboxylic acids through oxidation.


