Article

Photolytic Formation of Polybrominated Dibenzofurans (PBDFs) in Various Simulated Soil-Washing Solutions Containing Polybrominated Diphenyl Ethers (PBDEs)

by
Chenyu Zhang
1,
Xiaodong Du
1,*,
Songhan Zeng
1,
Jinghong Wen
2,
Jielei Luo
2,
Sile Wu
1,
Qian Zhang
1,
Xueqin Tao
2 and
Guining Lu
1,3,*
1
School of Environment and Energy, South China University of Technology, Guangzhou 510006, China
2
College of Resources and Environment, Zhongkai University of Agriculture and Engineering, Guangzhou 510225, China
3
The Key Lab of Pollution Control and Ecosystem Restoration in Industry Clusters, Ministry of Education, South China University of Technology, Guangzhou 510006, China
*
Authors to whom correspondence should be addressed.
Processes 2025, 13(6), 1806; https://doi.org/10.3390/pr13061806
Submission received: 11 May 2025 / Revised: 26 May 2025 / Accepted: 3 June 2025 / Published: 6 June 2025
(This article belongs to the Special Issue Advances in Remediation of Contaminated Sites: 3rd Edition)

Abstract

Soil washing is an efficient method to remove polybrominated diphenyl ethers (PBDEs) from contaminated soils. The obtained solutions from soil-washing still contain PBDEs, requiring further treatment before disposal or reuse. Although photolysis is effective for PBDE degradation in solutions, the concurrent formation of toxic polybrominated dibenzofurans (PBDFs) may limit its practical application. In this study, 2,8-dibromodibenzofurans (2,8-BDF) formation rate and mechanisms during 2,4,4′-tribromodiphenyl ether (BDE-28) photolysis in various simulated soil-washing solutions was investigated. Results revealed significant effects of solubilizers on 2,8-BDF formation. The nonionic surfactants polysorbate (TW80), polyoxyethylene octylphenyl ether (TX series), and the cationic surfactant cetyltrimethylammonium bromide (CTAB) resulted in low 2,8-BDF formation rate (1–5%), while the β-cyclodextrin led to the highest 2,8-BDF formation rate (about 28%). The nonionic surfactants polyoxyethylene dodecyl ethers (Brij series), and the anionic surfactants sodium dodecylbenzene sulfonate (SDBS) and sodium dodecyl sulfate (SDS), also showed a high level of 2,8-BDF formation rate (7–17%). Solubilizer structure and its interaction with BDE-28 determined the 2,8-BDF formation. The role of the micelle microenvironment on 2,8-BDF formation was verified via an experiment and molecular dynamics simulation. The organic region of micelle exhibited high hydrogen donation ability, which inhibited 2,8-BDF formation. The results indicated distinct risks of PBDE photolysis in various soil-washing solutions, providing an important reference for solubilizer selection and the application of photolysis on the treatment of soil-washing solutions containing PBDEs.

1. Introduction

Polybrominated diphenyl ethers (PBDEs) are typical brominated flame retardants used in electronic products (circuit board and plastic enclosure), foam, carpet, textile, construction materials, and vehicles [1]. However, PBDEs have attracted extensive concern for a long time due to their persistent, bio-accumulated and endocrine-disrupting properties [2], which are widely present in contaminated soils from e-waste dismantling sites. Reports indicate that the average concentration of BDE-209 in soil samples from e-waste dismantling areas ranges between 400 and 3000 μg kg−1 [3,4,5,6,7,8,9,10], with concentrations reaching up to 12, 150, and 296.4 mg kg−1 in severely polluted regions [11,12,13], where other PBDE congeners are also present. Therefore, given its severe pollution and harmful effects, the removal of PBDEs from contaminated soils is urgent.
PBDE solubilization via organic substances and the subsequent washing from soil represents a critical pollution remediation technology. Generally, washing serves as an effective method to remove contaminants from soil permanently. Surfactants are frequently employed as washing agents for the removal of organic contaminants from soil [14,15,16,17,18,19]. Surfactants exhibit molecular aggregation characteristics in water due to their dual hydrophilic and lipophilic groups. Upon reaching the critical micelle concentration (CMC), the lipophilic groups self-assemble under hydrophobic forces, forming micelles with hydrophilic chains as the outer layer and lipophilic structure as the core. The micelle tends to bind with hydrophobic organic pollutants, thereby facilitating the transfer of pollutants from soil to micelles and achieving the washing of pollutants from soil [14]. Surfactants can be categorized into cationic, anionic, and nonionic types on the basis of the dissociation properties of their hydrophilic chains. All three classes of surfactants have been utilized in studies concerning the washing of persistent organic pollutants, such as polycyclic aromatic hydrocarbons (PAHs), polychlorinated biphenyls (PCBs), and polybrominated diphenyl ethers (PBDEs), from contaminated soils [14,15,16,20]. For example, Yang et al. conducted solubilization experiments using cationic surfactant cetyltrimethylammonium bromide (CTAB), anionic surfactant sodium dodecylbenzene sulfonate (SDBS), and various nonionic surfactants vtz. polysorbate (TW80) and polyoxyethylene dodecyl ethers (Brij58, Brij78), to elucidate the solubilization mechanisms of PBDEs during washing processes. Their findings demonstrated that surfactants can effectively enhance the solubilization of PBDEs, with nonionic surfactants exhibiting more pronounced effects [20]. However, soil washing technology still encounters challenges regarding the treatment of waste washing solutions, to ensure the ultimate removal of pollutants and the recycling of washing agents [18,21].
Techniques such as photolysis, photocatalysis, zero-valent iron reduction, adsorption, advanced oxidation, and microbial degradation have potentially facilitated pollutant removal and washing agent recovery [18,21,22,23,24,25,26,27,28,29,30,31,32,33,34]. Among these methods, photolysis exhibits high efficiency for PBDE degradation without requiring additional reagents, which makes it a promising approach for treating soil-washing solutions containing PBDEs. Li et al. [29,30] and Huang et al. [31,32] investigated the direct photolysis of PBDEs in surfactant solutions, including CTAB, SDBS, polyoxyethylene octylphenyl ether (TX100), TW80, and polyoxyethylene dodecyl ethers (Brij35, Brij58), achieving rapid PBDE removal. Similar to photolysis in organic solvents, PBDEs undergo stepwise debromination to form low-brominated products. However, the polybrominated dibenzofurans (PBDFs) are also characteristic products of PBDE photolysis, resulting in critical concern due to their high toxicity. It is worth noting that current research lacks quantitative insight into PBDF generation in surfactant solutions, and quantitative data on PBDF formation across surfactant types is limited, which is essential for risk estimation during PBDE photolysis in soil-washing solutions. Previous studies have proved that cyclization of aryl radical (induced from the photo dissociation of ortho C-Br bond of PBDEs) is the origin of PBDFs, while hydrogen abstraction reaction between aryl radical and co-existing organics to form low-brominated PBDEs would inhibit PBDF formation [35,36]. These works found that water can barely provide hydrogen for aryl radicals, and PBDFs were the main products compared with low-brominated PBDEs. Organic solvents were excellent hydrogen donors and resulted in a low PBDF formation rate, which varied accordingly with different molecular structures of solvents. Therefore, it is speculated that the formation of surfactant micelles in water can provide an organic microenvironment similar to an organic solvent for PBDEs, keeping PBDFs at a low level. To fill the research gaps of quantitative analysis and micellar effects on PBDF formation during PBDE photolysis in soil-washing solutions, this study explores the effects of typical surfactants, including cationic surfactant CTAB, anionic surfactants SDBS, and sodium dodecyl sulfate (SDS), and nonionic surfactants viz. polyoxyethylene octylphenyl ethers (TX45, TX100, TX165, TX405), polyoxyethylene dodecyl ethers (Brij30, Brij35), and TW80. Additionally, bio-sourced substances like cyclodextrins exhibit favorable solubilization properties for organic pollutants and have garnered significant attention in recent soil washing studies [37]. Therefore, β-cyclodextrin (β-CD) was also evaluated as a target washing agent in this study. This investigation provides guidance for selecting appropriate solubilizers for PBDE washing from contaminated soils from the perspective of photolysis treatment for soil-washing solutions.

2. Materials and Methods

2.1. Chemicals

PBDEs: A 2,4,4-tribromodiphenyl ether (BDE-28) was used as the target PBDE, which is one of the most frequently detected PBDEs in the environment. As shown in Figure 1, there is one ortho-Br and two para-Br in the BDE-28 structure, and generally, three aryl radical intermediates and four primary debrominated products will form during photolysis. The four products, including 2,8-diBrdibenzofurans (2,8-BDF), a 4,4′-diBrdiphenyl ether (BDE-15), 2,4′-tribromodiphenyl ether (BDE-8), and 2,4-tribromodiphenyl ether (BDE-7), were monitored during BDE-28 photolysis. Among them, both 2,8-BDF and BDE-15 are generated from the BDE-15 radical, through cyclization and hydrogen abstraction reactions, respectively. They are the main target products focused on in this study. PBDEs and PBDFs were purchased from AccuStandard Inc. (New Haven, CT, USA). The internal standard substance PCB-61 was also purchased from AccuStandard Inc. (New Haven, CT, USA).
Solubilizers: All solubilizers in this study were analytical reagents. CTAB, SDBS, Brij35, and β-CD were purchased from Shanghai Aladdin Biochemical Technology Co., Ltd. (Shanghai, China). Brij30, TX45, TX100, TX165 and TX405 were purchased from Sigma-Aldrich Inc. (St. Louis, MO, USA). SDS was purchased from Ararat Biotechnology Co., Ltd. (Guangzhou, China). TW80 was purchased from Chengdu Kelong Chemical Reagent Factory (Chengdu, China). Polyoxyethylene dodecyl ether mixtures (BrijM) were purchased from Shanghai Adamas Reagent Co., Ltd. (Shanghai, China). The structure of the investigated solubilizers is shown in Figure 2.
Other chemicals: Acetonitrile (CH3CN, abbreviated as ACN; HPLC grade) and n-hexane (C6H14; HPLC grade) were purchased from Oceanpak Alexative Chemical., Ltd. (Gothenburg, Sweden). Analytical reagent sodium chloride (NaCl) and calcium chloride (CaCl2) were purchased from Shanghai Macklin Biochemical Technology Co., Ltd. (Shanghai, China).

2.2. Experimental Setup

2.2.1. Preparation of Simulated Soil-Washing Solutions Containing BDE-28

The CMC values for the selected surfactants in this study were derived from existing literature and product specifications, as summarized in Table 1. However, BrijM is a polymer mixture for which no reference CMC value is available; therefore, its experimental concentrations refer to Brij35. During the solubilization of BDE-28, the surfactant concentration was set at twice the CMC (2 CMC), and the β-CD concentration was fixed at 5 mM. Specifically, 2 mL of a 600 mg L−1 BDE-28 n-hexane solution was transferred into a brown glass tube, and the solvent was evaporated under a gentle nitrogen (N2) stream. Subsequently, 50 mL of the target solubilizer solution, prepared at the specified concentration, was added to the tube. The resulting mixture was placed on a shaker and agitated for 72 h at 165 rpm and 25 °C to achieve the solubilization.

2.2.2. Photolysis of BDE-28 in Simulated Soil-Washing Solutions

The quartz tubes (photo-reaction tubes) were annually arranged within the photo-reaction apparatus, where the UV lamp (254 nm, 28 W, irradiation intensity was about 0.46 mW cm−2) was vertically positioned in the quartz cold trap fixed at the center of the apparatus. During the photolysis, 25 °C circulating water was continuously supplied to the cold trap to maintain a stable temperature in the apparatus. Before initiating the photolysis reaction, various BDE-28 solutions were prepared according to the following procedures: (1) Based on the solubilization mentioned above, BDE-28 in all solutions reached near-equilibrium within 72 h. The process was extended to 120 h to ensure sufficient solubilization, and the resulting solution was ready for photolysis. (2) According to the actual solubilization efficiency, a specific volume of 600 mg L−1 BDE-28 n-hexane solution was transferred into a brown glass tube, and the solvent was evaporated under a gentle N2 stream. Subsequently, the surfactant solutions with concentrations of 5 CMC and 10 CMC (β-CD concentrations: 2.5 mM and 10 mM) were added, and the mixture was solubilized for 120 h. The resulting solution was ready for photolysis. (3) Two types of solubilized solutions—TX100 and CTAB—were selected as stock solutions. The photolysis of BDE-28 was conducted under varying solubilizer concentrations at 0.2, 0.5, and 1 CMC. By controlling the volume of the stock solutions, the concentration of BDE-28 was standardized to 60 μg L−1. The pure water with 40 μg L−1 BDE-28 was also prepared (adding 20 μL of 50 mg L−1 BDE-28 ACN solution to 25 mL water). (4) Three solubilizers—TX100, CTAB, and β-CD—were selected at a concentration of 10 CMC, 10 CMC, and 5 mM, respectively. Solubilized solutions were prepared using ACN/H2O mixtures with volume ratios of 10/90, 30/70, and 50/50. (5) Three solubilizers—TX100, CTAB, and SDBS—were selected at a concentration of 10 CMC. Solubilized solutions were prepared with 1, 10, and 100 mM NaCl or CaCl2 (1 and 5 mM CaCl2 for SDBS, due to the fact that precipitation of SDBS occurred when 10 and 100 mM CaCl2 was set). The above-prepared solutions were placed in the photo-reaction apparatus, and the lamp was turned on to initiate the photolysis reaction. Samples were collected and analyzed at predetermined time intervals. Each solution system was tested in duplicate.

2.2.3. Analysis Method

HPLC Test: For the photolysis solutions (1), (2), (4), and (5) as described above, 0.5 mL of each sample was directly analyzed using HPLC (Agilent 1200), which was equipped with a C18 column (5 μm, 250 × 4.6 mm) and a UV detector. The mobile phase consisted of ACN/H2O (V/V = 85/15), with a flow rate of 1 mL min−1 and a detection wavelength of 226 nm.
GC-MS Test: For the photolysis solution (3) described above, the pretreatment of samples was conducted. The photoreaction tube containing 25 mL reaction solution was removed from the photoreactor at a specified time interval, and 5 mL n-hexane was added for extraction. The mixture was shaken in a shaker for 2 h (165 rpm, 25 °C). Subsequently, 3 mL of the extract was taken, and the solvent was evaporated under a gentle nitrogen stream. The 200 μL n-hexane solution containing 0.5 mg L−1 PCB-61 (internal standard) was added for further extraction, and the extract was ready for analysis. Samples were analyzed using Trace GC Ultra gas chromatography coupled with a DSQII mass spectrum equipped with an electron impact ion source (Thermo Fisher Scientific, Inc., Waltham, MA, USA). The DB-5MS quartz capillary column was applied to separate the compounds in the samples. The helium flow rate was 1 mL min−1. The inlet temperature was set at 280 °C. The oven temperature was kept at 60 °C for 1 min, then elevated to 270 °C at a rate of 10 °C/min, finally elevated to 290 °C at a rate of 25 °C min−1, and maintained for 3 min. The ion source temperature was set at 280 °C, and the selected ion monitoring (SIM) mode was used to quantify the target compounds. The recovery of target compounds during the pretreatment of solution (3) was investigated. The absolute recovery for BDE-15, 2,8-BDF, and BDE-28 across all surfactant solutions was 102.5% ± 5.0% (92.9–108.5%), 104.9% ± 8.7% (86.3–116.3%), and 100.6% ± 6.1% (90.9–109.3%), respectively. The recovery of 2,8-BDF and BDE-28 relative to BDE-15 was 102.3% ± 5.1% (90.3–107.5%) and 98.2% ± 2.2% (94.8–101.3%), respectively. These recovery rates indicate that the pretreatment method effectively extracted the target compounds from the surfactant solutions. The near-100% recovery of 2,8-BDF and BDE-28 relative to BDE-15 suggests similar hydrophobic properties, implying no correction is necessary when calculating parameters according to Equations (3)–(6) mentioned in Section 2.4.
Dynamic light scattering (Nano-ZS90) was applied to monitor the diameter distribution and zeta potential of surfactant micelles. For every sample, the data acquisition was conducted 30 times for the diameter distribution and 6 times for the zeta potential, and the average results were finally obtained.

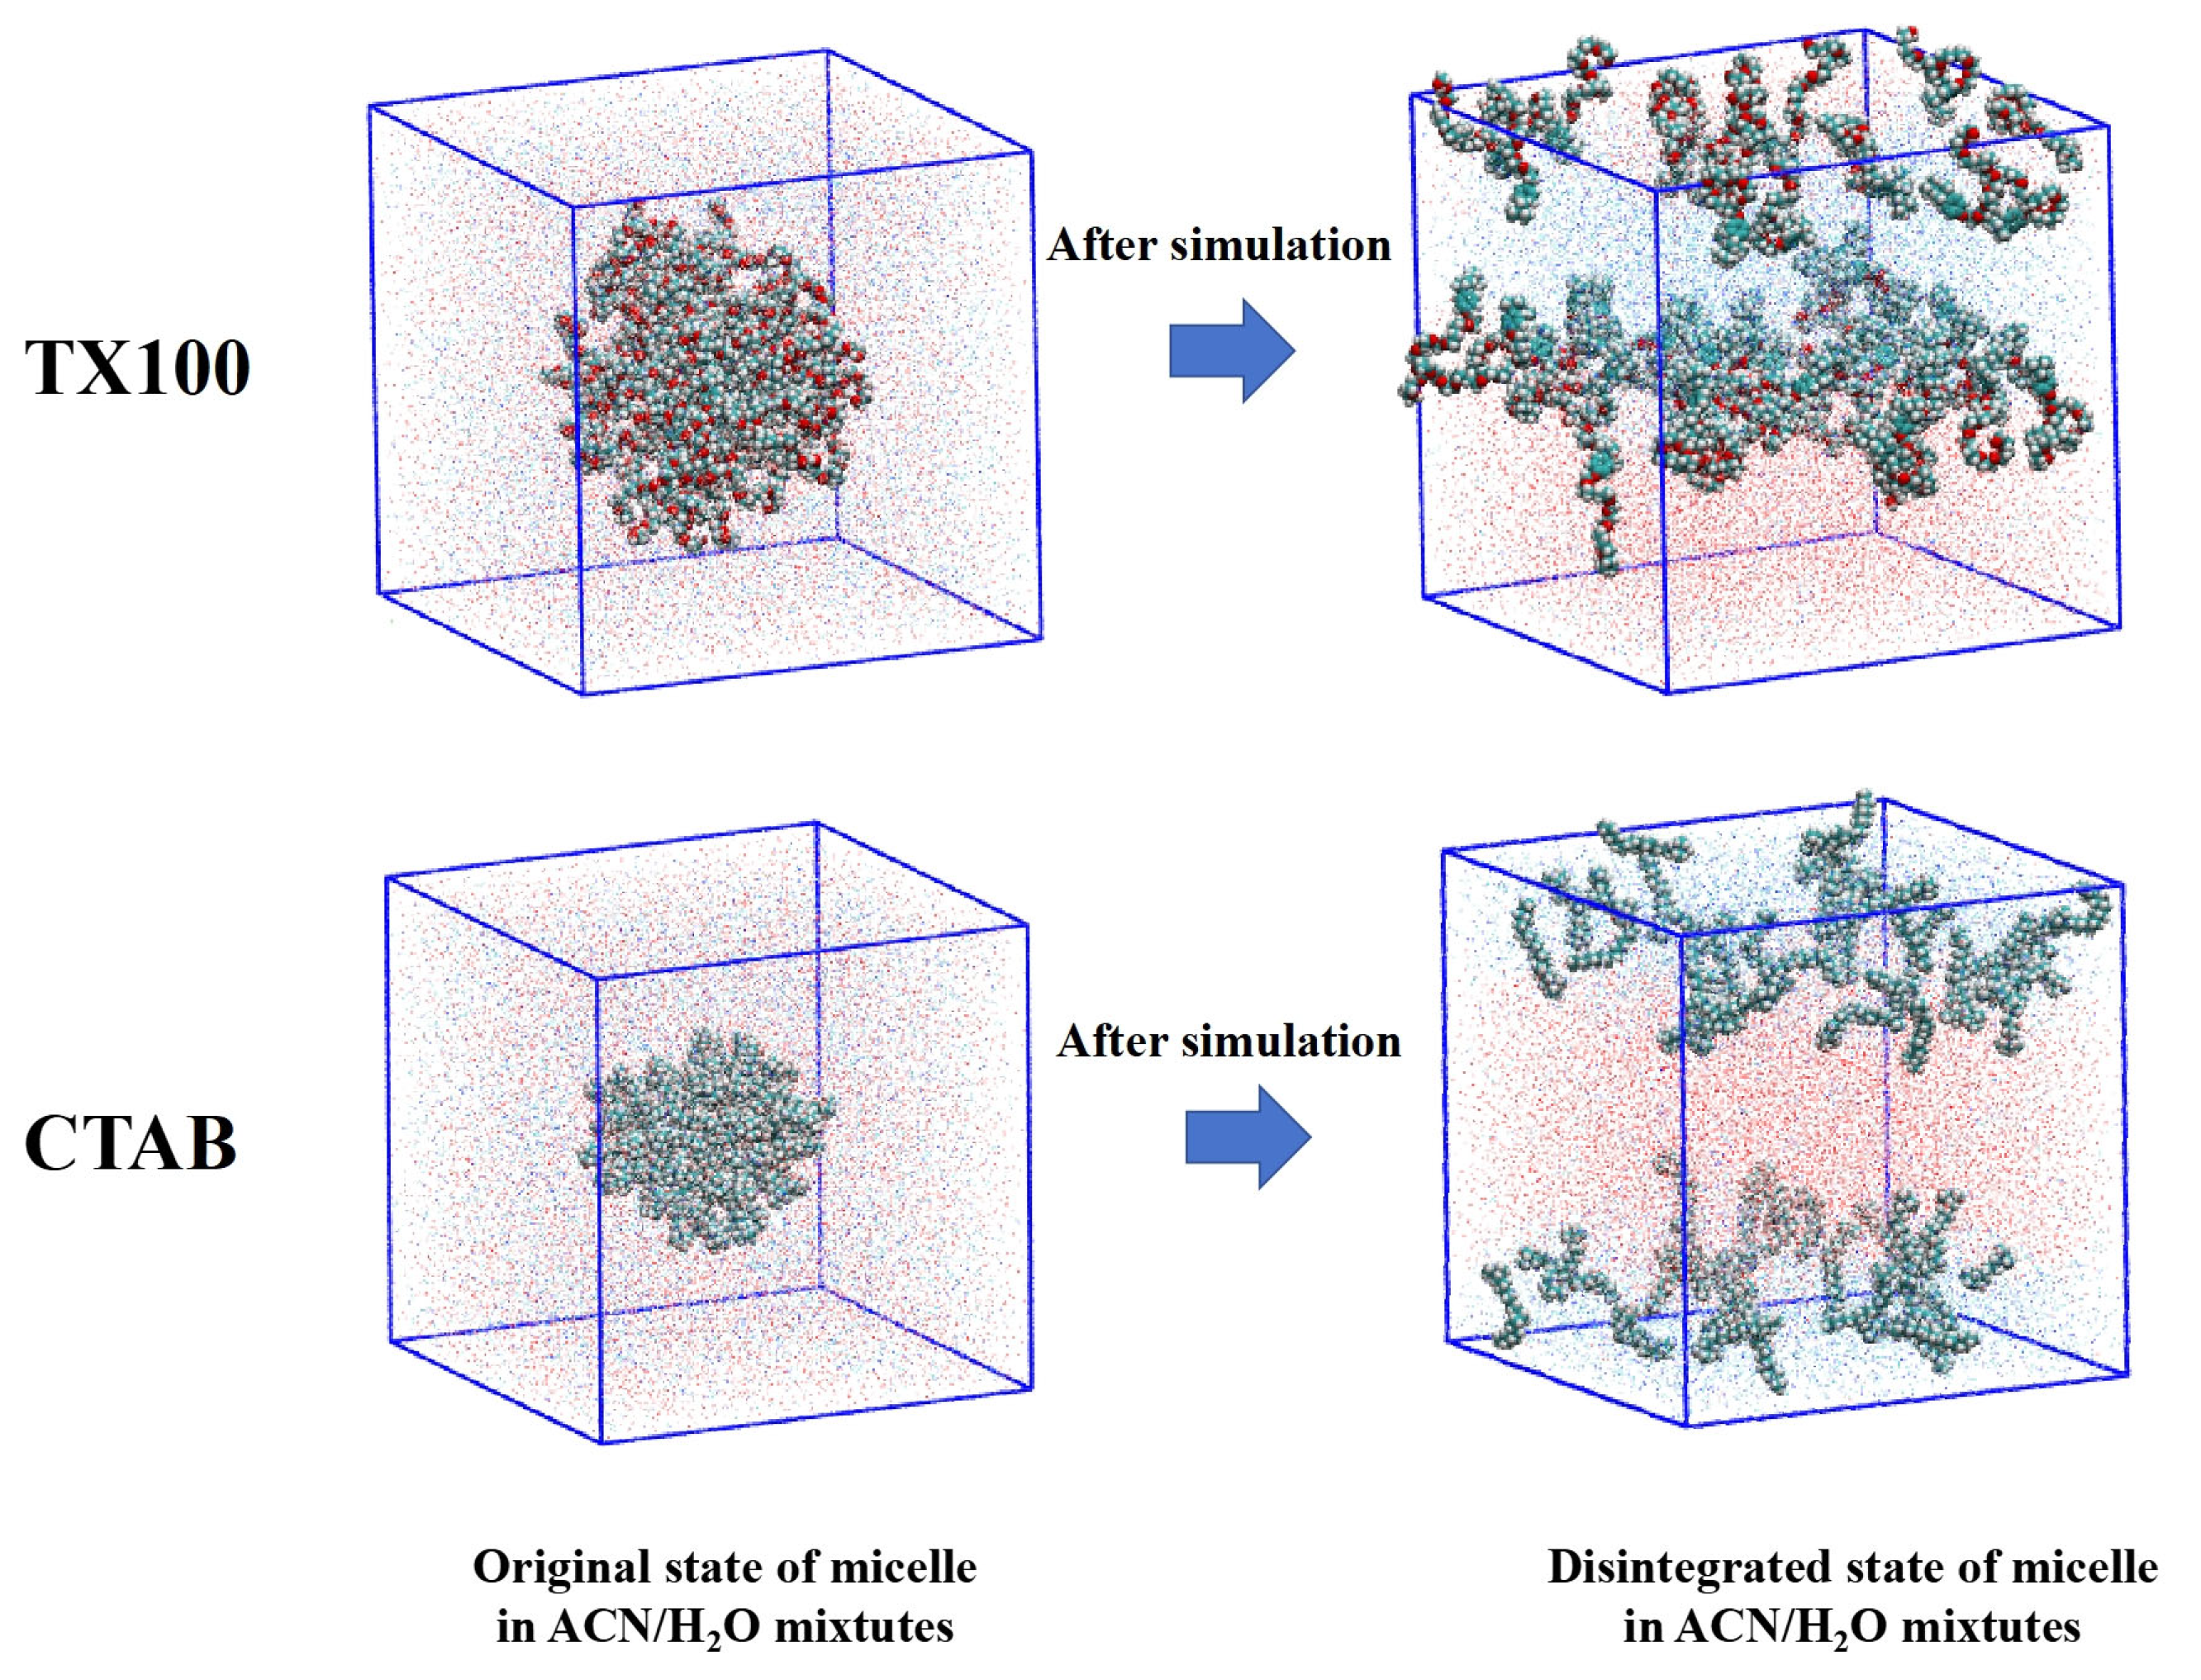
2.3. Molecular Dynamics Simulation

The motion of BDE-28 in micelles was simulated using the GROMACS 2018.8 molecular dynamics program [38,39].
(1) Molecular structure preparation and calculations. CTAB, SDBS, SDS, TX100, TW80, Brij30, and β-CD were selected as the representative solubilizers for simulation. The 3D structure files of these molecules were downloaded from the ChemSpider website. For TX100 and TW80, the ethoxy groups were extended to achieve the corresponding degree of polymerization. Initial micelle model construction requires a linear structure of molecule chains and, thus, conformational searches were not performed on molecules containing chains. Instead, the local energy minimum structure was directly obtained in the linear state using Gaussian 16 at the M06-2X-D3/def-TZVP level combined with the SMD implicit water model [40,41,42,43,44]. Frequency calculations were then performed to obtain the Hessian matrix. For β-CD, its inner cavity was opened to encapsulate the BDE-28 molecule through molecular dynamics simulations conducted using the quantum chemistry program xtb 6.4.2 [45] at the GFN2-xTB level. Subsequently, single-point energy calculations were performed on the seven molecular structures using Gaussian 16 at the B3LYP/def2-TZVP level combined with the SMD implicit water model [40,44,46,47].
(2) Construction of the BDE-28-solubilizer binding model. Based on the aforementioned structures, Packmol [48] was used to construct spherical micelle models for CTAB, SDBS, SDS, TX100, TW80, and Brij30 for molecular dynamics simulations. Given that the aggregation number of micelles typically ranges from 50 to 100 [14], the molecular aggregation number was set at 60, which aligned with experimentally determined or simulated values [49,50,51], as well as facilitating the construction of spherical models and ensuring the appropriate simulation box. After constructing the initial micelle model, the BDE-28 molecule was positioned on the micelle surface using Gaussview and Packmol. For β-CD, the BDE-28 molecule was placed within its inner cavity to generate the molecular encapsulation model using Gaussview.
(3) Topology file preparation. RESP atomic charges for BDE-28 and the seven solubilizer molecules were calculated using the Merz–Kollman method. The calculation was performed using Multiwfn 3.8 (dev) [52] based on the single-point energy calculation files. Topology files for BDE-28 and the seven solubilizer molecules were generated using Sobtop 1.0 (dev) [53], based on molecular structure files, frequency calculation result files, and RESP charge files. For CTAB, SDBS, SDS, TX100, TW80, and Brij30, bond and angle parameters were obtained from the Hessian matrix, while dihedral and improper parameters were obtained from the GAFF force field file. For β-CD, all bond, angle, dihedral, and improper parameters were extracted from the GAFF force field file.
(4) Molecular dynamics simulation. Cubic simulation boxes of 5 nm (β-CD), 10 nm (CTAB, SDBS, SDS, TX100, and Brij30), and 12 nm (TW80) were constructed using Packmol, with molecular structure models centered within the boxes. The models generated from Packmol were converted into GROMACS 2018.8 format, and water molecules were added into the box to create a water environment. For ionic surfactants viz. CTAB, SDBS, and SDS, counterions were added to neutralize the charge of the system. Molecular dynamics simulations were conducted in three stages: energy minimization, pre-equilibration, and production dynamics. Energy minimization was performed on the initial configuration using the steepest descent method. The 2–5 ns pre-equilibration simulations were conducted using V-rescale thermostat at a reference temperature of 298.15 K and a coupling time constant of 0.2 ps, and using Berendsen barostat in an isotropic mode at a reference pressure of 1 atm and a coupling time constant of 0.5 ps, with a compressibility of 4.5 × 10⁻⁵ bar−1. A single annealing process was applied with an annealing time of 30 ps and temperature of 298.15 K. After confirming the equilibrium of potential energy, temperature, pressure, and density, a 200 ns production dynamics simulation was performed using V-rescale thermostat at a reference temperature of 298.15 K and a coupling time constant of 0.2 ps, and using Parrinello–Rahman barostat in isotropic mode at a reference pressure of 1 atm and a coupling time constant of 2 ps, with a compressibility of 4.5 × 10⁻⁵ bar−1. During the simulation, the time step was set at 2 fs, and the Verlet cutoff scheme was employed. Electrostatic interactions were calculated using the PME method with a real-space cutoff radius (rcoulomb) of 1.0 nm. Meanwhile, the Van der Waals interactions were computed using the cutoff method with a Van der Waals cutoff radius (rvdw) of 1.0 nm. The Potential-shift-Verlet method was applied to modify the Van der Waals potential, and long-range corrections for both energy and pressure based on Van der Waals interactions were included. All bonds involving hydrogen atoms were constrained using the LINCS algorithm.

2.4. Data Processing

2.4.1. Kinetic Fittings

The photolytic degradation of PBDEs has been observed as a pseudo-first-order reaction [33,34,54]; thus, the degradation kinetics of BDE-28 was fitted using a first-order reaction model:
ln ( C / C 0 ) = k o b s t
where C is the BDE-28 concentration at a specific reaction time, C 0 is the initial concentration of BDE-28, and k o b s is the apparent first-order rate constant. Further, the accumulated concentration of photolysis products can be described as follows [55]:
C p = k p C 0 × e k o b s t e k p t k p k o b s
In the equation, C p is the accumulated concentration of a specific product, k p and k p are the formation rate constant and degradation rate constant of a specific product, respectively. By fitting the equation with the concentration evolution of products, the formation rate constant of BDE-15 (kBDE-15), 2,8-BDF (k2,8-BDF), BDE-8 (kBDE-8), and BDE-7 (kBDE-7) can be obtained. These rate constants indicated the contribution of different reaction pathways for BDE-28 transformation. Both BDE-15 and 2,8-BDF are derived from the BDE-15 radical after ortho C-Br dissociation. The ratio of ortho aryl radical (BDE-15 radical) among the three aryl radicals from C-Br dissociation can be estimated as:
Po-radical = (k2,8-BDF + kBDE-15)/(k2,8-BDF + kBDE-15 + kBDE-8 + kBDE-7)

2.4.2. Competition Processes

The 2,8-BDF is the critical toxic product generated during BDE-28 photolysis. The main point of this study is to assess its generation potential in various simulated soil-washing solutions. As shown in Figure 1, BDE-15 and 2,8-BDF are competing products. The hydrogen abstraction of the BDE-15 radical to form BDE-15 will inhibit the cyclization of the BDE-15 radical to form 2,8-BDF. As a potential hydrogen donor, solubilizers might promote BDE-15 formation and inhibit 2,8-BDF formation. Here, three characteristic parameters are defined to evaluate the formation potential of 2,8-BDF and the hydrogen donation ability of solubilizers:
PBDF = k2,8-BDF/kobs
Pcyc = k2,8-BDF/(k2,8-BDF + kBDE-15)
R = kBDE-15/k2,8-BDF
PBDF is the 2,8-BDF formation rate, indicating the formation potential from BDE-28. Pcyc is the cyclization rate, which quantitatively describes the competition between cyclization and hydrogen abstraction, revealing the hydrogen donor ability of solubilizers. R is the ratio between kBDE-15 and k2,8-BDF, and it quantitatively describes the relative reaction rate between hydrogen abstraction and cyclization. The higher R indicates the higher hydrogen donation ability of solubilizers. A one-way ANOVA analysis (p < 0.05) was conducted using SPSS 22 to feature the significant difference of kobs, PBDF, Pcyc and R in various reaction systems.

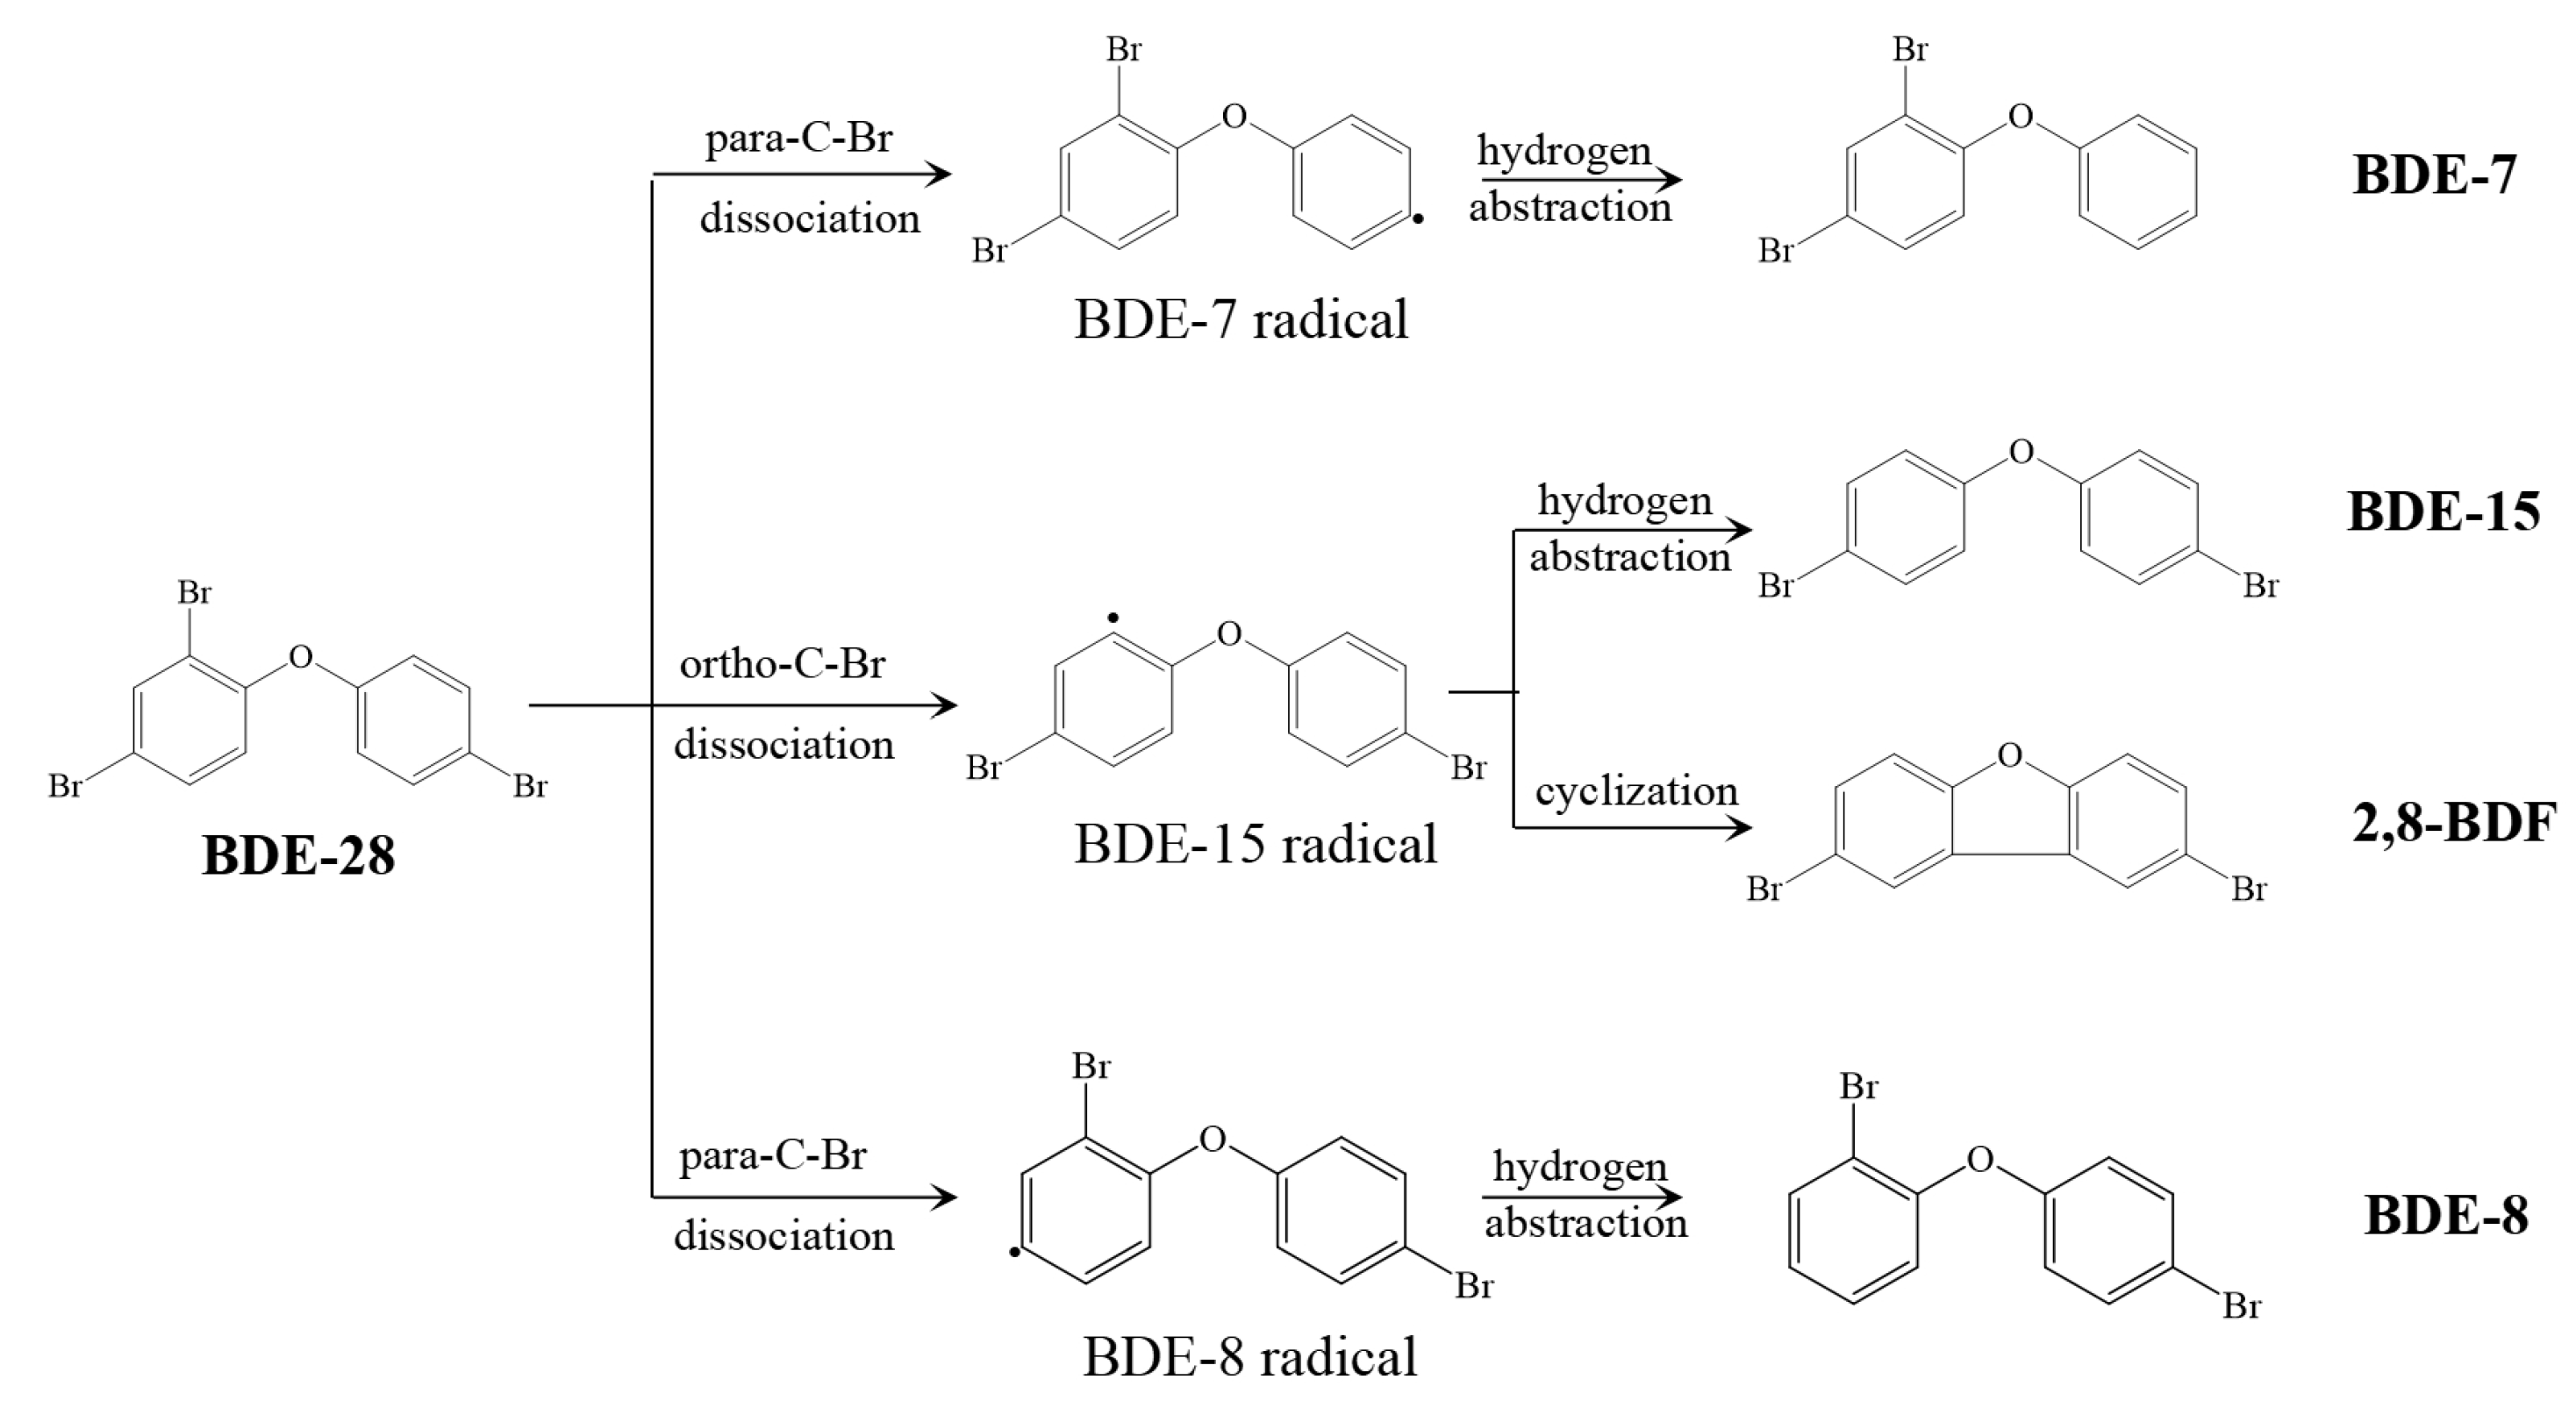
3. Results and Discussion

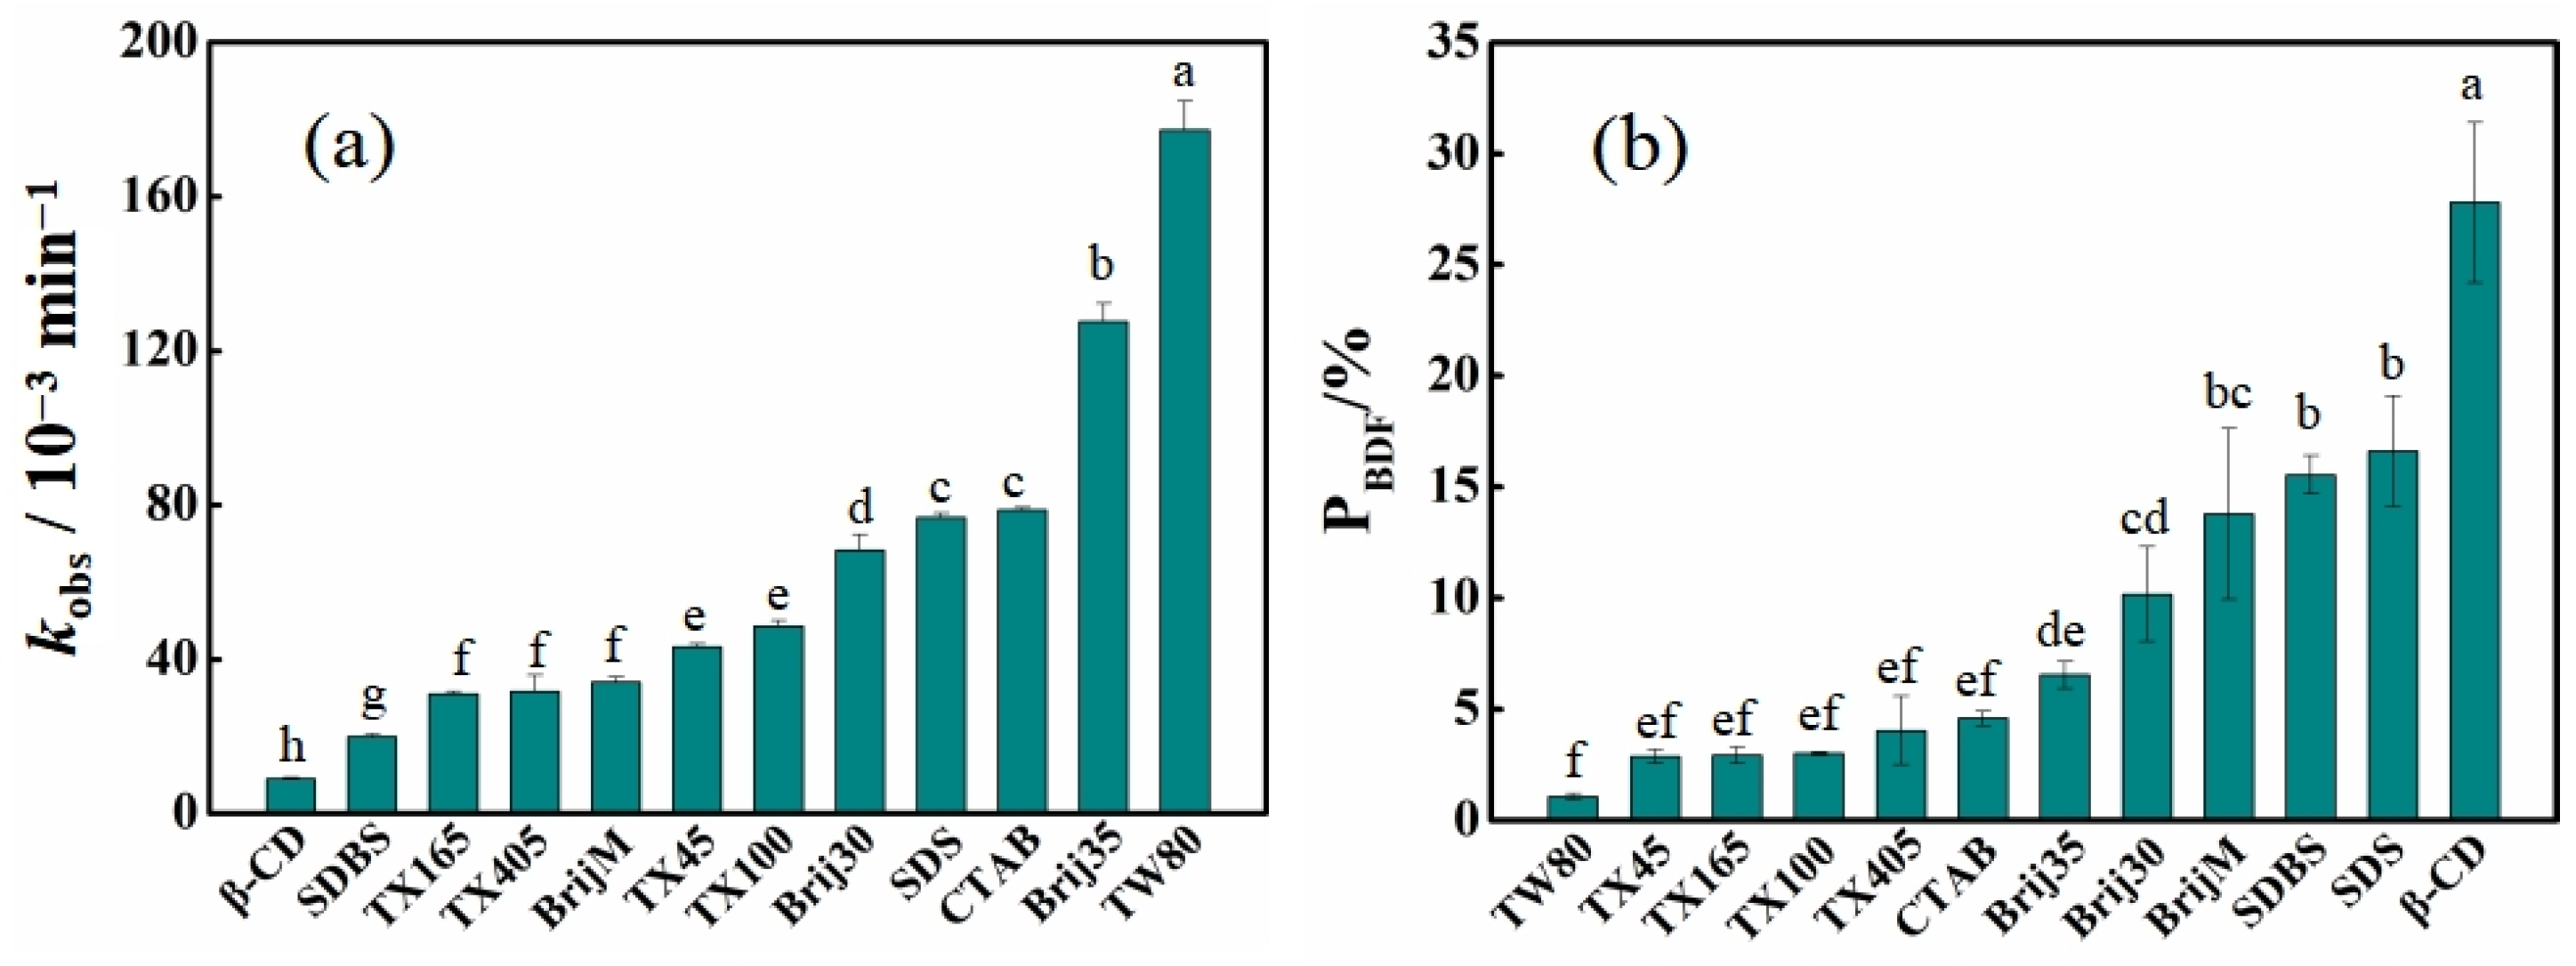
3.1. BDE-28 Photolysis and 2,8-BDF Formation in Various Simulated Soil-Washing Solutions

The degradation kinetics of BDE-28 and the formation kinetics of four products in various solutions are presented in Figures S1–S12. Equations (1) and (2) excellently fit the experimental data. The derived rate constants, PBDF, Pcyc and other parameters are summarized in Table S1. As shown in Figure 3a, the first-order degradation rate constants (kobs) of BDE-28 in various solutions varied from 0.009 min−1 to 0.177 min−1, in the order of TW80 (0.177 min−1) > Brij35 (0.128 min−1) > CTAB (0.079 min−1) > SDS (0.077 min−1) > Brij30 (0.068 min−1) > TX100 (0.049 min−1) > TX45 (0.043 min−1) > BrijM (0.034 min−1) > TX405 (0.032 min−1) > TX165 (0.031 min−1) > SDBS (0.020 min−1) > β-CD (0.009 min−1). Fast degradation was observed in the TW80 and Brij35 solutions, indicating the high efficiency for BDE-28 photolysis. In β-CD, BDE-28 degradation efficiency was the lowest, which showed the disadvantage of applying photolysis in β-CD solution. Besides kobs, the 2,8-BDF formation rate (PBDF) also showed a significant difference. As shown in Figure 3b, PBDF follows the order of: β-CD (27.81%) > SDS (16.63%) > SDBS (15.55%) > BrijM (13.78%) > Brij30 (10.19%) > Brij35 (6.55%) > CTAB (4.60%) > TX405 (4.05%) > TX100 (3.01%) > TX165 (2.94%) > TX45 (2.88%) > TW80 (1.07%). Further, the exhibited order showed an adverse effect upon the application of photolysis to treat soil-washing solutions containing BDE-28. TW80, TX series, and CTAB exhibited minimum risk, while β-CD, SDS and SDBS indicated the most hazards. Therefore, it can be concluded that β-CD is not a suitable solubilizer candidate for applying photolysis in the treatment of soil-washing solutions containing BDE-28.
In addition, the results further demonstrate that, at solubilizer concentrations of 2, 5, and 10 CMC (β-CD concentrations of 2.5, 5, and 10 mM), the formation rate of BDE-15 radical among three aryl radicals (Po-radical) during BDE-28 photolysis is 80.0% ± 7.2%, with a corresponding cyclization rate (Pcyc) of 15.4% ± 15.6%. This indicated that debromination predominantly occurred at the ortho position and was relatively insensitive to solubilizer types. However, BDE-28 exhibited markedly different cyclization characteristics across different solubilizer solutions. Although the Pcyc values for BDE-28 varied significantly among different solutions, a stable Pcyc value was observed for each solubilizer at varying concentrations (Figure 4a). The average Pcyc values at the three concentrations were as follows: TW80 (1.94% ± 0.16%), TX45 (5.49% ± 0.16%), TX165 (5.75% ± 0.58%), TX100 (5.95% ± 0.45%), CTAB (6.06% ± 0.21%), TX405 (6.94% ± 0.20%), Brij35 (11.83% ± 0.13%), Brij30 (14.44% ± 0.58%), BrijM (20.17% ± 1.68%), SDBS (20.97% ± 0.62%), SDS (24.00% ± 1.00%), and β-CD (61.56% ± 1.96%). According to Equation (6), the R values of BDE-28 in different solubilizer solutions at the three concentrations were calculated as follows: TW80 [52.45; 54.87; 45.06; 50.79 ± 4.17], TX45 [16.50; 17.40; 17.78; 17.23 ± 0.54], CTAB [15.43; 14.88; 16.27; 15.53 ± 0.57], TX100 [15.18; 16.64; 15.65; 15.82 ± 0.61], TX165 [14.43; 16.58;18.73; 16.58 ± 1.75], TX405 [13.66; 12.85; 13.75; 13.42 ± 0.40], Brij35 [7.57; 7.45; 7.35; 7.45 ± 0.09], Brij30 [5.56; 6.07; 6.18; 5.93 ± 0.27], SDBS [3.58; 3.88; 3.86; 3.77 ± 0.14], BrijM [3.47; 4.02; 4.48; 3.99 ± 0.41], SDS [3.39; 2.97; 3.17; 3.18 ± 0.17], and β-CD [0.70; 0.57; 0.61; 0.63 ± 0.05]. The first three values in parentheses represented the R values at increasing surfactant concentrations, while the fourth value represented the average R value across the three concentrations. These results indicated that hydrogen abstraction was much superior to cyclization in most cases. For the reaction kinetics of homogeneous systems, if solubilizer molecules were freely dispersed in water and the BDE-15 radical underwent free reactions with solubilizer molecules, then the hydrogen abstraction reaction rate constant kH-abs was calculated as follows:
kH-abs = k [solubilizer]
Here, k denotes the second-order reaction rate constant between the BDE-15 radical and solubilizer molecules, while [solubilizer] represents the concentration of the solubilizer. According to the formula, kH-abs was linearly dependent on the solubilizer concentration. The cyclization rate constant of the BDE-15 radical kcyc was the single-molecule reaction rate constant, which was independent of the solubilizer concentration. The molecular reaction rate constants controlled the observed formation rate constants of BDE-15 and 2,8-BDF, which can be represented as a quantitative relationship [36]:
kH-abs/kcyc = kBDE-15/k2,8-BDF = R
Consequently, the R value was expected to exhibit a linear increasing trend with solubilizer concentration. However, the experimentally obtained R values remained stable across varying solubilizer concentrations (Figure 4b). This suggested that BDE-28 resided in a stable microenvironment that remained unchanged even upon the increase of solubilizer concentration. This observation aligned with the phenomenon of surfactant micelle formation. Above the critical micelle concentration (CMC), micelle formation could provide a stable organic environment for BDE-28. The unique molecular structure of β-CD did not support micelle formation. Nevertheless, the stable R values observed for BDE-28 in β-CD solutions at different concentrations indicated another stable state viz. the molecule inclusion complex, which was also the stable microenvironment. The stable organic microenvironment resulted in the significantly decreased PBDF and Pcyc of BDE-28 in water, where the respective values of PBDF and Pcyc were above 40% and about 95% when solubilizers were absent (Table S1). Water was an extremely poor hydrogen donor for the BDE-15 radical [36]. The solubilizers provided abundant organic structures with high hydrogen abstraction reactivity and, thus, inhibited 2,8-BDF formation.
As mentioned above, BDE-28 exhibited markedly distinct cyclization characteristics in different solubilizer solutions. Notably, BDE-28 exhibited the lowest Pcyc value in TW80 solutions, indicating the minimal formation of 2,8-BDF. This suggested that the BDE-15 radical generated during the photolysis of BDE-28 was much more inclined toward hydrogen abstraction. This behavior may be attributed to the presence of furan rings in the TW80 structure. According to the previous findings [36], BDE-28 among various organic solvents exhibited the lowest Pcyc value in tetrahydrofuran (3.8%), which closely aligned with the Pcyc value observed in TW80. This indicated that the furan structure participated in the reaction, with hydrogen abstraction being the dominant process. Conversely, BDE-28 exhibited the highest Pcyc value in β-CD solution, indicating maximal formation of 2,8-BDF. Unlike surfactants, the solubilization effect of β-CD on BDE-28 was achieved through encapsulation within the inner cavity of a single molecule rather than through micelle binding. Consequently, BDE-28 was more exposed to the aqueous environment, leading to cyclization as the predominant process. The Pcyc value of BDE-28 for the cationic surfactant CTAB was significantly lower than those for the anionic surfactants SDBS and SDS. This difference may arise because both the hydrophilic and hydrophobic chains of CTAB were organic structures, favoring the hydrogen abstraction process. For the nonionic surfactant TX series, BDE-28 exhibited relatively low Pcyc values, similar to those observed for CTAB and for reported organic solvents such as alcohols [36]. This suggested that BDE-28 resided in the organic microenvironment formed by micelles. However, the Pcyc values of BDE-28 for nonionic surfactants Brij series were higher than those for the TX series, indicating differences in organic microenvironments formed by these two types of surfactants. Despite these differences, hydrogen abstraction remained the dominant process. Based on the aforementioned analysis, 2,8-BDF formation from BDE-28 photolysis in simulated soil-washing solutions was jointly influenced by structural properties of the surfactant and the characteristics of the organic microenvironment.

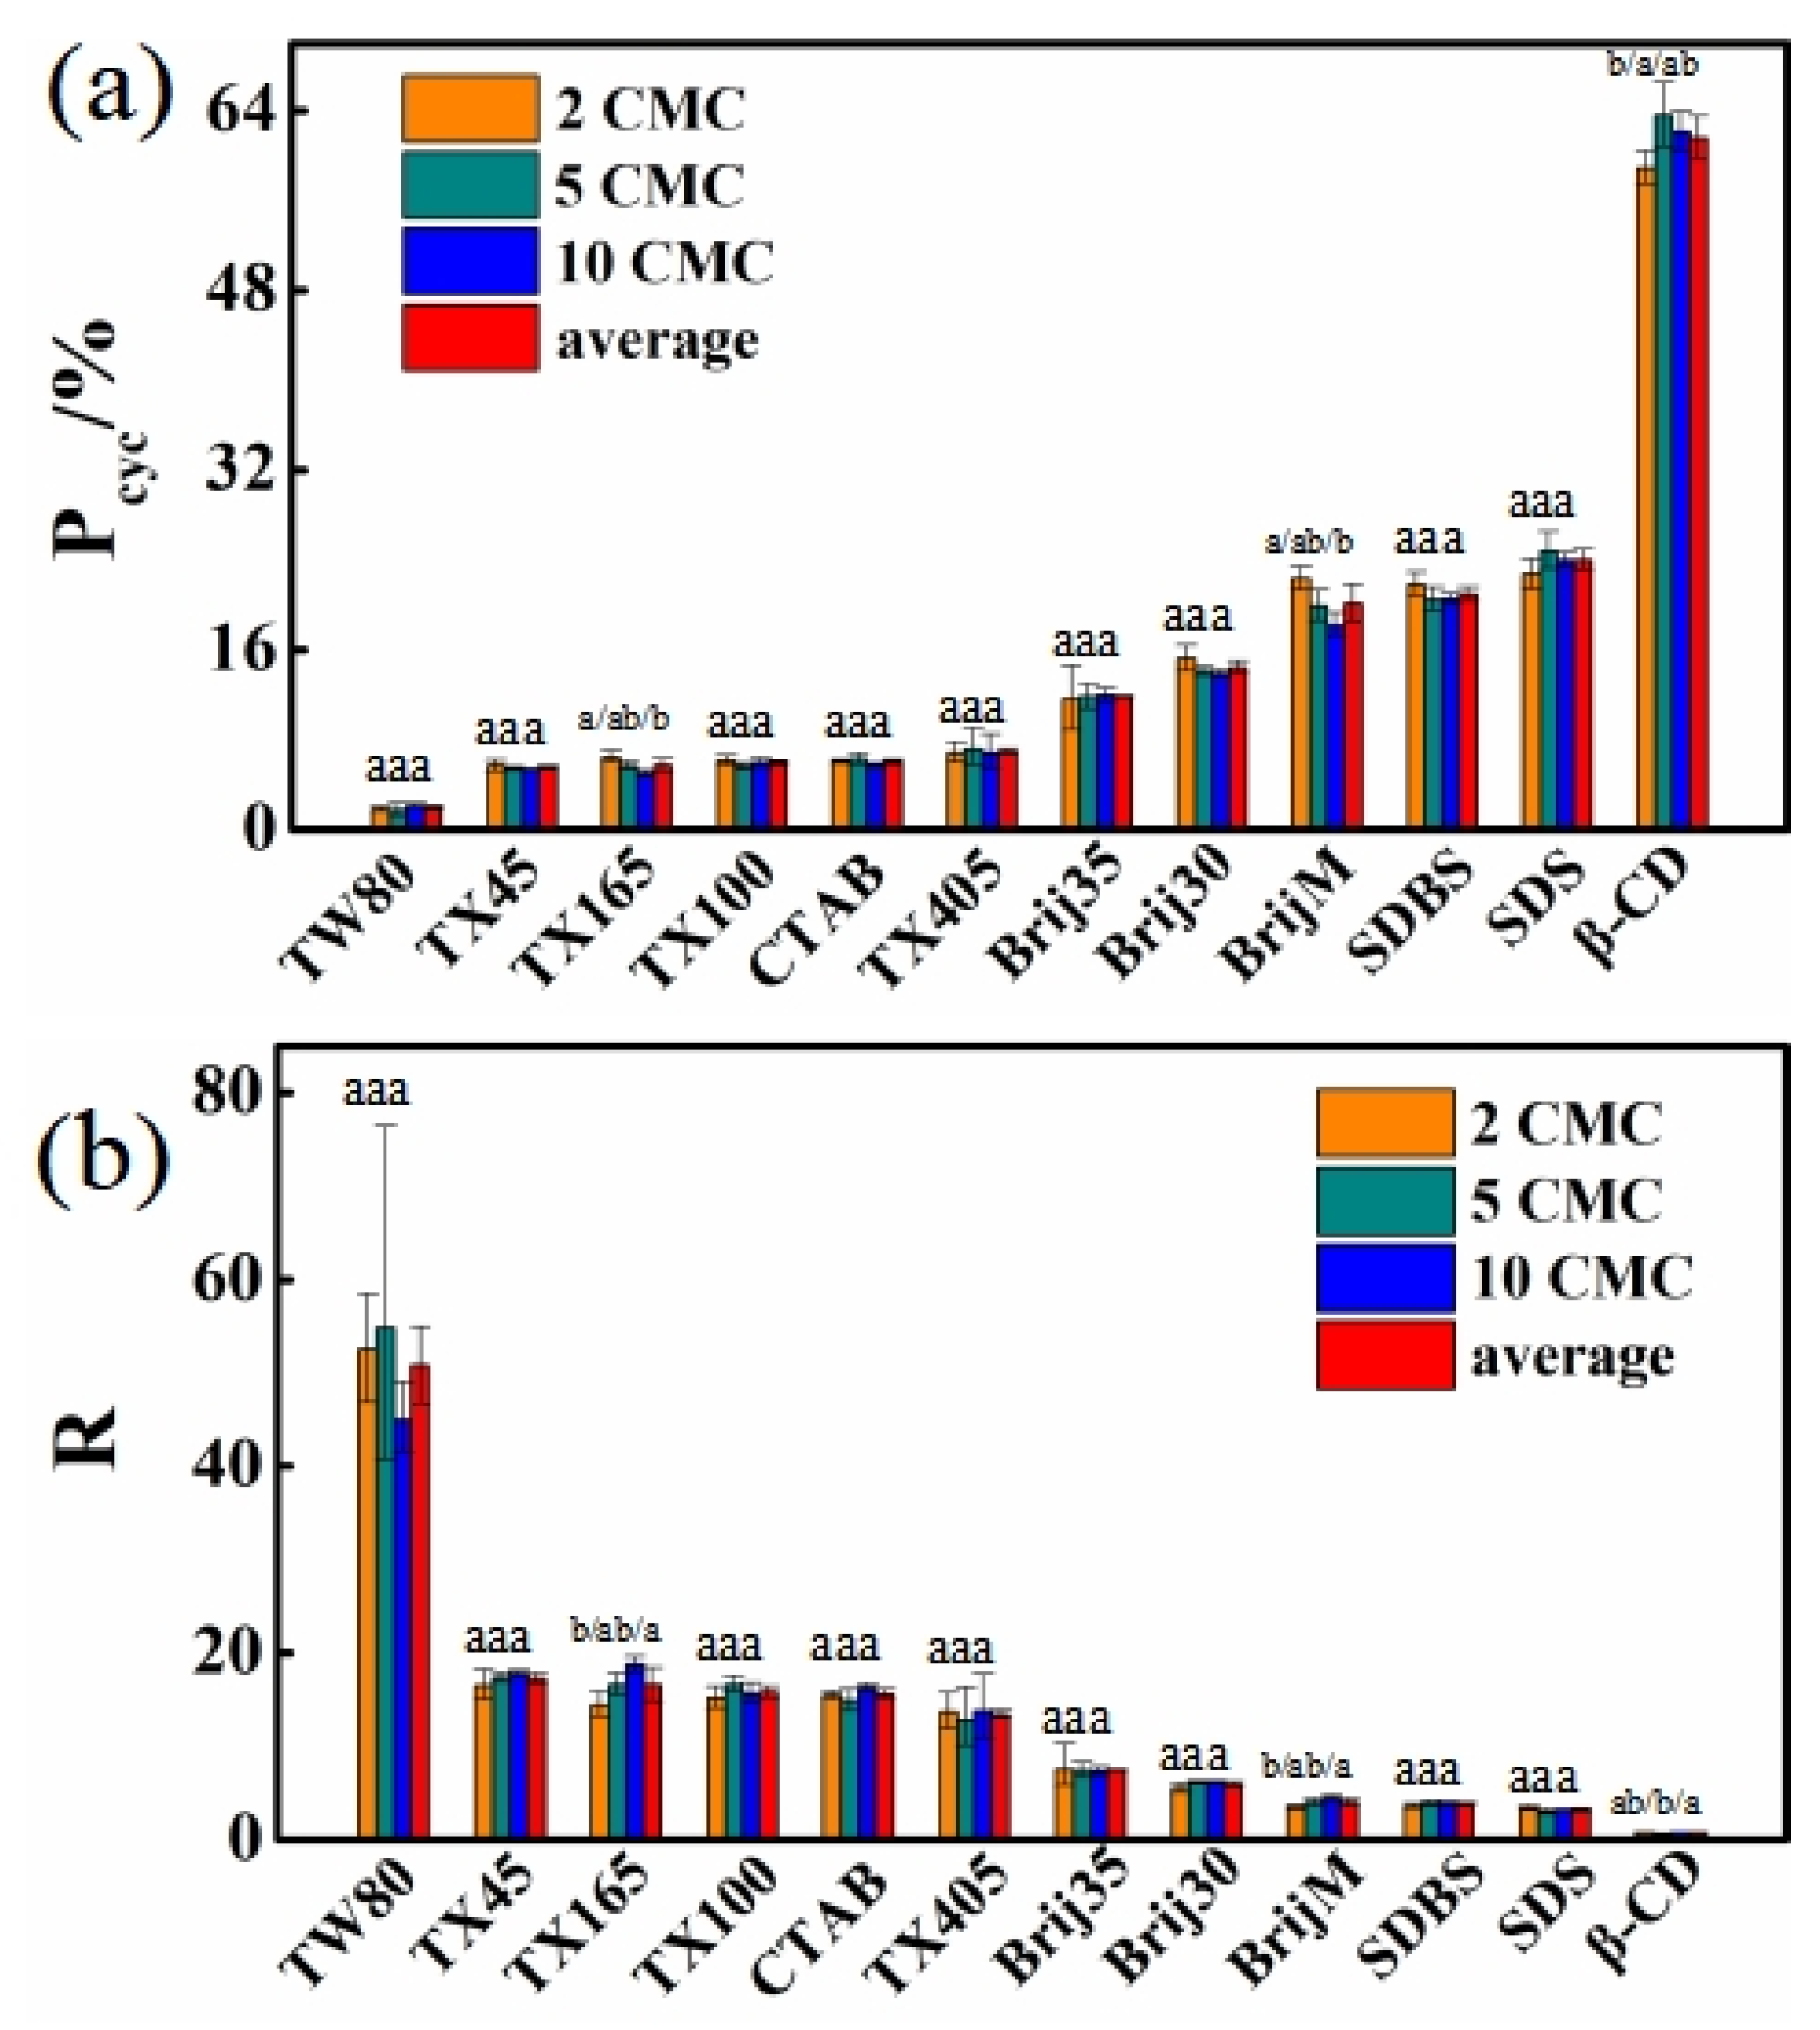
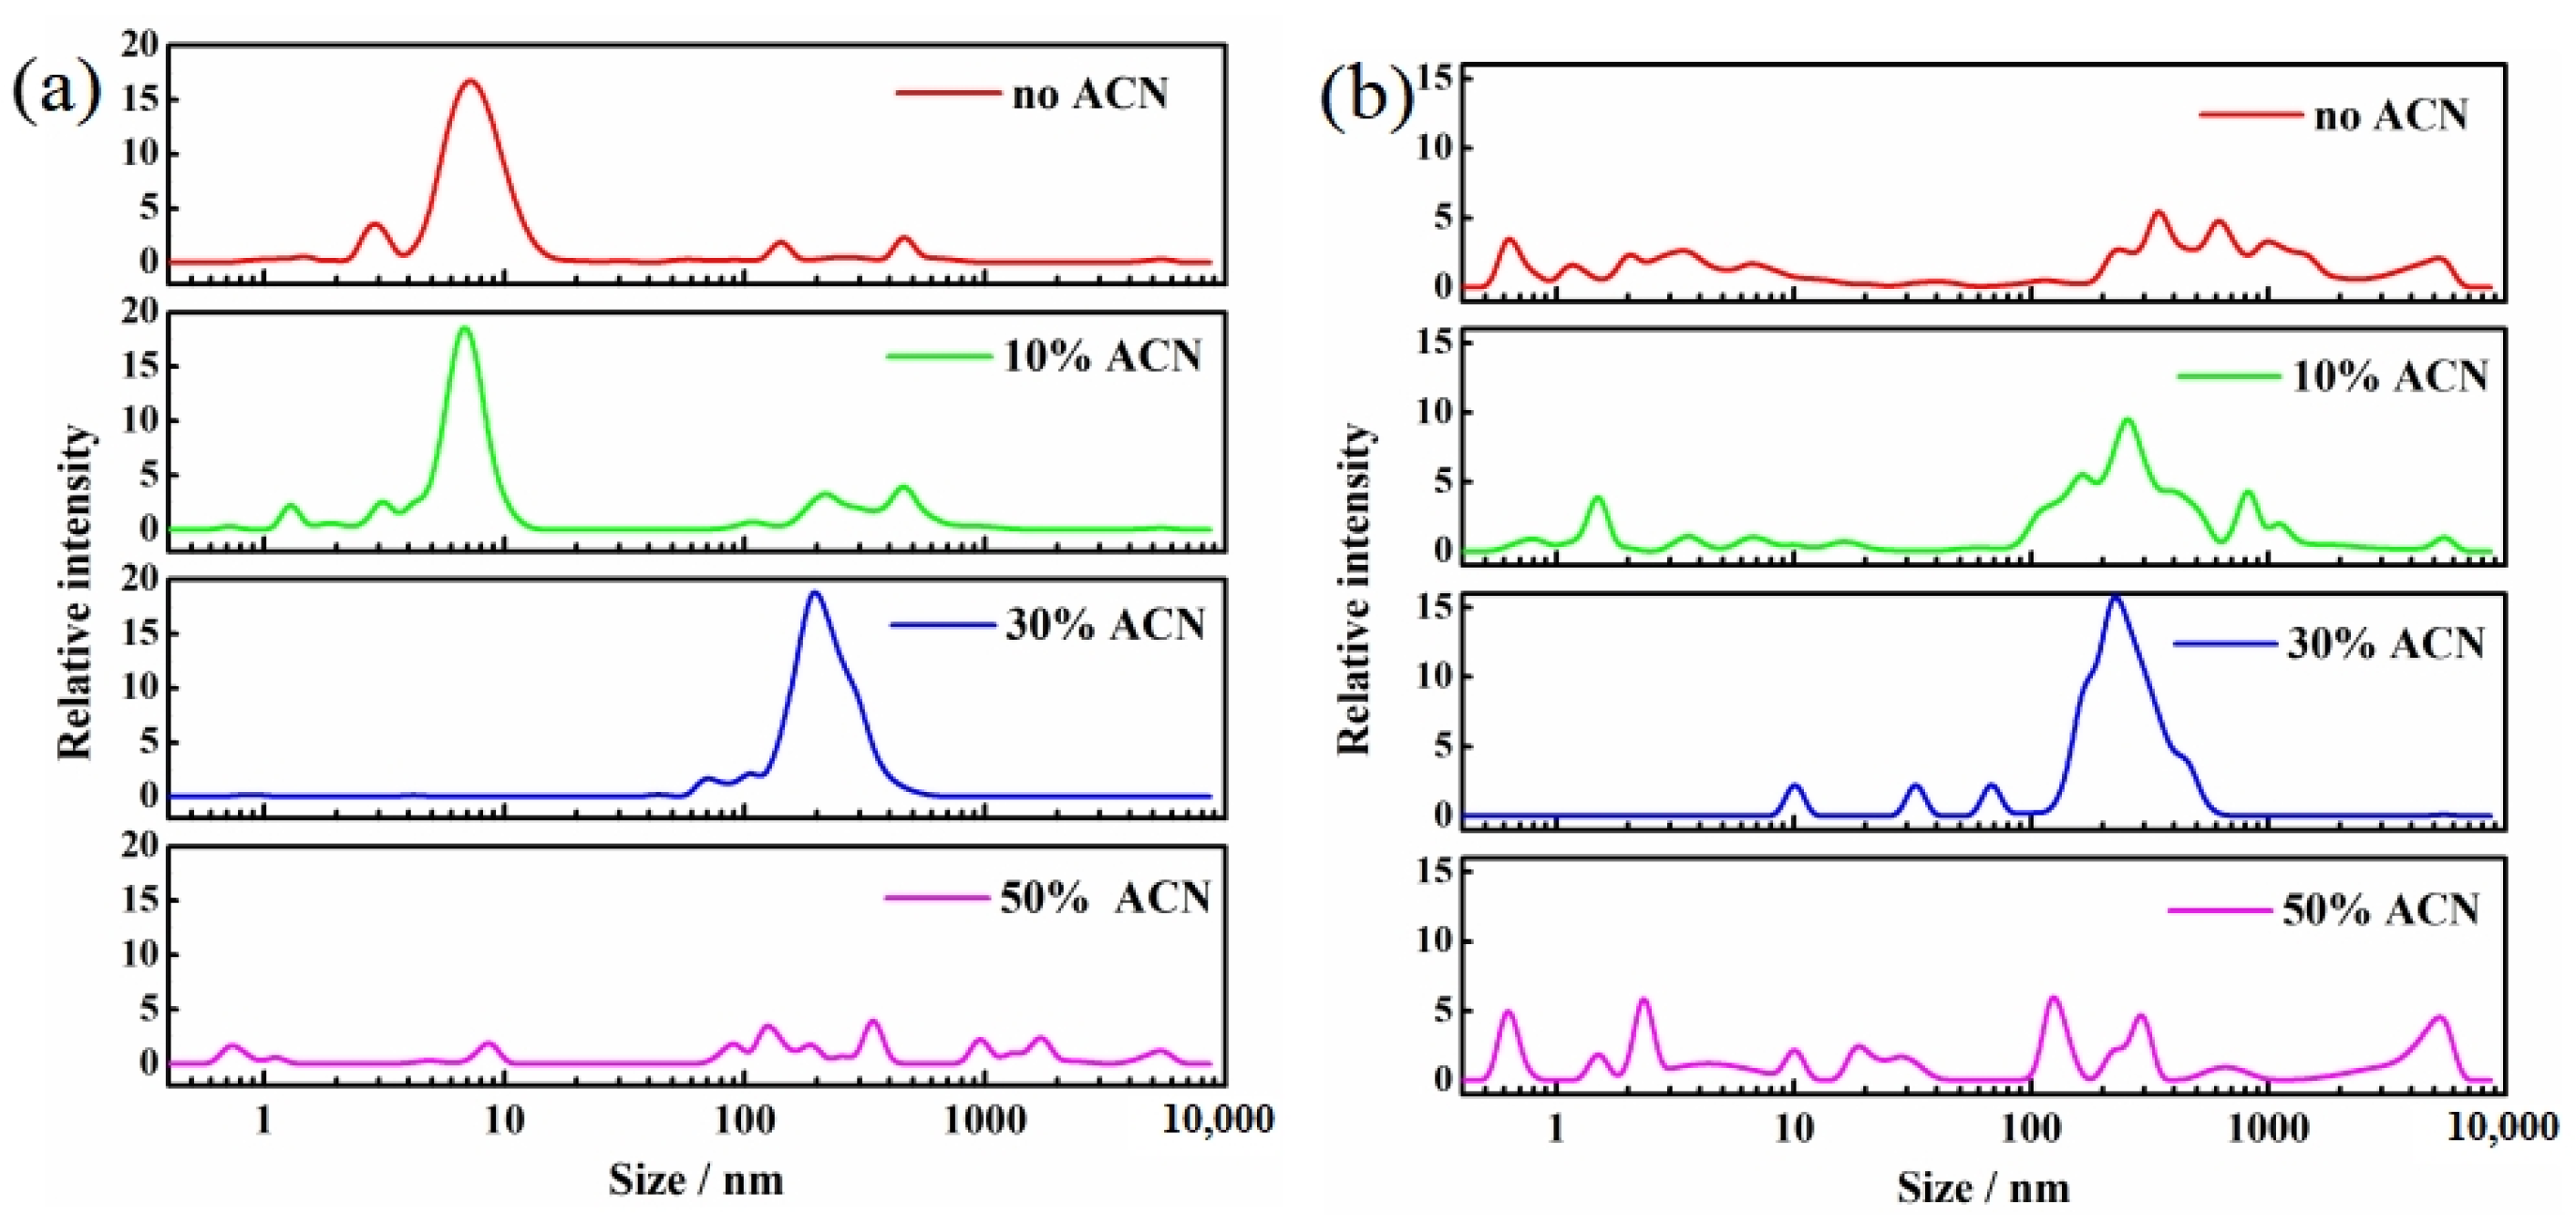
3.2. Formation Behavior of 2,8-BDF in Solutions with Surfactant Concentrations Under CMC

To further investigate the influence of organic microenvironments on BDE-28 photolysis, 2,8-BDF formation in solutions at solubilizer concentrations below the CMC was examined. Two representative surfactants were selected for this analysis: the cationic surfactant CTAB and the nonionic surfactant TX100. When the concentration is below the CMC, the micelle formation could be significantly hindered, leading to changes in the microenvironment for BDE-28. Consequently, it was expected that cyclization characteristics of the BDE-15 radical might be altered. The degradation kinetics of BDE-28 and the formation kinetics of BDE-15 and 2,8-BDF in different solutions are presented in Figures S13 and S14. Both Equations (1) and (2) excellently fit the experimental data, and the derived rate constants and cyclization rate are summarized in Table S2. Unlike the stable Pcyc values observed when surfactant concentrations were above the CMC (Figure 4), Pcyc varied significantly with surfactant concentrations below the CMC. Upon decreasing the CTAB concentration from 2 CMC to 1, 0.5, and 0.2 CMC, Pcyc values increased from 6.09% to 11.29%, 21.85%, and 33.06%, respectively (Figure 5a). These results indicated that the formation of the micellar environment was limited at low concentrations, allowing part of BDE-28 to remain free in the aqueous phase. According to previous findings [36] and this study, the BDE-15 radicals generated during the photolysis of free BDE-28 in water can be mostly converted to 2,8-BDF when compared with BDE-15. Therefore, lower CTAB concentrations resulted in fewer micelles, more free BDE-28, and higher Pcyc values. Oppositely, more micelles are generated with the increase of CTAB concentration, capturing the BDE-28 and reducing the Pcyc. Similar to CTAB, the respective Pcyc values also increased from 6.18% to 8.69%, 38.99% and 64.18% upon the decrease of the TX100 concentration from 2 CMC to 1, 0.5, and 0.2 CMC (Figure 5b). In summary, micelles were stably generated above the CMC, providing BDE-28 with a stable micellar microenvironment that was unaffected by surfactant concentration, resulting in stable Pcyc values. Below the CMC, micelle formation was hindered, and changes in surfactant concentration altered the microenvironment for BDE-28, leading to variations in Pcyc. These results further verified the micelle-microenvironment for BDE-28 in solubilizer solutions.

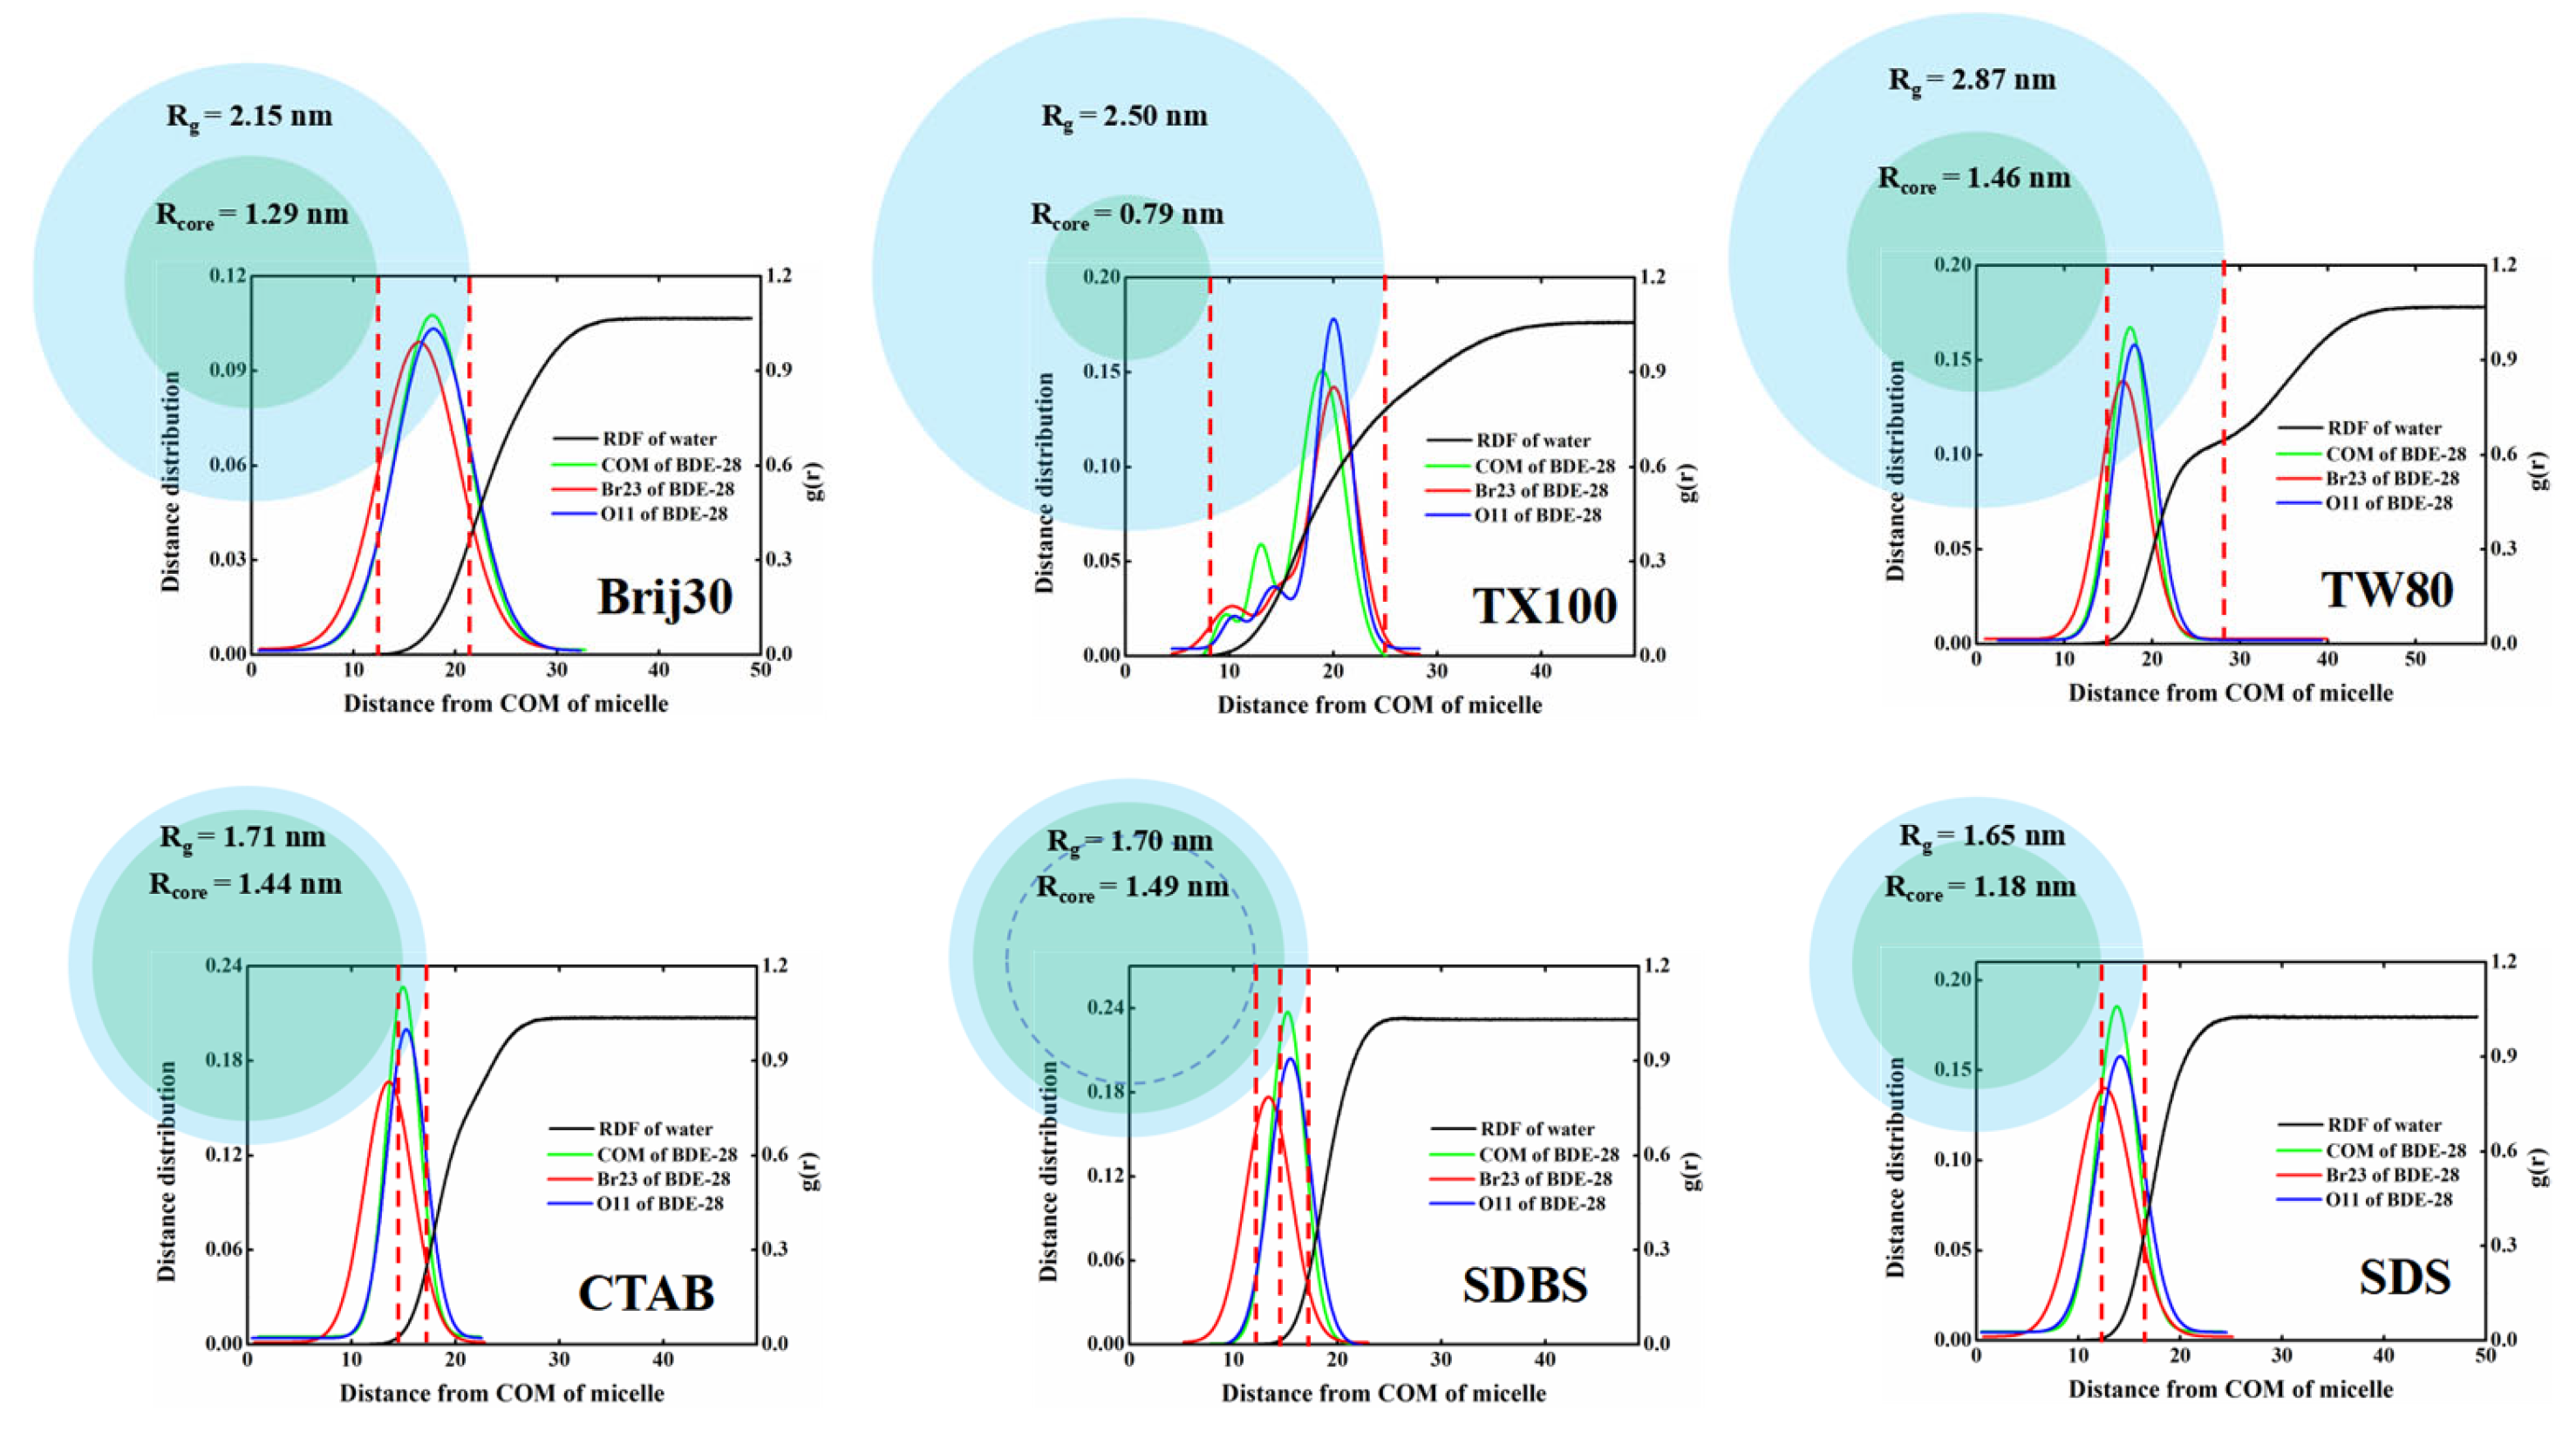
3.3. Effect of Micellar Microenvironment on 2,8-BDF Formation

To modulate the formation of an organic microenvironment, varying proportions of ACN were further introduced into solubilizer solutions. CTAB, TX100, and β-CD were chosen as solubilizers with concentration set as 10 CMC, 10 CMC, and 5 mM, respectively. The degradation kinetics of BDE-28 and the formation kinetics of BDE-15 and 2,8-BDF in different solutions are presented in Figures S15–S17. Both Equations (1) and (2) excellently fit the experimental data, and the derived rate constants and cyclization rates are summarized in Table S3. As shown in Figure 6, the respective Pcyc values for BDE-28 in CTAB solutions changed from 5.79% to 9.54%, 31.01%, and 34.60% as the ACN/H2O volume ratio increased from 0/100 to 10/90, 30/70, and 50/50. The Pcyc values in TX100 solutions shifted from 6.01% to 5.44%, 42.08%, and 47.27%, respectively. Meanwhile, Pcyc in β-CD solutions decreased from 63.64% to 56.83%, 51.37%, and 47.20%, respectively. According to previous studies [36], the introduction of ACN in pure water will promote hydrogen abstraction of the BDE-15 radical and decrease Pcyc. For the β-CD solution, Pcyc was really decreased with elevated ACN concentration. However, Pcyc significantly increased in CTAB and TX100 solutions. This indicated that the micellar structures formed by CTAB and TX100 were probably destroyed by ACN, making BDE-28 dissolve in ACN/H2O, which has a lower hydrogen abstraction reaction ability. Different from CTAB and TX100, this phenomenon revealed that there were no micelles that formed in the β-CD solution. Therefore, the results suggested that BDE-28 transferred from micelles into the ACN/H2O mixed solvent, thereby altering its microenvironment and influencing 2,8-BDF formation.
The aggregation of CTAB and TX100 molecules in ACN/H2O mixed solvents was investigated using dynamic light scattering (DLS), as shown in Figure 7. In the CTAB solution without ACN, aggregates (micelles) with a particle size of 1–10 nm were formed. Light scattering signals were also detected in the range of 10–10,000 nm. This indicated that these aggregates could interconnect to form larger structures. Upon the introduction of 10% ACN, the signal intensity of 1–10 nm aggregates decreased, while the signal intensity of 100–1000 nm aggregates increased, which suggested that the micelle structure began to break down and reassemble into larger interconnected structures. At this stage, BDE-28 became increasingly exposed to the solvent environment due to the disruption of the micellar structure and changes in the distribution of BDE-28 between the solvent and CTAB. This exposure reduced the hydrogen-donating ability of the micelle, leading to the increased Pcyc. Upon increasing the ACN concentration to 30%, the 1–10 nm aggregates almost disappeared, and the signal intensity of 100–1000 nm aggregates significantly increased, indicating the further breakdown of micelles and their reassembly into larger structures. As a result, more BDE-28 was distributed in the solvent phase, causing a further increase in Pcyc. Upon increasing the ACN concentration to 50%, the 100–1000 nm structures were disrupted, and the signal intensity of 1–100 nm aggregates increased, which indicated that the larger structures broke down into smaller aggregates. At this stage, the micellar structure was further disrupted, and BDE-28 continued to redistribute into the solvent, resulting in a continued increase in Pcyc.
The TX100 solution exhibited a similar process. In the absence of ACN, aggregates (micelles) with a particle size of 2–20 nm were formed. Upon adding 10% ACN, the 2–20 nm aggregates remained dominant, but a new signal emerged in the 100–1000 nm range, indicating the partial disruption of micelles and their reassembly into larger structures. Interestingly, at this stage, Pcyc exhibited a decreased tendency, suggesting that BDE-28 remained encapsulated within the micelles. The addition of ACN molecules may have caused the hydrophilic chains of the micelles to interact more strongly with the organic environment, enhancing the hydrogen abstraction of the BDE-15 radical. Upon increasing the ACN concentration to 30%, the 2–20 nm aggregates almost disappeared, and the signal intensity of 100–1000 nm aggregates significantly increased, which indicated that the micellar structure was disrupted and reassembled into larger structures. At this stage, most of BDE-28 was exposed to the solvent environment, leading to a significant increase in Pcyc. Upon further increasing the ACN concentration to 50%, the 100–1000 nm structures were disrupted, and small aggregates almost disappeared, indicating that most of the micellar structure was disrupted, and Pcyc continued to rise.
Molecular dynamics simulations of CTAB and TX100 micelles in a 50% ACN solution were conducted. During the simulation, the micellar structure gradually disintegrated (as shown in Figure 8), providing further evidence that the addition of ACN disrupts micellar structures. In summary, as characterized by dynamic light scattering and molecular dynamics simulations, the organic microenvironment formed by the surfactants controlled the cyclization rate during the photolysis of BDE-28.

3.4. Interaction Between BDE-28 and Solubilizer

According to the above results, BDE-28 exhibited distinct cyclization characteristics during photolysis in various solubilizer solutions. It has also been proposed that the photolysis process occurs within the micellar or molecular inner cavity microenvironment, which thereby indicates a correlation between the photolysis-induced cyclization of BDE-28 and its surrounding microenvironment. Prior investigations have quantitatively linked the solvent environment to the Pcyc of BDE-28, revealing that the structure and concentration of hydrogen donors can influence the formation of 2,8-BDF [36]. Due to hydrophobic interactions, surfactant molecules self-assembled in water to form micelles with an internal environment similar to organic solvents, which exhibited a much higher hydrogen donation ability than aqueous solution. When BDE-28 resided in micelles with a microenvironment analogous to an organic solvent, its Pcyc was significantly reduced compared to that in the aqueous environment, as evidenced by experimental findings. Variations in surfactant molecular structures resulted in differing hydrogen-donating capacities. Meanwhile, the position of BDE-28 within micelles reflected its interaction with surfactant molecules, such as its presence in the dense alkyl core, loose hydrophilic chains, or interfacial water regions. These varying interaction environments correspond to distinct hydrogen-donating scenarios. The surfactants examined in this study all feature alkyl cores, and the completely hydrophobic cores form an organic microenvironment resembling the alkanes. Nonionic surfactants exhibited ethoxy-based hydrophilic chains, and cationic surfactant CTAB possesses trimethyl quaternary ammonium-based hydrophilic chains, both of which created mixed water-organic microenvironments in the aqueous phase. However, anionic surfactants SDBS and SDS contain sulfur-oxygen-based inorganic hydrophilic chains, forming an inorganic microenvironment in their hydrophilic regions. The interface region outside the hydrophilic chains remained entirely in the aqueous phase. Molecular dynamics simulations were performed on six representative surfactants—CTAB, SDBS, SDS, TX100, Brij30, and TW80—to elucidate the localization of BDE-28 molecules within micelles. The probability of ortho-bromine (Br23), the center of mass (COM) for BDE-28, and an oxygen atom (O11) appearing in specific regions was utilized to characterize the microenvironmental features of BDE-28. As shown in Figure 9, Rg denotes the micelle’s radius of gyration, while Rcore represents the distance from the junction atom between hydrophobic and hydrophilic chains to the micelle’s center of mass, which signifies the radius of the hydrophobic core. The horizontal axis indicates the distance to the micelle’s center of mass. The left vertical axis represents the probability of the BDE-28 molecule appearing at a given distance to the micelle’s center of mass, and the right vertical axis illustrates the radial distribution function of water molecules. The core, represented by Rcore, is entirely hydrophobic, with the hydrophilic chains situated in the aqueous phase and exhibiting a gradual decrease in water content from the surface toward the interior (Figure 9). The ortho-bromine predominantly resides within the micelle. For nonionic surfactants, it is primarily located in the hydrophilic chain, suggesting an affinity between BDE-28 and the ethoxy-based hydrophilic chain. In contrast, for ionic surfactants, it is mainly found in the hydrophobic chain but also frequently appears in the hydrophilic chain.
The probabilities of ortho-bromine appearing in different micellar regions were further estimated. For nonionic surfactants, the ortho-bromine has over a 90% probability of being located in the region within Rg, which approached nearly 100% for TW80 and TX100. Consequently, the hydrogen abstraction reaction of the BDE-15 radical was highly active due to the abundant organic environment and, thus, led to a low Pcyc. In CTAB micelles, the ortho-bromine has approximately 92.7% probability of being in the region within Rg (with 63.7% in the hydrophobic region and 29.0% in the hydrophilic region). Given its predominant residence in the organic environment, CTAB also exhibited a low Pcyc. Within SDBS micelles, the ortho-bromine has approximately a 94.1% probability of being located internally, with 75.3% in the hydrophobic region (32.4% in the aliphatic chain region and 42.9% in the benzene ring region). Considering the weak hydrogen-donating ability of the benzene ring [36], the effective hydrogen-donating organic region is limited to 32.4%, resulting in a relatively higher Pcyc. For SDS micelles, the ortho-bromine has approximately a 90.9% probability of being located internally, with only 39.4% in the hydrophobic region and, thus, also yielding a relatively higher Pcyc.
The molecular dynamic simulation results observed that BDE-28 remained stably bound to solubilizer molecules rather than being freely dissolved in water, which thereby elucidated the solubilization process at the molecular level. Additionally, simulations also indicated stable encapsulation between β-CD and BDE-28, confirming the rationality of the encapsulation structure during solubilization. In the open architecture, BDE-28 resided widely in an aqueous environment, exhibiting a high Pcyc value. As shown in Figure 10, three distinct binding models for seven solubilizers and BDE-28 can be obtained: (1) the micellar core adsorption model, where BDE-28 was localized within the micelle, exemplified by TX100 and TW80 with long hydrophilic chains; (2) the micellar-aqueous interface adsorption model, where BDE-28 presented in the micellar interface, such as Brij30, CTAB, SDBS, and SDS with short hydrophilic chains; and (3) the molecular encapsulation model, where BDE-28 was confined within the molecule, as seen in β-CD with its hydrophobic cavity structure. These diverse adsorption models corresponded to distinct microenvironments, reflecting varying interactions between BDE-28 and the organic hydrogen donors, which in turn influence hydrogen abstraction and cyclization reactions. In conclusion, through molecular dynamics simulations and organic region analysis, a detailed micellar microenvironment description was established. Combined with kinetic data, this approach elucidated how the position of BDE-28 in micelles affects the formation of 2,8-BDF.

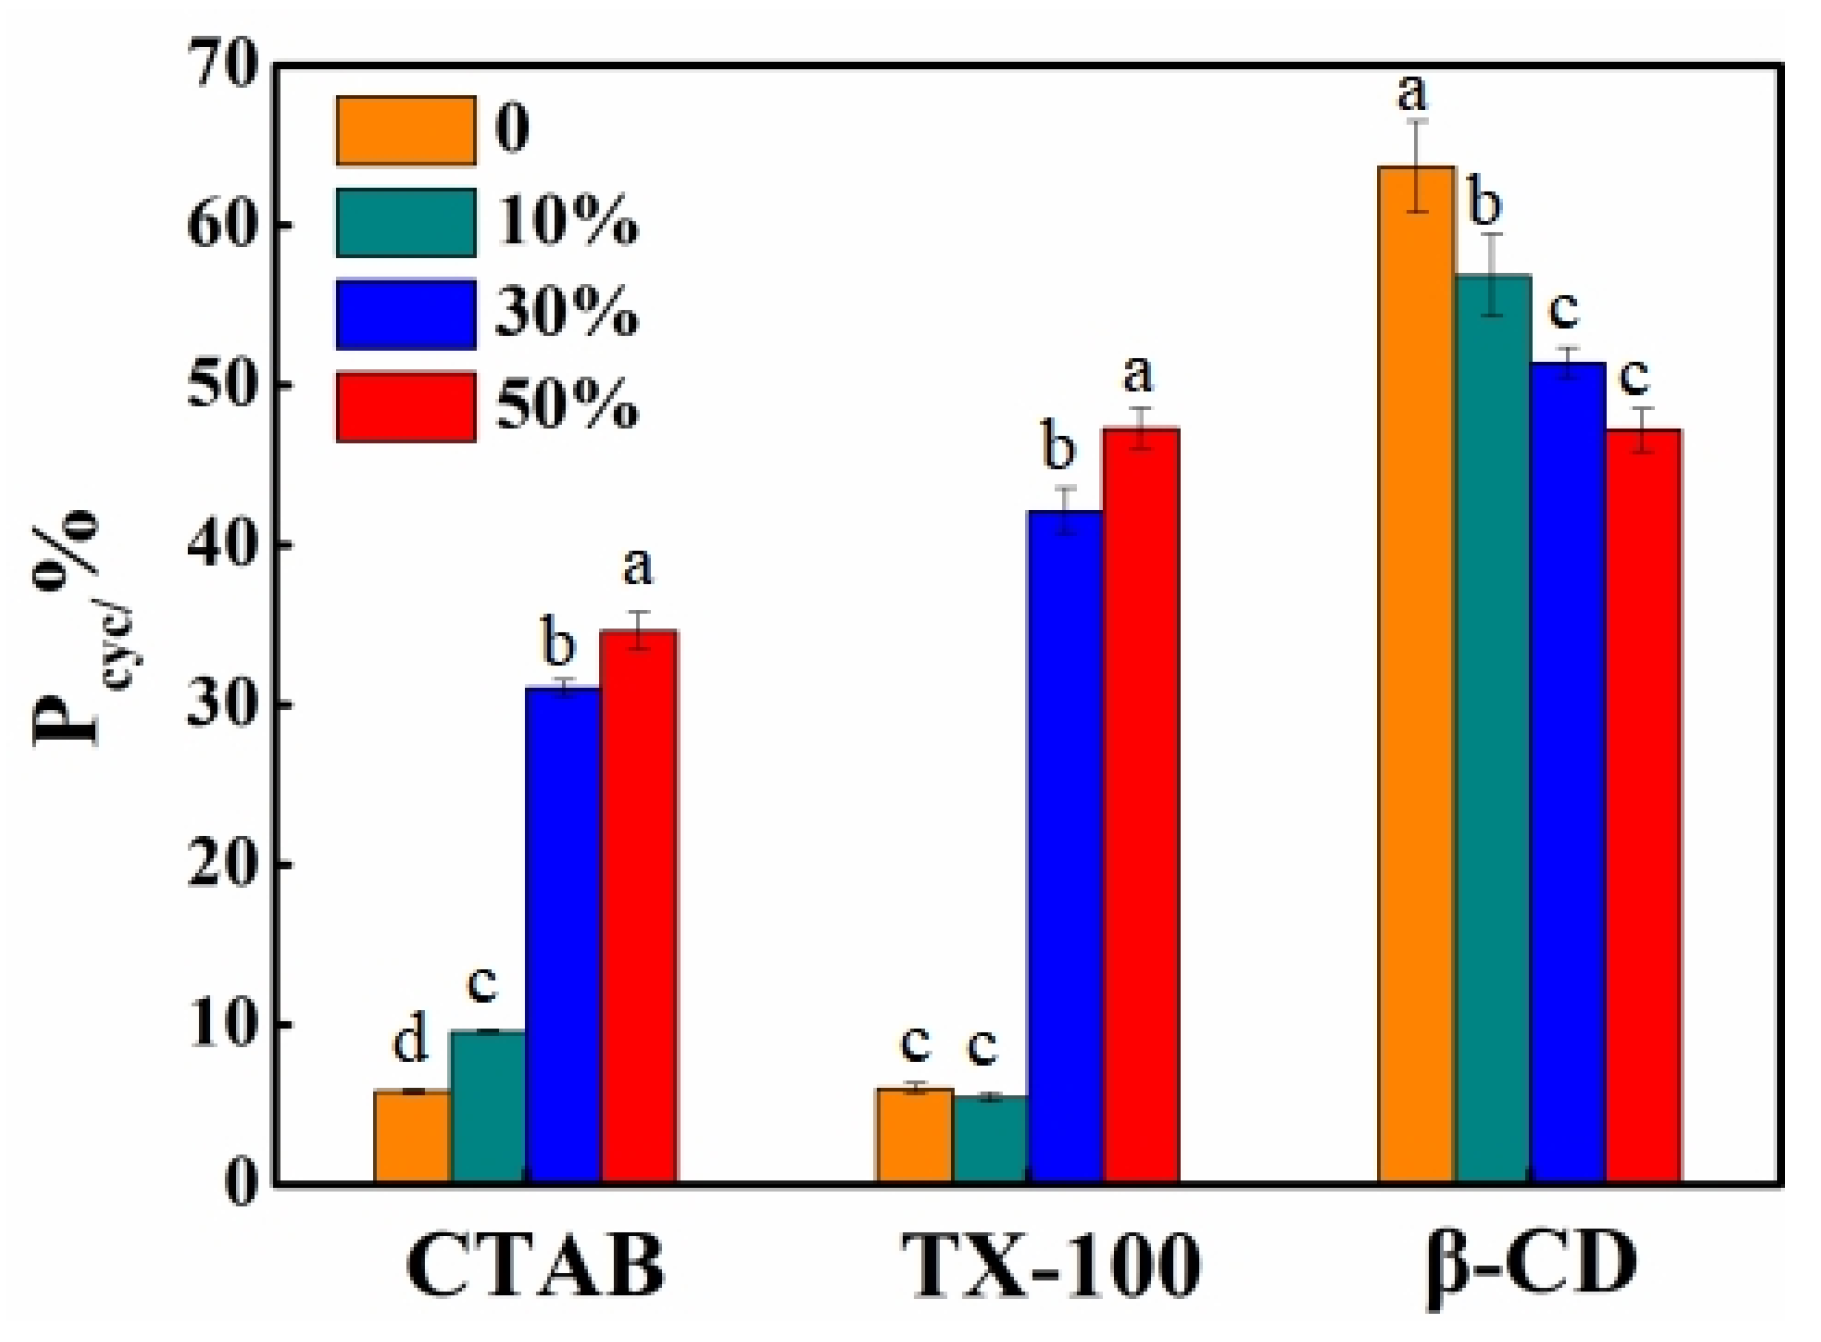
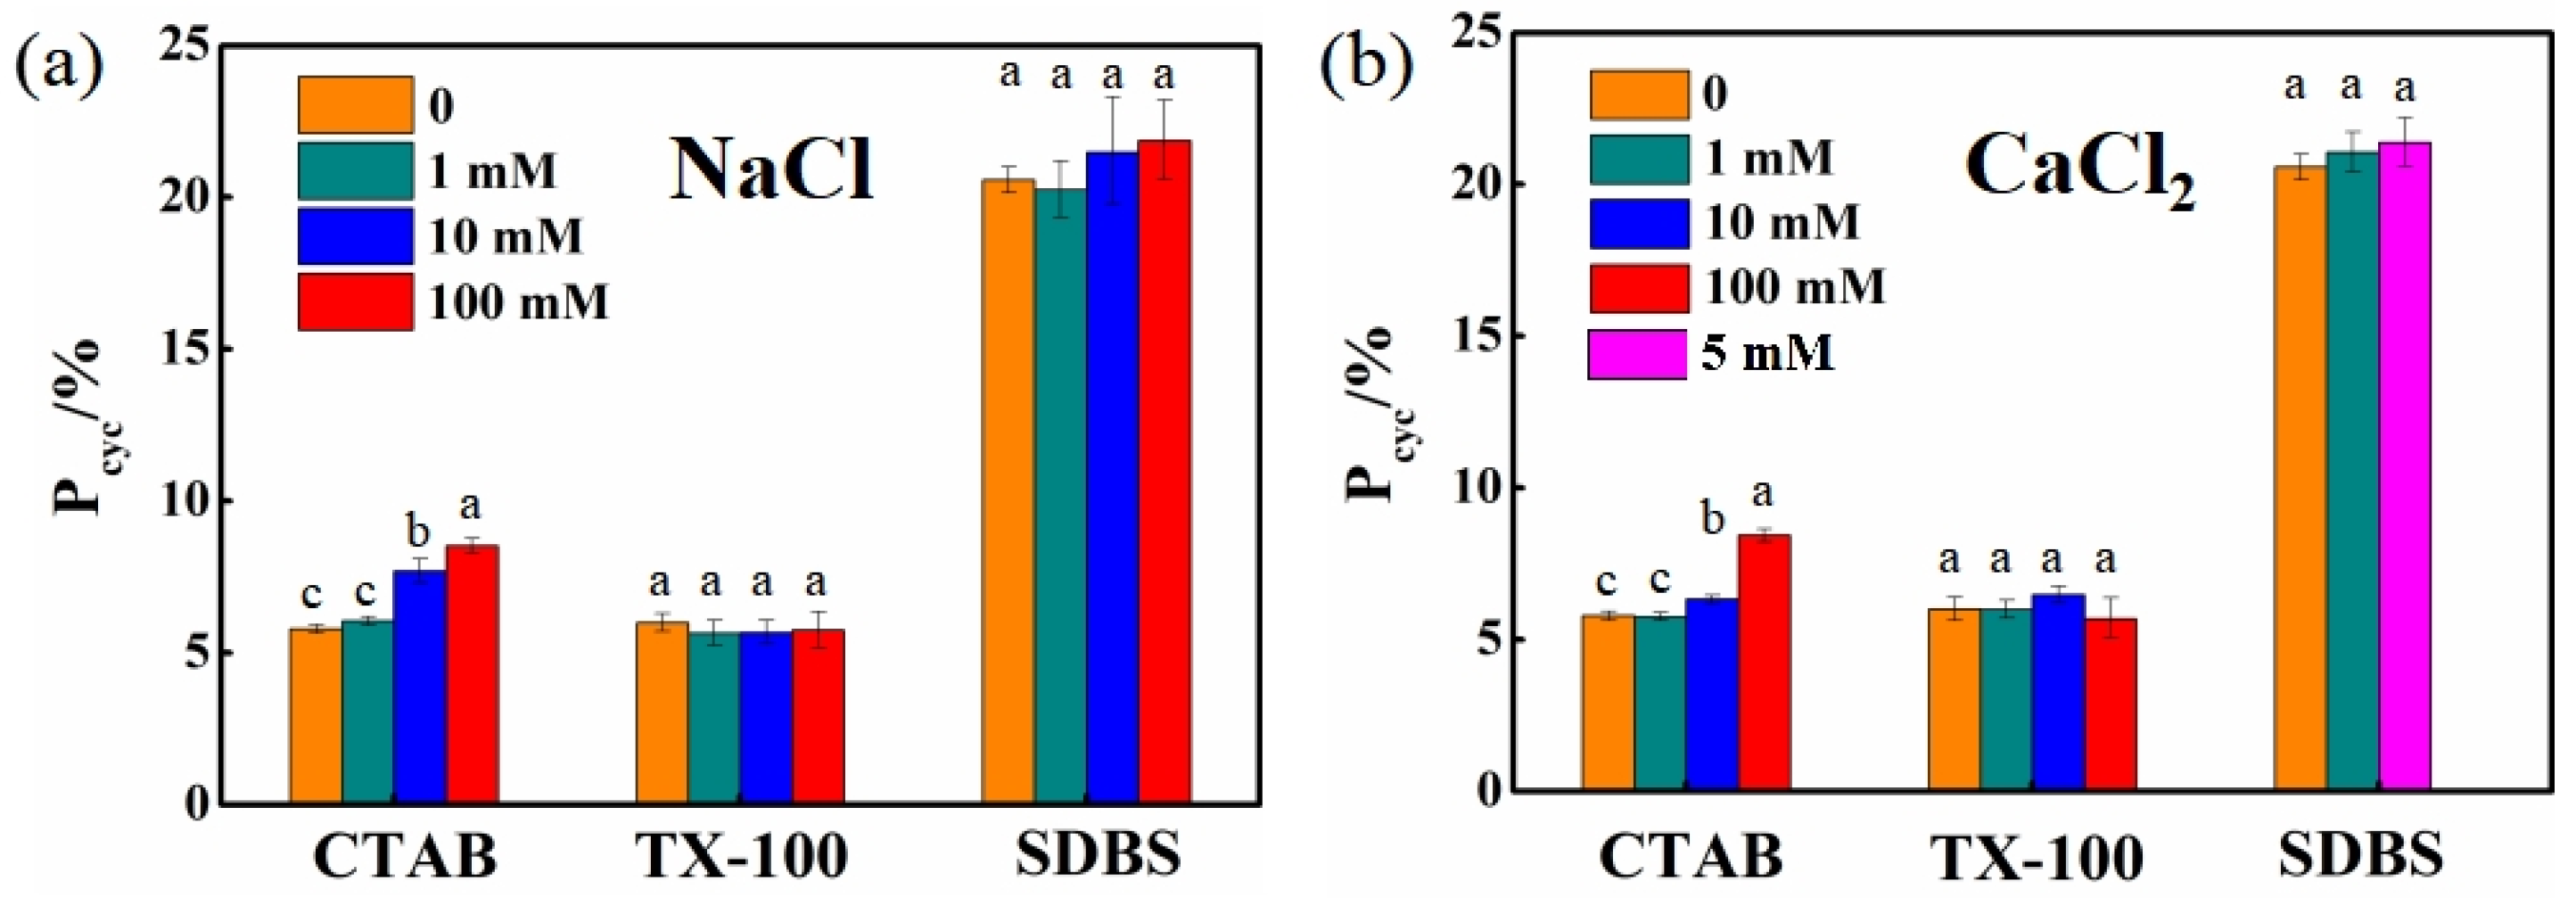
3.5. Effect of Inorganic Ions on 2,8-BDF Formation

The effects of representative ions (Na+, Ca2+, and Cl) on 2,8-BDF formation during BDE-28 photolysis in CTAB, TX100, and SDBS solutions at a concentration of 10 CMC were investigated. The degradation kinetics of BDE-28 and the formation kinetics of the four products in different solutions are presented in Figures S18–S22. Both Equations (1) and (2) excellently fit the experimental data. The derived rate constants and cyclization rates are summarized in Tables S4 and S5. The results demonstrated that the presence of ions had no significant effect on the Pcyc of BDE-28 in nonionic (TX100) and anionic (SDBS) surfactant solutions, but led to an increase in Pcyc for BDE-28 in cationic (CTAB) surfactant solutions. As shown in Figure 11, NaCl concentrations ranging from 1 to 100 mM had negligible effects on Pcyc in TX100 and SDBS solutions, with average values of 5.77 ± 0.14% and 21.04 ± 0.66%, respectively. Similarly, CaCl2 concentrations ranging from 1 to 100 mM and 1 to 5 mM also exhibited the minimal influence on Pcyc in TX100 and SDBS solutions, with average values of 6.05 ± 0.28% and 21.01 ± 0.33%, respectively. In contrast, as the concentrations of NaCl and CaCl2 increased from 0 to 100 mM, Pcyc in CTAB solutions increased from 5.79% to 8.52% and 8.44%, respectively, with average values of 7.01 ± 1.13% and 6.58 ± 1.10% across the tested ion concentrations.
Dynamic light scattering was employed to examine the micelle formation under the influence of ions (Figure 12 and Figure 13). Upon the addition of ions, the micelles in CTAB solutions became more concentrated within the 2–10 nm range, indicating the enhanced uniformity in particle size. The micelle size distribution narrowed from 2–20 nm to 5–10 nm in TX100 solutions, becoming more uniform and interconnected to form larger structures. CaCl2 induced the transformations in micelle structure in SDBS solutions, where the 1–4 nm micelles shifted to 3–10 nm and the 100–400 nm structures transitioned to 20–200 nm, suggesting an increase in micelle unit size and a more compact connection between micelles. At low concentrations (1–10 mM), NaCl had little effect on micelle morphology. However, at 100 mM, the 1–4 nm micelle structure expanded to 4–20 nm. These findings indicated that the addition of ions promoted the micelle formation in all three surfactant solutions, with a more pronounced effect observed in CTAB solutions. This suggested that the increase in Pcyc of BDE-28 in CTAB solutions was not attributable to micelle disruption. As analyzed in the previous section, the organic CTAB ion group contributed to the hydrogen abstraction reaction of BDE-15 radicals. The introduction of inorganic ions might compress the electric double layer on the ionic micelle surface [56] and lead to the decrease of the micellar surface potential of CTAB micelles with increasing ion strength [57]. The decrease in zeta potential of the CTAB micelle upon increasing the ion concentration was also observed in this study (Figure S23), indicating that inorganic ions gathered on the interface. This might decrease the abundance of the organic environment, thereby influencing the hydrogen abstraction reaction and resulting in variations in Pcyc. For SDBS, the BDE-28 would also be present in the ionic hydrophilic region. This region was inorganic and, thus, the ionic strength would not influence the organic microenvironment, though it would affect the ionic head-group. For TX100, BDE-28 is mostly present in the nonionic hydrophilic chain. Ions may not show electrostatic interaction with nonionic groups; therefore, they do not exhibit an influence on Pcyc. In summary, CTABs have hydrophilic chain properties that are both organic and ionic, which are influenced by ions and result in changes in Pcyc.

4. Conclusions

In this work, BDE-28 was selected as the model compound to systematically investigate the influence of various solubilizers on the photodegradation of BDE-28 in simulated soil-washing solutions, specifically focusing on the formation of 2,8-BDF from aryl radicals (BDE-15 radical cyclization). Among the investigated twelve solubilizer solutions, the photolysis of BDE-28 exhibited distinct 2,8-BDF formation characteristics. The 2,8-BDF formation rate was significantly influenced by the type of solubilizer, with values ranging from 1% to 28%. Specifically, the nonionic surfactants with fully organic structures, such as the TW80 and TX series, as well as the cationic surfactant CTAB, contributed to a relatively low 2,8-BDF formation rate (≈1–5%), making them potential candidates for the washing of PBDEs-contaminated soils and the subsequent photolysis treatment of washing solutions. In contrast, β-CD solution exhibited the highest 2,8-BDF formation rate (≈28%), indicating its lower favorability as a soil-washing solution for photolysis treatment. Additionally, nonionic surfactants of the Brij series and anionic surfactants such as SDBS and SDS showed a moderately high 2,8-BDF formation rate (≈7–17%). For these solutions, photolysis should be applied with caution due to their elevated cyclization tendencies. BDE-15 was a competitive product for 2,8-BDF and formed from the hydrogen abstraction of the BDE-15 radical. The cyclization rate can be applied to evaluate the 2,8-BDF formation potential influenced by the hydrogen donation ability of various solubilizers. In the simulated soil-washing solution, BDE-28 was sequestered within the organic microenvironment formed by the micelles of the solubilizer. This microenvironment significantly suppressed the formation of 2,8-BDF by enhancing the hydrogen abstraction reaction to form BDE-15. Under the influence of NaCl and CaCl2, the cyclization rate of BDE-28 in TX100 and SDBS solutions remained nearly unchanged. In contrast, the cyclization rate of BDE-28 in CTAB solution exhibited a slight increase, potentially attributable to the changes in the surface characteristics of the micelles. These changes may alter the retention state of BDE-28 within the organic ion groups, consequently influencing the hydrogen abstraction reaction and the cyclization rate.

Supplementary Materials

The following supporting information can be downloaded at: https://www.mdpi.com/article/10.3390/pr13061806/s1, Figures S1–S22: Generation kinetics of products and degradation kinetics of BDE-28 in various simulated soil-washing solutions; Figure S23: Zeta potential of 10 CMC CTAB solution containing NaCl or CaCl2 with various concentrations. Tables S1–S5: Degradation and transformation parameters of BDE-28 in various simulated soil-washing solutions.

Author Contributions

Writing—original draft preparation, C.Z.; writing—review and editing, X.D. and G.L.; investigation, C.Z., S.Z., J.W., J.L., S.W. and Q.Z.; supervision, X.D., X.T. and G.L.; funding acquisition, X.D. and G.L. All authors have read and agreed to the published version of the manuscript.

Funding

This work was supported by the National Natural Science Foundation of China (Nos. 42407502 and 42277380), and China Postdoctoral Science Foundation (2024M750948).

Data Availability Statement

The original contributions presented in this study are included in the article.

Acknowledgments

The authors are grateful to the ecological restoration research group for their support in the experiments, and are also grateful to the contribution of language polish by Waseem Hayat.

Conflicts of Interest

The authors declare no conflicts of interest.

References

  1. Abbasi, G.; Li, L.; Breivik, K. Global Historical Stocks and Emissions of PBDEs. Environ. Sci. Technol. 2019, 53, 6330–6340. [Google Scholar] [CrossRef] [PubMed]
  2. Wu, Z.; He, C.; Han, W.; Song, J.; Li, H.; Zhang, Y.; Jing, X.; Wu, W. Exposure pathways, levels and toxicity of polybrominated diphenyl ethers in humans: A review. Environ. Res. 2020, 187, 109531. [Google Scholar] [CrossRef] [PubMed]
  3. Gao, S.; Hong, J.; Yu, Z.; Wang, J.; Yang, G.; Sheng, G.; Fu, J. Polybrominated diphenyl ethers in surface soils from e-waste recycling areas and industrial areas in South China: Concentration levels, congener profile, and inventory. Environ. Toxicol. Chem. 2011, 30, 2688–2696. [Google Scholar] [CrossRef] [PubMed]
  4. Leung, A.O.W.; Luksemburg, W.J.; Wong, A.S.; Wong, M.H. Spatial distribution of polybrominated diphenyl ethers and polychlorinated dibenzo-p-dioxins and dibenzofurans in soil and combusted residue at Guiyu, an electronic waste recycling site in southeast China. Environ. Sci. Technol. 2007, 41, 2730–2737. [Google Scholar] [CrossRef]
  5. Liu, M.; Huang, B.; Bi, X.H.; Ren, Z.F.; Sheng, G.Y.; Fu, J.M. Heavy metals and organic compounds contamination in soil from an e-waste region in South China. Environ. Sci.-Process. Impacts 2013, 15, 919–929. [Google Scholar] [CrossRef]
  6. Ma, J.; Addink, R.; Yun, S.; Cheng, J.; Wang, W.; Kannan, K. Polybrominated Dibenzo-p-dioxins/Dibenzofurans and Polybrominated Diphenyl Ethers in Soil, Vegetation, Workshop-Floor Dust, and Electronic Shredder Residue from an Electronic Waste Recycling Facility and in Soils from a Chemical Industrial Complex in Eastern China. Environ. Sci. Technol. 2009, 43, 7350–7356. [Google Scholar] [CrossRef]
  7. Tang, X.; Zeng, B.; Hashmi, M.Z.; Long, D.; Yu, B.; Ullah, N.; Shen, C.; Chen, Y. PBDEs and PCDD/Fs in surface soil taken from the Taizhou e-waste recycling area, China. Chem. Ecol. 2014, 30, 245–251. [Google Scholar] [CrossRef]
  8. Wang, J.X.; Liu, L.L.; Wang, J.F.; Pan, B.S.; Fu, X.X.; Zhang, G.; Zhang, L.; Lin, K.F. Distribution of metals and brominated flame retardants (BFRs) in sediments, soils and plants from an informal e-waste dismantling site, South China. Environ. Sci. Pollut. Res. 2015, 22, 1020–1033. [Google Scholar] [CrossRef]
  9. Wang, S.; Zhang, S.Z.; Huang, H.L.; Niu, Z.C.; Han, W. Characterization of polybrominated diphenyl ethers (PBDEs) and hydroxylated and methoxylated PBDEs in soils and plants from an e-waste area, China. Environ. Pollut. 2014, 184, 405–413. [Google Scholar] [CrossRef]
  10. Zhang, S.H.; Xu, X.J.; Wu, Y.S.; Ge, J.J.; Li, W.Q.; Huo, X. Polybrominated diphenyl ethers in residential and agricultural soils from an electronic waste polluted region in South China: Distribution, compositional profile, and sources. Chemosphere 2014, 102, 55–60. [Google Scholar] [CrossRef]
  11. Alabi, O.A.; Bakare, A.A.; Xu, X.J.; Li, B.; Zhang, Y.L.; Huo, X. Comparative evaluation of environmental contamination and DNA damage induced by electronic-waste in Nigeria and China. Sci. Total Environ. 2012, 423, 62–72. [Google Scholar] [CrossRef] [PubMed]
  12. Labunsk, I.; Harrad, S.; Santillo, D.; Johnston, P.; Brigden, K. Levels and distribution of polybrominated diphenyl ethers in soil, sediment and dust samples collected from various electronic waste recycling sites within Guiyu town, southern China. Environ. Sci.-Process. Impacts 2013, 15, 503–511. [Google Scholar] [CrossRef] [PubMed]
  13. Liu, Q.; Jiao, X.; Wang, X.; Lu, G.; Gai, N.; Yang, Y. Spatial Distribution of PBDEs in Topsoils from Electronic Waste Dismantling Sites and the Surrounding Areas in Guiyu, Guangdong Province. Rock Miner. Anal. 2012, 31, 1006–1014. [Google Scholar]
  14. Shah, A.; Shahzad, S.; Munir, A.; Nadagouda, M.N.; Khan, G.S.; Shams, D.F.; Dionysiou, D.D.; Rana, U.A. Micelles as Soil and Water Decontamination Agents. Chem. Rev. 2016, 116, 6042–6074. [Google Scholar] [CrossRef]
  15. Lamichhane, S.; Bal Krishna, K.C.; Sarukkalige, R. Surfactant-enhanced remediation of polycyclic aromatic hydrocarbons: A review. J. Environ. Manag. 2017, 199, 46–61. [Google Scholar] [CrossRef]
  16. Pei, G.; Zhu, Y.; Cai, X.; Shi, W.; Li, H. Surfactant flushing remediation of o-dichlorobenzene and p-dichlorobenzene contaminated soil. Chemosphere 2017, 185, 1112–1121. [Google Scholar] [CrossRef]
  17. Karthick, A.; Roy, B.; Chattopadhyay, P. A review on the application of chemical surfactant and surfactant foam for remediation of petroleum oil contaminated soil. J. Environ. Manag. 2019, 243, 187–205. [Google Scholar] [CrossRef]
  18. Trellu, C.; Mousset, E.; Pechaud, Y.; Huguenot, D.; van Hullebusch, E.D.; Esposito, G.; Oturan, M.A. Removal of hydrophobic organic pollutants from soil washing/flushing solutions: A critical review. J. Hazard. Mater. 2016, 306, 149–174. [Google Scholar] [CrossRef]
  19. Mao, X.; Jiang, R.; Xiao, W.; Yu, J. Use of surfactants for the remediation of contaminated soils: A review. J. Hazard. Mater. 2015, 285, 419–435. [Google Scholar] [CrossRef]
  20. Yang, X.; Lu, G.; She, B.; Liang, X.; Yin, R.; Guo, C.; Yi, X.; Dang, Z. Cosolubilization of 4,4′-dibromodiphenyl ether, naphthalene and pyrene mixtures in various surfactant micelles. Chem. Eng. J. 2015, 260, 74–82. [Google Scholar] [CrossRef]
  21. Trellu, C.; Pechaud, Y.; Oturan, N.; Mousset, E.; van Hullebusch, E.D.; Huguenot, D.; Oturan, M.A. Remediation of soils contaminated by hydrophobic organic compounds: How to recover extracting agents from soil washing solutions? J. Hazard. Mater. 2021, 404, 124137. [Google Scholar] [CrossRef] [PubMed]
  22. Ma, Y.; Chen, J.; Du, X.; Xie, C.; Zhou, J.; Tao, X.; Dang, Z.; Lu, G. Efficient removal of polybrominated diphenyl ethers from soil washing effluent by dummy molecular imprinted adsorbents: Selectivity and mechanisms. J. Environ. Sci. 2023, 129, 45–57. [Google Scholar] [CrossRef] [PubMed]
  23. Zheng, Z.; Lu, G.; Wang, R.; Huang, K.; Tao, X.; Yang, Y.; Zou, M.; Xie, Y.; Yin, H.; Shi, Z.; et al. Effects of surfactant on the degradation of 2,2′,4,4′-tetrabromodiphenyl ether (BDE-47) by nanoscale Ag/Fe particles: Kinetics, mechanisms and intermediates. Environ. Pollut. 2019, 245, 780–788. [Google Scholar] [CrossRef] [PubMed]
  24. Li, H.; Huang, G.; Wang, M. Enhanced solubilization and reductive degradation of 2,2′,4,4′- tretrabromodiphenyl ether by PAC-Pd/Fe nanoparticles in the presence of surfactant. Environ. Sci. Pollut. Res. 2020, 27, 5085–5096. [Google Scholar] [CrossRef]
  25. Wei, L.; Zhou, B.; Xiao, K.; Yang, B.; Yu, G.; Li, J.; Zhu, C.; Zhang, J.; Duan, H. Highly efficient degradation of 2,2′,4,4′-tetrabromodiphenyl ether through combining surfactant-assisted Zn0 reduction with subsequent Fenton oxidation. J. Hazard. Mater. 2020, 385, 121551. [Google Scholar] [CrossRef]
  26. Liang, D.-w.; Yang, Y.-h.; Xu, W.-w.; Peng, S.-k.; Lu, S.-f.; Xiang, Y. Nonionic surfactant greatly enhances the reductive debromination of polybrominated diphenyl ethers by nanoscale zero-valent iron: Mechanism and kinetics. J. Hazard. Mater. 2014, 278, 592–596. [Google Scholar] [CrossRef]
  27. Huang, K.; Liu, H.; He, J.; He, Y.; Tao, X.; Yin, H.; Dang, Z.; Lu, G. Application of Ag/TiO2 in photocatalytic degradation of 2,2′,4,4′-tetrabromodiphenyl ether in simulated washing waste containing Triton X-100. J. Environ. Chem. Eng. 2021, 9, 105077. [Google Scholar] [CrossRef]
  28. Huo, L.; Zhao, C.; Gu, T.; Yan, M.; Zhong, H. Aerobic and anaerobic biodegradation of BDE-47 by bacteria isolated from an e-waste-contaminated site and the effect of various additives. Chemosphere 2022, 294, 133739. [Google Scholar] [CrossRef]
  29. Li, X.; Huang, J.; Fang, L.; Yu, G.; Lin, H.; Wang, L. Photodegradation of 2,2′,4,4′-tetrabromodiphenyl ether in nonionic surfactant solutions. Chemosphere 2008, 73, 1594–1601. [Google Scholar] [CrossRef]
  30. Li, X.; Huang, J.; Yu, G.; Deng, S. Photodestruction of BDE-99 in micellar solutions of nonionic surfactants of Brij 35 and Brij 58. Chemosphere 2010, 78, 752–759. [Google Scholar] [CrossRef]
  31. Huang, K.; Lu, G.; Zheng, Z.; Wang, R.; Tang, T.; Tao, X.; Cai, R.; Dang, Z.; Wu, P.; Yin, H. Photodegradation of 2,4,4′-tribrominated diphenyl ether in various surfactant solutions: Kinetics, mechanisms and intermediates. Environ. Sci.-Process. Impacts 2018, 20, 806–812. [Google Scholar] [CrossRef] [PubMed]
  32. Huang, K.; Liang, J.; Jafvert, C.T.; Li, Q.; Chen, S.; Tao, X.; Zou, M.; Dang, Z.; Lu, G. Effects of ferric ion on the photo-treatment of nonionic surfactant Brij35 washing waste containing 2,2′,4,4′-terabromodiphenyl ether. J. Hazard. Mater. 2021, 415, 125572. [Google Scholar] [CrossRef] [PubMed]
  33. Santos, M.S.F.; Alves, A.; Madeira, L.M. Chemical and photochemical degradation of polybrominated diphenyl ethers in liquid systems—A review. Water Res. 2016, 88, 39–59. [Google Scholar] [CrossRef] [PubMed]
  34. Yao, B.; Luo, Z.; Zhi, D.; Hou, D.; Luo, L.; Du, S.; Zhou, Y. Current progress in degradation and removal methods of polybrominated diphenyl ethers from water and soil: A review. J. Hazard. Mater. 2021, 403, 123674. [Google Scholar] [CrossRef]
  35. Wang, R.; Tang, T.; Xie, J.B.; Tao, X.Q.; Huang, K.B.; Zou, M.Y.; Yin, H.; Dang, Z.; Lu, G.N. Debromination of polybrominated diphenyl ethers (PBDEs) and their conversion to polybrominated dibenzofurans (PBDFs) by UV light: Mechanisms and pathways. J. Hazard. Mater. 2018, 354, 1–7. [Google Scholar] [CrossRef]
  36. Du, X.; Li, H.; Liang, J.; Wang, R.; Huang, K.; Hayat, W.; Cai, L.; Tao, X.; Dang, Z.; Lu, G. Hydrogen-Donor-Controlled Polybrominated Dibenzofuran (PBDF) Formation from Polybrominated Diphenyl Ether (PBDE) Photolysis in Solutions: Competition Mechanisms of Radical-Based Cyclization and Hydrogen Abstraction Reactions. Environ. Sci. Technol. 2023, 57, 7777–7788. [Google Scholar] [CrossRef]
  37. Morillo, E.; Madrid, F.; Lara-Moreno, A.; Villaverde, J. Soil bioremediation by cyclodextrins. A review. Int. J. Pharm. 2020, 591, 119943. [Google Scholar] [CrossRef]
  38. Van Der Spoel, D.; Lindahl, E.; Hess, B.; Groenhof, G.; Mark, A.E.; Berendsen, H.J.C. GROMACS: Fast, flexible, and free. J. Comput. Chem. 2005, 26, 1701–1718. [Google Scholar] [CrossRef]
  39. Abraham, M.J.; Murtola, T.; Schulz, R.; Páll, S.; Smith, J.C.; Hess, B.; Lindahl, E. GROMACS: High performance molecular simulations through multi-level parallelism from laptops to supercomputers. SoftwareX 2015, 1–2, 19–25. [Google Scholar] [CrossRef]
  40. Frisch, M.J.; Trucks, G.W.; Schlegel, H.B.; Scuseria, G.E.; Robb, M.A.; Cheeseman, J.R.; Scalmani, G.; Barone, V.; Mennucci, B.; Petersson, G.A.; et al. Gaussian 16, Revision A.03; Gaussian, Inc.: Wallingford, CT, USA, 2016. [Google Scholar]
  41. Zhao, Y.; Truhlar, D.G. The M06 suite of density functionals for main group thermochemistry, thermochemical kinetics, noncovalent interactions, excited states, and transition elements: Two new functionals and systematic testing of four M06-class functionals and 12 other functionals. Theor. Chem. Acc. 2008, 120, 215–241. [Google Scholar] [CrossRef]
  42. Schäfer, A.; Huber, C.; Ahlrichs, R. Fully optimized contracted Gaussian basis sets of triple zeta valence quality for atoms Li to Kr. J. Chem. Phys. 1994, 100, 5829–5835. [Google Scholar] [CrossRef]
  43. Grimme, S.; Antony, J.; Ehrlich, S.; Krieg, H. A consistent and accurate ab initio parametrization of density functional dispersion correction (DFT-D) for the 94 elements H-Pu. J. Chem. Phys. 2010, 132, 154104. [Google Scholar] [CrossRef] [PubMed]
  44. Marenich, A.V.; Cramer, C.J.; Truhlar, D.G. Universal solvation model based on solute electron density and on a continuum model of the solvent defined by the bulk dielectric constant and atomic surface tensions. J. Chem. Phys. B 2009, 113, 6378–6396. [Google Scholar] [CrossRef] [PubMed]
  45. Bannwarth, C.; Caldeweyher, E.; Ehlert, S.; Hansen, A.; Pracht, P.; Seibert, J.; Spicher, S.; Grimme, S. Extended tight-binding quantum chemistry methods. Wiley Interdiscip. Rev. Comput. Mol. Sci. 2021, 11, e1493. [Google Scholar] [CrossRef]
  46. Stephens, P.J.; Devlin, F.J.; Chabalowski, C.F.; Frisch, M.J. Ab initio calculation of vibrational absorption and circular dichroism spectra using density functional force fields. J. Phys. Chem. 1994, 98, 11623–11627. [Google Scholar] [CrossRef]
  47. Weigend, F.; Ahlrichs, R. Balanced basis sets of split valence, triple zeta valence and quadruple zeta valence quality for H to Rn: Design and assessment of accuracy. Phys. Chem. Chem. Phys. 2005, 7, 3297–3305. [Google Scholar] [CrossRef]
  48. Martínez, L.; Andrade, R.; Birgin, E.G.; Martínez, J.M. PACKMOL: A package for building initial configurations for molecular dynamics simulations. J. Comput. Chem. 2009, 30, 2157–2164. [Google Scholar] [CrossRef]
  49. Palazzesi, F.; Calvaresi, M.; Zerbetto, F. A molecular dynamics investigation of structure and dynamics of SDS and SDBS micelles. Soft Matter 2011, 7, 9148–9156. [Google Scholar] [CrossRef]
  50. Amani, A.; York, P.; de Waard, H.; Anwar, J. Molecular dynamics simulation of a polysorbate 80 micelle in water. Soft Matter 2011, 7, 2900–2908. [Google Scholar] [CrossRef]
  51. De Nicola, A.; Kawakatsu, T.; Rosano, C.; Celino, M.; Rocco, M.; Milano, G. Self-Assembly of Triton X-100 in Water Solutions: A Multiscale Simulation Study Linking Mesoscale to Atomistic Models. J. Chem. Theory Comput. 2015, 11, 4959–4971. [Google Scholar] [CrossRef]
  52. Lu, T.; Chen, F. Multiwfn: A multifunctional wavefunction analyzer. J. Comput. Chem. 2012, 33, 580–592. [Google Scholar] [CrossRef] [PubMed]
  53. Lu, T. Sobtop, Version 1.0(dev3). Available online: http://sobereva.com/soft/Sobtop (accessed on 2 April 2022).
  54. Bezares-Cruz, J.; Jafvert, C.T.; Hua, I. Solar photodecomposition of decabromodiphenyl ether: Products and quantum yield. Environ. Sci. Technol. 2004, 38, 4149–4156. [Google Scholar] [CrossRef] [PubMed]
  55. Erickson, P.R.; Grandbois, M.; Arnold, W.A.; McNeill, K. Photochemical Formation of Brominated Dioxins and Other Products of Concern from Hydroxylated Polybrominated Diphenyl Ethers (OH-PBDEs). Environ. Sci. Technol. 2012, 46, 8174–8180. [Google Scholar] [CrossRef] [PubMed]
  56. Rosen, M.J.; Zhou, Q. Surfactant−Surfactant Interactions in Mixed Monolayer and Mixed Micelle Formation. Langmuir 2001, 17, 3532–3537. [Google Scholar] [CrossRef]
  57. Johnson, S.B.; Drummond, C.J.; Scales, P.J.; Nishimura, S. Electrical double layer properties of hexadecyltrimethylammonium chloride surfaces in aqueous solution. Colloids Surf. A 1995, 103, 195–206. [Google Scholar] [CrossRef]
Figure 1. BDE-28 and the main photolysis products.
Processes 13 01806 g001
Figure 2. Structures of various solubilizers.
Processes 13 01806 g002
Figure 3. BDE-28 degradation features in various solubilizer solutions. (a) First-order rate constants of BDE-28 photolysis in solutions containing 2 CMC solubilizers (5 mM for β-CD), (b) average 2,8-BDF formation rate (PBDF) in solutions containing solubilizers with concentrations of 2 CMC, 5 CMC, and 10 CMC (2.5 mM, 5 mM and 10 mM for β-CD). One-way ANOVA analysis results are indicated as a–h upon column.
Processes 13 01806 g003
Figure 4. BDE-15 and 2,8-BDF formation features in solutions containing solubilizers with concentrations of 2 CMC, 5 CMC, and 10 CMC (2.5 mM, 5 mM and 10 mM for β-CD). (a) Cyclization rate (Pcyc), (b) ratio between formation rates of BDE-15 and 2,8-BDF. One-way ANOVA analysis was separately conducted for each solubilizer at three concentrations, the results are indicated as a and b upon column.
Processes 13 01806 g004
Figure 5. Cyclization rate (Pcyc) of BDE-28 in solutions with solubilizer at various concentrations. (a) In CTAB solutions, (b) in TX100 solutions. One-way ANOVA analysis results are indicated as a–c upon column.
Processes 13 01806 g005
Figure 6. Cyclization rate (Pcyc) of BDE-28 in three solubilizer solutions with ACN of various concentrations. One-way ANOVA analysis was separately conducted for each solubilizer, and the results are indicated as a–d upon column.
Processes 13 01806 g006
Figure 7. Dynamic light scattering of (a) 10 CMC TX100 and (b) 10 CMC CTAB solutions with ACN of various concentrations.
Processes 13 01806 g007
Figure 8. MD simulation of TX100 and CTAB micelles in 50% ACN solution. The chain structures indicate TX100 and CTAB molecules, the red dots around TX100 and CTAB indicate water molecules, and green dots around TX100 and CTAB indicate ACN molecules.
Processes 13 01806 g008
Figure 9. Distribution characteristics of BDE-28 in micelles obtained from MD simulation.
Processes 13 01806 g009
Figure 10. Combination models of BDE-28 and solubilizers. The color of solubilizer molecule skeleton is indicated as follows: the green denotes carbon, the red denotes oxygen, the yellow denotes sulfur, and the blue denotes nitrogen.
Processes 13 01806 g010
Figure 11. Effect of NaCl and CaCl2 on Pcyc of BDE-28 in 10 CMC CTAB, 10 CMC TX100 and 10 CMC SDBS solutions. (a) 1–100 mM NaCl; (b) 1–100 mM CaCl2. One-way ANOVA analysis was separately conducted for each solubilizer, and the results are indicated as a–c upon column.
Processes 13 01806 g011
Figure 12. Dynamic light scattering of solubilizer solution with 0–100 mM NaCl. (a) 10 CMC CTAB, (b) 10 CMC TX100 and (c) 10 CMC SDBS.
Processes 13 01806 g012
Figure 13. Dynamic light scattering of solubilizer solution with 0–100 mM CaCl2. (a) 10 CMC CTAB, (b) 10 CMC SDBS and (c) 10 CMC TX100.
Processes 13 01806 g013
Table 1. Molecular weight of solubilizers and CMC of surfactants.
SolubilizerMolecular WeightCMC/μM
TX100647.0270
TX45382.5360
TX165910.0456
TX4051966.0793
TW801310.025
CTAB364.5786
SDBS348.52389
SDS288.47767
Brij30362.537
Brij351199.590
β-CD1135.0-
Disclaimer/Publisher’s Note: The statements, opinions and data contained in all publications are solely those of the individual author(s) and contributor(s) and not of MDPI and/or the editor(s). MDPI and/or the editor(s) disclaim responsibility for any injury to people or property resulting from any ideas, methods, instructions or products referred to in the content.

