Article

Experimental and Numerical Study of Multi-Cluster Fracturing in Horizontal Wells for Low-Permeability Reservoirs

1
Well Services Branch of CNPC Offshore Engineering Co., Ltd., Tianjin 300451, China
2
School of Petroleum Engineering, China University of Petroleum (East China), Qingdao 266580, China
*
Author to whom correspondence should be addressed.
Processes 2025, 13(6), 1693; https://doi.org/10.3390/pr13061693
Submission received: 30 April 2025 / Revised: 21 May 2025 / Accepted: 26 May 2025 / Published: 28 May 2025
(This article belongs to the Section Energy Systems)

Abstract

:
Hydraulic fracturing is a crucial technology for developing unconventional oil and gas resources, widely used to enhance low-permeability reservoirs. To clarify the complex fracture propagation behavior in the Shahejie Formation III of the Dagang Oilfield, Bohai Bay Basin, a typical low-permeability reservoir, we conducted laboratory experiments using physical models along with numerical simulations based on the cohesive element method. These approaches were used to study the impact of various formation and operational parameters on the fracture morphology of multi-cluster hydraulic fracturing, including formation properties (permeability, elastic modulus, Poisson’s ratio) and operational conditions (in situ stress, perforation cluster number, injection rate, and fracturing fluid viscosity). The results indicate that an increased horizontal stress difference coefficient can induce a transition from symmetric bi-wing fractures to asymmetric multi-branch fractures. Increasing the number of perforation clusters leads to stress interference between fractures, enhancing fracture complexity. Higher fracturing fluid injection rates promote the formation of long and wide main fractures but reduce the complexity of the fracture network, while fracturing fluid viscosity has a weaker influence on fracture morphology. Among the investigated factors, the number of perforation clusters and the injection rate exhibited a strong control on the fracture parameters. Notably, the variation trends of the fracture parameters with respect to the influencing factors in both experiments and numerical simulations were generally consistent. This study provides theoretical support for complex fracture network prediction and fracturing design optimization for low-permeability reservoirs.

1. Introduction

With the profound transformation of the global energy structure, the economically effective development of low-permeability reservoirs, such as those of shale gas and tight oil, has become a critical strategy for ensuring national energy security [1,2]. Horizontal well multi-cluster fracturing (HWMCF) is a core technique for the commercial exploitation of unconventional reservoirs like those of tight sandstone and shale oil, and it is one of the primary measures for enhancing oil and gas reservoir productivity [3,4]. The effectiveness of fracturing directly determines the technical and economic feasibility of unconventional resource development. In practical engineering applications, however, issues such as stress shadowing effects between fractures, competition for fracture propagation paths, and fracture formation stability often lead to non-uniform fracture propagation and limited fracturing effectiveness, becoming key technical bottlenecks that restrict the efficiency of HWMCF. The propagation of multi-cluster hydraulic fractures involves complex physical and mechanical processes, including rock deformation and fracture induced by high-pressure fluids, energy dissipation due to viscous fluid flow within fractures, dynamic propagation of fracture tips, and stress interactions between multiple hydraulic fractures [5,6,7,8,9,10,11,12]. In reservoirs characterized by low permeability and complex in-situ stress fields, complex fracture propagation patterns and limited stimulated reservoir volume after fracturing can lead to unsatisfactory production enhancement [13,14,15]. Therefore, in-depth research on fracture propagation behavior and the controlling factors of multi-cluster fracturing is of significant theoretical and engineering application value for optimizing the fracturing parameter design and improving the fracturing effectiveness [16].
Extensive research has been conducted by scholars worldwide on the mechanisms of hydraulic fracture propagation. Chen [17], based on fracture mechanics theory, constructed a mixed-mode fracture criterion for hydraulic fracture propagation and derived a quantitative relationship between the fracture turning angle and the stress intensity factor. This study revealed that horizontal stress difference, fracturing fluid flow rate, fluid viscosity, and the initial approach angle of natural fractures significantly influence fracture path deviation, providing insight into fracture deflection mechanisms in complex formations. Wang et al. [18] verified the accuracy of numerical models by comparing physical fracturing simulation experiments, numerical simulation results, and field fracturing data, demonstrating that the numerical simulation results were in good agreement with the experimental results. Hou et al. [19] studied the influence of bedding, in situ stress, and perforation parameters on fracture propagation paths in shale horizontal wells through large-scale true triaxial simulation experiments, finding that hydraulic fractures exhibit bidirectional extension from the incision, and high-rate fracturing can overcome the limitations of bedding cementation, extending the main fracture but suppressing the complexity of the fracture network. Zheng et al. [20] investigated the penetration behavior of hydraulic fractures on shale bedding planes with parameters like fracturing fluid viscosity and injection rate, utilizing the discrete element method in conjunction with physical experiments. The results showed that the higher the fracturing fluid viscosity, the more easily the fracturing fractures penetrate the layers to form complex fracture networks, and dimensionless criteria were proposed to judge the fracture penetration law. Zhou et al. [21] clarified the rock mechanical anisotropy characteristics of shale samples with developed bedding through indoor rock mechanics experiments and direct shear experiments and combined this strategy with the discrete element method to study the influence of bedding on the propagation path and complexity of hydraulic fractures in shale reservoirs with developed bedding. It was found that opening high-density bedding can increase the fracture complexity of the stimulated volume, but the fracture height and length are significantly suppressed. Jafari et al. [22] proposed a fully coupled fluid–solid coupling model based on the extended finite element method and verified the reliability of the model through experimental data. Liu et al. [23] revealed the influence of pre-fractured fracture state, stage spacing, perforation parameters, horizontal stress difference, and cementing quality on the fracture propagation morphology in the multi-stage fracturing of horizontal wells in tight sandstone based on true triaxial experiments. Furthermore, they proposed optimization strategies for construction parameters based on pressure curve features to identify effective fracturing stages and improve fracture uniformity and efficiency.
However, studies on the propagation patterns of multi-cluster simultaneous fracturing in horizontal wells under complex geological conditions are relatively limited, and the understanding of the dominant factors affecting multi-cluster fracture propagation is not yet deep enough. This paper focuses on the reservoir characteristics of the Shahejie Formation III in the Dagang Oilfield, prepares fracturing samples under realistic geological mechanical conditions, carries out a series of physical fracturing simulation experiments, and further uses the cohesive element numerical simulation method to quantitatively analyze the related parameters of multi-cluster fracturing fractures, focusing on the fracture propagation law and its main controlling factors. The study aims to provide theoretical guidance and technical support for the effective development of low-permeability oil reservoirs in this area.

2. Materials and Methods

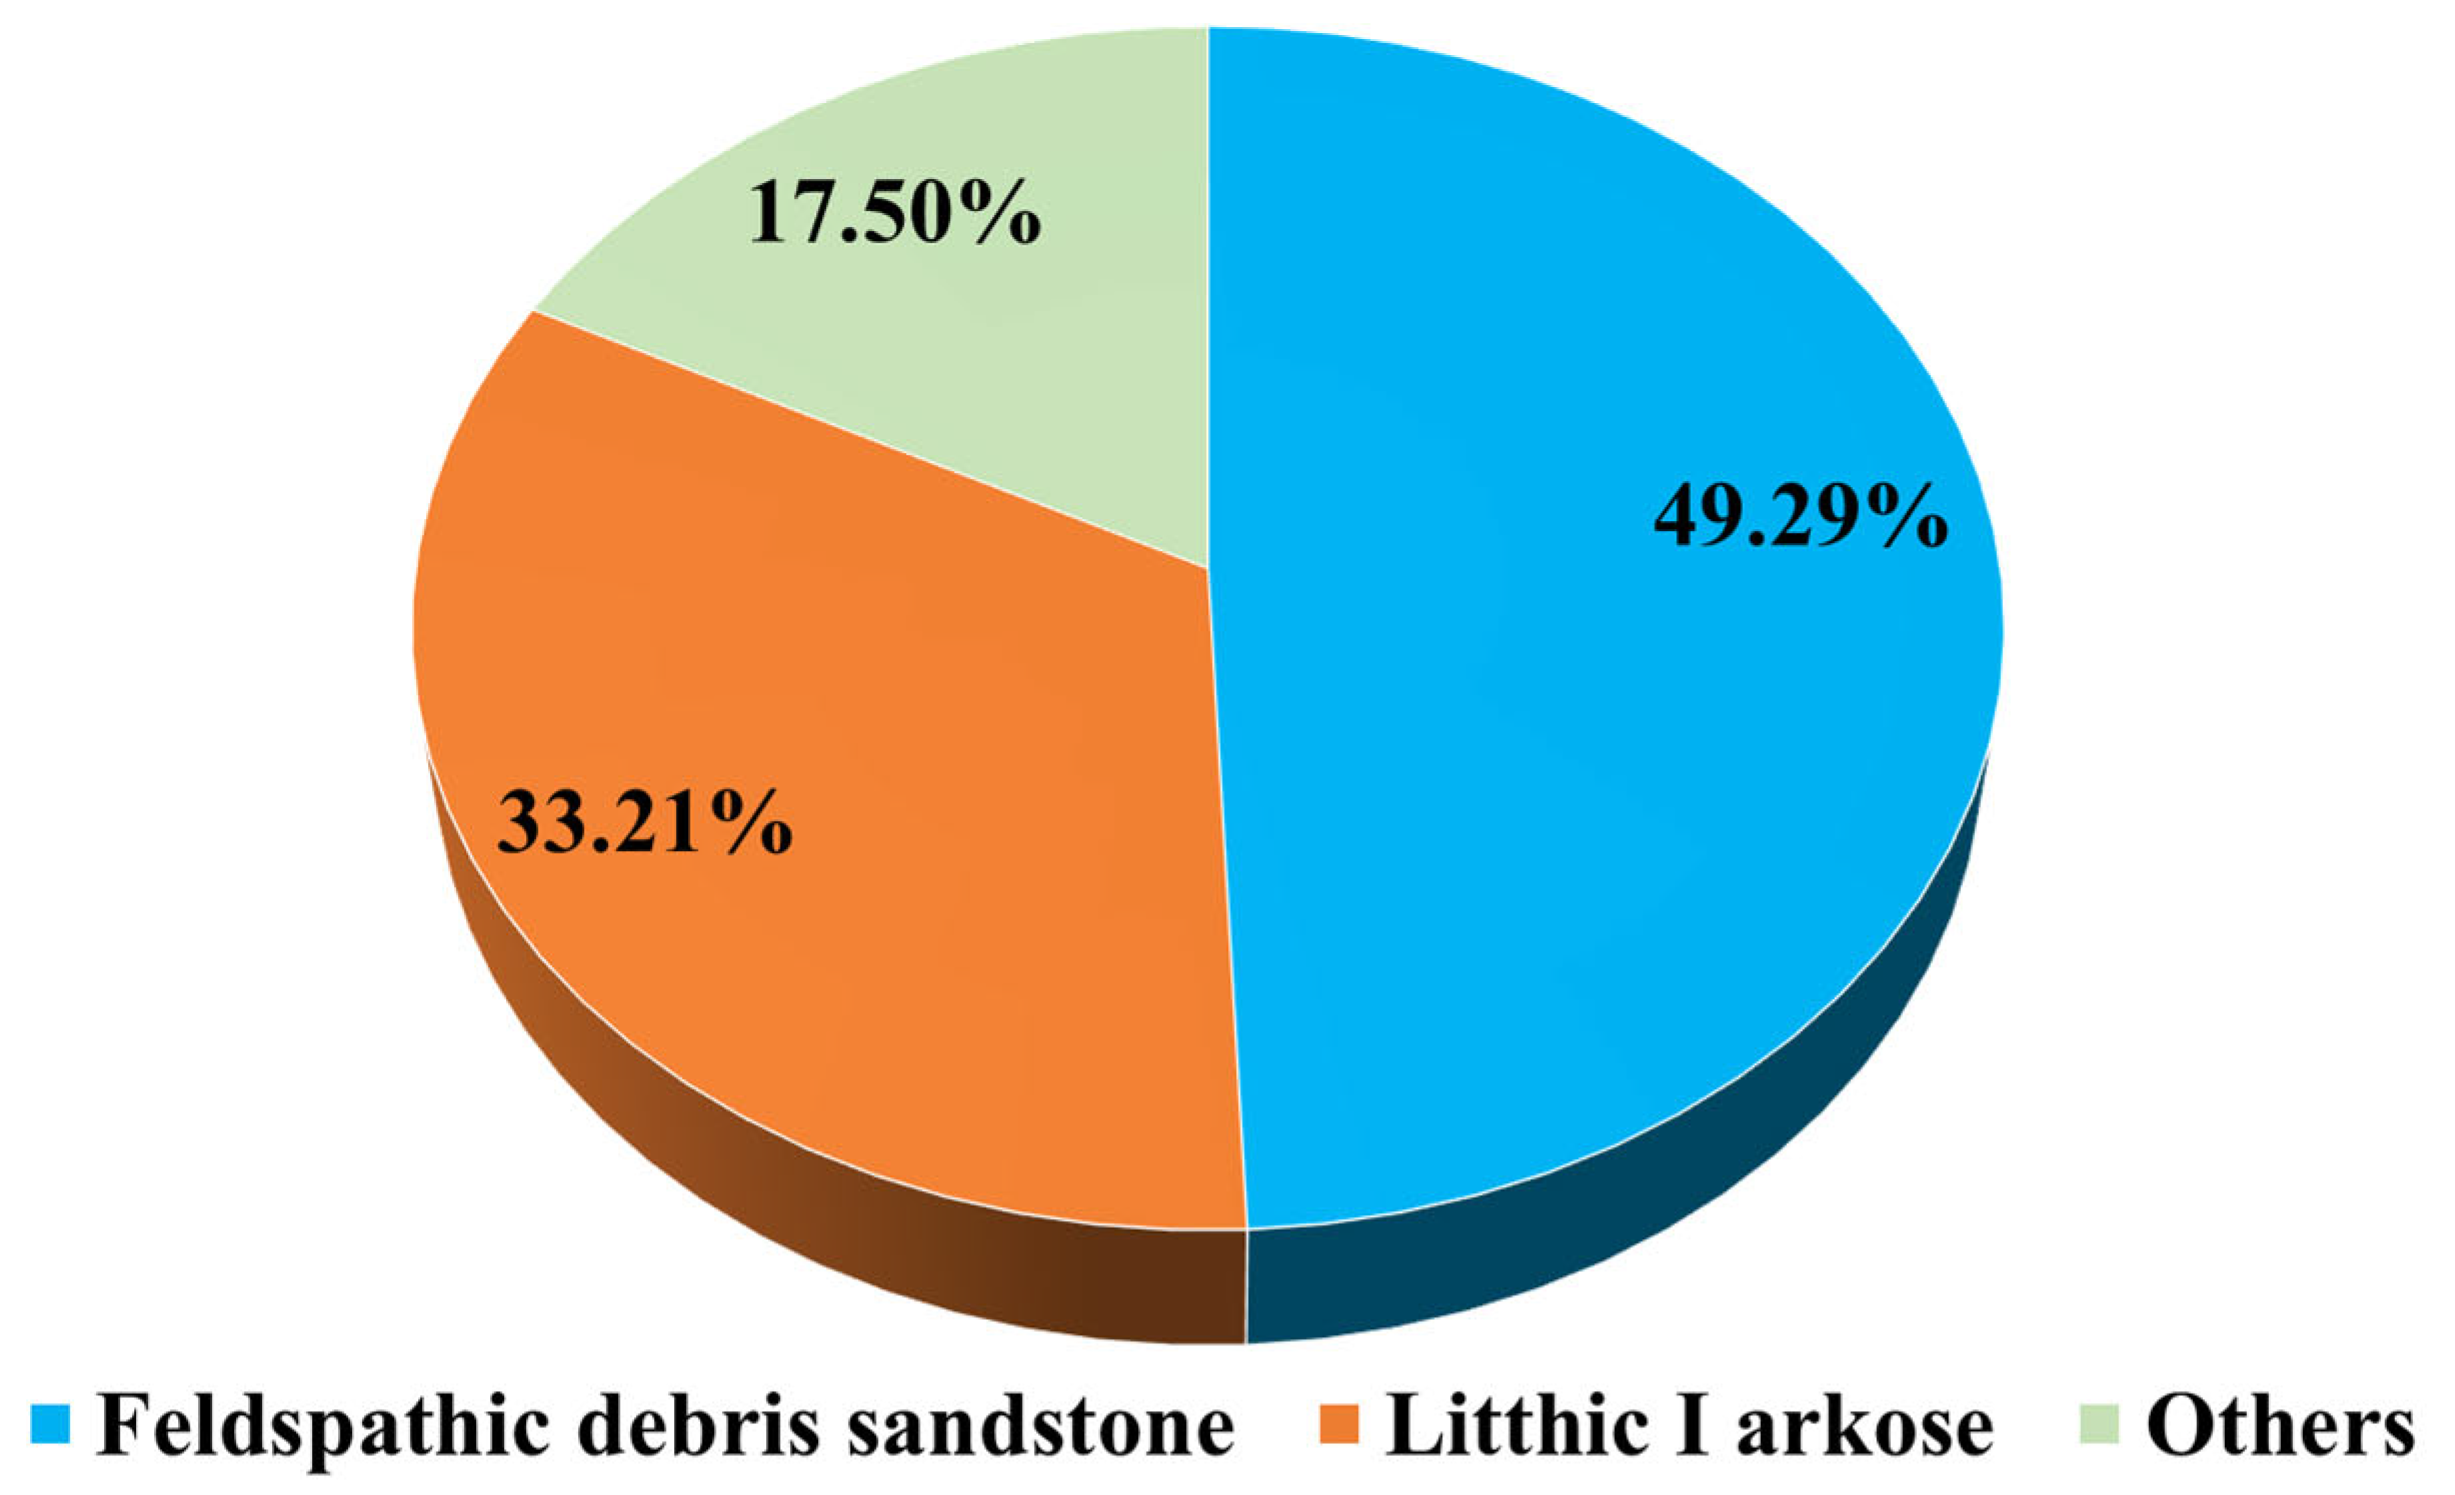
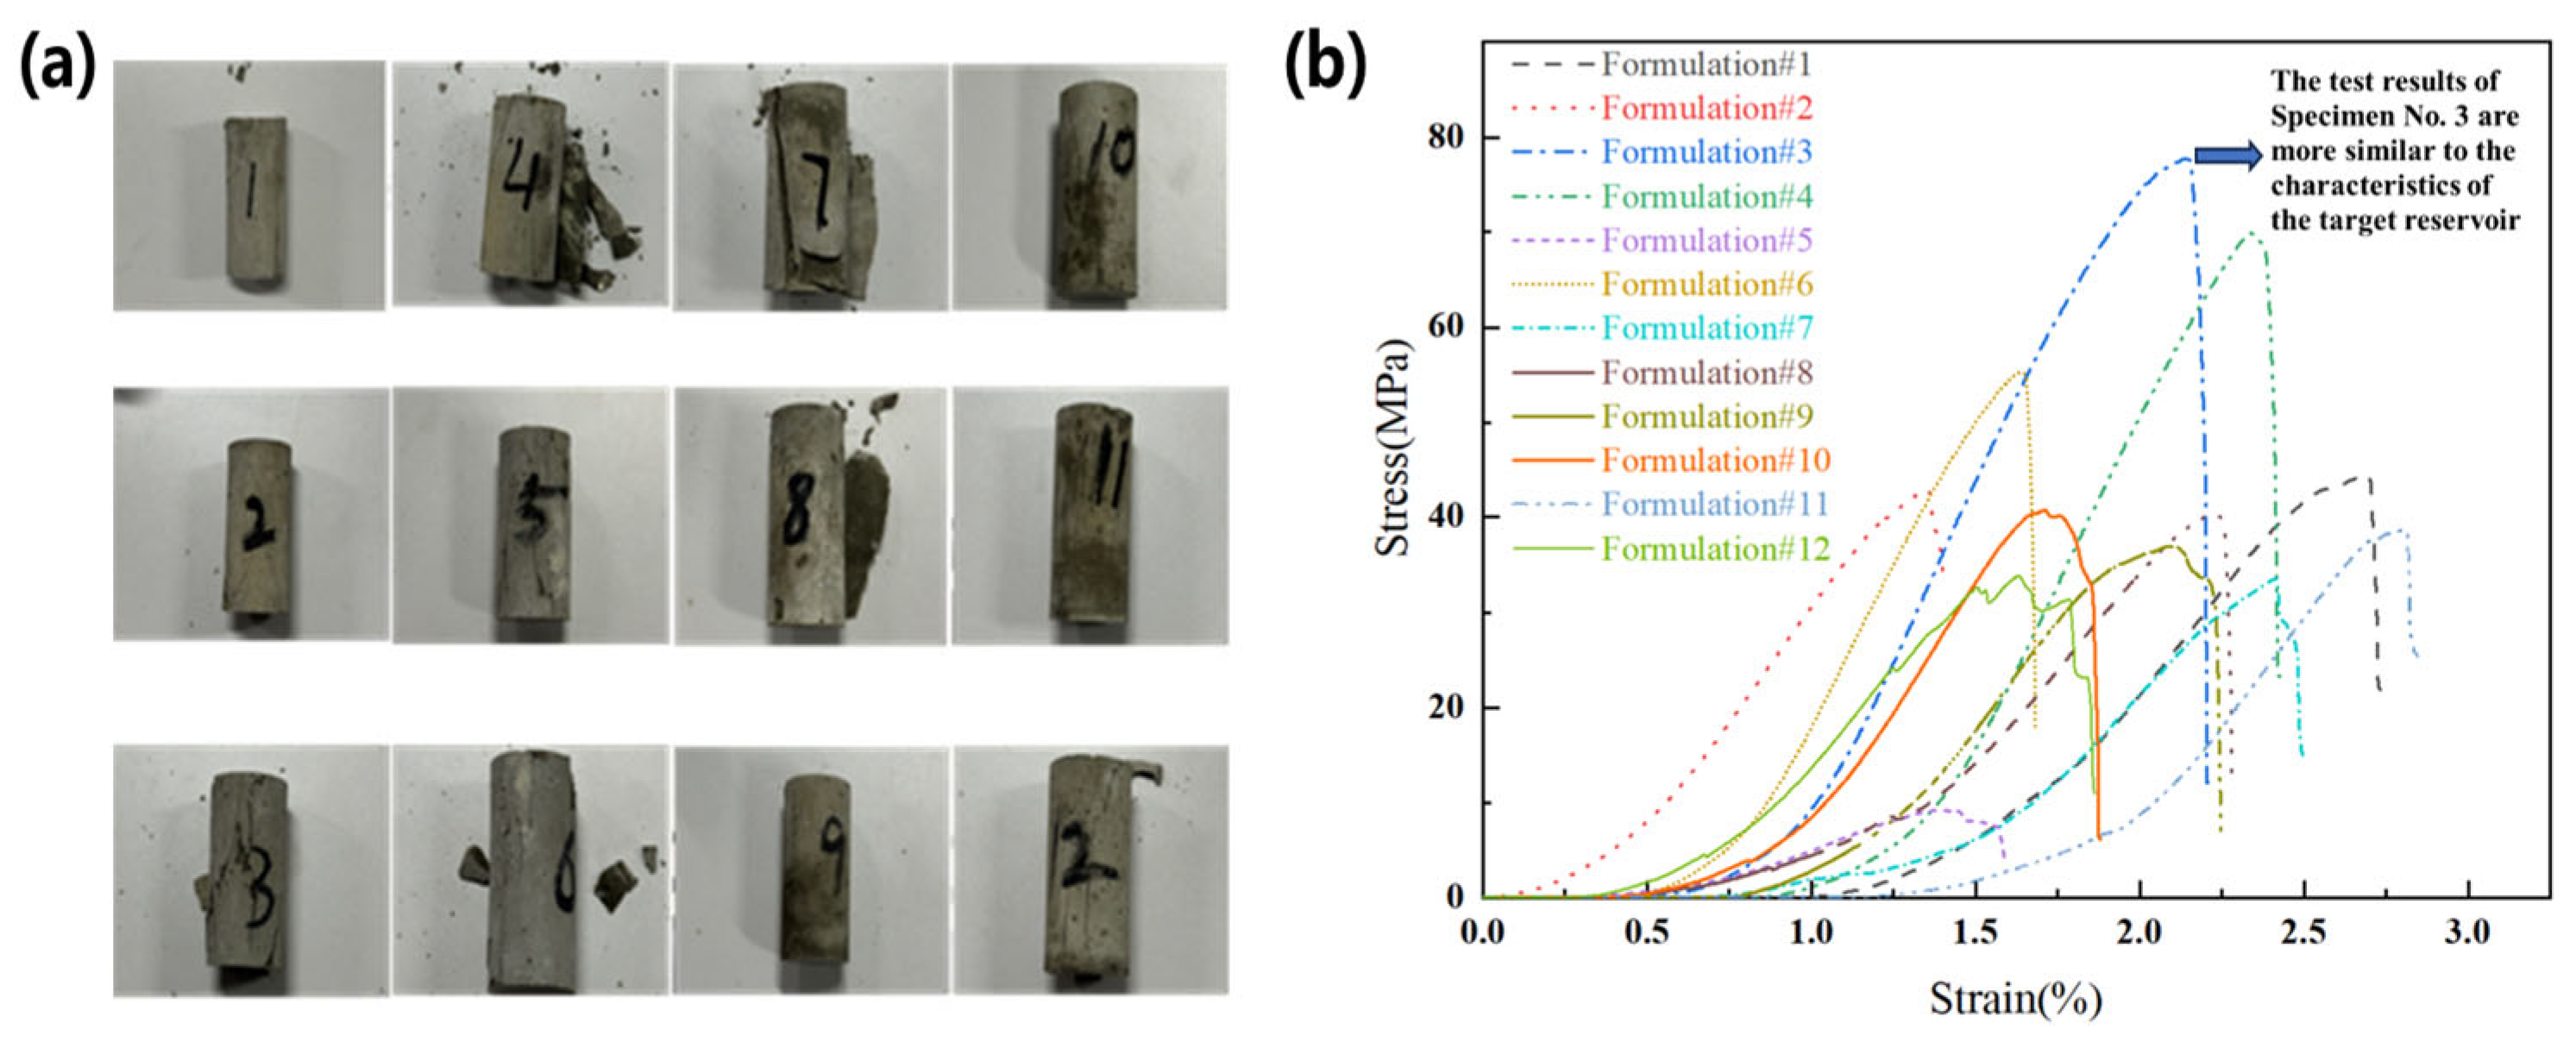
2.1. Reservoir Characterization and Specimen Preparation

The Dagang Oilfield is situated within the Beidagang, Nandagang, and Kong Dian structural zones of the Huanghua Depression. The primary oil- and gas-bearing stratum is the Shahejie Formation III (Es3), characterized by feldspathic litharenite, as shown in Figure 1. The main oil-bearing intervals of the Es3 member exhibit a relatively high clay mineral content, predominantly illite/smectite mixed-layer clay and kaolinite. The illite content averages 12.5%, and the chlorite content averages 20.3%. The reservoir porosity predominantly ranges from 5% to 25%, with permeability primarily ranging from 0 to 10 mD. The uniaxial compressive strength of the rock reaches 74 MPa [24,25,26,27], and the average Young’s modulus is 16 GPa, indicating overall low-to-medium porosity and ultra-low permeability characteristics.
To accurately replicate the mineralogical composition and petrophysical properties of the Es3 member in the Dagang oilfield, a synthetic rock specimen formulation was developed. The initial formulation was based on the approximate proportions of solid materials in the target reservoir, specifically, 62.5% quartz powder, 20.0% calcite, and 17.5% montmorillonite. Subsequently, a series of specimen formulations were designed, varying the amounts of cement and water added. The mechanical and petrophysical properties of these synthetic specimens were then compared with those of the target reservoir rock to determine the optimal formulation for this study. The results of uniaxial compression tests on the synthetic rock specimens with different formulations are shown in Figure 2a, with the corresponding load–displacement curves presented in Figure 2b. Based on these comparative tests, Formulation #3 was selected as the most representative of the target reservoir characteristics. The repeatability of Formulation #3 was confirmed through the preparation of three identical specimens, with the test results demonstrating consistent replication of the target reservoir characteristics, as shown in Table 1.

2.2. True Triaxial Hydraulic Fracturing Experiments

2.2.1. Experimental Apparatus

The experiments were conducted using a true triaxial fracturing simulation system, which consists of three primary components, i.e., a triaxial stress loading system, a fracturing fluid injection system, and a data acquisition system, as shown in Figure 3.
Triaxial stress loading system: This system comprises a triaxial press, a hydraulic power unit, and a control console, enabling precise sample mounting, independent control of the three principal stresses, and synchronized triaxial stress loading. The pressure control accuracy is ±0.1 MPa.
Fracturing fluid injection system: This system includes a triplex plunger pump, a fluid reservoir, a mass flow meter, and high-pressure fracturing fluid lines. The triplex plunger pump has a maximum pressure capacity of 100 MPa and a rated flow rate of 15 L/min. The fracturing fluid lines are rated for a maximum working pressure of 20 MPa. The fluid reservoir stores the fracturing fluid, which was dyed with a tracer for post-fracture analysis.
Data acquisition system: This system consists of a signal acquisition unit, pressure transducers, flow rate sensors, data transmission lines, and data acquisition software, enabling synchronized multi-channel data acquisition. The acquired experimental data included the maximum principal stress, minimum principal stress, vertical stress, fracturing fluid flow rate, and fracturing fluid pressure, with a data acquisition frequency of 1024 Hz.

2.2.2. Experimental Design

To investigate the effects of horizontal in situ stress difference, number of perforation clusters, fracturing fluid injection rate, and fracturing fluid viscosity on fracture morphology, a horizontal well multi-cluster fracturing simulation experimental scheme was designed, as shown in Table 2. The simulation of horizontal well stress loading is illustrated in Figure 4a, and the multi-cluster perforation configuration is shown in Figure 4b. Following each fracturing experiment, the specimen was sectioned, and the fracture propagation morphology was analyzed by applying dye infiltration along the fracture surfaces. The dyed sections were then photographed, and the images were used for qualitative and comparative analyses of fracture morphology.

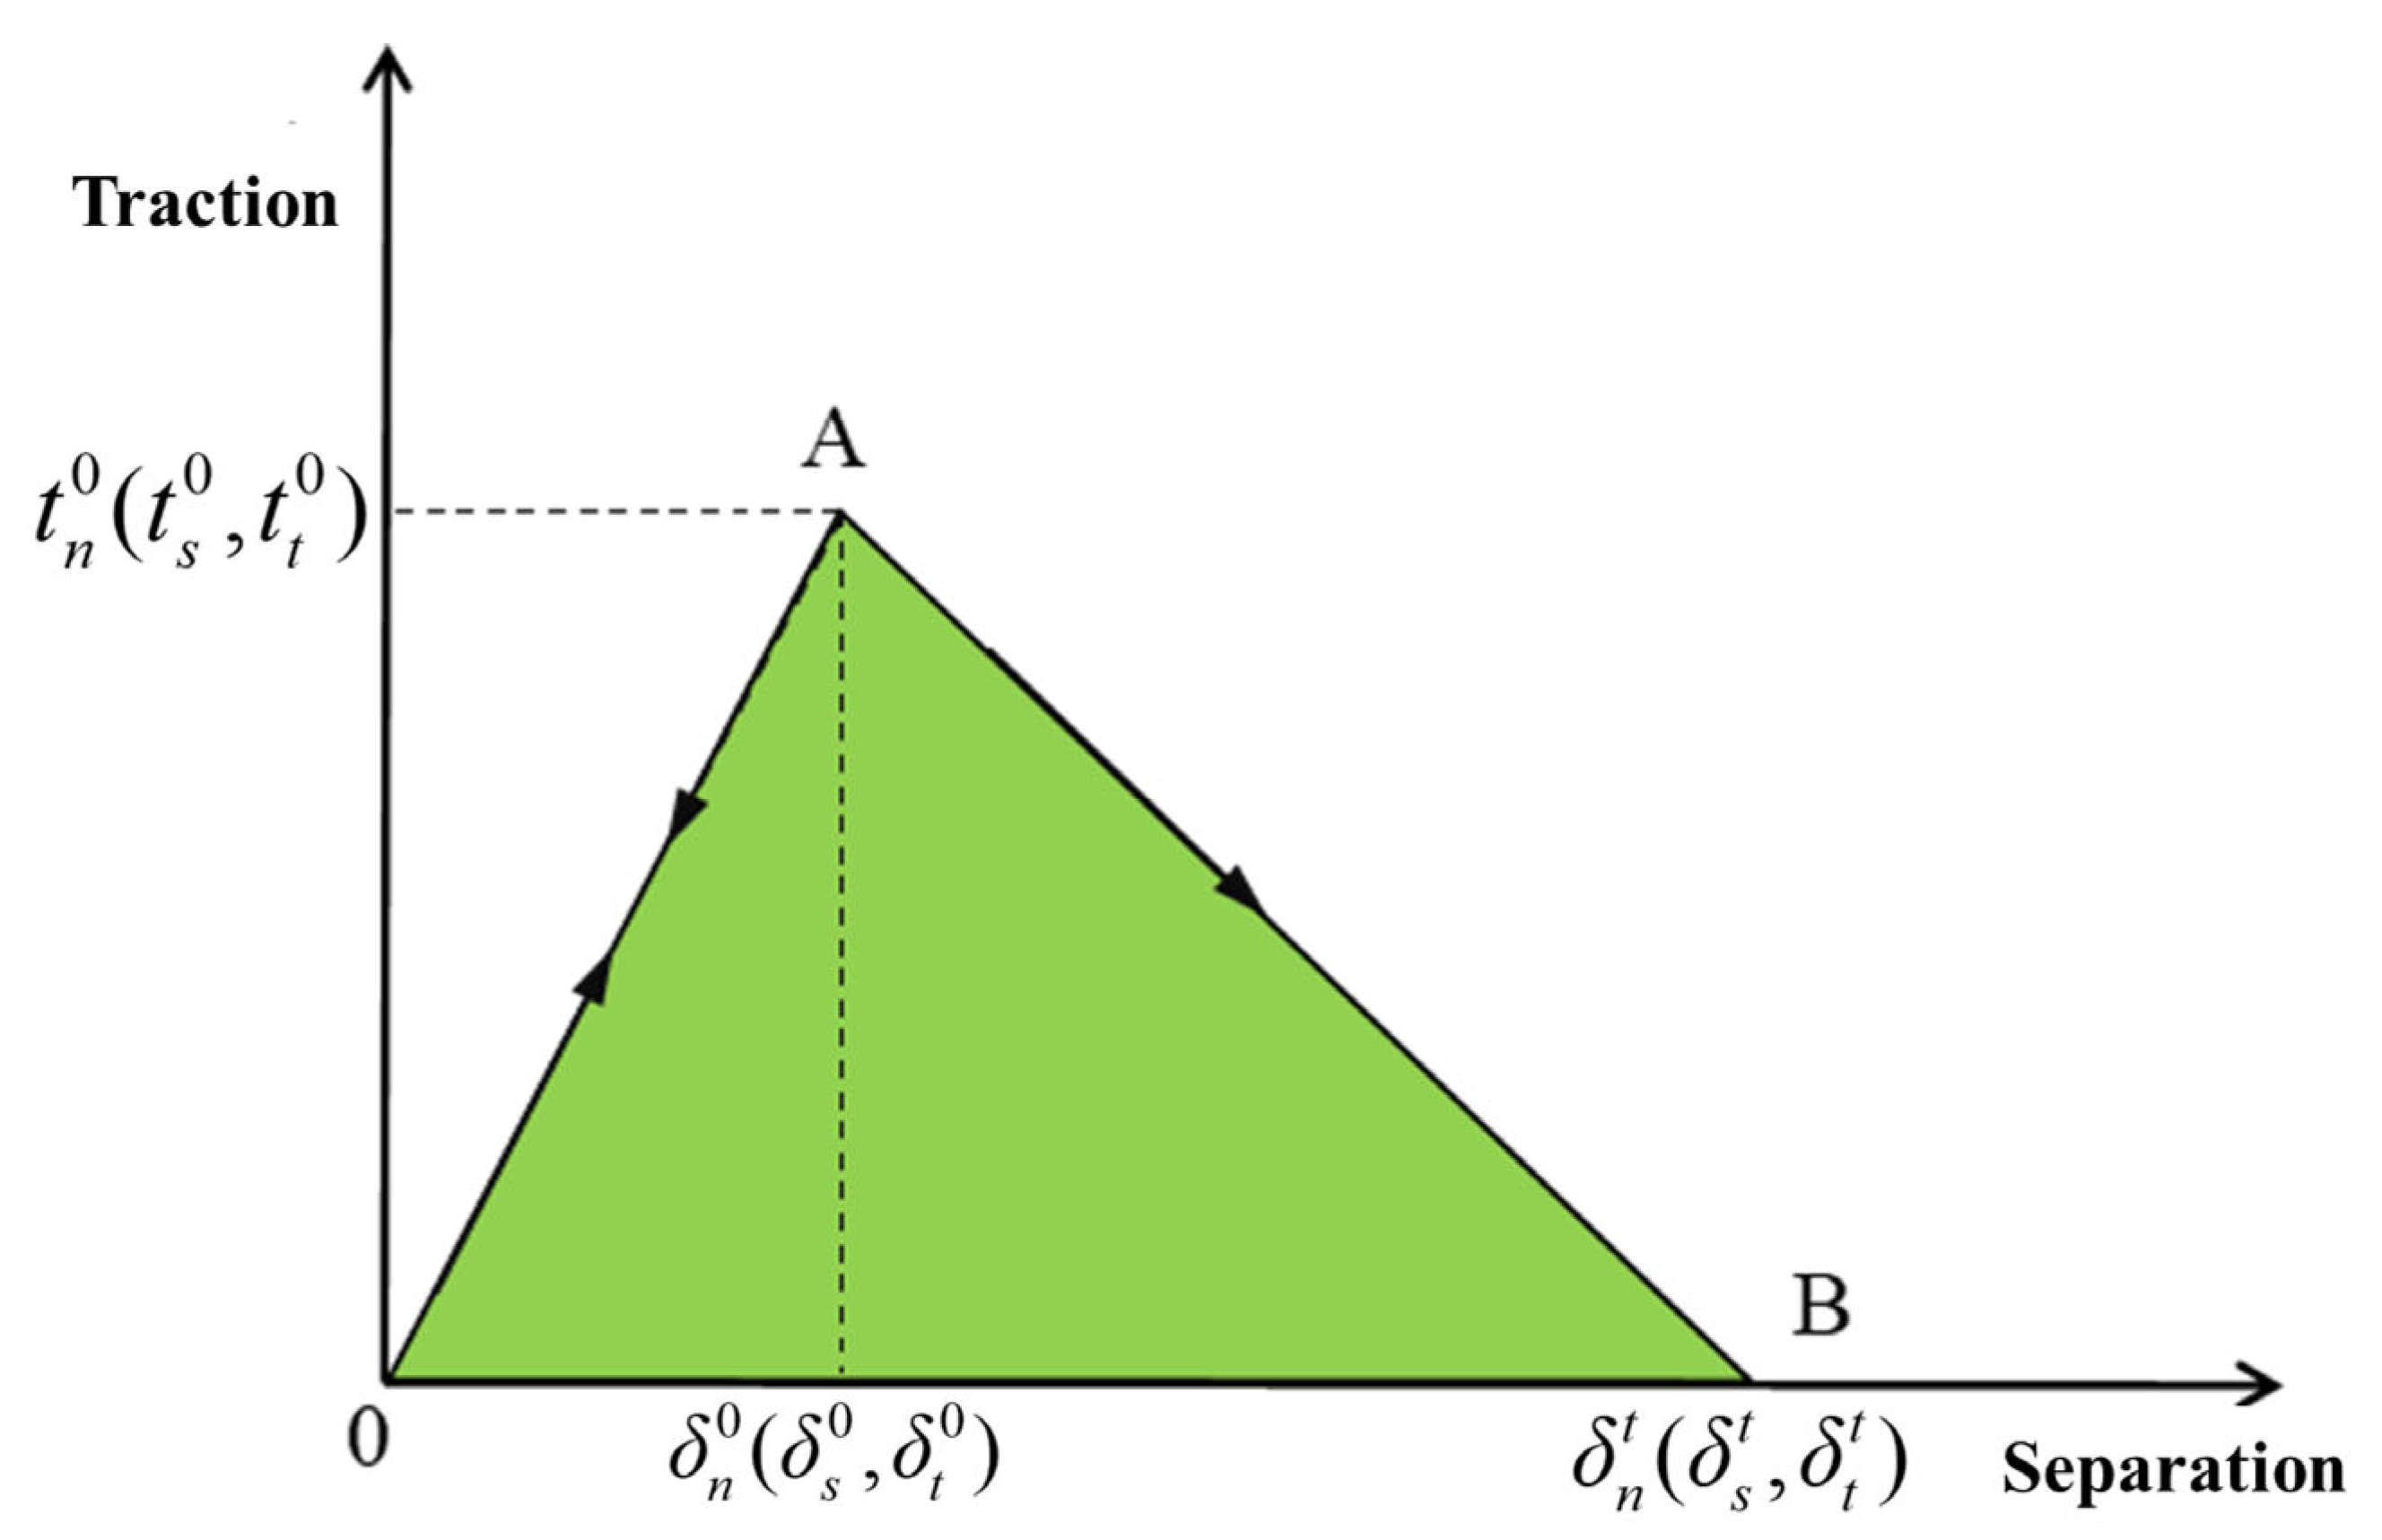
2.3. Numerical Simulation Using Cohesive Elements

While physical simulation experiments of horizontal well multi-cluster fracturing provide preliminary insights into the effects of horizontal in situ stress difference coefficient, number of perforation clusters, fracturing fluid injection rate, and fracturing fluid viscosity on fracture morphology, they are limited in their ability to quantitatively assess the influence of varying conditions on fracture width, height, and stimulated volume. Therefore, to complement the experimental results and to quantitatively evaluate the impact of different reservoir and operational parameters on fracture characteristics, numerical simulations were conducted using the cohesive element method (CEM). The CEM allows for the detailed modeling of damage and failure within a cohesive layer, enabling the extraction of relevant fracture parameters [28,29,30].
In the CEM-based simulation, several assumptions were adopted to ensure model consistency and computational feasibility. The rock formation was considered a homogeneous, isotropic, linear elastic medium prior to failure. Fracture initiation and propagation were governed by a predefined traction–separation law under the framework of linear elastic fracture mechanics. Only Mode I (opening mode) fracture was simulated, and cohesive elements were inserted along the mesh interfaces, restricting the fracture propagation paths. The fracturing fluid was assumed to be single-phase, incompressible, and Newtonian, with its flow governed by Poiseuille’s law. Thermo-chemical effects, natural fractures, and proppant transport were not included. Quasi-static loading was assumed, and inertial effects were neglected. These assumptions provided a simplified, yet robust, framework for investigating the influence of key parameters on fracture evolution under controlled conditions.
The fracture criterion for rocks, as commonly employed in hydraulic fracturing simulations, can be expressed as follows [31]:
σ n σ n m a x 2 + τ s τ s m a x 2 + τ t τ t m a x 2 = 1
where σ n represents the stress acting on the cohesive element in the normal direction (MPa); τ s and τ t represent the stresses acting on the element in the two tangential directions (MPa); σ n m a x represents the critical stress for element failure in the normal direction (MPa); and τ s m a x and τ t m a x represent the critical stresses for element failure in the two tangential directions (MPa).
The damage factor D is calculated using the following equation [32]:
D = δ m f ( δ m m a x δ m 0 ) δ m m a x ( f δ m 0 )
where δ m m a x is the maximum displacement reached by the element during loading (m); δ m f is the displacement at which the element is completely damaged (m); and δ m 0 is the displacement at which the element initiates damage (m).
The cohesive element method, employing a linear traction–separation law, effectively describes the relationship between traction forces and fracture opening displacement on the fracture surface. This mechanical model is well-suited for analyzing the response of interfaces or crack surfaces in materials under load, providing a robust framework for simulating fracture initiation and propagation [33,34,35]. A typical traction–separation curve is shown in Figure 5.

3. Results and Discussion

This section provides an in-depth exploration of the fracture propagation behavior in multi-cluster hydraulic fracturing within low-permeability reservoirs and the controlling factors affecting fracturing effectiveness, with a particular focus on geological and engineering parameters. The study was primarily centered on the following aspects: firstly, the influence of in situ stress, perforation cluster number, fracturing fluid injection rate, and fluid viscosity on fracture propagation patterns was analyzed through laboratory experiments; secondly, numerical simulation methods were employed to further investigate the effects of in situ stress conditions (particularly, the horizontal stress difference), engineering parameters (such as perforation cluster number and fracturing fluid injection rate), and reservoir properties (including permeability, elastic modulus, and Poisson’s ratio) on fracture morphology, with a focus on quantifying these impacts; and finally, through methods such as dominant factor analysis, the relative importance of these parameters on fracturing effectiveness was assessed.

3.1. Analysis of Multi-Cluster Fracturing Physical Simulation Experiments

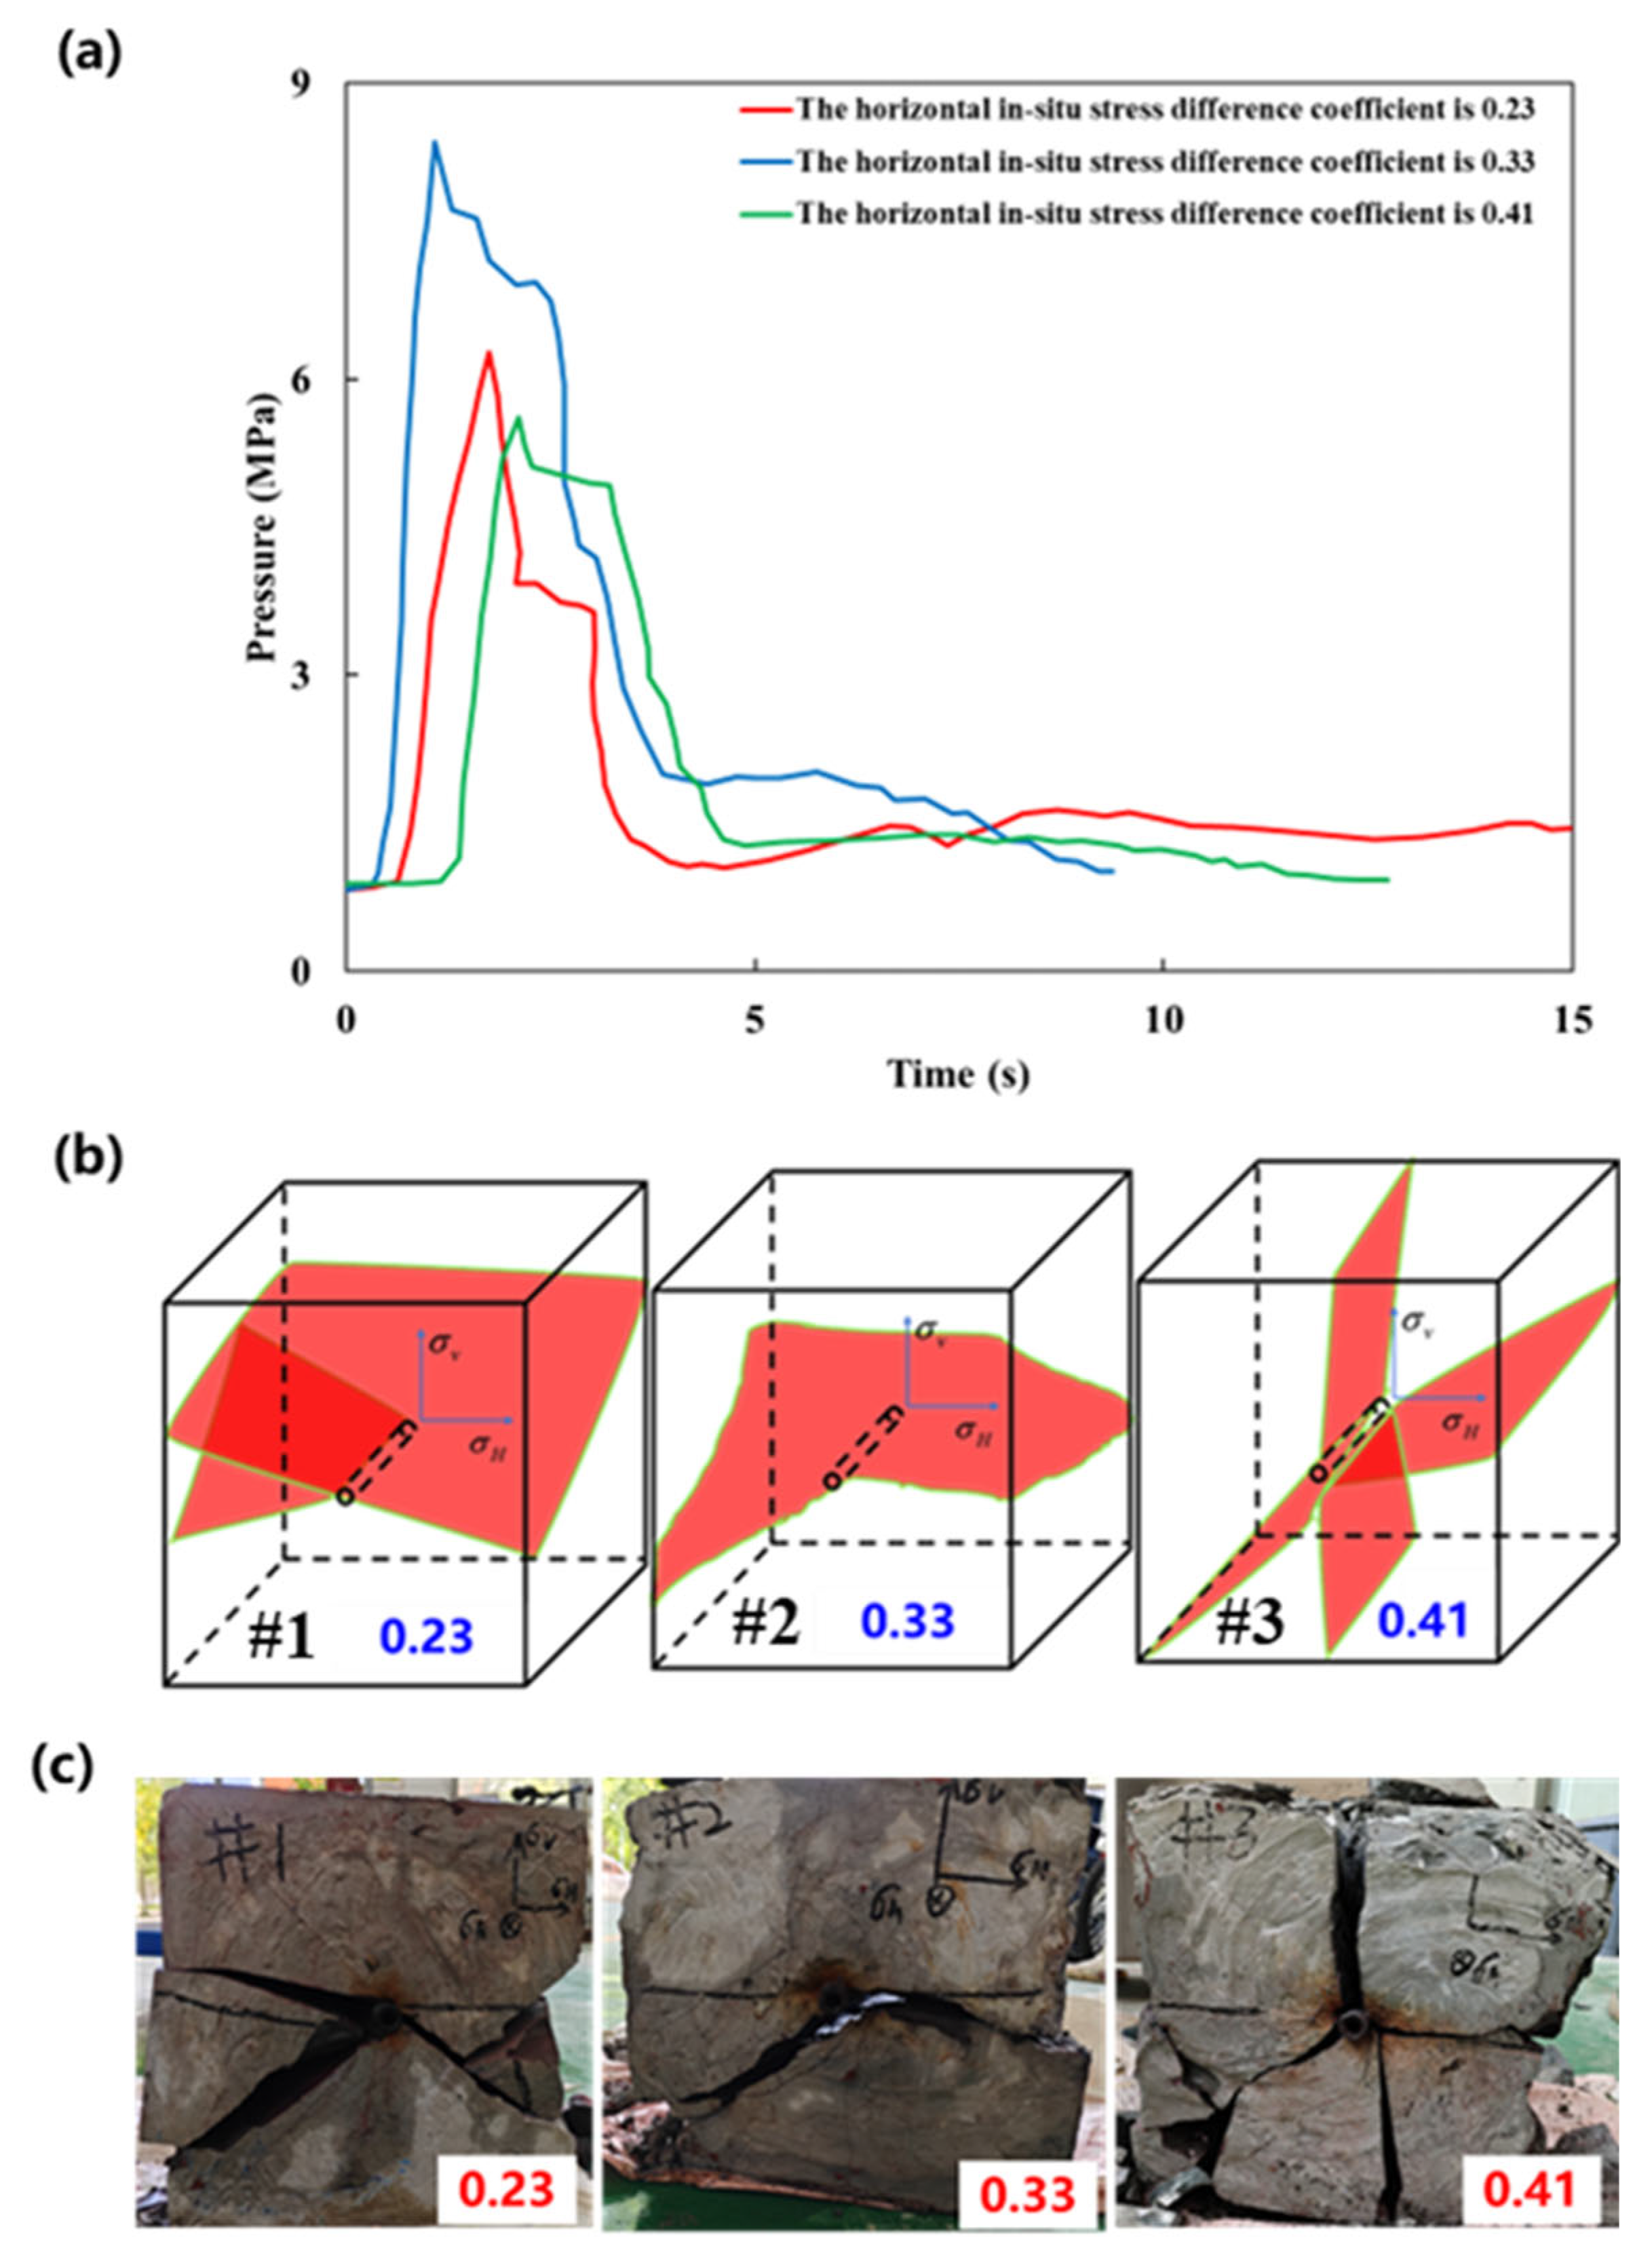
3.1.1. Effect of Horizontal In Situ Stress Difference

The fracturing pressure curves for horizontal in situ stress difference coefficients of 0.23, 0.33, and 0.41 are presented in Figure 6a. At a stress difference coefficient of 0.23, the pressure rapidly decreased to 50% of the breakdown pressure immediately after fracture initiation, indicating a pronounced fracture propagation phase. This sharp drop was likely due to the rapid fracture opening and extension. As the fracture propagated, the injected fluid was quickly absorbed into the expanding fracture volume, resulting in a substantial and sudden pressure release at the wellbore. The reduced stress confinement also allowed for a higher fluid loss rate, contributing to the steep pressure decline. With a stress difference coefficient of 0.33, the pressure decreased more gradually after reaching the breakdown pressure. In contrast, at a stress difference coefficient of 0.41, the pressure dropped sharply upon reaching failure, with no discernible fracture propagation stage. Notably, although the stress difference coefficient increased monotonically from 0.23 to 0.41, the highest breakdown pressure was observed at the intermediate value of 0.33. This unexpected trend may be attributed to localized material heterogeneities, stress concentration zones, or variations in initial fracture nucleation sites, which collectively altered the fracture initiation thresholds.
Figure 6b,c illustrate the fracture patterns and fracture surface morphologies of the specimens after fracturing for stress difference coefficients of 0.23, 0.33, and 0.41. When the stress difference coefficient was 0.23 or 0.33, the fractures predominantly formed symmetric bi-wing shapes. At 0.23, secondary cracks were also observed near the specimen edges, possibly due to weak local planes. In contrast, at a coefficient of 0.41, the fracture morphology transitioned into a combination of vertical and single-wing fractures, indicating a departure from symmetric propagation.
This transition can be attributed to an increase in stress anisotropy. As the horizontal stress difference increased, the stronger differential stress promoted asymmetric stress concentrations around the crack tips, leading to fracture deflection and the initiation of secondary branches along directions of reduced resistance. The accompanying pressure curves also exhibited greater fluctuations, consistent with unstable propagation and abrupt changes in fracture geometry.

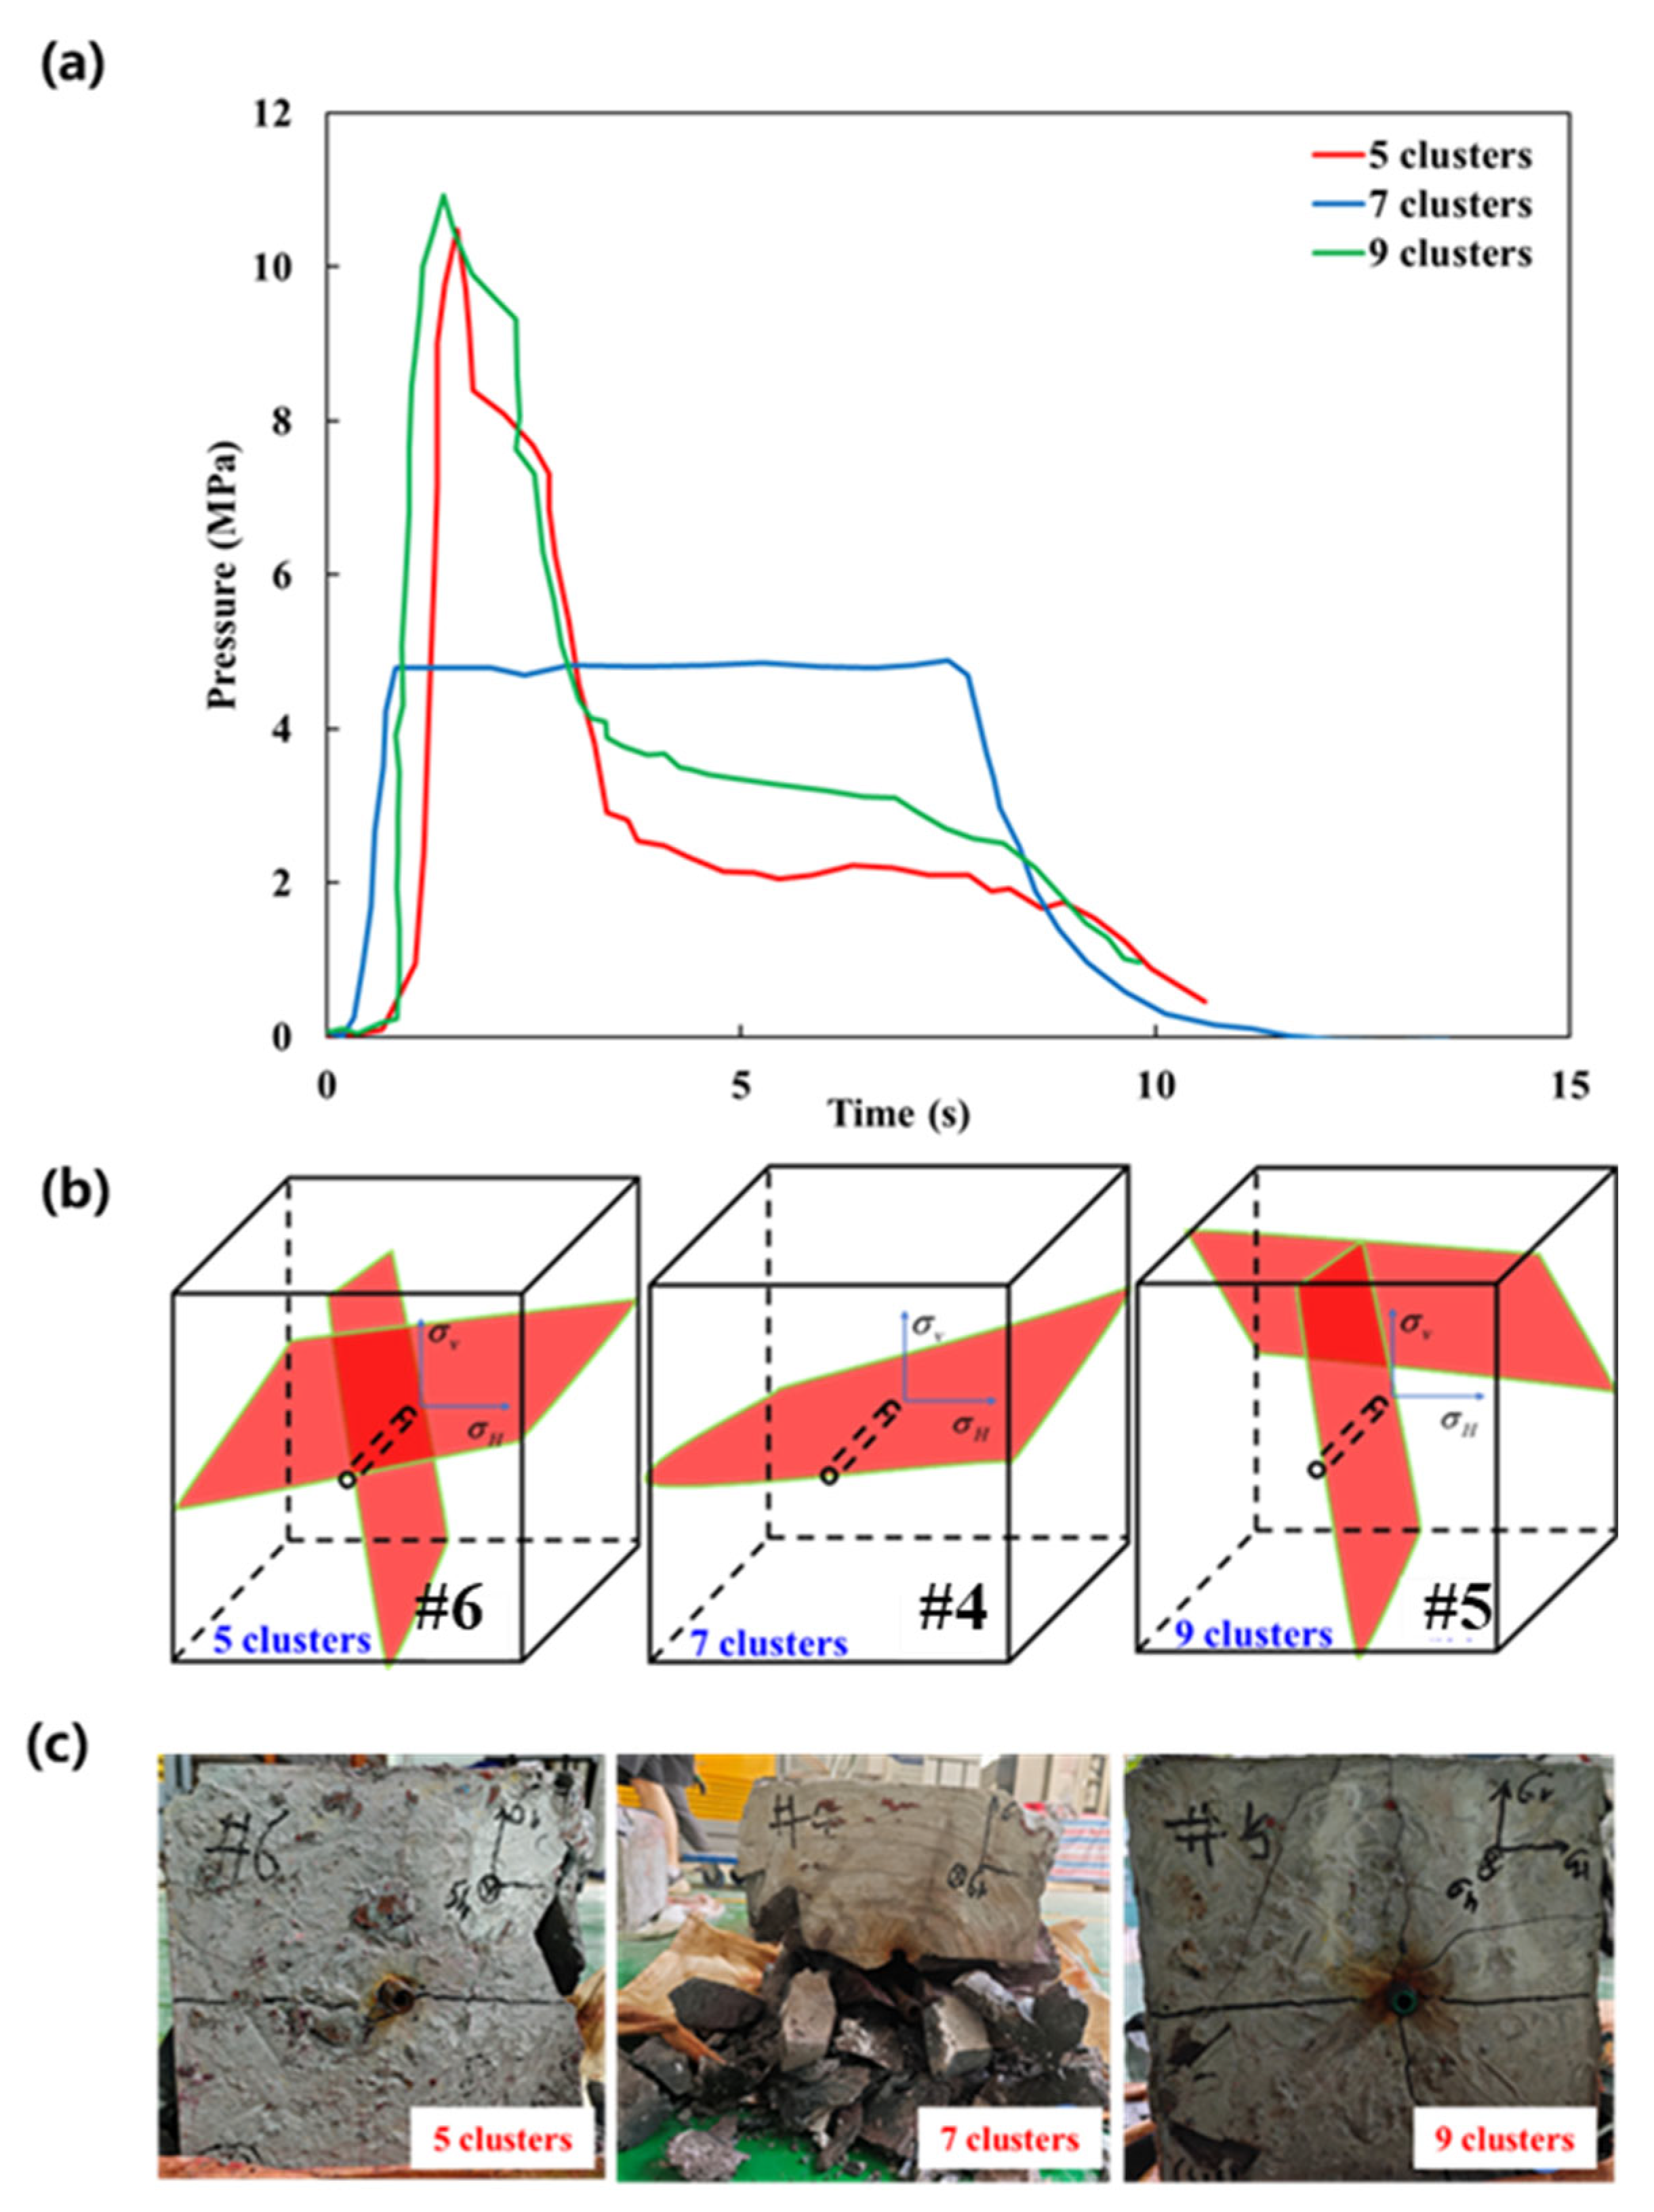
3.1.2. Effect of Perforation Cluster Number

The fracturing pressure curves for five, seven, and nine perforation clusters are shown in Figure 7a. With five and nine clusters, the pressure decreased after reaching the breakdown pressure. After dropping to approximately 80% of the breakdown pressure, the pressure decreased more slowly before rapidly declining to the propagation pressure. Figure 7b,c show the fracture patterns and fracture surface morphologies for five, seven, and nine perforation clusters. It can be seen that for five and nine clusters, the specimens tended to form vertical fractures and bi-wing horizontal fractures, resulting in relatively complex fracture patterns. However, when the cluster number was seven, the specimen exhibited a dominant horizontal main fracture, accompanied by significant damage in its lower half and the formation of numerous secondary fractures. This may have been due to the presence of more weak planes in the lower half of the specimen during the preparation of the seven-cluster sample. Furthermore, stress interference between the fractures may have inhibited the lateral propagation of the fractures on either side of the central fracture. Overall, increasing the number of perforation clusters resulted in more complex fracture patterns in the fractured specimens.

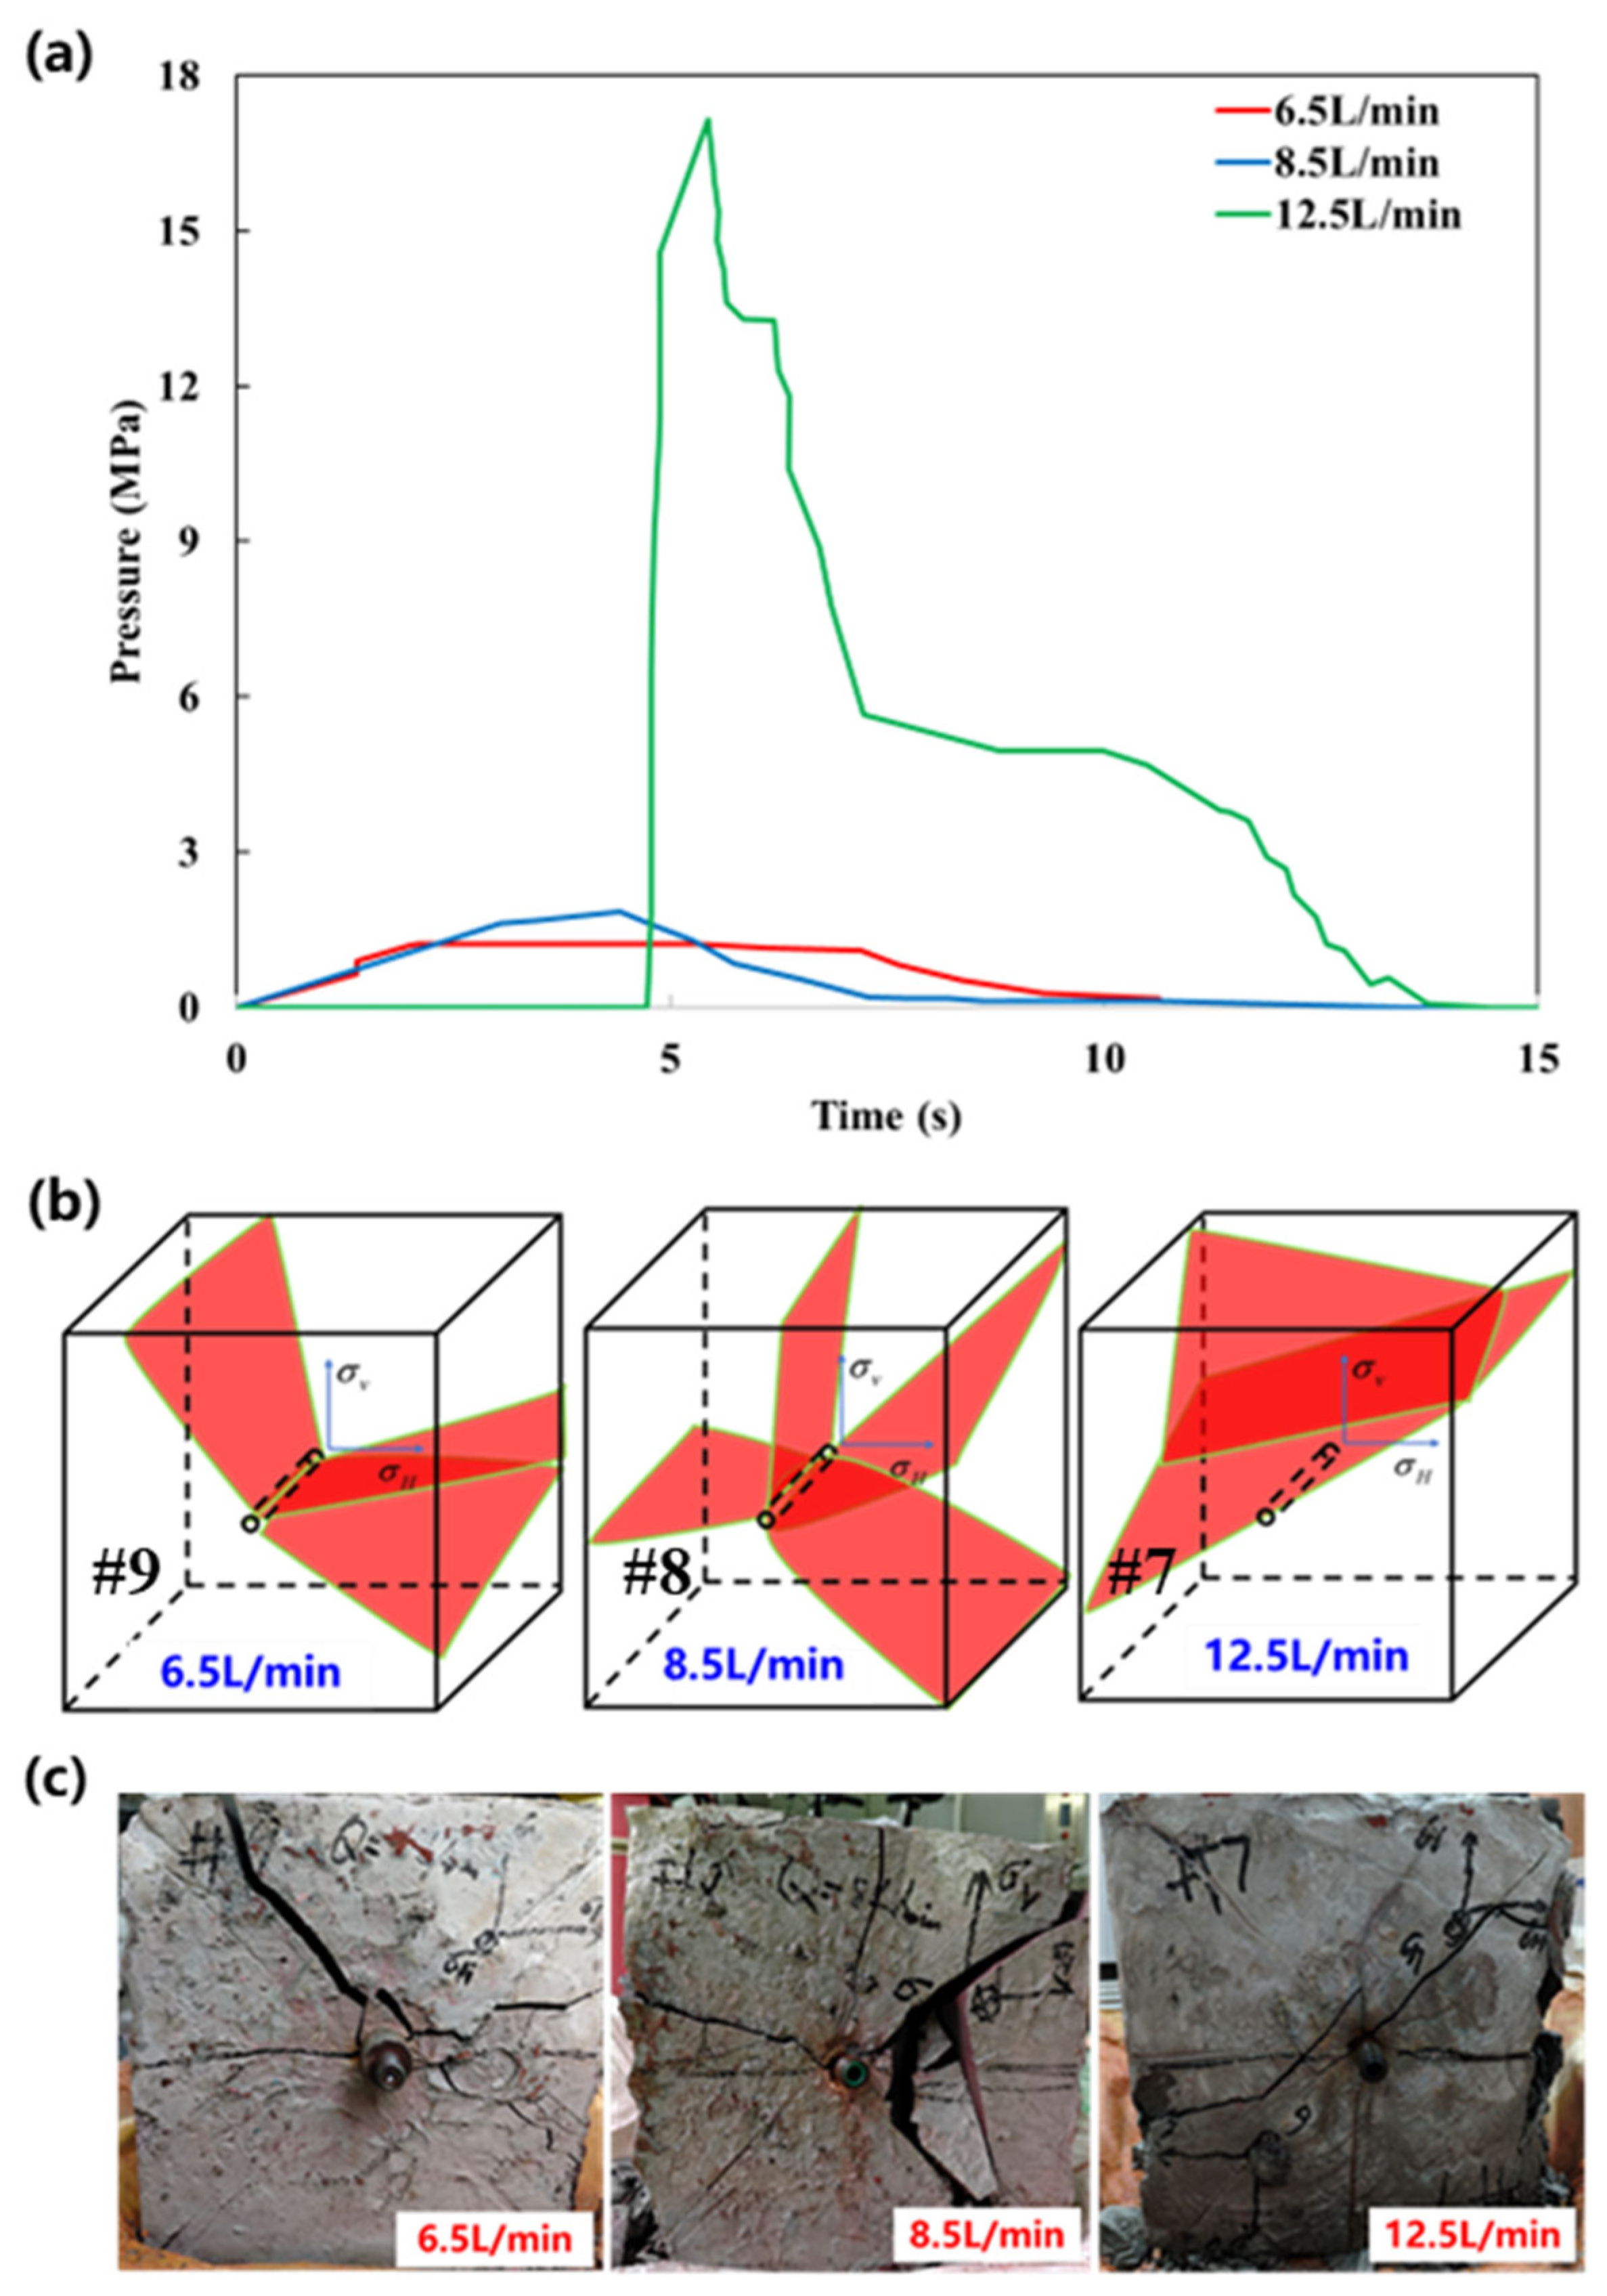
3.1.3. Effect of the Fracturing Fluid Injection Rate

The fracturing pressure curves for fracturing fluid injection rates of 6.5 L/min, 8.5 L/min, and 12.5 L/min are presented in Figure 8a. The breakdown pressures at the injection rates of 6.5 and 8.5 L/min were similar in magnitude, showing little variation between the two conditions. However, a notable increase in breakdown pressure was observed at 12.5 L/min. This rise is likely attributable to the increased injection momentum, which may lead to enhanced near-wellbore stress concentration and higher resistance to fracture initiation. Figure 8b,c show the fracture patterns and fracture surface morphologies for the fracturing fluid injection rates of 6.5 L/min, 8.5 L/min, and 12.5 L/min. The specimens fractured at the injection rates of 12.5 L/min and 8.5 L/min exhibited bi-wing horizontal fractures. However, the specimen fractured at 6.5 L/min displayed a more complex fracture morphology, likely due to incomplete fracture propagation and local heterogeneity. These findings suggest that while higher injection rates promote the formation of longer and wider main fractures, they also require higher breakdown pressures. Lower injection rates, despite comparable breakdown pressures, may result in irregular fracture development due to insufficient energy input and delayed propagation dynamics.

3.1.4. Effect of Fracturing Fluid Viscosity

The fracturing pressure curves for fracturing fluid viscosities of 1 cP, 10 cP, and 30 cP are presented in Figure 9a. When the fracturing fluid viscosity was 1 cP, the fracturing curve exhibited characteristics similar to those observed for specimens with different horizontal stress difference coefficients. However, when the fracturing fluid viscosity was 10 cP, the pressure increased again after an initial rapid decline. This may have been due to poor cementation around the fracturing string, leading to specimen fracture upon the pressure increase, followed by a temporary cessation of fracturing. With further pressure increase, the specimen failed completely. In this case, the second peak pressure was considered the breakdown pressure of the specimen. Notably, there was no clear monotonic trend for fluid viscosity and breakdown pressure. Under the 10 cP condition, the specimen exhibited a relatively high peak pressure. In contrast, the breakdown pressure observed at 30 cP was lower than that at both 1 cP and 10 cP. This outcome may be associated with stress concentration near the borehole wall caused by the higher fluid viscosity, which facilitated an earlier fracture initiation and limited a further pressure buildup. Additionally, no stable fracture propagation stage was observed at 30 cP, and the specimen showed characteristics of brittle failure.
Figure 9b,c illustrate the fracture patterns and fracture surface morphologies for fracturing fluid viscosities of 1 cP, 10 cP, and 30 cP. When the fracturing fluid viscosity was 1 cP and 10 cP, the specimens exhibited bi-wing horizontal fractures. However, at a fracturing fluid viscosity of 30 cP, the fracture propagated diagonally downwards through the specimen, with vertical secondary fractures forming along the specimen edges.

3.2. Numerical Simulation Results Analysis

Given the inherent heterogeneity of rocks and the resulting variability in laboratory experimental results, relying solely on physical experiments is insufficient to fully elucidate the mechanisms by which various factors influence the fracturing effectiveness. Moreover, the quantitative assessment of fracture width, height, and stimulated volume under different conditions is challenging in laboratory settings. Therefore, to complement the experimental findings and to gain a deeper understanding of the underlying physics, numerical simulations were conducted using ABAQUS software (Version 6.8) to investigate the effects of varying formation and operational parameters on fracture morphology and stimulated volume. The numerical simulation scheme was developed based on the mechanical properties and geomechanical characteristics of the target research area, with the baseline parameter settings summarized in Table 3.

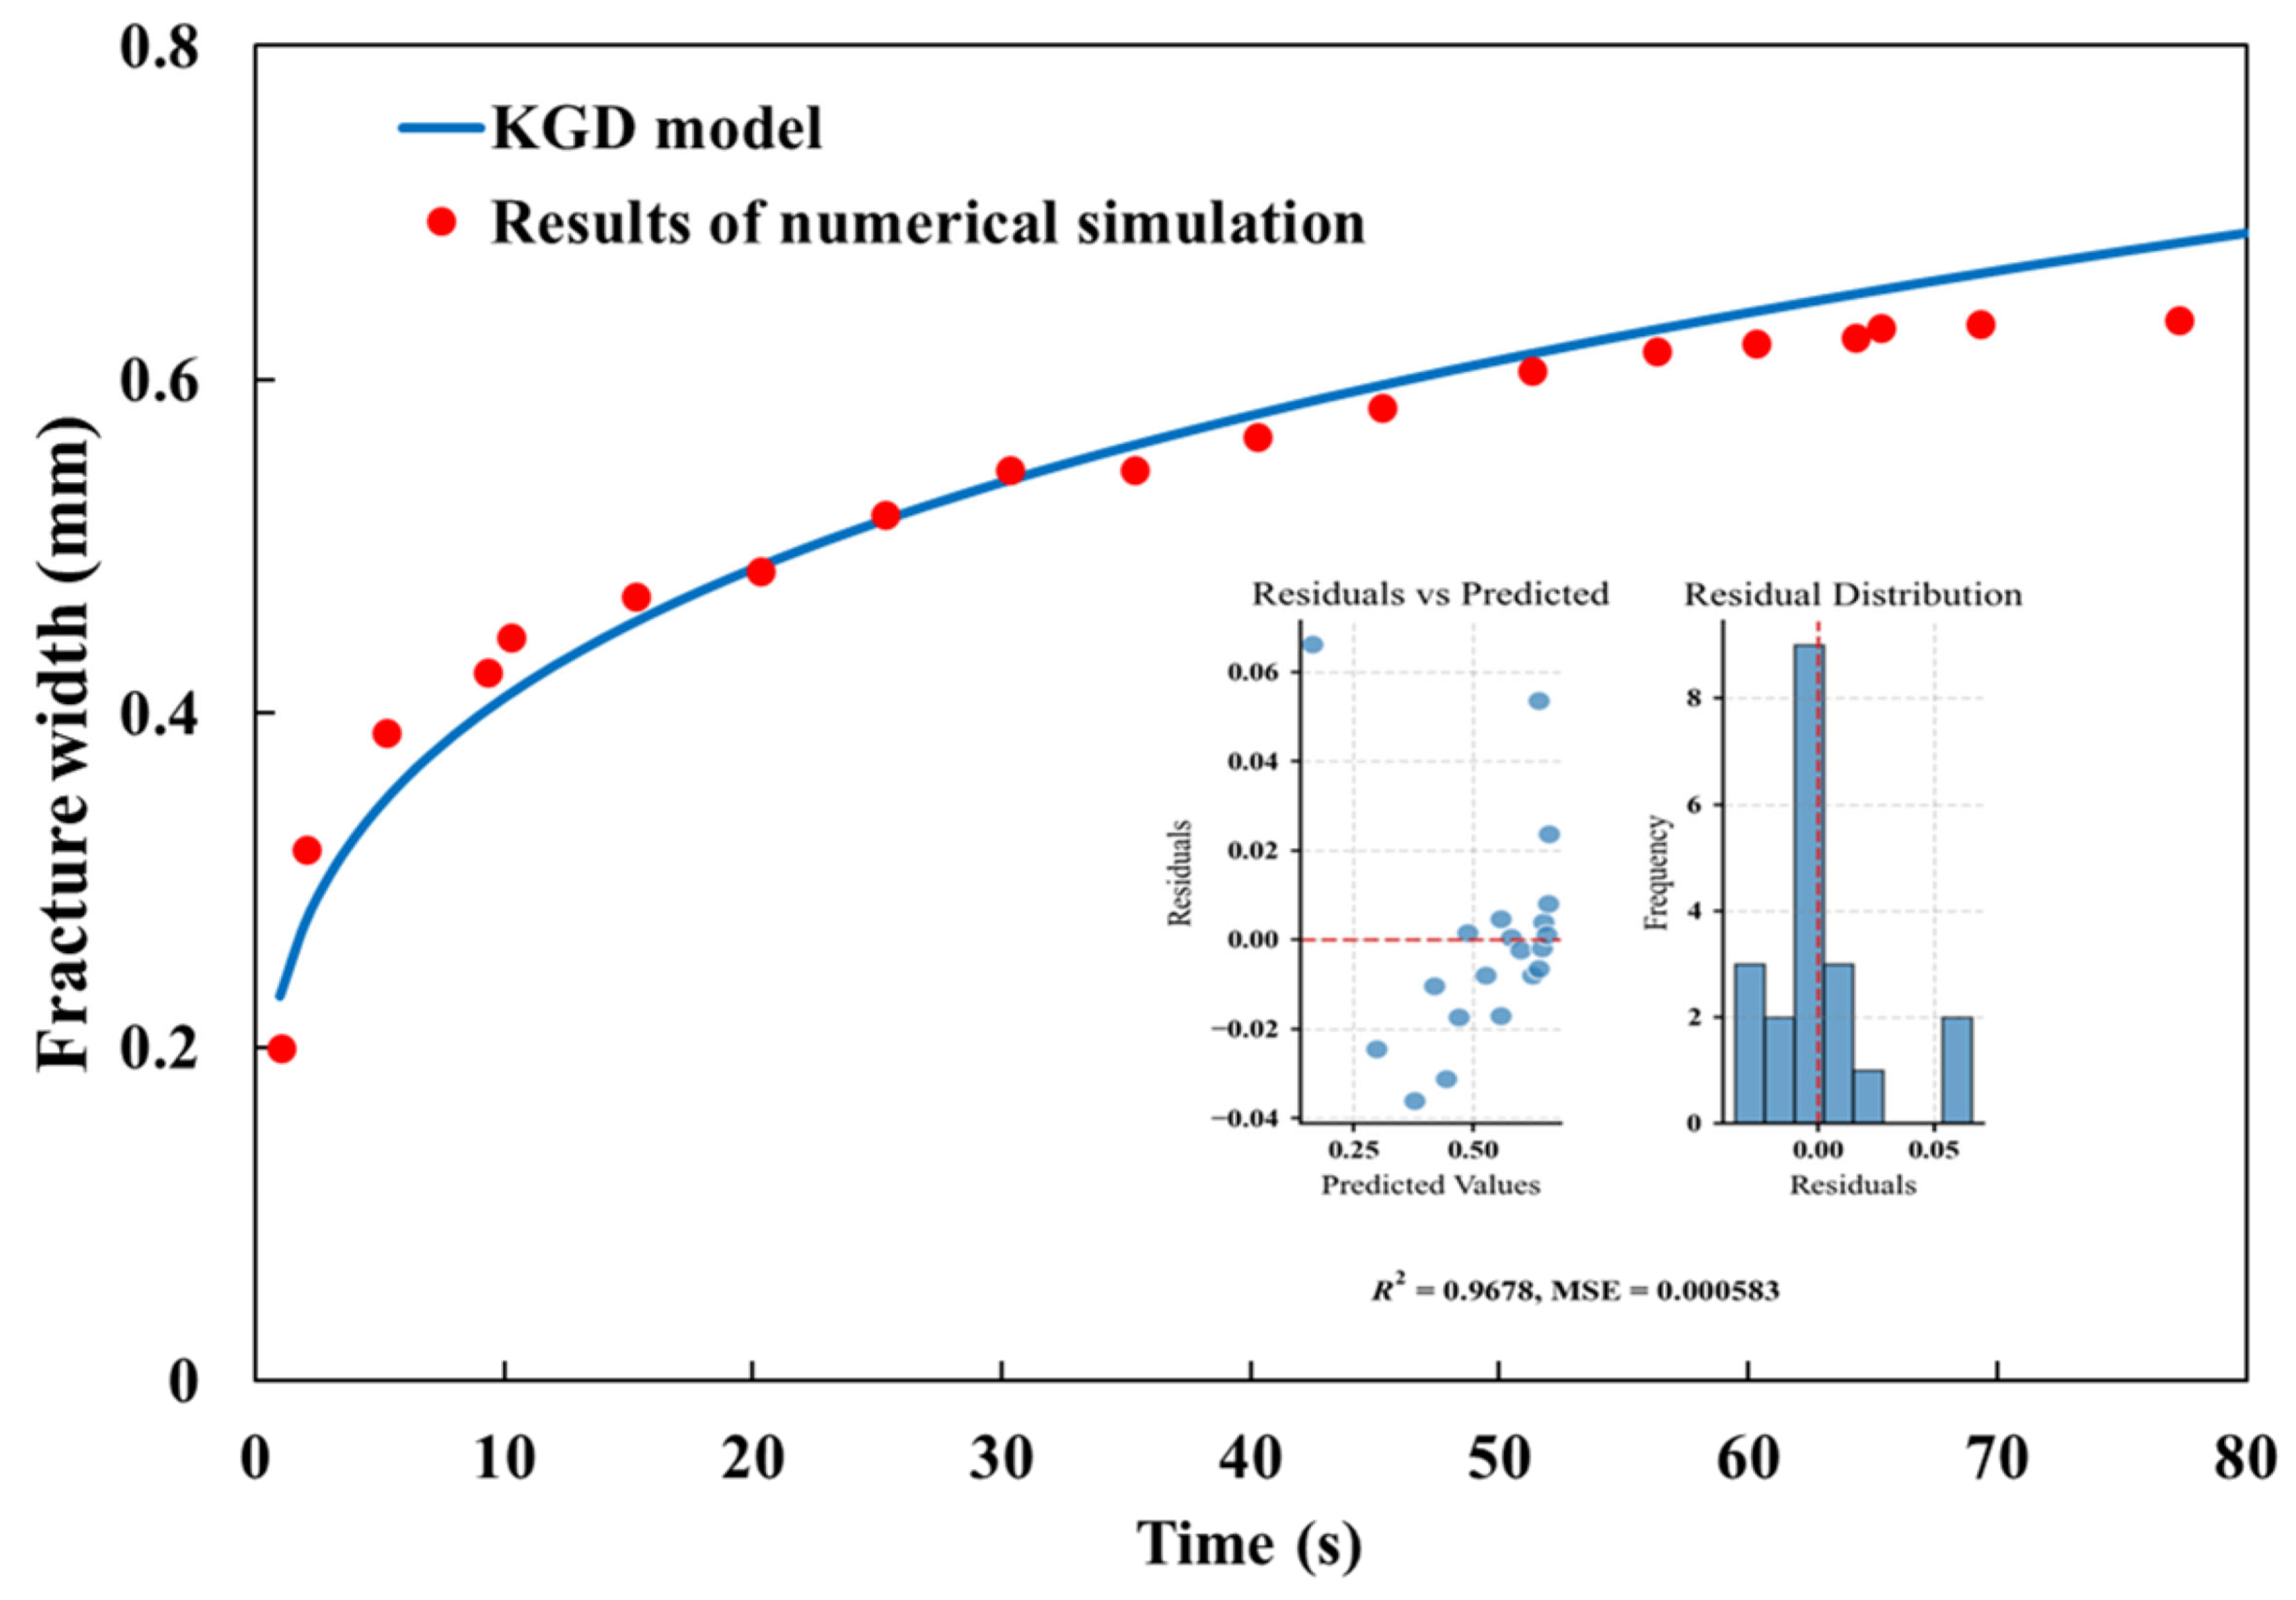
3.2.1. Model Validation

The accuracy and reliability of the CEM have been extensively validated by researchers [36,37]. In this study, a two-dimensional single-fracture propagation model was constructed based on the cohesive damage model, and the results were compared with the analytical solution of the KGD model. The basic input parameters used in the validation process are listed in Table 4. To quantitatively assess the consistency between the numerical results and the analytical benchmark, residual analysis was conducted. The comparison revealed a high degree of agreement, with a coefficient of determination (R2) of 0.9678 and a mean squared error (MSE) of 0.000583, indicating strong predictive capability and excellent numerical stability of the model. Figure 10 illustrates the comparison of the fracture width predictions between the simulation and the KGD solution. These results collectively verified the robustness and accuracy of the CEM-based numerical model.

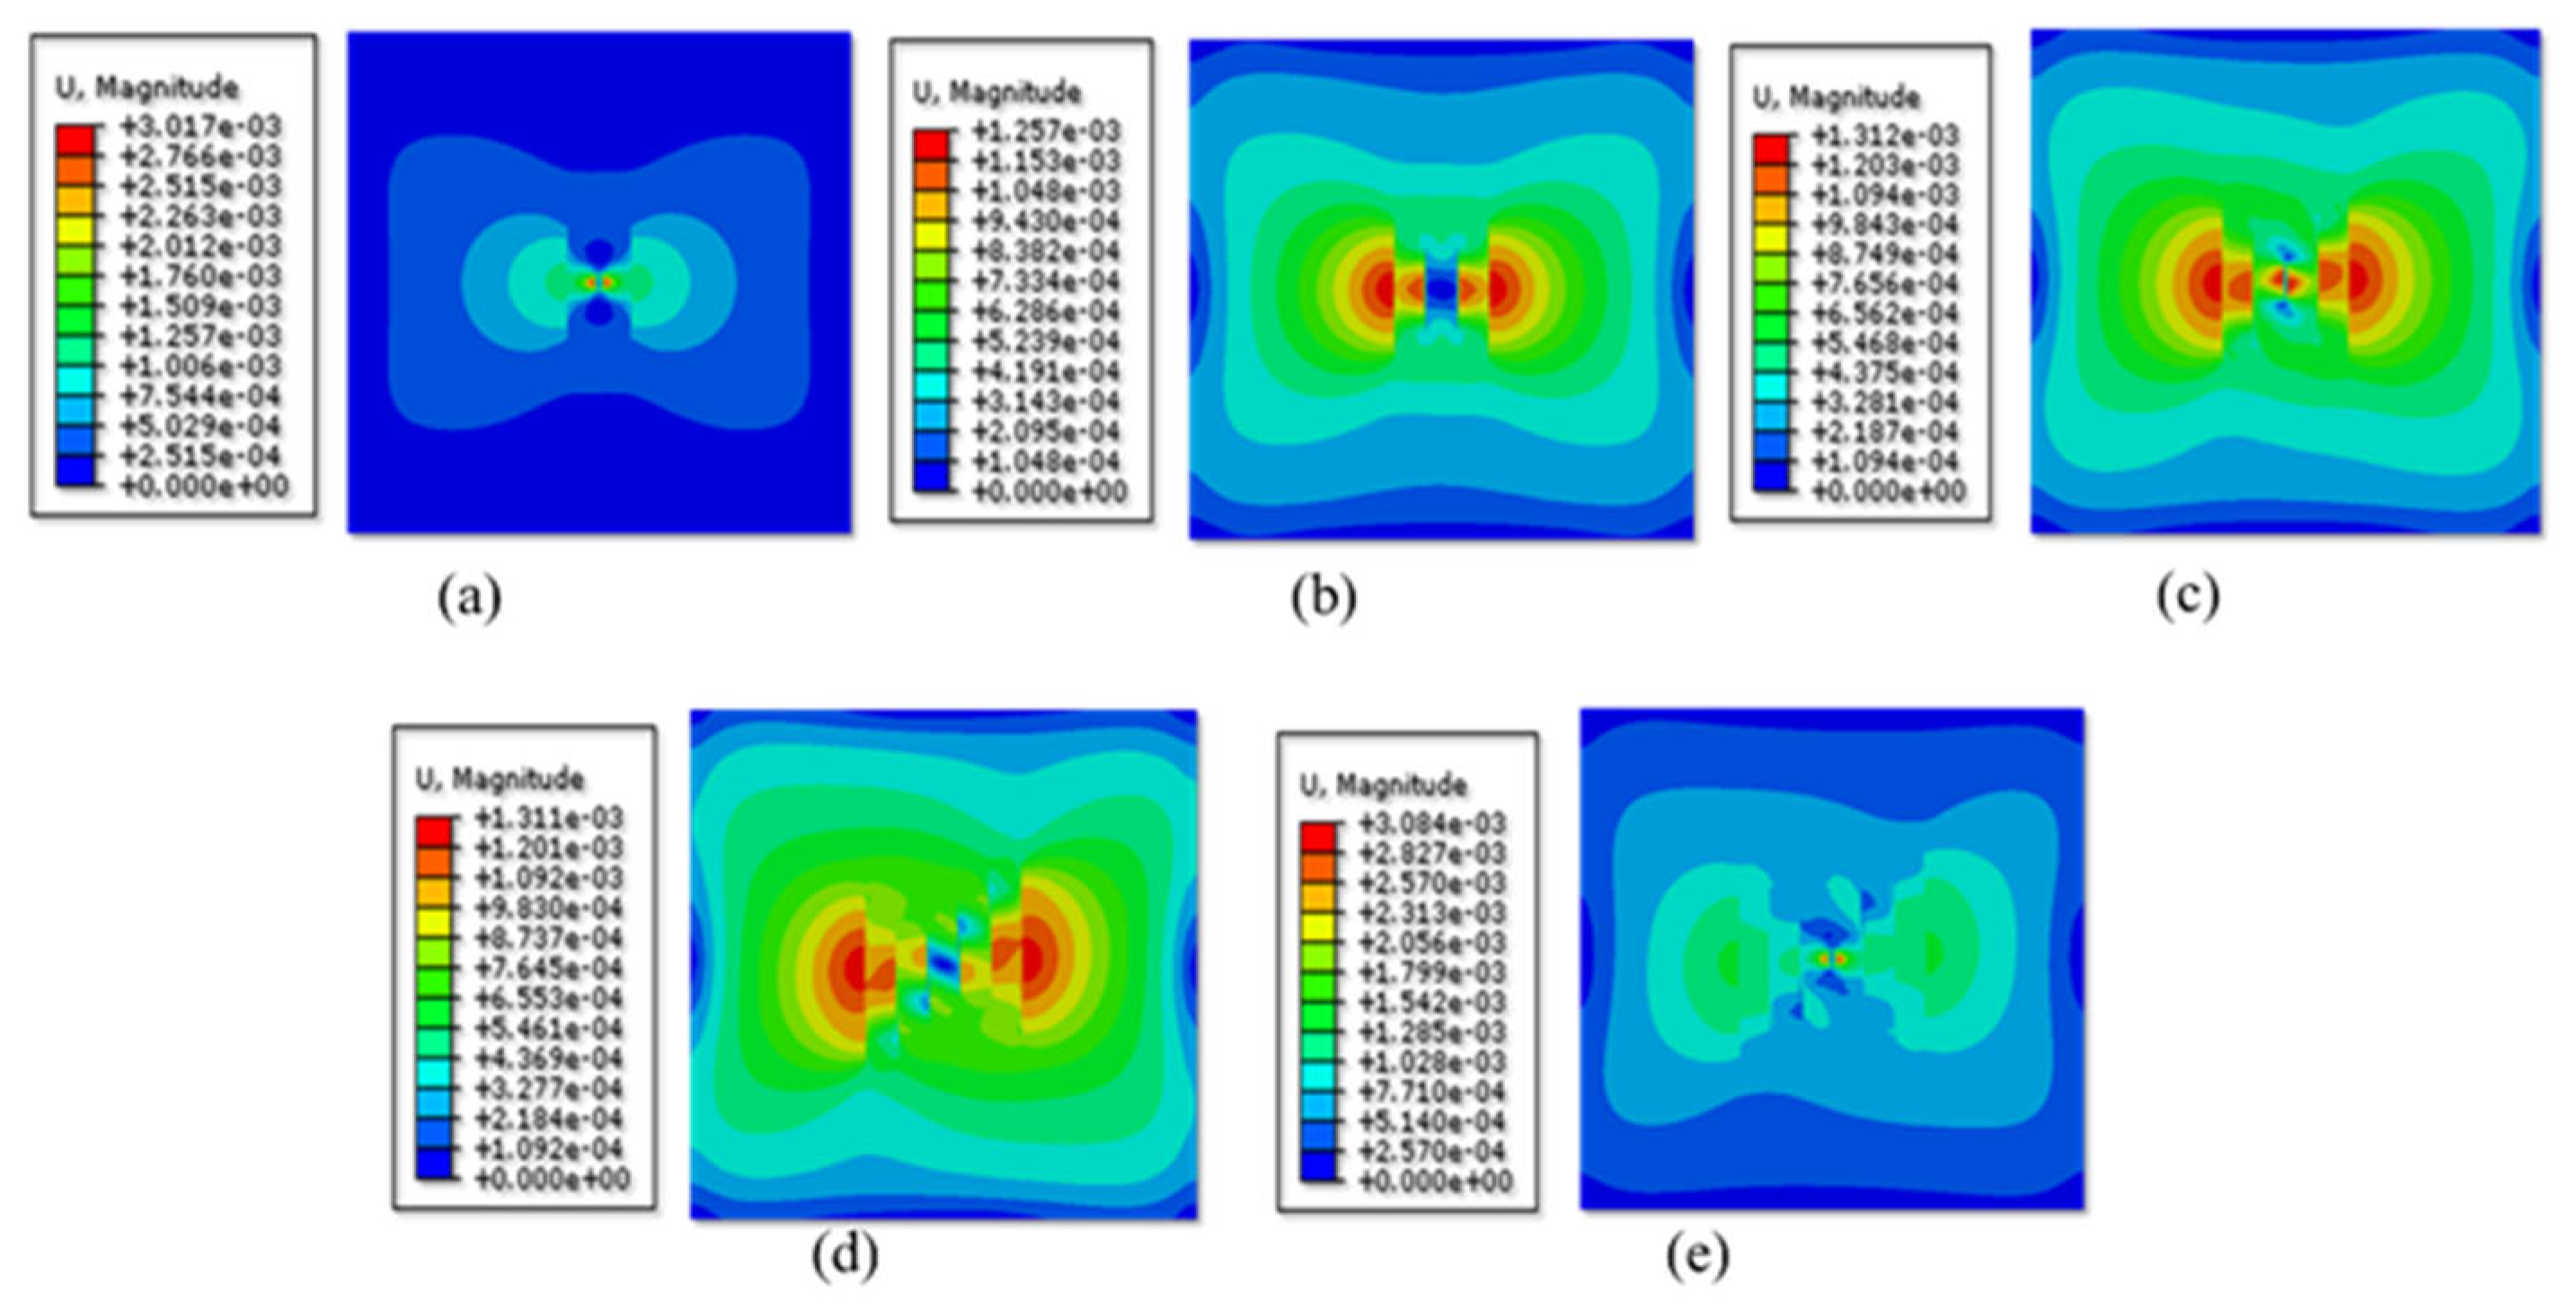
3.2.2. Analysis of Factors Influencing the Fracture Propagation Patterns
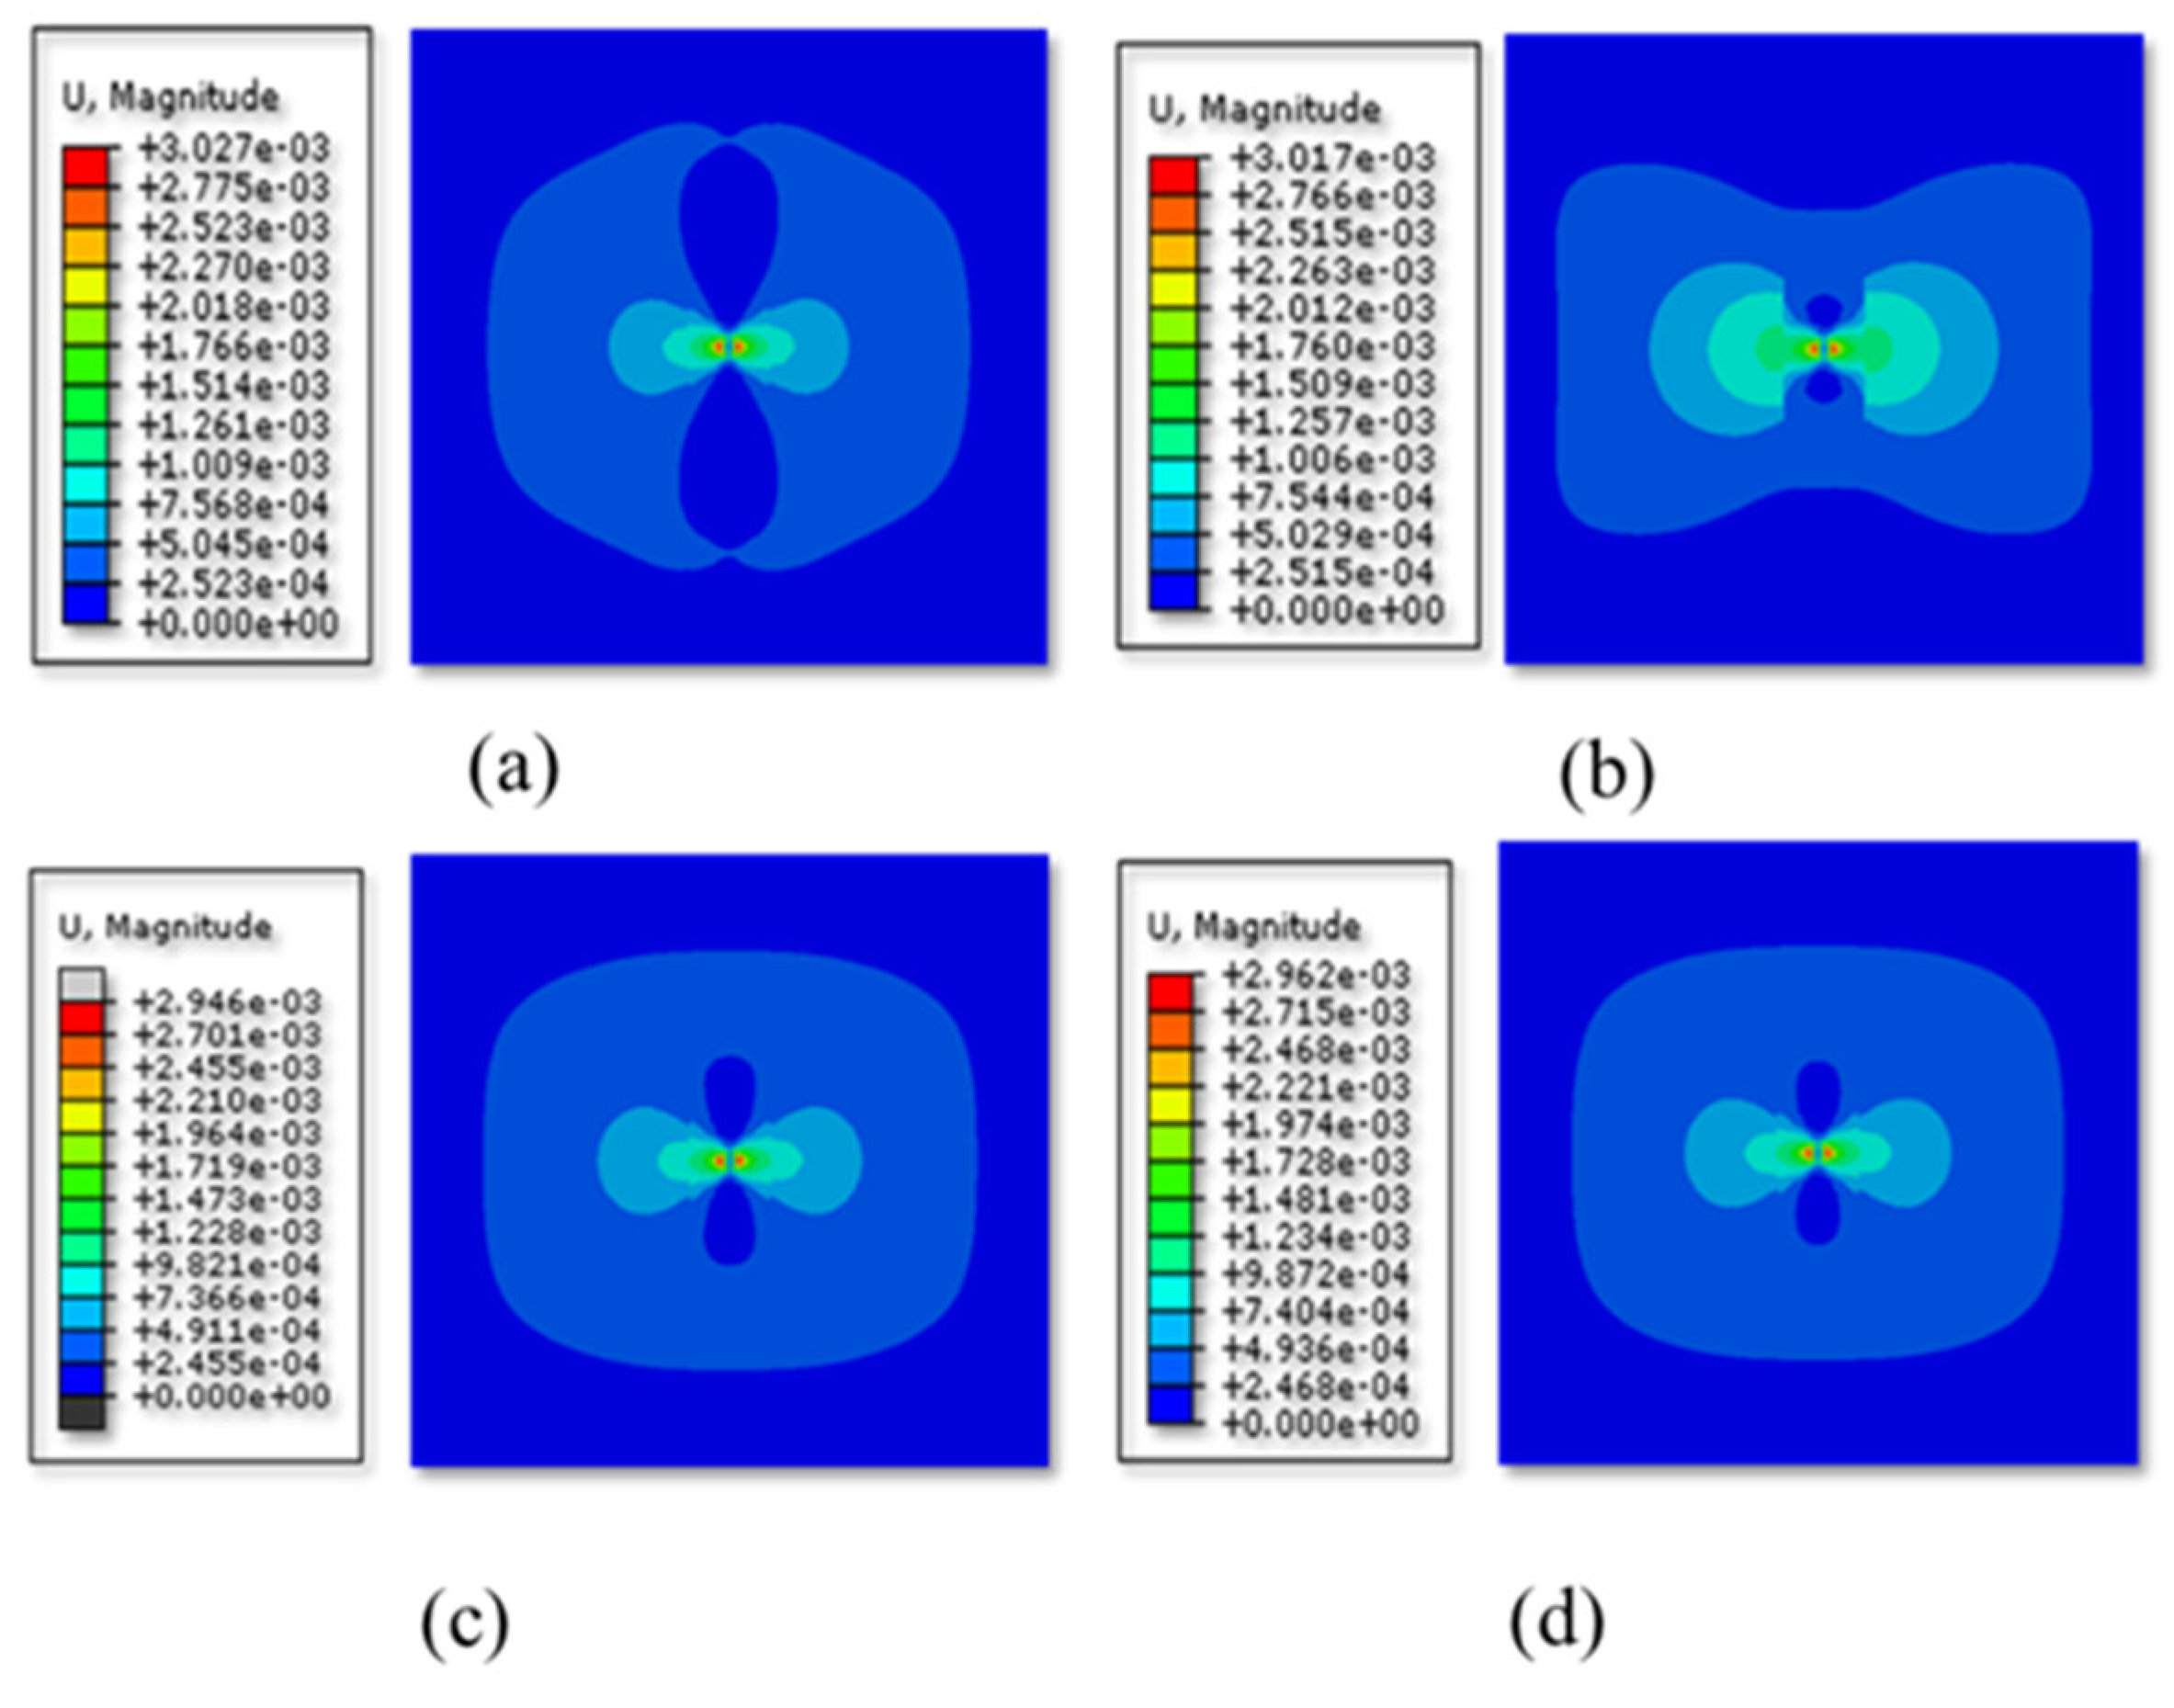
(a)
Effect of horizontal stress difference
Figure 11 illustrates the fracture propagation patterns for horizontal stress differences of 0 MPa, 5 MPa, and 10 MPa. Within the investigated range of horizontal stress differences (0–10 MPa), the middle fracture consistently exhibited the maximum fracture width. Notably, the middle fracture width was minimized when the stress difference was 0 MPa. A clear stress interference between fractures was observed. The propagation of the middle fracture significantly inhibited the lateral propagation of the fractures on either side, leading to a fracture morphology characterized by a short and wide middle fracture flanked by longer and narrower side fractures. As shown in Figure 12, the horizontal stress difference had a limited impact on the maximum fracture width. However, the horizontal stress difference exerted a noticeable influence on the total fracture length and stimulated volume. At a horizontal stress difference of 10 MPa, although the total fracture length decreased slightly, the stimulated volume increased. This increase in stimulated volume may be related to the larger fracture widths achieved at this stress difference, suggesting that higher horizontal stress differences tend to promote the formation of wider fractures.
(b)
Effect of the number of perforation clusters
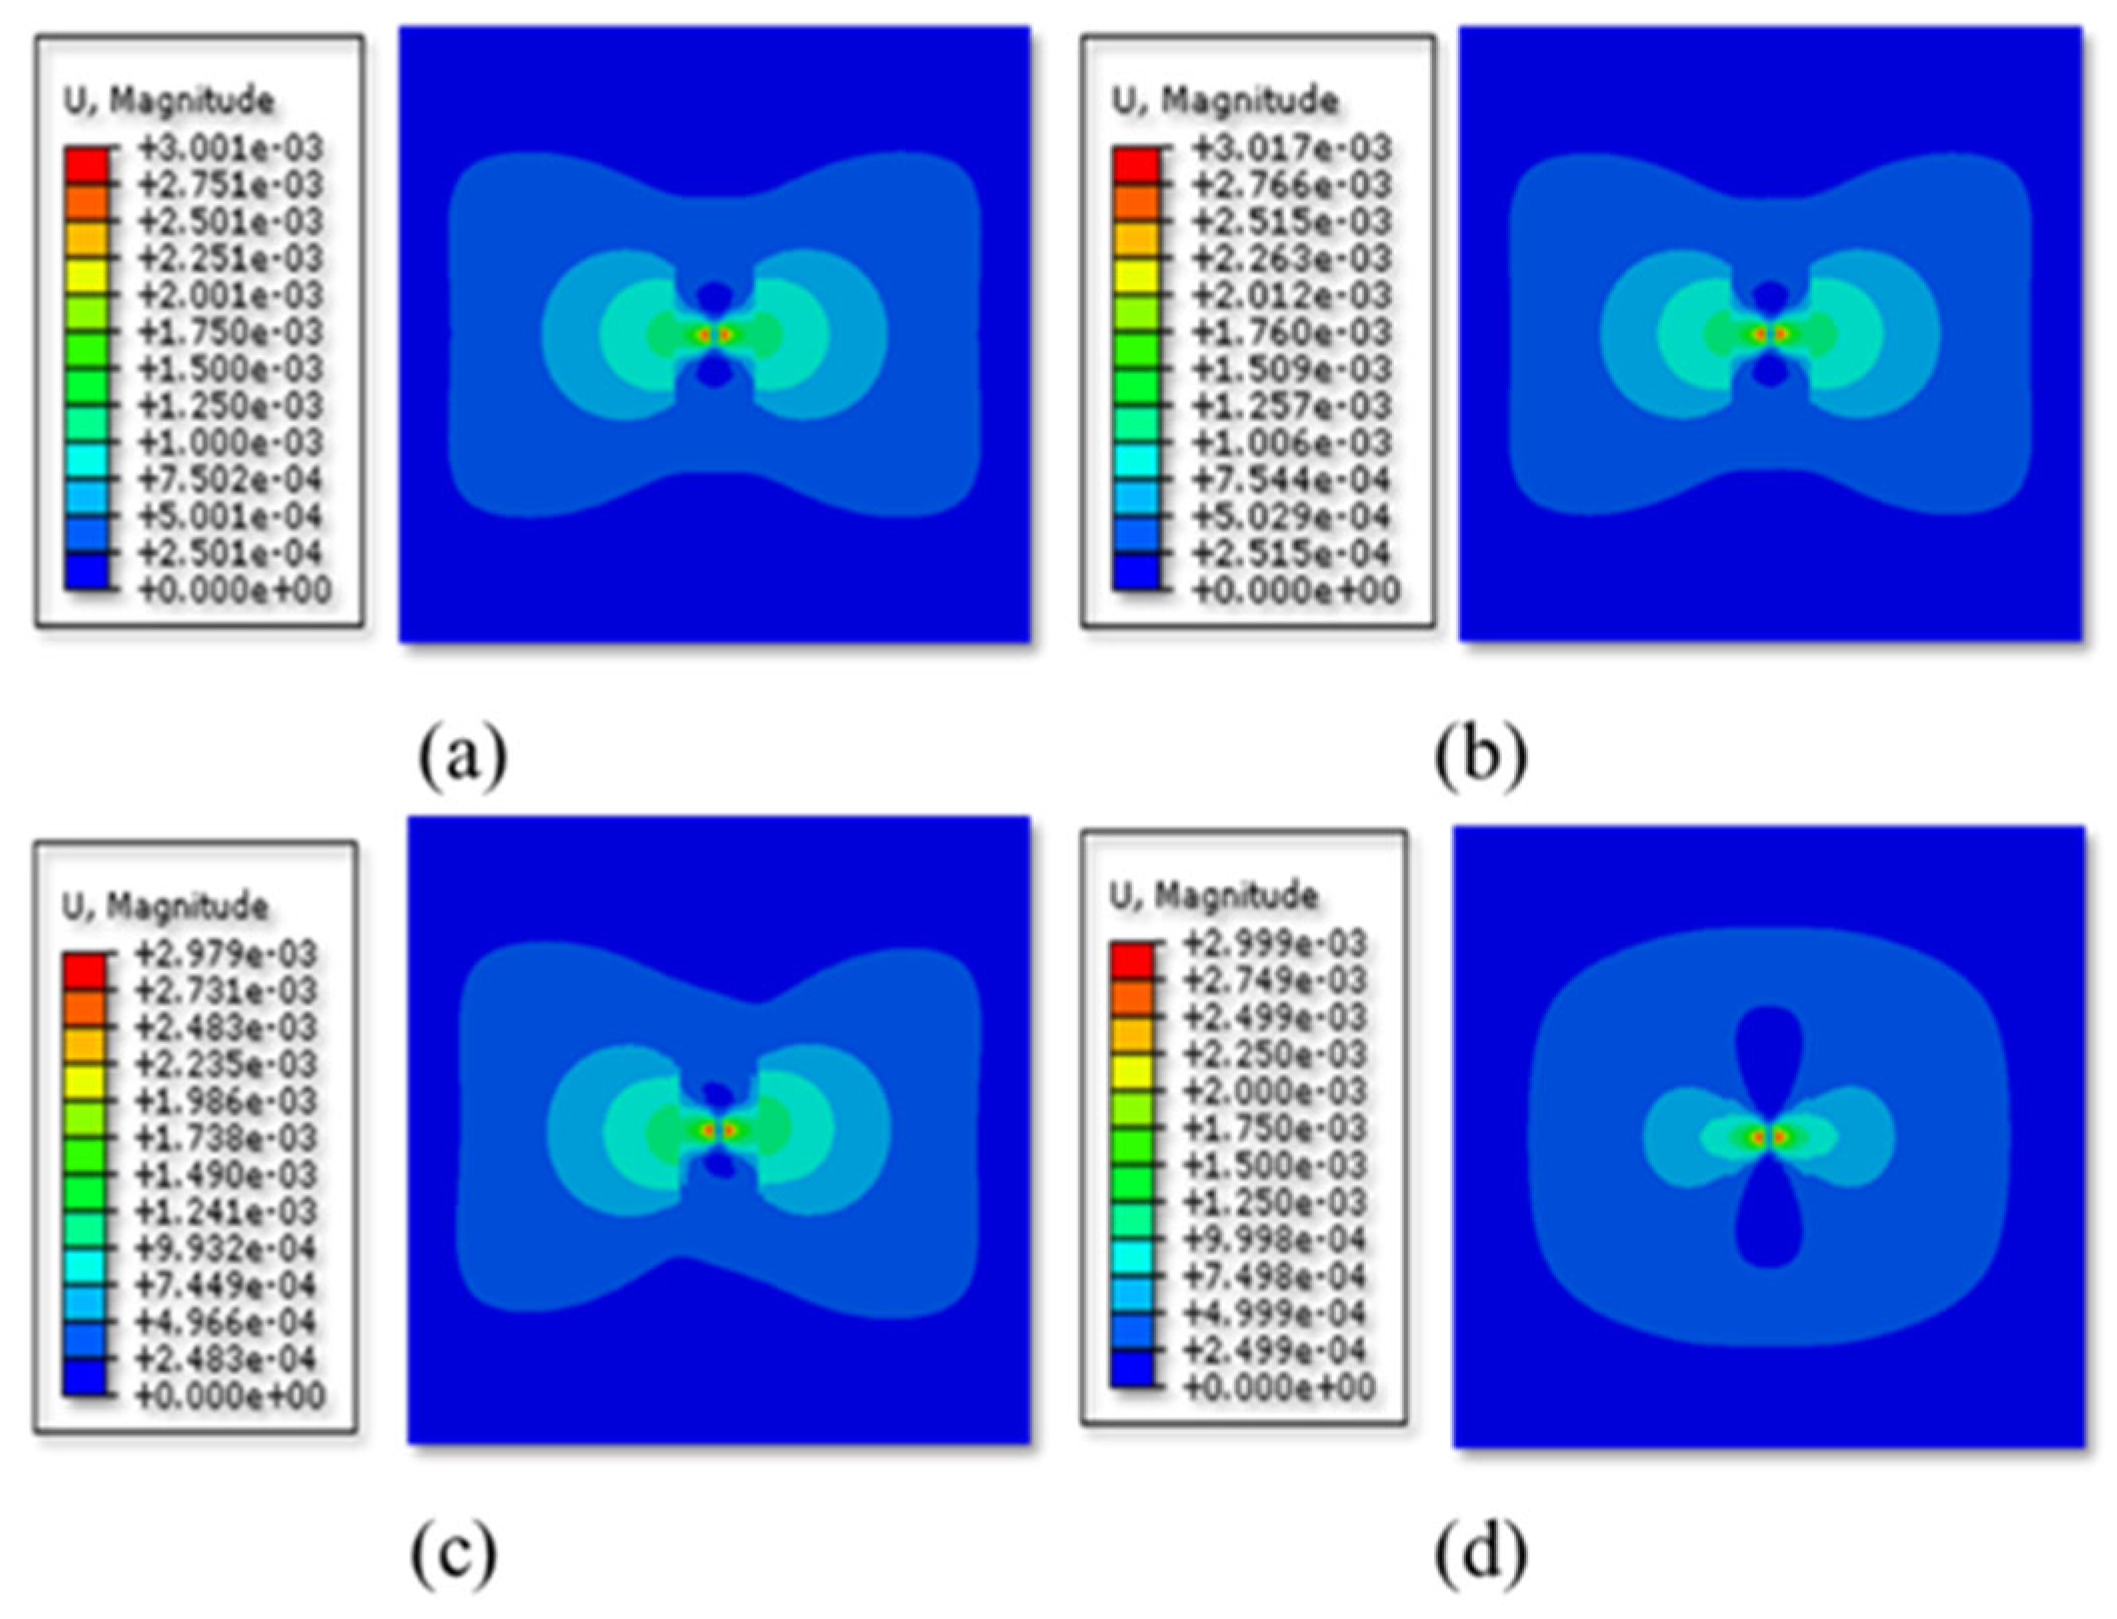
Figure 13 displays the fracture propagation patterns for three, four, five, six, and seven perforation clusters. Within the range of 3–5 perforation clusters, the middle fracture consistently exhibited the maximum fracture width, particularly when the number of perforation clusters was odd. When the number of perforation clusters was even (four and six clusters), the multi-cluster fractures propagated more uniformly. A clear stress interference between fractures was observed, with the propagation of the middle fracture significantly inhibiting the lateral propagation of the fractures on either side, leading to a fracture morphology characterized by a short and wide middle fracture flanked by longer and narrower side fractures. When the number of perforation clusters exceeded five, stress deflection occurred, and the fractures no longer exhibited a symmetrical bi-wing pattern. As shown in Figure 14, the number of perforation clusters had a significant impact on the maximum fracture width, total fracture length, and stimulated volume. The total fracture length and stimulated volume exhibited a positive correlation with the number of perforation clusters. Specifically, when the number of perforation clusters increased from three to seven, the fracture volume increased by 263%, and the total fracture length increased by 178%.
(c)
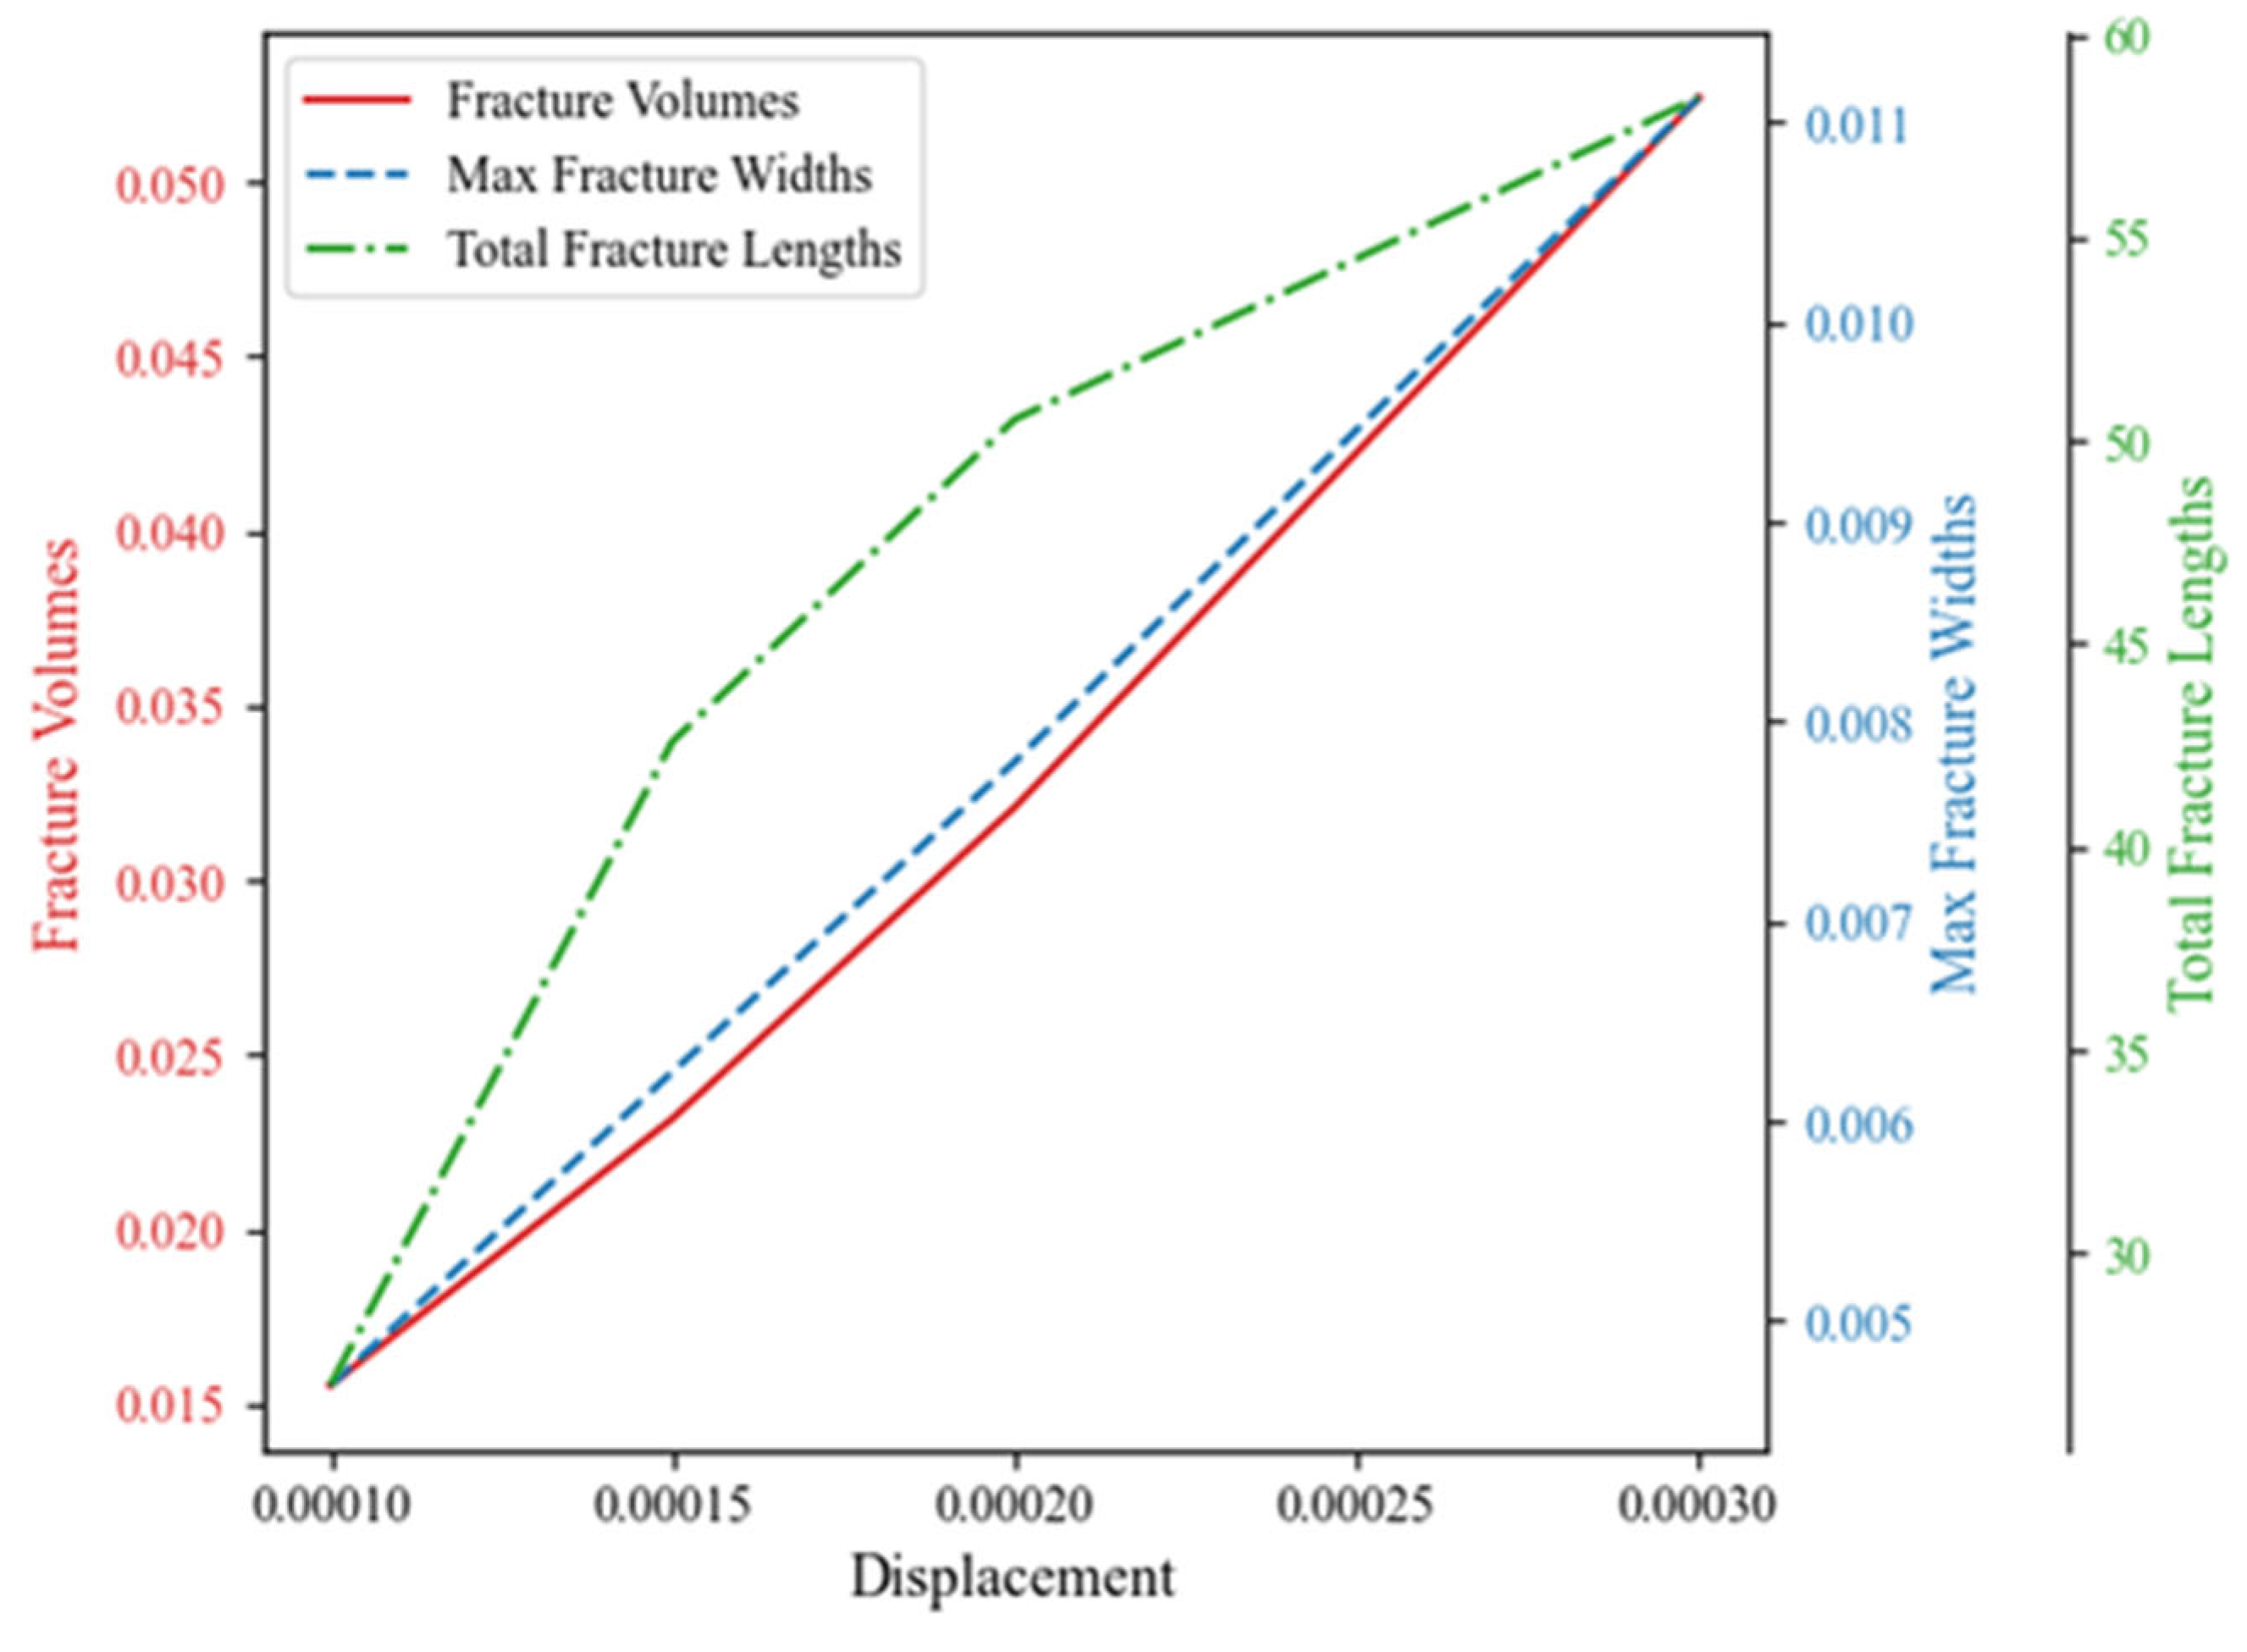
Effect of the injection rate
The effect of different fracturing fluid injection rates on fracture width is shown in Figure 15. Within the investigated range of injection rates (0.0001–0.0003 m3/s), the middle fracture consistently exhibited the maximum fracture width. The middle fracture width was maximized at an injection rate of 0.0003 m3/s. The injection rate had a significant impact on the maximum fracture width, total fracture length, and stimulated volume. The maximum fracture width, total fracture length, and stimulated volume were all maximized at an injection rate of 0.0003 m3/s. Figure 16 shows that there was a significant positive correlation between injection rate and fracture parameters. Within a certain range, a higher injection rate was more conducive to reservoir fracturing. Specifically, when the injection rate increased from 0.0001 to 0.0003 m3/s, the total fracture length, maximum fracture width, and stimulated volume increased by 118%, 138%, and 237%, respectively.
(d)
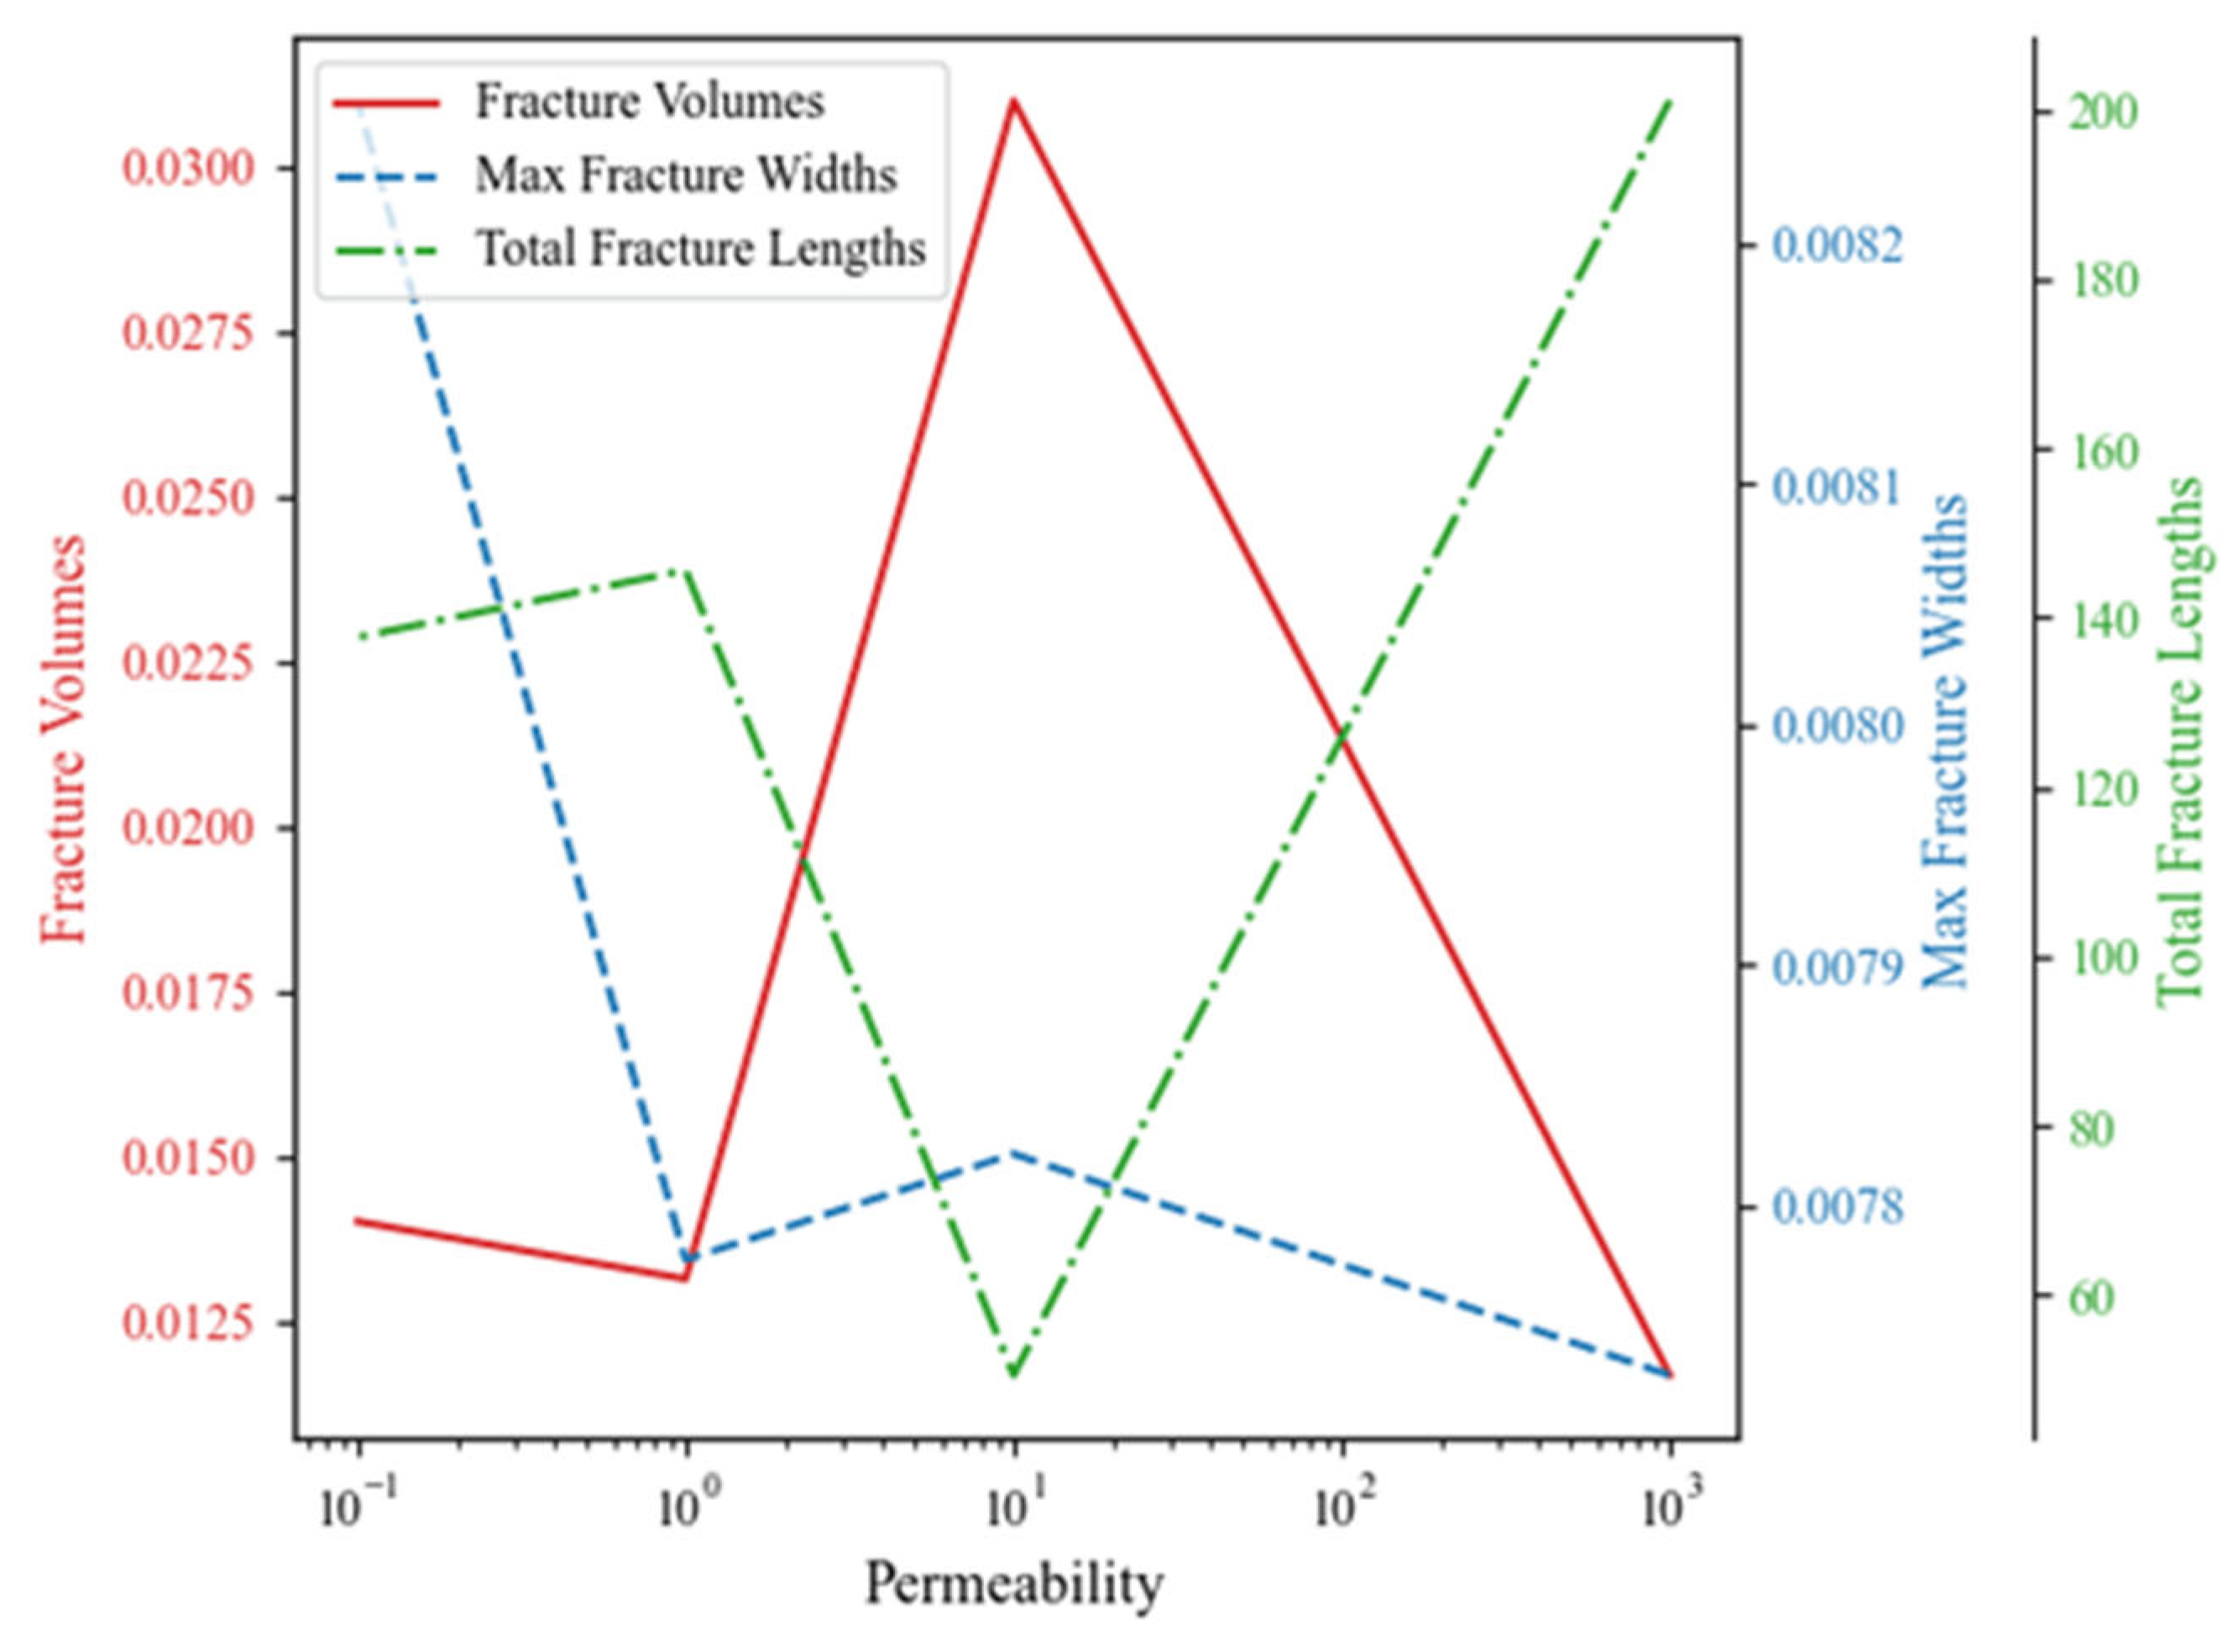
Effect of permeability
The effect of permeability on fracture width is illustrated in Figure 17. Within the investigated permeability range (0.1–1000 mD), the central fracture consistently exhibited the greatest fracture width. A clear stress shadowing effect was observed among the fractures. The propagation of the central fracture significantly suppressed the lateral extension of adjacent fractures, resulting in a fracture geometry characterized by a short and wide central fracture flanked by longer and narrower peripheral fractures.
As shown in Figure 18, permeability exhibited a minimal influence on the maximum fracture width across the tested range. This was likely because fracture width is primarily governed by local fluid pressure and near-tip stress concentration, which remained sufficiently high during the early propagation stages. Given the short simulation duration and high injection pressure, fluid leak-off into the formation was limited, especially at low permeability; so, the peak fracture aperture remained relatively unaffected. In contrast, permeability significantly affected total fracture length and volume, as higher permeability facilitated pressure diffusion and altered the propagation extent of peripheral fractures. These observations indicate that while maximum width is locally controlled, fracture volume and network growth are more sensitive to formation permeability.
(e)
Effect of the elastic modulus
The effect of the elastic modulus on fracture width is shown in Figure 19. Within the investigated range of elastic moduli (20–35 GPa), the middle fracture consistently exhibited the maximum fracture width, particularly at an elastic modulus of 20 GPa. When the elastic modulus was 25 GPa, the two outer fracture clusters exhibited larger widths, while the fracture widths were generally smaller in the other cases. Significant stress interference between fractures was observed at both low and high elastic moduli. The propagation of the middle fracture significantly inhibited the lateral propagation of the fractures on either side, leading to a fracture morphology characterized by a short and wide middle fracture flanked by longer and narrower side fractures.
As shown in Figure 20, the elastic modulus had a limited impact on the maximum fracture width, which peaked at 20 GPa. However, the elastic modulus exerted a significant influence on the total fracture length and stimulated volume. The total fracture length was lower at 25 GPa, but the stimulated volume was maximized, potentially due to the larger widths of the two outer fracture clusters.
(f)
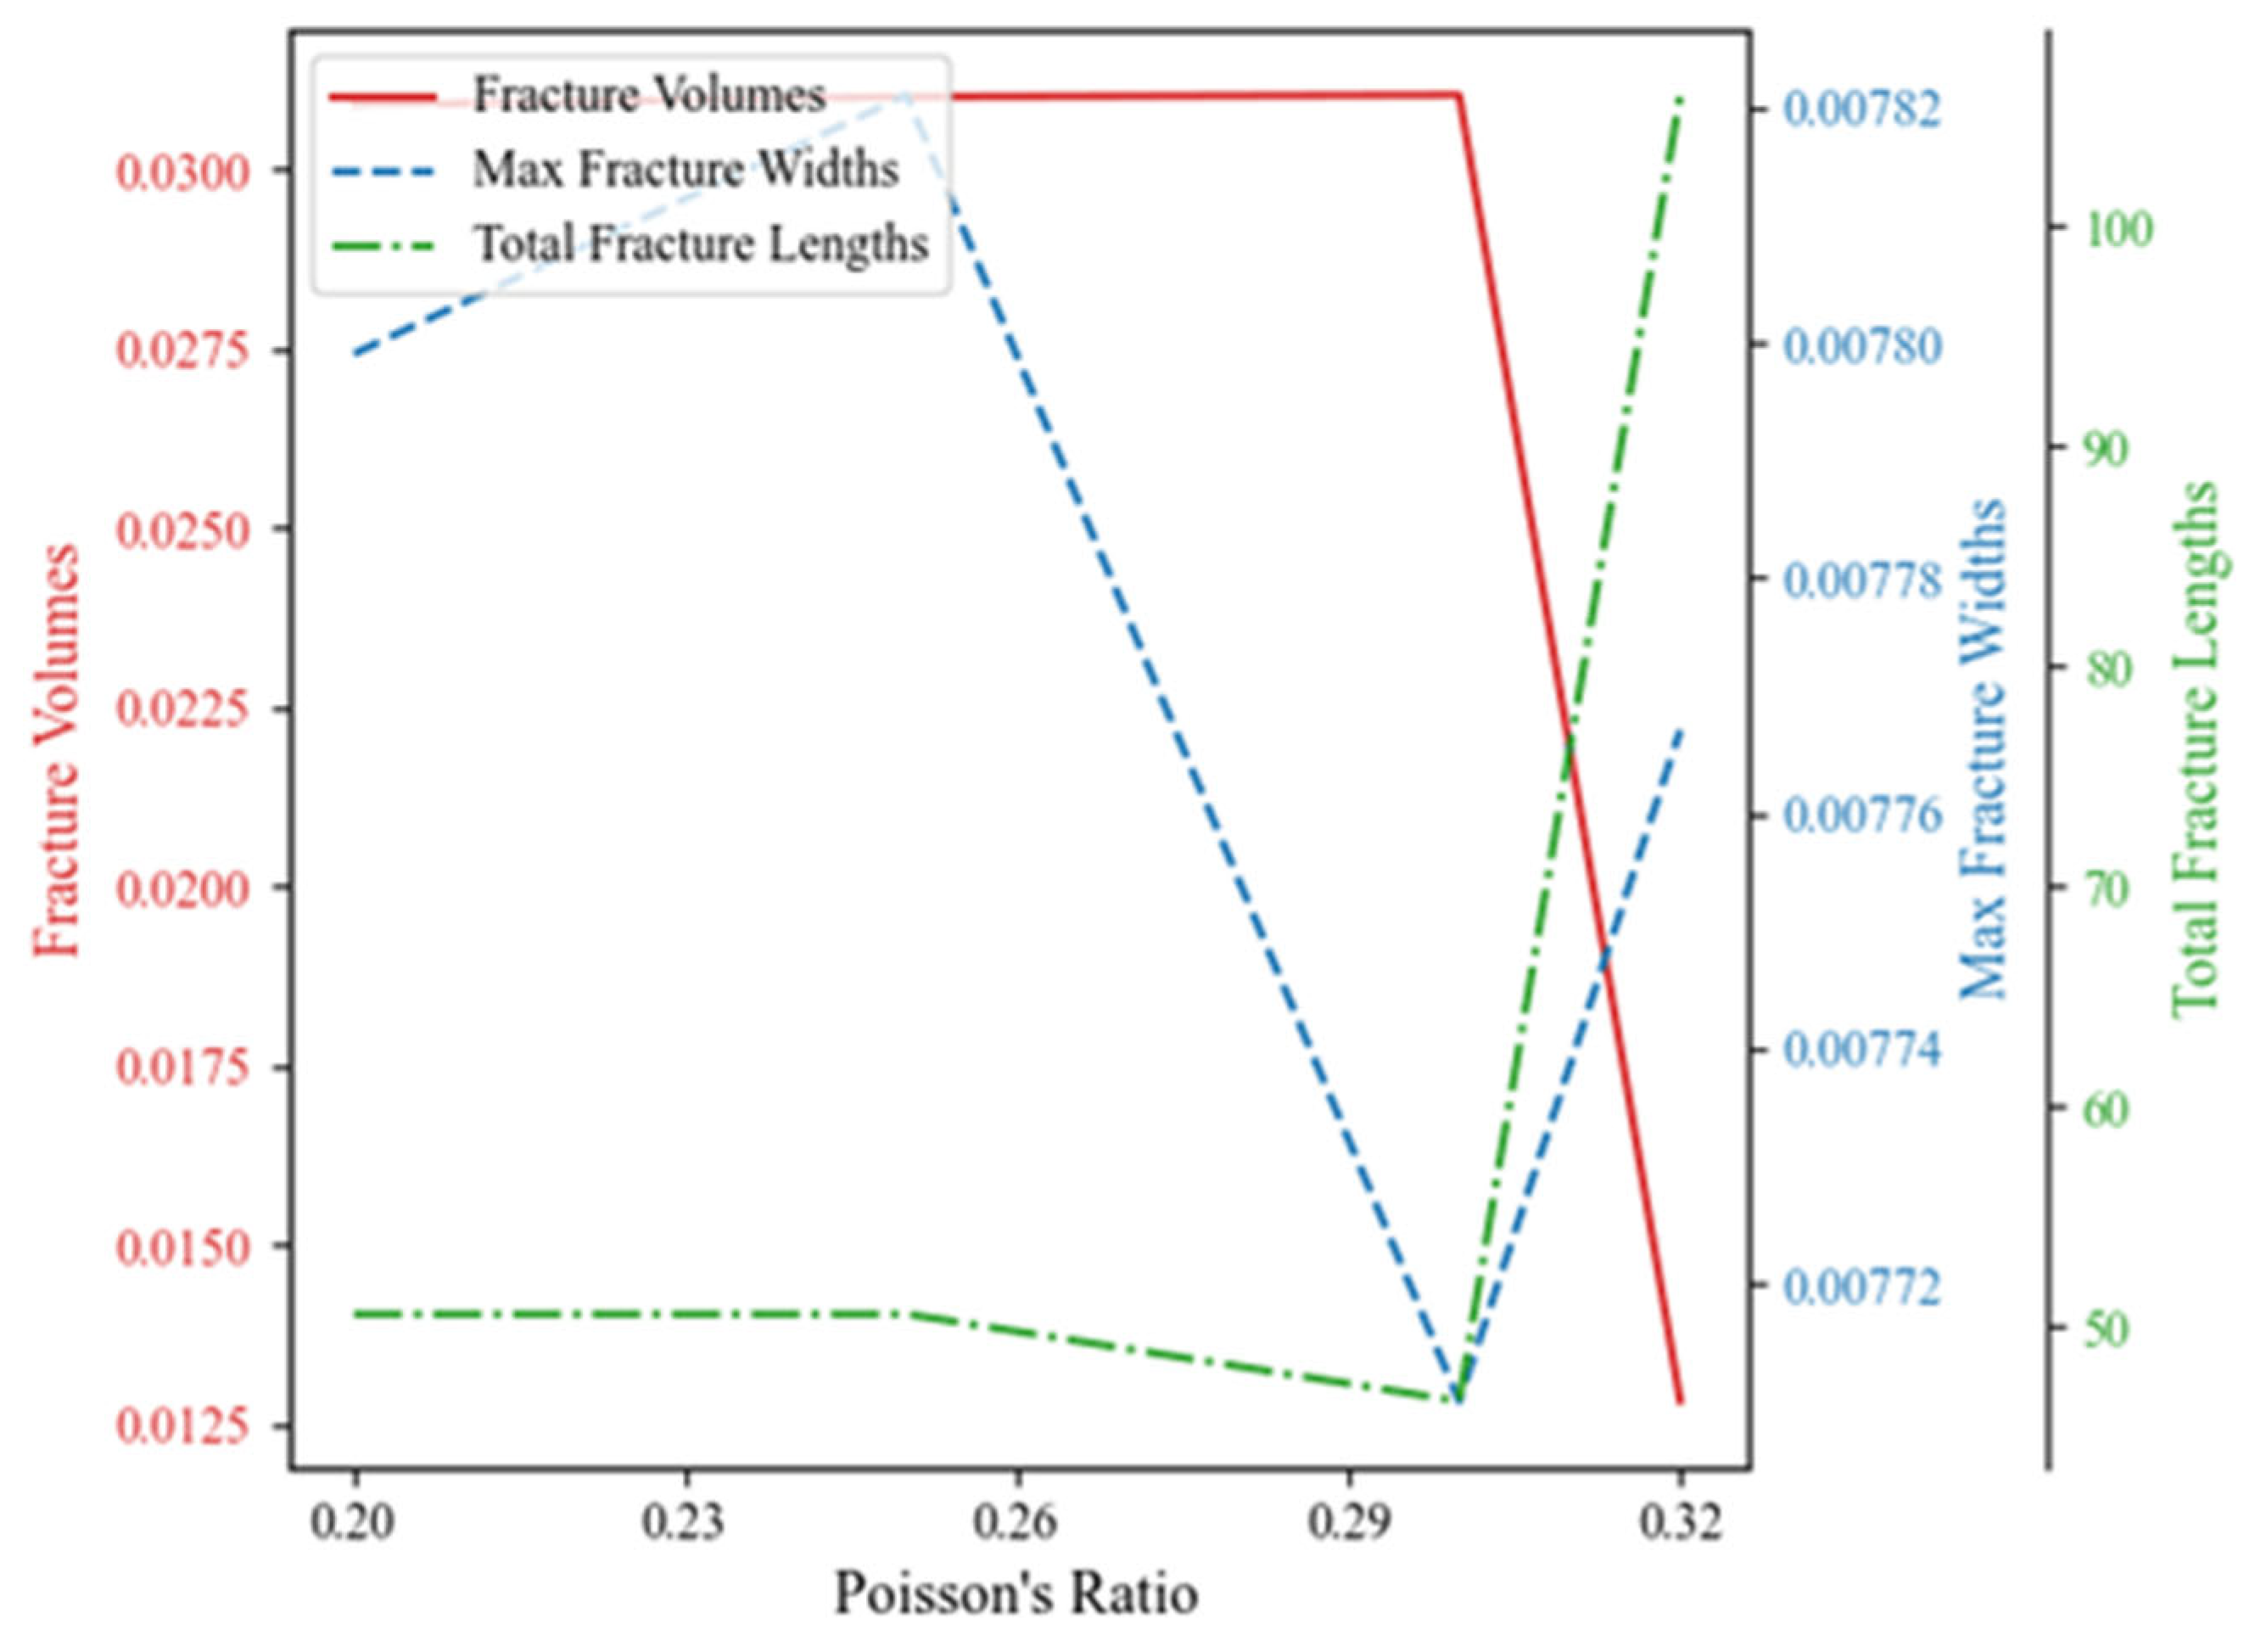
Effect of Poisson’s ratio
The fracture propagation patterns for Poisson’s ratios within the range of 0.2–0.32 are shown in Figure 21. Within this range, the middle fracture consistently exhibited the maximum fracture width. The middle fracture width was minimized at a Poisson’s ratio of 0.3. The expansion of the middle fracture significantly affected the two outer fracture clusters at a Poisson’s ratio of 0.32, resulting in their minimum widths. Significant stress interference between fractures was observed. The propagation of the middle fracture significantly inhibited the lateral propagation of the fractures on either side, leading to a fracture morphology characterized by a short and wide middle fracture flanked by longer and narrower side fractures.
As shown in Figure 22, Poisson’s ratio had a limited impact on the maximum fracture width, which was minimized at a value of 0.3. However, Poisson’s ratio significantly influenced the total fracture length and stimulated volume. The total fracture length was lower at a Poisson’s ratio of 0.3, but the stimulated volume was maximized, potentially due to the larger widths of the two outer fracture clusters. When the Poisson’s ratio was further increased, the widths of the side fractures decreased significantly, while their lengths increased, resulting in a substantial reduction in the overall stimulated volume.

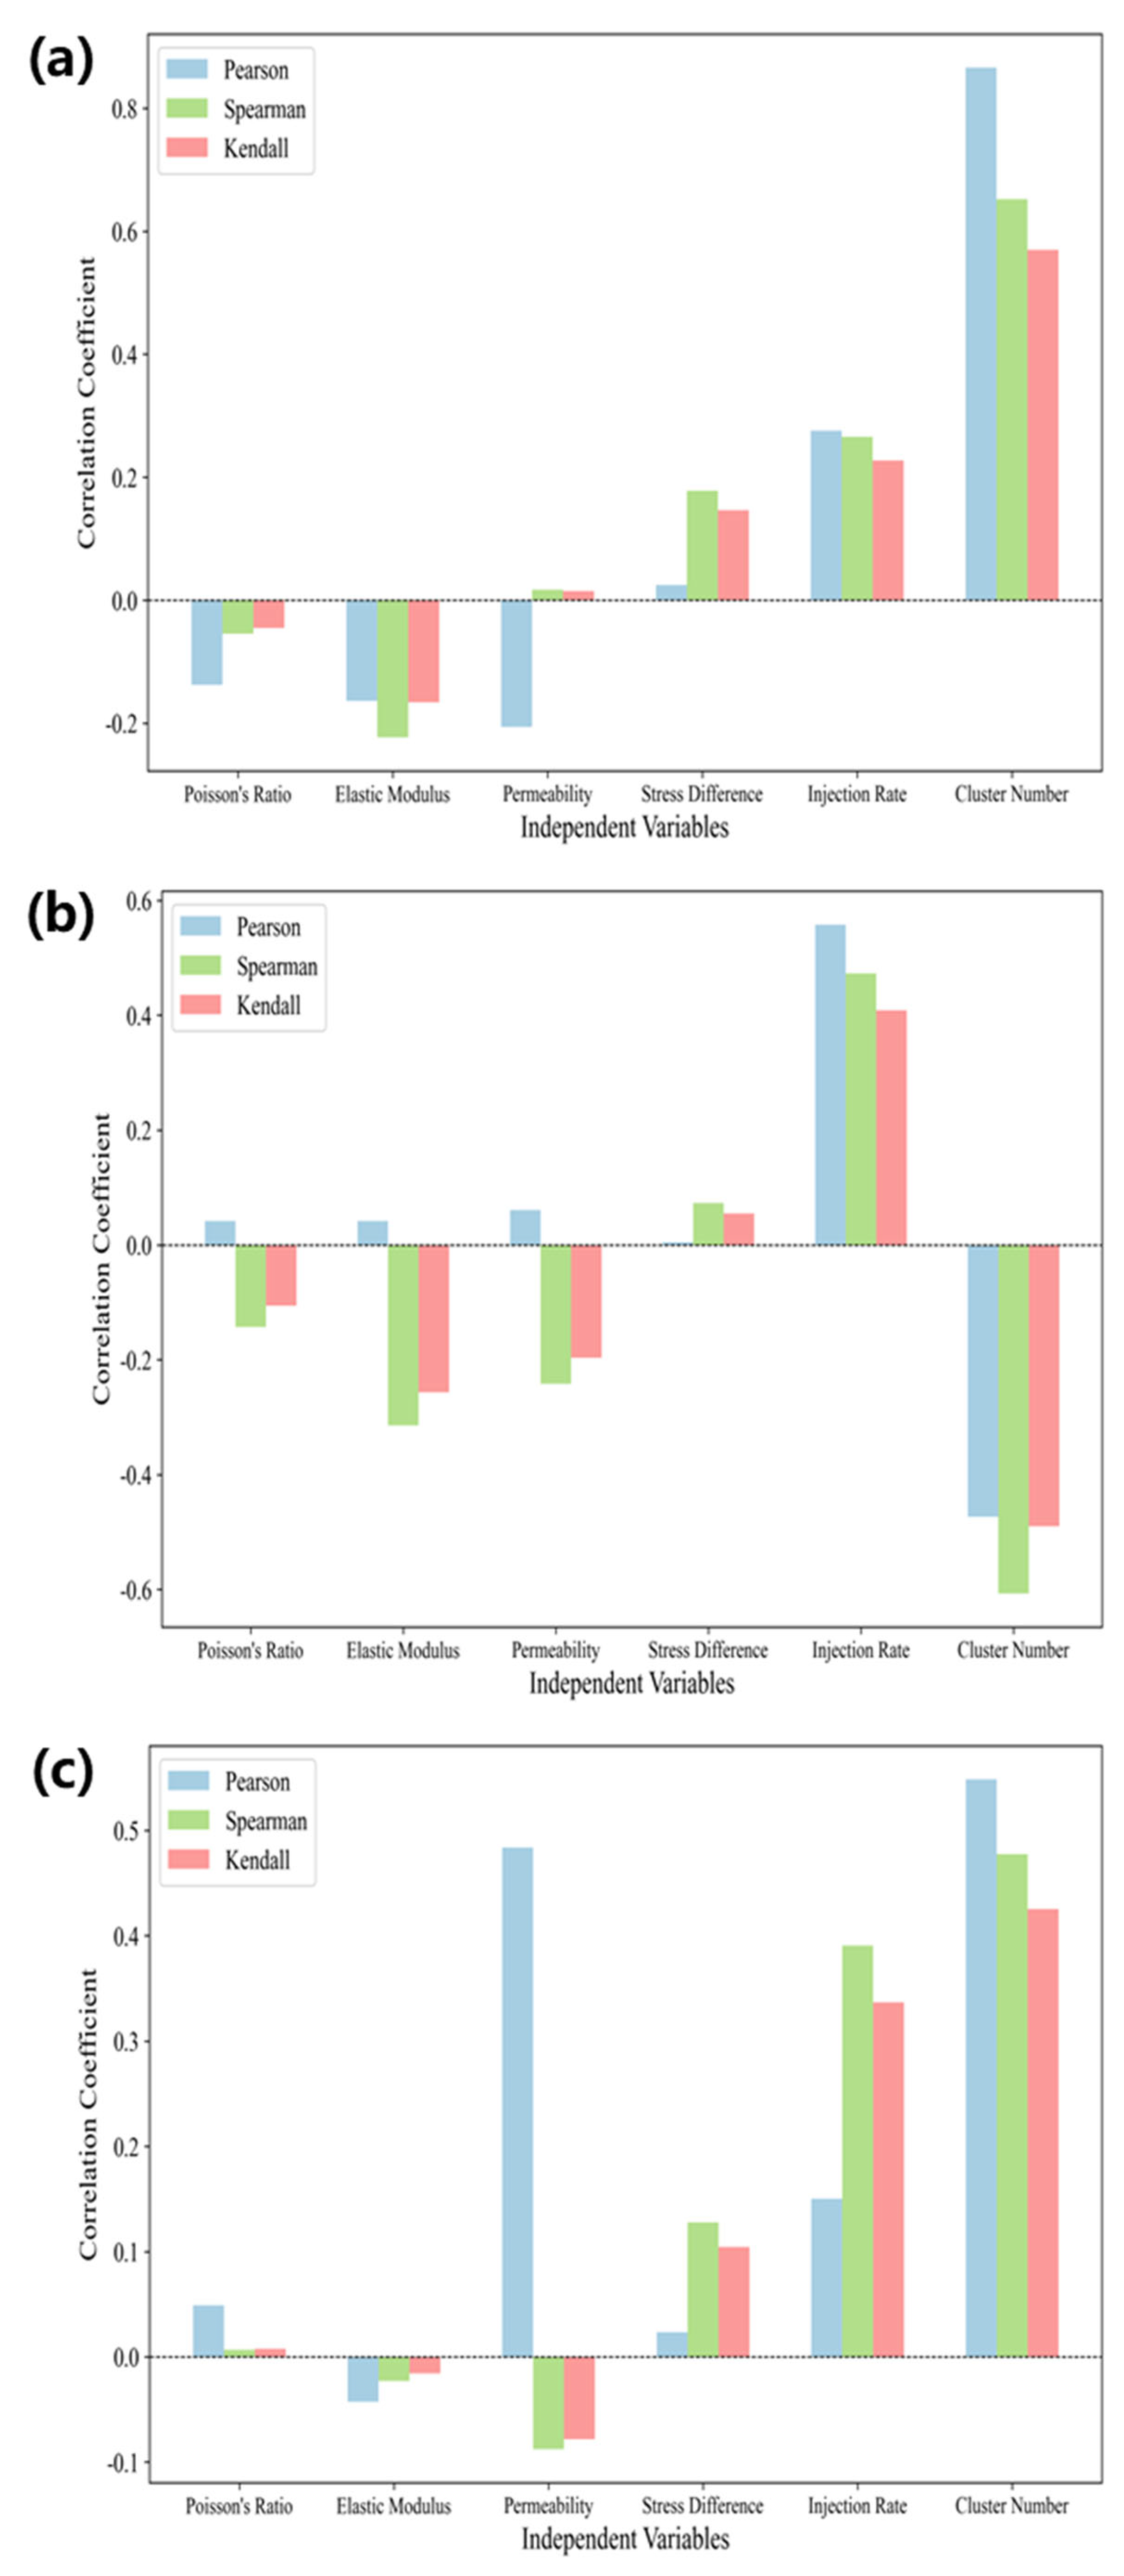
3.3. Dominant Factor Analysis of Fracture Morphology

Based on the results of the aforementioned numerical simulations of fracture propagation, variance analysis, correlation analysis, and principal component analysis were conducted to investigate the specific degree to which the above factors influenced the fracture parameters. In the variance and correlation analyses, analysis of variance (ANOVA) [38] and three different correlation coefficients (Pearson’s, Spearman’s, and Kendall’s) were used to identify the parameters with statistically significant impacts on stimulated volume, maximum fracture width, and total fracture length. For principal component analysis (PCA), a covariance matrix was constructed from the input data, followed by eigenvalue decomposition to extract the principal components. The contribution of each parameter was evaluated based on the loadings and the explained variance ratio.
The variance analysis results indicated that the number of perforation clusters, injection rate, and permeability exhibited a strong control over the variation in stimulated volume. Injection rate and number of perforation clusters were dominant in influencing the maximum fracture width. For total fracture length, the number of perforation clusters and permeability appeared as the key influencing factors, as shown in Figure 23. Overall, the number of perforation clusters ranked among the top controlling factors for all three parameters, suggesting that the spatial distribution characteristics of fractures have a significant impact on multiple aspects of fracture morphology. The injection rate also demonstrated a high degree of influence on different fracture morphology indicators, reflecting the role of rock deformation under external forces in shaping fracture morphology.
The correlation coefficient analysis further supported the conclusions of the variance analysis. For stimulated volume, maximum fracture width, and total fracture length, the number of perforation clusters and the injection rate ranked among the top controlling factors in the correlation coefficient analysis, as shown in Figure 24. In addition, the elastic modulus was also prominent among the controlling factors in the correlation coefficient analysis of stimulated volume and maximum fracture width, indicating that the elastic properties of the material play a role in the formation of these fracture morphology characteristics.
The principal component analysis results (Figure 25) showed that the number of perforation clusters was also ranked first among the controlling factors, which again emphasizes its importance for fracture morphology. Factors such as Poisson’s ratio and permeability also occupied a certain position among the controlling factors in the principal component analysis. From the perspective of the explained variance ratio, each principal component relatively equally explained the variance of the original data, which means that multiple factors jointly affected the formation of fracture morphology, and no single factor occupied an absolute dominant position. The cumulative explained variance ratio showed that the first few principal components could better cumulatively explain the information of the original data, further indicating that the comprehensive variables extracted through principal component analysis effectively covered the main factors affecting fracture morphology.
Although the experiments and simulations were conducted using parameters representative of the Shahejie Formation III, the findings regarding the effects of perforation cluster number, injection rate, stress difference, and formation properties on fracture morphology are not unique to this formation. These factors are common in many low-permeability reservoirs worldwide. Therefore, the conclusions of this study may provide useful guidance for fracturing design and production enhancement for other tight oil and gas reservoirs that exhibit similar geological and mechanical characteristics.

4. Conclusions

(1)
The fracturing pressure curves generally conformed to typical pressure–time characteristics. When the horizontal stress difference coefficient, number of perforation clusters, and fracturing fluid viscosity were relatively low, the fractured specimens predominantly exhibited bi-wing, approximately symmetrical horizontal fractures. In contrast, increasing the injection rate of the fracturing fluid led to the frequent occurrence of vertical fractures. The direction of fracture propagation was strongly affected by the number of perforation clusters and the horizontal stress difference coefficient; specifically, increasing either of these parameters caused noticeable deviation from the initial propagation axis. Additionally, the fracture complexity increased with higher perforation cluster numbers and greater fluid viscosity, reflecting enhanced stress interaction and fluid resistance effects during fracture evolution.
(2)
The number of perforation clusters appeared as a significantly dominant factor in determining fracture morphology, reflecting the influence of the fracture spatial distribution characteristics throughout the formation process of stimulated volume, maximum fracture width, and total fracture length. The injection rate, another prominent factor in multiple analyses, reflects the critical influence of external mechanical forces on fracture morphology. Factors such as permeability, elastic modulus, and Poisson’s ratio also appeared to participate in shaping the fracture morphology to varying degrees, interacting with the number of perforation clusters and the injection rate to jointly determine the final fracture morphology.
(3)
From the perspective of stimulated volume, increasing the injection rate and the number of perforation clusters was effective to increase the stimulated volume. Specifically, when the injection rate increased from 0.0001 to 0.0003 m3/s, the total fracture length and stimulated volume increased by 118% and 237%, respectively. Similarly, increasing the number of perforation clusters from three to seven resulted in a 263% increase in fracture volume and a 178% increase in total fracture length. However, increasing the number of perforation clusters can lead to stress deflection, resulting in a departure from the symmetrical bi-wing fracture pattern.

Author Contributions

Conceptualization, P.J. and Z.W.; methodology, H.Z.; software, H.Z. and W.Z.; validation, W.Z.; formal analysis, P.J.; investigation, S.Q.; resources, P.J. and G.S.; data curation, G.S.; writing—original draft preparation, P.J. and H.Z.; writing—review and editing, Z.W.; visualization, S.Q. and W.Z.; supervision, Z.W.; project administration, G.S. All authors have read and agreed to the published version of the manuscript.

Funding

This research received no external funding.

Data Availability Statement

The original contributions presented in this study are included in the article. Further inquiries can be directed to the corresponding author.

Conflicts of Interest

Authors Peng Ji, Shoumei Qiu and Guoqiang Song were employed by the Well Services Branch of CNPC Offshore Engineering Co., Ltd. The remaining authors declare that the research was conducted in the absence of any commercial or financial relationships that could be construed as a potential conflict of interest. The company had no role in the design of the study; in the collection, analyses, or interpretation of data; in the writing of the manuscript, or in the decision to publish the results.

References

  1. Liu, H.; Wang, H.; Liu, R.; Zhao, Q.; Zhang, X.; Yong, H. The present status and essential points of developing the unconventional hydrocarbon resources in China. Nat. Gas Ind. 2009, 29, 113–116+146. [Google Scholar]
  2. Zou, C.; Zhai, G.; Zhang, G.; Wang, H.; Zhang, G.; Li, J.; Wang, Z.; Wen, Z.; Ma, F.; Liang, Y.; et al. Formation, distribution, potential and prediction of global conventional and unconventional hydrocarbon resources. Pet. Explor. Dev. 2015, 42, 13–25. [Google Scholar] [CrossRef]
  3. Wang, Y.; Lu, Y.; Li, Y.; Wang, X.; Yan, X.; Zhang, Z. Progress and application of hydraulic fracturing technology in unconventional reservoir. Acta Pet. Sin. 2012, 33, 149–158. [Google Scholar]
  4. Tan, P.; Xing, Y.; Han, T.; Chen, J.; Xu, H.; Chen, Z. Physical simulation experiments on non-uniform extension of multi-cluster hydraulic fractures under complex fracturing conditions. Chin. J. Rock Mech. Eng. 2025, 1–13. [Google Scholar]
  5. Li, Y.; Ma, J.; Li, T.; Sun, P. Optimization of Dynamic Fracture Plugging Parameters in Lower Cambrian Qiongzhusi Shale, Southern Sichuan Basin. J. Southwest Pet. Univ. 2024, 46, 137–145. [Google Scholar]
  6. Wang, C.; Zhang, H.; Zhao, J.; Wang, T. Study on Hydraulic Fracture Propagation in Elastoplastic Reservoir. China Pet. Mach. 2022, 50, 80–88. [Google Scholar] [CrossRef]
  7. Zhang, Z.; Gao, W.; Ma, X. Energy Dissipation of Hydraulic Fracturing Based on Energy Balance. J. Chongqing Jiaotong Univ. 2017, 36, 54–57. [Google Scholar]
  8. Song, Y.; Lin, R.; Huang, Y.; Ren, L.; Yue, W.; Sun, Y. Simulation and control of fractures asynchronous initiation-propagation of horizontal well fracturing for deep shale gas. Pet. Geol. Oilfield Dev. Daqing 2022, 41, 145–152. [Google Scholar] [CrossRef]
  9. Olson, J.E. Multi-fracture propagation modeling: Applications to hydraulic fracturing in shales and tight gas sands. In Proceedings of the 42nd U.S. Rock Mechanics Symposium (USRMS), San Francisco, CA, USA, 29 June 2008. [Google Scholar]
  10. Nagel, N.B.; Sanchez-Nagel, M. Stress shadowing and microseismic events: A numerical evaluation. In Proceedings of the SPE Annual Technical Conference and Exhibition, Denver, CO, USA, 30 October–2 November 2011. SPE-147363-MS. [Google Scholar]
  11. Roussel, N.P.; Sharma, M.M. Optimizing fracture spacing and sequencing in horizontal-well fracturing. SPE Prod. Oper. 2011, 26, 173–184. [Google Scholar] [CrossRef]
  12. Zhao, J.-Z.; Chen, X.-Y.; Liu, C.-Y.; Li, Y.-M.; Li, H.; Cao, X.-J. The Analysis of Crack Interaction in Multi-stage Horizontal Fracturing. Nat. Gas Geosci. 2015, 26, 533–538. [Google Scholar]
  13. Yan, X.; Wang, Y.; Wang, T.; Zhao, H.; Xu, Y.; Wan, K.; Guo, N. Field application of tight oil factory fracturing in Mahu sag. Reserv. Eval. Dev. 2018, 8, 70–76. [Google Scholar] [CrossRef]
  14. Zhang, J.; Qi, Y. Impact of in-situ stresses on shale reservoir development and its countermeasures. Oil Gas Geol. 2020, 41, 776–783+799. [Google Scholar]
  15. Hubbert, M.K.; Willis, D.G. Mechanics of hydraulic fracturing. Trans. AIME 1957, 210, 153–168. [Google Scholar] [CrossRef]
  16. Wang, B.; Li, L.; Dong, X.; Liu, S.; Zhou, F. Investigation into the controlling factors of the in-stage multi-cluster fracturing effects based on optical fiber monitoring. Pet. Sci. Bull. 2023, 8, 775–786. [Google Scholar]
  17. Mian, C. Re-orientation and propagation of hydraulic fractures in shale gas reservoir. J. China Univ. Pet. 2013, 37, 88–94. [Google Scholar]
  18. Wang, C.; Chen, C.; Sun, Y.; Wang, W.; Hong, J.; Gao, S. Simulation of Oil Shale Hydraulic Fracturing in Nong’an and the Experimental Study. Drill. Eng. 2015, 42, 7–11. [Google Scholar]
  19. Hou, Z.; Yang, C.; Wang, L.; Liu, P.; Guo, Y.; Wei, Y.; Li, Z. Hydraulic fracture propagation of shale horizontal well by large-scale true triaxial physical simulation test. Rock Soil Mech. 2016, 37, 407–414. [Google Scholar] [CrossRef]
  20. Zheng, Y.; He, R.; Huang, L.; Bai, Y.; Wang, C.; Chen, W.; Wang, W. Exploring the effect of engineering parameters on the penetration of hydraulic fractures through bedding planes in different propagation regimes. Comput. Geotech. 2022, 146, 104736. [Google Scholar] [CrossRef]
  21. Zhou, T.; Wang, H.; Li, F.; Li, Y.; Zou, Y.; Zhang, C. Numerical simulation of hydraulic fracture propagation in laminated shale reservoirs. Pet. Explor. Dev. 2020, 47, 1039–1051. [Google Scholar] [CrossRef]
  22. Jafari, A.; Vahab, M.; Khalili, N. Fully coupled XFEM formulation for hydraulic fracturing simulation based on a generalized fluid leak-off model. Comput. Methods Appl. Mech. Eng. 2021, 373, 113447. [Google Scholar] [CrossRef]
  23. Liu, N.; Zhang, Z.; Zou, Y.; Ma, X.; Zhang, Y. Propagation law of hydraulic fractures during multi-staged horizontal well fracturing in a tight reservoir. Pet. Explor. Dev. 2018, 45, 1059–1068. [Google Scholar] [CrossRef]
  24. Fu, G.; Wang, Q.; Shi, J. Sealing oil-gas time and ability effectiveness of mudstone caprocks in middle Es1 in Dagang Oilfield. J. Cent. South Univ. 2012, 43, 3142–3148. [Google Scholar]
  25. Xu, G.; Chen, Y.; Chen, C.; Hu, L.; Liu, Z. Reservoir Characteristics and Reservoir-controlling Factors of Es3 Member in Qi’nan Sag, Huanghua Depression. J. Southwest Pet. Univ. 2023, 45, 31–42. [Google Scholar]
  26. Jiang, G.; Wang, L.; Zhang, S.; Tang, X.; Guo, H. Drilling fluid technology to protect the formations in low/ultra-low permeability reservoirs. Spec. Oil Gas Reserv. 2014, 21, 113–116+156. [Google Scholar]
  27. Li, C. Research and Application of Fracture-Induced Stress Field in Tight Oil Reservoirs of Dagang Oilfield. Ph.D. Thesis, Southwest Petroleum University, Chengdu, China, 2016. [Google Scholar]
  28. Radovitzky, R.; Seagraves, A.; Tupek, M.; Noels, L. A scalable 3D fracture and fragmentation algorithm based on a hybrid, discontinuous Galerkin, cohesive element method. Comput. Methods Appl. Mech. Eng. 2011, 200, 326–344. [Google Scholar] [CrossRef]
  29. Lu, W.; Lubbad, R.; Løset, S. Simulating ice-sloping structure interactions with the cohesive element method. J. Offshore Mech. Arct. Eng. 2014, 136, 031501. [Google Scholar] [CrossRef]
  30. Jiang, H.; Meng, D. 3D numerical modelling of rock fracture with a hybrid finite and cohesive element method. Eng. Fract. Mech. 2018, 199, 280–293. [Google Scholar] [CrossRef]
  31. Camanho, P.P.; Dávila, C.G. Mixed-Mode Decohesion Finite Elements for the Simulation of Delamination in Composite Materials; NASA: Washington, DC, USA, 2002. [Google Scholar]
  32. Turon, A.; Camanho, P.P.; Costa, J.; Dávila, C.G. A damage model for the simulation of delamination in advanced composites under variable-mode loading. Mech. Mater. 2006, 38, 1072–1089. [Google Scholar] [CrossRef]
  33. Biao, F.; Liu, H.; Zhang, S.; Zhang, J.; Wang, X. A Numerical Study of Parameter Influences on Horizontal Hydraulic Fracture. Eng. Mech. 2011, 28, 228–235. [Google Scholar]
  34. Li, B. Research on the Disintegration Study on the Disintegration Mechanism of Mudstone Sample Model Under Freeze-thaw Cycle. Ph.D. Thesis, Shenyang Jianzhu University, Shenyang, China, 2024. [Google Scholar] [CrossRef]
  35. Wang, H. Study on Hydraulic Fracturing Technology of Top Coal Cross-seam Network in Initial Mining Period Based on Stress Regulation. Ph.D. Thesis, China University of Mining and Technology, Beijing, China, 2024. [Google Scholar]
  36. Fu, S.; Chen, M.; Xia, Y.; Tan, P.; Zhang, Y.; Li, Y. Hydraulic fracture height growth law for deep coal measures shale reservoir. Fault Block Oil Gas Field 2021, 28, 555–560. [Google Scholar]
  37. Sobhaniaragh, B.; Trevelyan, J.; Mansur, W.; Peters, F. Numerical simulation of MZF design with non-planar hydraulic fracturing from multi-lateral horizontal wells. J. Nat. Gas Sci. Eng. 2017, 46, 93–107. [Google Scholar] [CrossRef]
  38. Ahmadi, S.; Khormali, A.; Razmjooie, A. Experimental investigation on separation of water in crude oil emulsions using an oil-soluble demulsifier. Iran. J. Chem. Chem. Eng. Res. Artic. Vol. 2023, 42, 2332–2343. [Google Scholar] [CrossRef]
Figure 1. Petrographic composition of the Shahejie Formation III (Es3) in the Dagang oilfield.
Processes 13 01693 g001
Figure 2. Uniaxial compression test results of synthetic rock specimens with different formulations: (a) uniaxial compressive strength; (b) stress–strain curves.
Processes 13 01693 g002
Figure 3. Schematic diagram of the true triaxial fracturing simulation experimental system.
Processes 13 01693 g003
Figure 4. (a) Stress loading configuration representing horizontal well stimulation; (b) multi-cluster perforation arrangement within the borehole.
Processes 13 01693 g004
Figure 5. Representative traction–separation curve for cohesive elements.
Processes 13 01693 g005
Figure 6. Effect of horizontal in situ stress difference coefficient on fracturing behavior: (a) fracturing pressure curves; (b) schematic representation of fracture patterns; (c) fracture surface morphologies of post-fractured specimens.
Processes 13 01693 g006
Figure 7. Effect of perforation cluster number on fracturing behavior: (a) fracturing pressure curves; (b) schematic representation of fracture patterns; (c) fracture surface morphologies of post-fractured specimens.
Processes 13 01693 g007
Figure 8. Effect of fracturing fluid injection rate on fracturing behavior: (a) fracturing pressure curves; (b) schematic representation of fracture patterns; (c) fracture surface morphologies of post-fractured specimens.
Processes 13 01693 g008
Figure 9. Effect of fracturing fluid viscosity on fracturing behavior: (a) fracturing pressure curves; (b) schematic representation of fracture patterns; (c) fracture surface morphologies of post-fractured specimens.
Processes 13 01693 g009
Figure 10. Comparison between the KGD model analytical solution and the numerical simulation results for fracture width.
Processes 13 01693 g010
Figure 11. Simulated fracture propagation patterns under different horizontal stress differences: (a) 0 MPa; (b) 5 MPa; (c) 10 MPa.
Processes 13 01693 g011
Figure 12. The variation of the fracture parameters with the horizontal stress difference.
Processes 13 01693 g012
Figure 13. Simulated fracture propagation patterns for different numbers of perforation clusters: (a) 3 clusters; (b) 4 clusters; (c) 5 clusters; (d) 6 clusters; (e) 7 clusters.
Processes 13 01693 g013
Figure 14. The variation of the fracture parameters with the number of perforation clusters.
Processes 13 01693 g014
Figure 15. Simulated fracture propagation patterns under different injection rates: (a) 0.0001 m3/s; (b) 0.00015 m3/s; (c) 0.0002 m3/s; (d) 0.0003 m3/s.
Processes 13 01693 g015
Figure 16. The variation of the fracture parameters with the injection rate.
Processes 13 01693 g016
Figure 17. Simulated fracture propagation patterns under different permeability coefficients: (a) 1000 md; (b) 100 mD; (c) 10 mD; (d) 0.1 mD.
Processes 13 01693 g017
Figure 18. The variation law of the fracture parameters with permeability.
Processes 13 01693 g018
Figure 19. Simulated fracture propagation patterns under different elastic moduli: (a) 20 GPa; (b) 25 GPa; (c) 30 GPa; (d) 35 GPa.
Processes 13 01693 g019
Figure 20. The variation law of the fracture parameters with the elastic modulus.
Processes 13 01693 g020
Figure 21. Simulated fracture propagation patterns under different Poisson’s ratios: (a) 0.2; (b) 0.25; (c) 0.30; (d) 0.32.
Processes 13 01693 g021
Figure 22. The variation law of the fracture parameters with the Poisson’s ratio.
Processes 13 01693 g022
Figure 23. Correlation coefficients showing the influence of various independent variables on fracture volume (blue), maximum fracture width (green), and total fracture length (red). Asterisks (*) denote statistically significant correlations.
Processes 13 01693 g023
Figure 24. Results of the correlation analysis showing the correlation coefficients between each input and the output (a) fracture volume, (b) maximum fracture width, (c) total fracture length.
Processes 13 01693 g024
Figure 25. Results of principal component analysis.
Processes 13 01693 g025
Table 1. Representative test results of synthetic fracturing specimens prepared according to Formulation #3.
ParameterTarget ReservoirLaboratory SpecimenRelative Error (%)
Porosity (%)5–255.7723.07
Uniaxial compressive strength (MPa)7477.85.14
Young’s modulus (GPa)1616.472.94
Permeability (mD)0–101.4342.80
Table 2. Experimental parameters for horizontal well multi-cluster fracturing simulation.
SampleTest GroupσvHhHorizontal In Situ Stress Difference Coefficient
( K h = ( σ H σ h ) σ H )
Number of Perforation ClustersPump Displacement
(L/min)
Fracturing Fluid Viscosity
(cP)
1A12/10/7.70.23712.51
212/10/6.70.33712.51
312/10/5.90.41712.51
4B12/10/6.70.33712.51
512/10/6.70.33912.51
612/10/6.70.33512.51
7C12/10/6.70.33712.51
812/10/6.70.3378.51
912/10/6.70.3376.51
10D12/10/6.70.33712.51
1112/10/6.70.33712.510
1212/10/6.70.33712.530
Table 3. Baseline parameters for numerical simulation.
ParameterValueParameterValue
Tensile strength5 MPaCluster spacing5 m
Maximum horizontal principal stress60 MPaVoid ratio10%
Minimum horizontal principal stress60/55/50 MPaNumber of perforation clusters3/4/5/6/7
Permeability coefficients1 e−5/1 e−7/1 e−8/1 e−9 m/sViscosity1/10/30 cP
Table 4. Input parameters used for numerical model validation.
ParameterValueParameterValue
Elastic modulus20 GPaInjection rate0.002 m3/min
Poisson’s ratio0.25Viscosity0.001 cP
Filtration coefficient10−14 cPTime80 s
Disclaimer/Publisher’s Note: The statements, opinions and data contained in all publications are solely those of the individual author(s) and contributor(s) and not of MDPI and/or the editor(s). MDPI and/or the editor(s) disclaim responsibility for any injury to people or property resulting from any ideas, methods, instructions or products referred to in the content.

