1. Introduction
Hydrogen plays a key role in the transition to a more sustainable energy model. Hydrogen is the fuel with the highest energy content per unit mass (120 MJ/kg), and its utilization releases water and oxygen into the atmosphere [
1]. However, due to its low volumetric density under ambient conditions (0.0824 kg/m
3), less than one-third that of natural gas [
2], it is not competitive with fossil fuels without altering its state during the transport and storage phase.
High-pressure compression is currently the most developed and widely used method for storing and transporting hydrogen in metallic or composite cylindrical vessels at pressures up to 700 bar [
1]. However, it requires significant energy, consuming approximately 13–18% of hydrogen’s lower heating value [
1]. Alternatively, liquefaction increases the volumetric density to 71 kg/m
3 at −253 °C and atmospheric pressure [
3], but it requires 30–40% of hydrogen’s lower heating value [
1]. These extremely low temperatures and high pressures represent significant challenges to large-scale commercialization. Therefore, developing an alternative that enables hydrogen transportation under milder and safer liquid-phase conditions, similar to traditional fuels, is crucial to gaining public trust and attracting both private and public investment in the hydrogen supply chain [
4].
In recent times, liquid organic hydrogen carriers (LOHCs) have attracted considerable attention as a solution for transporting and storing hydrogen because of their favourable attributes:
(a) LOHCs are oil-like organic systems that can remain in liquid form under ambient conditions, so they are easy and safe to store and transport. This also facilitates the gradual integration of LOHC systems into existing petroleum-based industries, allowing the utilization of their existing infrastructure in a hydrogen-based economy [
5].
(b) The concept of LOHC is based on the reversible hydrogenation and dehydrogenation of carbon double bonds through well-known catalytic reactions [
5].
(c) LOHCs have been shown to have a high hydrogen storage capacity, ranging up to 7.3 wt% of hydrogen [
6].
Hydrogen reversibly binds to LOHCs through a catalytic hydrogenation process, an exothermic reaction that occurs at moderate temperatures (100–300 °C) and pressures (30–50 bar) [
5,
7,
8]. The hydrogenated LOHCs exhibit a significant increase in volumetric energy density compared with molecular hydrogen and can be stored under ambient conditions for long periods without energy losses [
9]. In contrast, dehydrogenation is an endothermic process that typically occurs at atmospheric pressure and high temperatures (200–400 °C) depending on the LOHC–catalyst combination [
8,
9]. The heat needed for dehydrogenation can be either supplied internally, through partial combustion of the released hydrogen, or externally from available waste heat sources or fuel combustion [
5]. In addition, if the two reactors are close together, it may be possible to use the heat produced by the exothermic reactor to power part of the endothermic one.
Over the years, various compounds have been studied, each with distinct chemical properties and significantly different transport and storage performances [
5]. Research has predominantly focused on compounds derived from hydrocarbons commonly used in petrochemicals [
5]. According to Niermann et al. [
9], an ideal LOHC should have the following characteristics: high boiling point, low melting point, high hydrogen storage capacity, wide availability, cost-effectiveness, low dehydrogenation temperature, environmental and human safety, stability, and high technology readiness level (TRL). Many aromatic hydrocarbons, such as benzene, toluene, naphthalene, and dibenzyltoluene can be used as LOHCs due to the interaction of the aromatic rings, which makes them more prone to hydrogenation and dehydrogenation than other organic molecules [
7]. However, some of the aromatic compounds are carcinogenic or flammable, while others are solid at room temperature [
10]. Generally, the hydrogen storage capacities of cyclic hydrocarbons are between 6 and 8 wt% of hydrogen, and the heat required for dehydrogenation is significant (62–71 kJ/mol) [
10]. In addition to cyclic aromatic hydrocarbons, N-heterocyclic base compounds [
11] such as N-ethyl carbazole, chinolina, indolo, phenazine, 1,2-Dihydro-1,2-Azaborine, have attracted much attention in LOHC research. The incorporation of heteroatoms such as N, P, and O into aromatics significantly influences the thermodynamics of dehydrogenation [
7]. As shown by Clot et al. [
12], the substitution of heteroatoms at specific ring positions can effectively lower the dehydrogenation temperature of LOHCs and considerably reduce the enthalpy of reaction [
7,
12], resulting in thermodynamic conditions to fully release hydrogen at low temperatures [
13]. However, such compounds suffer from low TRL, high toxicity, and complicated hydrogenation/dehydrogenation mechanics, which limits their scalability at large scales [
14].
1.1. Hydrogen Transport by LOHCs
Among all the possible aromatic candidates, dibenzyltoluene (DBT)/perhydro-dibenzyltoluene (PDBT), and toluene (TOL)/methylcyclohexane (MCH) systems are the most promising candidates for large-scale applications. TOL/MCH benefits from a low cost of 0.3 EUR/kg and a high mature TRL of 8, making it attractive for large scale applications, particularly in Asia, where pilot projects in Japan and Southeast Asia have demonstrated its feasibility [
15].
Conversely, DBT/PDBT has gained increasing attention in Europe, driven by its non-flammability, low toxicity (13.8 TPI/mg), and low vapor pressure, which facilitate hydrogen separation. Its cost, currently ranging between 2 and 4 EUR/kg, suggests feasibility for large-scale deployment [
6,
8,
16]. The German company Hydrogenious GmbH has pioneered DBT/PDBT commercialization in Europe, reaching a TRL of 9 and engaging in multiple European hydrogen projects [
17].
In the literature, several studies explore the possible use of LOHCs for transporting hydrogen by ship over long distances from countries rich in renewable energy to those with potentially high future hydrogen demand [
18,
19].
Cho et al. [
20] conducted a lifecycle assessment to evaluate the environmental impacts of hydrogen transportation using renewable TOL and DBT. The study analysed hydrogen transport produced by wind-powered electrolysis over long distances, specifically, from South Australia to Asia (11,000 km) and Europe (24,000 km). The results showed that hydrogen transport via renewable DBT exhibited lower emissions than TOL, with 9.5 kg CO
2/kg H
2 compared with 9.6 kg CO
2/kgH
2 for TOL, primarily due to its higher hydrogen storage capacity (6.2 wt% vs. 6.12 wt%) and lower energy consumption during dehydrogenation (9.8 kWh/kg H
2 vs. 10.4 kWh/kg H
2). For short distances (<5000 km), road transport by truck was found to be more environmentally sustainable than marine transport, with 8.6 to 10.2 kg CO
2/kg H
2 for truck transport compared with 9.2 to 10 kg CO
2/kg H
2 for marine transport over the same distance. While this study provides a detailed environmental assessment, it does not include an economic analysis of hydrogen transport.
Kim et al. [
21] conducted a comprehensive techno-economic and carbon footprint analysis comparing liquid hydrogen, ammonia, and the TOL/MCH system for overseas hydrogen transport and inland distribution. Their findings indicate that TOL transport is the most cost-effective option for moderate distances (4000 km) and large-scale hydrogen transport (1 Mt H
2 per year). For inland distribution, LOHC truck transport is economically viable for quantities below 4500 tons of H
2 per year, with estimated costs between 0.001 and 0.008 USD/kg H
2/km, considerably lower than other hydrogen carriers. However, the high energy demand of the dehydrogenation step (7.19–10.09 kWh/kg H
2) remains a critical limitation, significantly affecting economic feasibility (dehydrogenation cost of 0.76 USD/kg H
2).
Since LOHCs have proven to be a competitive option for large-scale maritime transport, their use for short-distance distribution via road could naturally expand and compete with traditional hydrogen transport technologies. In this context, road transport via LOHCs could benefit from the infrastructures developed for long-distance hydrogen transport, offering a potentially safer and logistically flexible alternative to gaseous or cryogenic hydrogen delivery. Among studies addressing road transport specifically, Hurskainen et al. [
22] compared hydrogen road delivery costs via the DBT/PDBT concept and compressed gas. They found that the LOHC concept is more advantageous at higher hydrogen demands, particularly over longer transport distances. Specifically, for a hydrogen demand of 10 MW (7200 kg/day), the LOHC delivery costs range from 0.7 to 2.8 EUR/kg, whereas compressed gas, using steel bottle containers, results in significantly higher costs, reaching up to 3.1 EUR/kg. LOHC remains competitive with composite gas cylinders for transport distances up to 100 km but becomes the lowest-cost option for distances beyond 150 km. However, the analysis focuses on DBT/PDBT without modelling the hydrogenation and dehydrogenation reactions explicitly. Additionally, the liquid hydrogen option is not considered.
1.2. Objective of the Work
Given the regional market distinction—TOL/MCH in Asia and DBT/PDBT in Europe—this study focuses on the techno-economic evaluation of the DBT/PDBT system for hydrogen transportation in Italy, aligning with the growing European interest in this LOHC technology. A techno-economic analysis of hydrogen transportation via LOHCs by road is carried out, also simulating hydrogenation and dehydrogenation plants for DBT/PDBT systems, in ASPEN Plus. The results are compared with hydrogen transported by using 350-bar compressed and cryogenic vessel tanks. Moreover, a sensitivity analysis evaluates the feasibility of transporting 1 t/d, 2 t/d, and 4 t/d of hydrogen over distances of 50, 150, and 300 km, from the production/hydrogenation site to the dehydrogenation/use point, focusing on the levelized cost of hydrogen (LCOH) and its cost components, particularly the levelized cost of transported hydrogen (LCOTH).
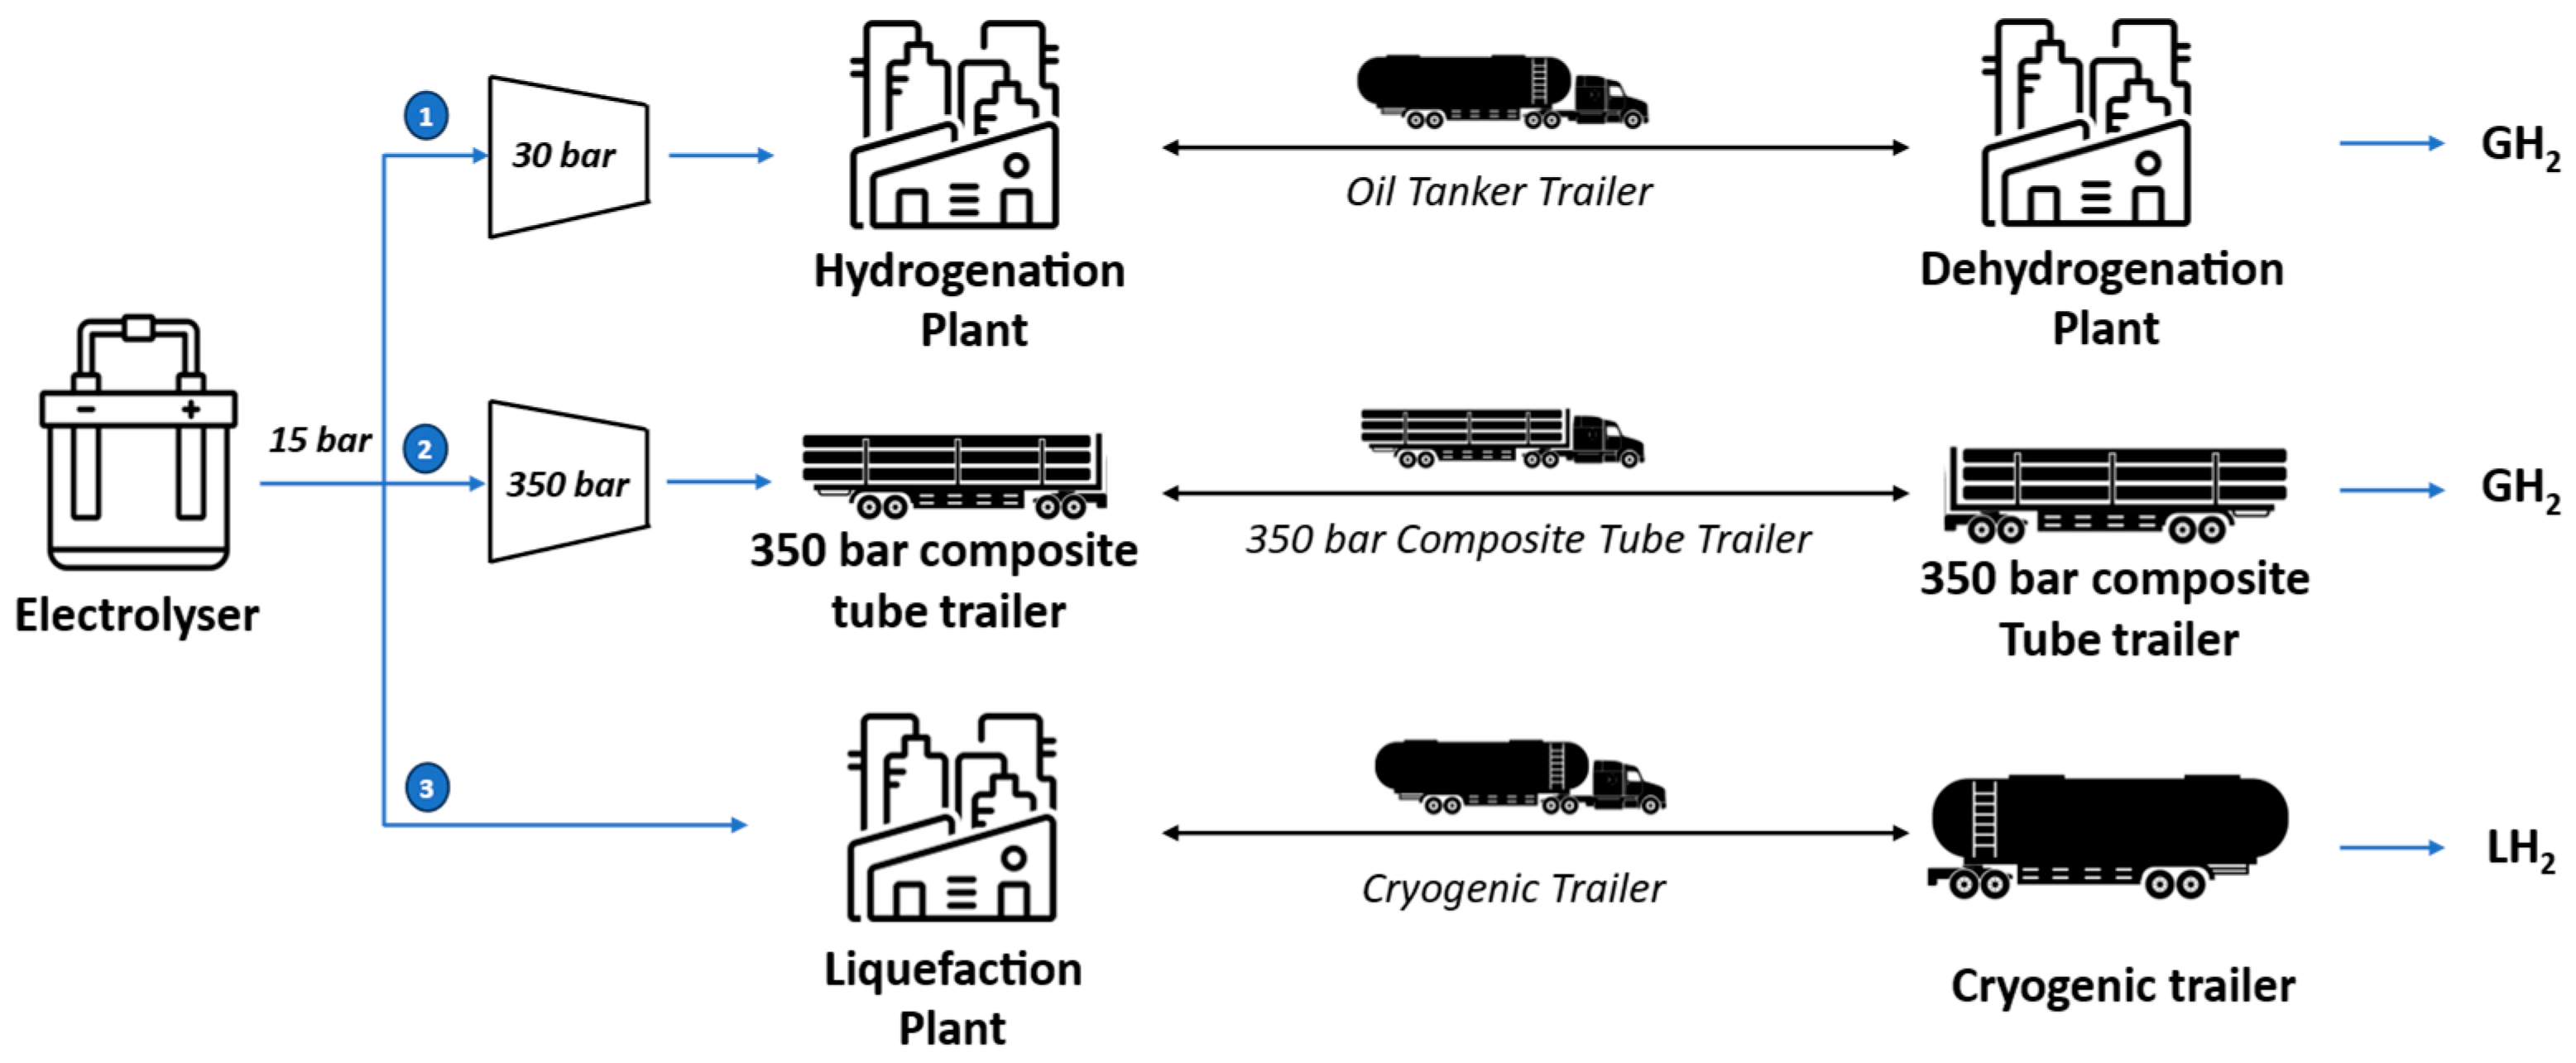
Figure 1 illustrates the three hydrogen transportation options considered in the analysis. In each case, hydrogen is produced by an alkaline electrolyser (AEL) at 15 bars. In the first pathway, hydrogen reacts with the LOHC in the hydrogenation unit after a compression step up to 30 bars. The hydrogenated product is then loaded into an oil tank trailer, transported by road, and unloaded at the dehydrogenation unit, where hydrogen is separated from the LOHC at 1.1 bar. In the second alternative pathway, hydrogen is compressed and loaded into a 350-bar composite tube trailer, transported by road, and unloaded at the destination. In the third pathway, hydrogen is liquefied and loaded into a cryogenic tube trailer. It is then transported by road and delivered to the destination point. As depicted in
Figure 1, the physical transport pathways (compressed and liquefied hydrogen) involve fewer processing steps compared with the chemical LOHC-based method, as they do not require the dehydrogenation step necessary for releasing hydrogen at the delivery point. Additionally, in physical-based transport, trucks return with an empty trailer, whereas in LOHC-based transport, they return with a full trailer containing the depleted LOHC. Since the analysis focuses on hydrogen transportation, the final user is not considered, and no further hydrogen conversion processes beyond delivery are examined. However, it is important to note that the delivered hydrogen’s state varies depending on the transport method. In the compressed hydrogen pathway, hydrogen arrives at 350 bar and must be recompressed if large storage is required. In the liquid hydrogen pathway, it must be either stored in cryogenic tanks or regasified before use. In the LOHC pathway, hydrogen is released from the dehydrogenation unit as a gas at 1.1 bar, requiring compression for storage if not immediately utilized.
3. Method
The levelized cost of hydrogen (LCOH), in EUR/kg, for each transportation case study is obtained with the following equation:
where LCOH
production corresponds to the hydrogen production cost, specifically associated with hydrogen generation from an alkaline electrolyser, and LCOTH represents the levelized cost of transported hydrogen as the sum of the transformation cost required before transportation and the transportation cost. Transformation includes the hydrogenation and dehydrogenation steps for LOHCs, compression for compressed hydrogen, and liquefaction for liquefied hydrogen.
Each component of the LCOH is calculated by dividing the total annual costs (the sum of CAPEX, fixOPEX, varOPEX, and CO
2,cost) by the annual amount of useful hydrogen delivered (Q
H2), using the following equation:
where j denotes the j-th step of the transportation option. CAPEX is obtained by the annualization of the investment cost (IC) through the capital recovery factor (CRF), assuming an interest rate (i) and a depreciation time (n) by the following equation:
FixOPEX and varOPEX refer to the fixed operational expenditures of the plant or technology (generally estimated as a percentage of annualized IC) and the variable energy and material costs incurred for annual operation, respectively. CO2,cost,j represents the carbon tax associated with the fuel consumption of each truck used in the various hydrogen transportation options.
Each stage of the hydrogen chain is analysed, with all expenditures adjusted to the 2024 euro value.
3.1. Levelized Cost of Electricity
In accordance with the 2023 EU Delegated Acts on renewable hydrogen (Regulations EU 2023/1184 and 2023/1185) [
28], in Italy electricity must be supplied from renewable power plants, either through direct connection or via power purchase agreements (PPAs), ensuring compliance with the criteria of additionality and temporal and geographical correlation. Until 2030, temporal correlation is considered monthly, meaning that electricity used to power an electrolyser can be classified as renewable if its production occurs within the same month as the associated renewable energy generated through a PPA.
In this study, electricity is assumed to be supplied via a virtual PPA from the Italian national grid with monthly temporal correlation. The levelized cost of electricity (LCOE) has been estimated based on 0.14 EUR/kWh, the average of Italian PUN, short for “Prezzo Unico Nazionale” or National Single Price, between 2004 and 2024 [
29], with the addition of average system charges amounting to 30–40 EUR/MWh [
30]. The historical trend of the Italian PUN (2004–2024) is depicted in
Figure 4.
3.2. Hydrogen Production
Hydrogen is produced using an AEL, currently the most mature technology for large-scale hydrogen production [
31].
In this study, the electrolyser is assumed to operate for 5500 h per year using renewable energy sources as the primary power supply, following monthly correlations under a PPA contract, in accordance with [
32], which estimates a feasible annual equivalent full-load hour value under the current deployment of renewable energy in Italy.
At least 260 h of scheduled maintenance with plant downtime are assumed, as reported by some electrolyser suppliers. However, unplanned shutdowns for extraordinary maintenance are not considered in this study.
A dry piston compressor compresses the produced hydrogen to 15 bar.
The main parameters for the AEL are reported in
Table 8.
The fixOPEX cost (4% of ICEL) also includes personnel for plant supervision. The minimum number of staff cannot be defined a priori, since it depends on the specific case. However, according to information provided by electrolyser suppliers, it could be covered within this percentage.
3.3. Hydrogen Compression
The specific work (w
comp, kWh/kg) required for the compressors is calculated using the following equation [
22]:
whose terms are described in
Table 9 [
22]. The total number of compression stages is determined based on a maximum compression ratio of 2.5 per stage, assuming that the suction temperature remained constant at 313.15 K.
The compressor investment cost (IC
comp) is calculated using the equation developed in the study carried out by the Fuel Cells and Hydrogen Joint Undertaking [
33]:
where A, B, Q
ref, a, b, c, d, and p
ref are constant [
33]. For the compressor CAPEX, a lifetime of 15 years and an interest rate of 8% are considered. Compressor FixOPEX is assumed to be 4% of the IC, while the annual electricity consumption associated with the compressor specific work is included as varOPEX
comp. Electricity costs are calculated using the electricity price provided in
Table 8.
3.4. LOHC System
The expenditures of the LOHC systems include investment, fixed and variable costs of the compressor to compress hydrogen up to 30 bar, the LOHC reactors, the BOP, and the LOHC storage at the hydrogenation and dehydrogenation sites. Since LOHC technology has not yet been fully scaled, significant uncertainties remain regarding the reactor and BOP investment costs. Two different methods were considered for estimating their value.
Eypasch et al. [
23] (method 1) estimated the costs of the DBT hydrogenation and PDBT dehydrogenation reactors along with all additional components by curve fitting their confidential specific system costs at different sizes, obtaining the following equations:
where P
max is the maximum power of the hydrogenation and dehydrogenation plants in kW.
In contrast, Reuß et al. [
34] (method 2) computed the DBT hydrogenation and PDBT dehydrogenation reactors using the scale factor method through the following equations:
where IC
hyd,DBT and IC
dehyd,PDBT are the investment costs for the installed hydrogenation and dehydrogenation equipment, respectively. IC
base,hyd and IC
base,dehyd are the base costs of hydrogenation and dehydrogenation, respectively; capacity and IC
compare are the design and base capacity, respectively, while IC
scale is the scaling factor.
Table 10 summarizes the values assumed for the abovementioned parameters. The same values of the interest rate and the depreciation rate were assumed for estimating the CRF used in the annualization of IC in method 1.
The average value derived from the two methods was then assumed for comparison with other transportation ways. The cost of energy requirements, both thermal and electrical, were considered as a variable cost component of the systems (varOPEX).
Regarding the thermal consumption of the dehydrogenation reactor, two scenarios were considered: the first scenario (H
2-powered LOHC) utilizes a portion of the hydrogen released from the dehydrogenation reactor to fuel the reactor itself, using approximately 32.15% of the inlet H
2 flow; the second one (NG-powered LOHC) assumes that the reactor’s thermal demand is met by burning natural gas. In the case of NG-powered LOHC, natural gas is purchased according to the 2024 non-household gas prices in the EU of 0.06 EUR/kWh [
35], excluding value-added tax, but with an additional CO
2 emission tax for the natural gas combustion of 10.13 EUR/MWh [
36]. The electricity costs were computed using the electricity price from
Table 8.
Finally, two fixed LOHC storage tanks, one at the hydrogenation site and another at the dehydrogenation site, were considered. The storage CAPEX was obtained by annualization of storage IC using the scale factor method, as performed by Reuß et al. [
34]. The variable costs include the purchase of the compound and its replacement due to degradation of LOHC over time.
Table 11 summarizes the storage parameters for DBT/PDBT storage systems [
22,
34].
3.5. Hydrogen Liquefaction
The liquefaction IC (IC
liq) was calculated using the scale factor method, according to Reuß et al. [
34]. The main parameters are presented in
Table 12. The annual electricity cost required to liquefy hydrogen, based on the liquify index reported in
Table 12 [
37], was considered as the annual variable expenditure (VarOPEX
liq).
3.6. Transportation
The number of required deliveries per day depends on the daily hydrogen target and the net payload of the trailer, according to the following equation:
The net trailer payload refers to the actual amount of hydrogen delivered to the end user compared with the total storage capacity of the trailer. In the case of liquid and compressed hydrogen, a fraction, commonly referred to as heel, cannot be extracted from the trailer, typically accounting for 5–10% of the total capacity [
22,
34,
38]. For the H
2-powered LOHC system, the net payload is approximately 77.85% of the total, as part of the hydrogen is consumed to supply heat to the dehydrogenation reactor.
The required number (#) of trucks + trailers is calculated by using the equation:
where truck availability represents the fraction of the total annual hours during which a truck is operational, accounting for potential downtime due to maintenance or other constraints.
The maximum daily trips are computed with the equation:
where Tot trip time is computed with the following equation:
In this study, truck deliveries are assumed to take place only when the trailer reaches at least 75% of its net trailer payload. Until this threshold is met, hydrogen is considered to remain stored within the trailer.
Table 13 summarizes the main parameters used to compute the IC, as well as the annual fixed (fixOPEX
trucking) and variable expenditures (varOPEX
trucking), for the three transportation options. The fuel price and labour costs were selected based on the average values for Italy in the year 2024 [
39,
40].
In
Table 13, I
CO2,fuel denotes the CO
2 emissions from diesel combustion in a heavy-duty truck [
41], while Tax
CO2,fuel represents the carbon tax (45 EUR/tCO
2) that the EU aims to implement by 2027 for heating and transport, mitigated by the introduction of a new Social Climate Fund [
43,
44]. The annual CO
2 emission (tCO
2/year) is computed according to the following equation:
and the cost associated with the corresponding carbon tax is computed by the following equation:
The varOPEXtrucking includes the costs of fuel, personnel, and variable maintenance.
The expense associated with the annual fuel consumption of trucks on the road is calculated using the following equation:
The expense associated with the cost of personnel that drive the trucks is calculated using the following equation:
where round trip time is the travel time without charging and uncharging cargo operations.
The fixed O&M expenditures associated with the number of trucks and trailers are calculated using the following equation:
where the number of trucks and trailers includes the backup fleet.
4. Results and Discussion
4.1. Hydrogen Delivery Logistics
Table 14 summarizes the key parameters of the hydrogen road transportation logistics plan, including the number of trucks and trailers; the fleet IC (MEUR); the total annualized transformation and transportation costs (MEUR/year); the round-trip time (h); the total trip time (h), including loading and unloading time; and the number of trips per year. In this initial analysis, production costs have been neglected, as the focus is only on logistics planning. A further analysis, presented in
Section 4.4, includes these costs. In the fleet count, an additional trailer and truck have been included in each scenario to ensure hydrogen delivery in case of an accidental truck breakdown. In addition, it is assumed that a trip is made only when the trailer’s capacity exceeds 75% of its nominal capacity. This assumption remains valid as long as there are no daily constraints imposed by a hypothetical hydrogen user and only an annual hydrogen delivery requirement needs to be met.
The results in
Table 14 show that as the transport distance and the amount of hydrogen to be delivered increase, the number of H
2 compressed tube trailers rises significantly. In addition, that number is higher if compared with the liquid carrier option, due to the lower maximum storage capacity (900 kg vs. 2 t and 4.3 t for LOHC and LH
2, respectively). For a 50 km distance, at least 2 trucks and 2 H
2 compressed tube trailers are required, as the total travel time allows for up to 6 trips per day. At 150 km, and for a daily demand of 4 t/d, the number of trucks and tube trailers increases to 3 + 3, since the total travel time of 8 h permits 3 trips per day. At 300 km, each truck can complete only one trip per day due to the total travel time of 14 h. Consequently, a higher number of trucks and H
2 compressed tube trailers are required: 3 + 3 for 1 t/d, 4 + 4 for 2 t/d, and 6 + 6 for 4 t/d, respectively. In the case of transporting liquefied hydrogen and LOHC, a fleet consisting of 1 trailer and 1 truck, plus a reserve, is always sufficient. However, for the fleet with LOHC, the number increases to 2 + 2 with a reserve in the case of 4 t/d and 300 km.
From an economic point of view, the IC for the LOHC fleet is the lowest, considering all distances and hydrogen daily rates (0.76–1.13 MEUR). The fleet IC with liquefied hydrogen is 2.04 MEUR for all distances and hydrogen demands, as its number remains unchanged within this range. When the fleet carrying compressed hydrogen at 350 bar consists of two trucks and two trailers, its IC is estimated at approximately 1.42 MEUR. The hydrogen compressed fleet becomes the most expensive (2.12–4.25 MEUR) at 300 km and at 150 km when hydrogen demand is 4 t/d.
The annualized transformation cost of the liquefied hydrogen option is the highest across all distances and hydrogen demands (1.92–5.17 MEUR) due to the high IC and energy requirements of the liquefaction plant. In the LOHC option, a moderate annual transportation expense (0.16–1.04 MEUR/year) contrasts with a high and increasing annual transformation expense (0.39–1.11 MEUR/year) as the required hydrogen flow rate increases. The transformation expense in the NG-powered LOHC scenario is slightly higher than in the H2-powered LOHC scenario due to the cost of purchasing natural gas to fuel the dehydrogenation reactor. In contrast, in the compressed hydrogen scenario, a low annual transformation cost (0.12–0.36 MEUR/year) contrasts with a high annual transportation cost (0.38–2.78 MEUR/year), which increases as the hydrogen demand and transport distance grow.
In terms of total annual trips, the H2 compressed tube trailer trucks complete 417, 821, and 1642 trips per year for 1, 2, and 4 t/d, respectively. The high number of trips required for hydrogen transport may introduce logistical challenges, such as increased vehicle wear over time and potential maintenance costs, which would result in higher costs and potential penalties. Although heavy-duty trucks are engineered for continuous operation, their performance may be affected by the regulatory constraints and safety protocols specific to hydrogen handling. Additionally, frequent truck movements in densely populated or industrially active areas could contribute to local traffic congestion. Conversely, the LOHC fleet requires a maximum of 121, 365, and 730 trips per year for 1, 2, and 4 t/d, respectively. Finally, the cryogenic LH2 fleet requires 91, 182, and 365 trips per year for 1, 2, and 4 t/d, respectively. Therefore, the option of transporting hydrogen in liquid form reduces the number of annual road trips unless there are no mandatory daily user demands. Except for a 4 t/d demand, deliveries occur every 3 days for 1 t/d and every 2 days for 2 t/d.
4.2. CO2 Emissions Assessment
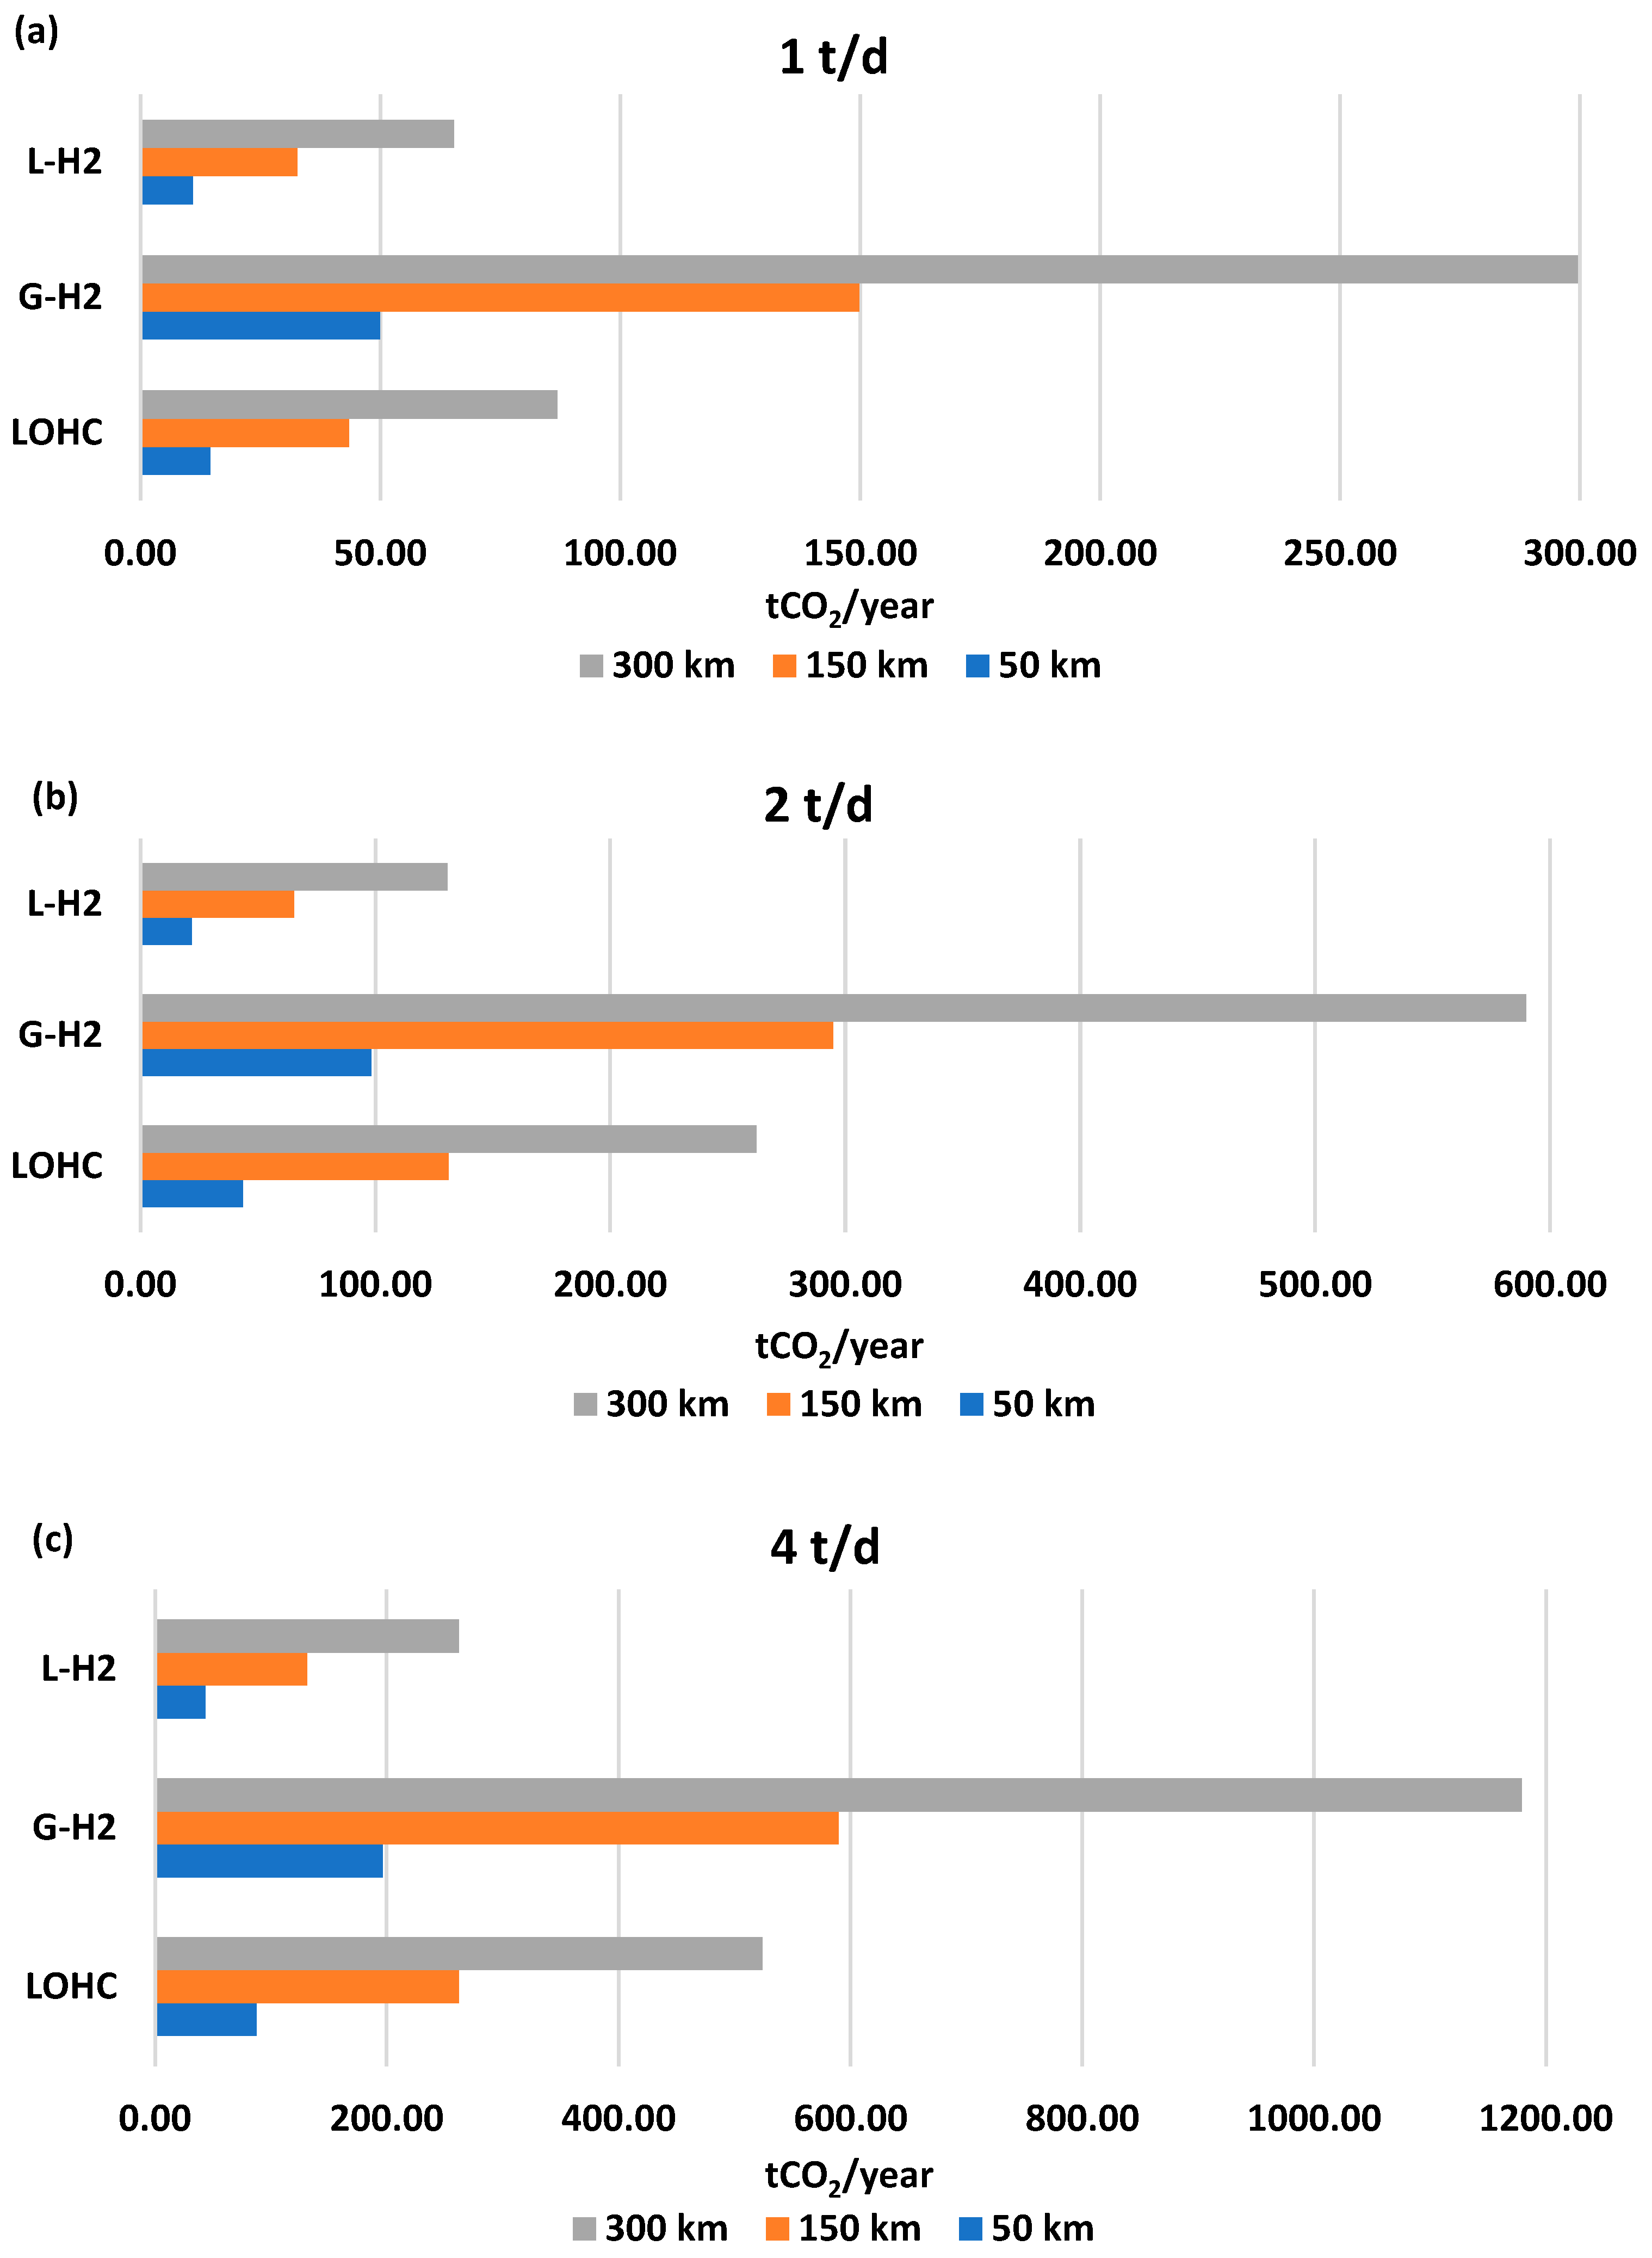
Figure 5 shows the annual CO
2 emissions (tCO
2/year) for each hydrogen transport solution as a function of distance for 1 t/d (a), 2 t/d (b), and 4 t/d (c).
As expected, an increase in transport distance and hydrogen volume leads to higher CO2 emissions across all transport solutions. Among the investigated options, hydrogen transport via compressed tube trailer exhibits the highest emissions for all distances and hydrogen quantities. This is primarily due to the large number of trips required each year, as tube trailers have a significantly lower payload capacity (900 kg) compared with liquid-based alternatives. Specifically, emissions range from 49.91 tCO2/year (1 t/d and 50 km) to 1179.28 tCO2/year (4 t/d and 300 km).
Conversely, liquid hydrogen transport has the lowest annual emissions, as fewer trips are required to meet the same yearly hydrogen demand. Emissions for this option range from 10.89 tCO2/year (1 t/d and 50 km) to 262.14 tCO2/year (4 t/d and 300 km).
DBT/PDBT transport falls between gaseous and liquid hydrogen in terms of emissions, with values ranging from 14.48 tCO2/year (1 t/d and 50 km) to 524.29 tCO2/year (4 t/d and 300 km).
It should be noted that the specific emissions for DBT/PDBT truck transport reported in this study (1.20 gCO
2/km kgH
2) are higher than those reported by Cho et al. [
20], who estimated 0.39 gCO
2/km kgH
2. The main factor is the higher fuel consumption assumed in this work, set at 0.45 L/km, which corresponds to approximately 0.187 g diesel/km kgH
2 and is representative of a conventional EURO V heavy-duty vehicle under typical road conditions. In contrast, Cho et al. [
20] assume 0.21 kg diesel per kg of H
2 transported over a 1700 km distance, which equates to 0.124 g diesel/km kgH
2, as they model a 40-ton EURO VI diesel truck, characterized by lower emissions and higher fuel efficiency.
Table 15,
Table 16 and
Table 17 summarize the annual CO
2 emissions and carbon tax as a function of delivered hydrogen for 50, 150, and 300 km, respectively. The applied carbon tax is insufficient to provide a clear economic advantage for liquid hydrogen transport, despite its lower annual trip frequency. However, while the economic penalty may not be significant, the shift from gaseous to liquid transport—whether via LOHC or liquid hydrogen—delivers substantial environmental benefits. Specifically, CO
2 emissions are reduced by 56% with LOHC and 78% with liquid hydrogen.
4.3. Transportation Cost Breakdown
To provide a comprehensive view of the cost structure for each transportation option and enable a comparative analysis under varying conditions,
Figure 6 illustrates the LCOTH as a function of transport distance and daily hydrogen demand.
Figure 6 highlights that as hydrogen demand increases, LCOTH decreases across all transportation options, while increasing transport distance leads to higher LCOTH. The increase in cost with transport distance is primarily driven by the trucking component. Transporting larger quantities over longer distances reduces truck availability within a single day, thereby requiring additional vehicles, increasing fuel consumption, and intensifying personnel utilization. However, this increase is not uniform across all technologies.
Transporting liquified hydrogen results in being the most expensive option, with costs reaching up to 5.35 EUR/kg. Compared with other alternatives, this method is heavily influenced by the IC required for the liquefaction plant and the energy expenditure for liquefying hydrogen, which account for approximately 80% of the total cost. The trucking-related cost is relatively low (0.31–1.19 EUR/kg); however, for these quantities of hydrogen, the technology is unable to compete with its alternatives.
Transporting compressed gaseous hydrogen at 350 bar in tube trailers is the most economical option for distances ranging from 50 to 150 km (0.71–1.31 EUR/kg and 1.10–1.61 EUR/kg, respectively). The largest cost component is associated with the purchase of the fleet and O&M expenses, while the cost related to the compressor remains relatively low (less than 0.40 EUR/kg). At these distances, NG-powered LOHC and H2 powered-LOHC options are disadvantaged by the costs of the hydrogenation and dehydrogenation plants as well as the associated energy expenditures (1.04–1.71 EUR/kg and 1.32–2.27 EUR/kg, respectively).
While this cost gap makes the LOHC option less competitive for distances of 50–150 km, it becomes increasingly less pronounced as the distance increases, since the trucking cost for compressed hydrogen rises significantly compared with that of the LOHC solution. At 300 km, the NG-powered LOHC solution becomes the most advantageous (1.49–1.89 EUR/kg). The H2 powered version ranges from 1.91 to 2.50 EUR/kg and becomes comparable to the compressed hydrogen option. The H2-powered LOHC scenario is therefore strongly penalized by the reduction in the hydrogen delivered to the final user, which increases its LCOTH.
At the same distance, the cost associated with the compressed hydrogen fleet amounts to 1.81–2.42 EUR/kg. However, it should be noted that, although the economic advantage of the LOHC solution over the gaseous hydrogen option is modest, its key benefit lies in requiring a substantially smaller fleet, resulting in fewer trucks on the road.
Compared with the study by Hurskainen et al. [
22], the present work confirms the overall trend that LOHC-based hydrogen delivery becomes more cost-effective than compressed hydrogen for long-distance transport (≥300 km). For a similar hydrogen demand (2 t/d vs. 1.8 t/d) and at 150 km, both studies report similar LCOTH for DBT, ranging between 1.2 and 1.7 EUR/kg. Despite adopting the same compressed hydrogen trailer capacity (900 kg H
2), the transport cost for GH
2 in the present study is lower than in Hurskainen et al. [
22]. At 150 km and 2 t/d, this work estimates a delivery cost of 1.21 EUR/kg, compared with approximately 1.8 EUR/kg in Hurskainen’s model. This difference is likely due to variations in how fleet size, investment costs, and energy prices are considered.
4.4. Sensitivity Analysis
Given the uncertainties in electricity prices and capital expenditures of the hydrogenation and dehydrogenation systems, a sensitivity analysis was conducted to assess the robustness of the LCOTH and LCOH results. The LCOE was varied between 0.03 and 0.30 EUR/kWh, reflecting the historical minimum and maximum of the Italian PUN in the 2004–2024 period.
Two representative scenarios were considered: a small-scale case (1 t/d) and a large-scale case (4 t/d), both at 150 km, a distance at which LOHC transport begins to compete with compressed hydrogen, as shown in
Section 4.3.
To account for capital cost uncertainty, three IC levels were assumed for the DBT/PDBT system:
- I.
DBT_Min, from the optimistic scenario in Eypasch et al. [
23];
- II.
DBT_Max, from the conservative estimate by Reuß et al. [
34];
- III.
DBT_Mean, the average value used as baseline in the main analysis of
Section 4.3.
4.4.1. LCOTH
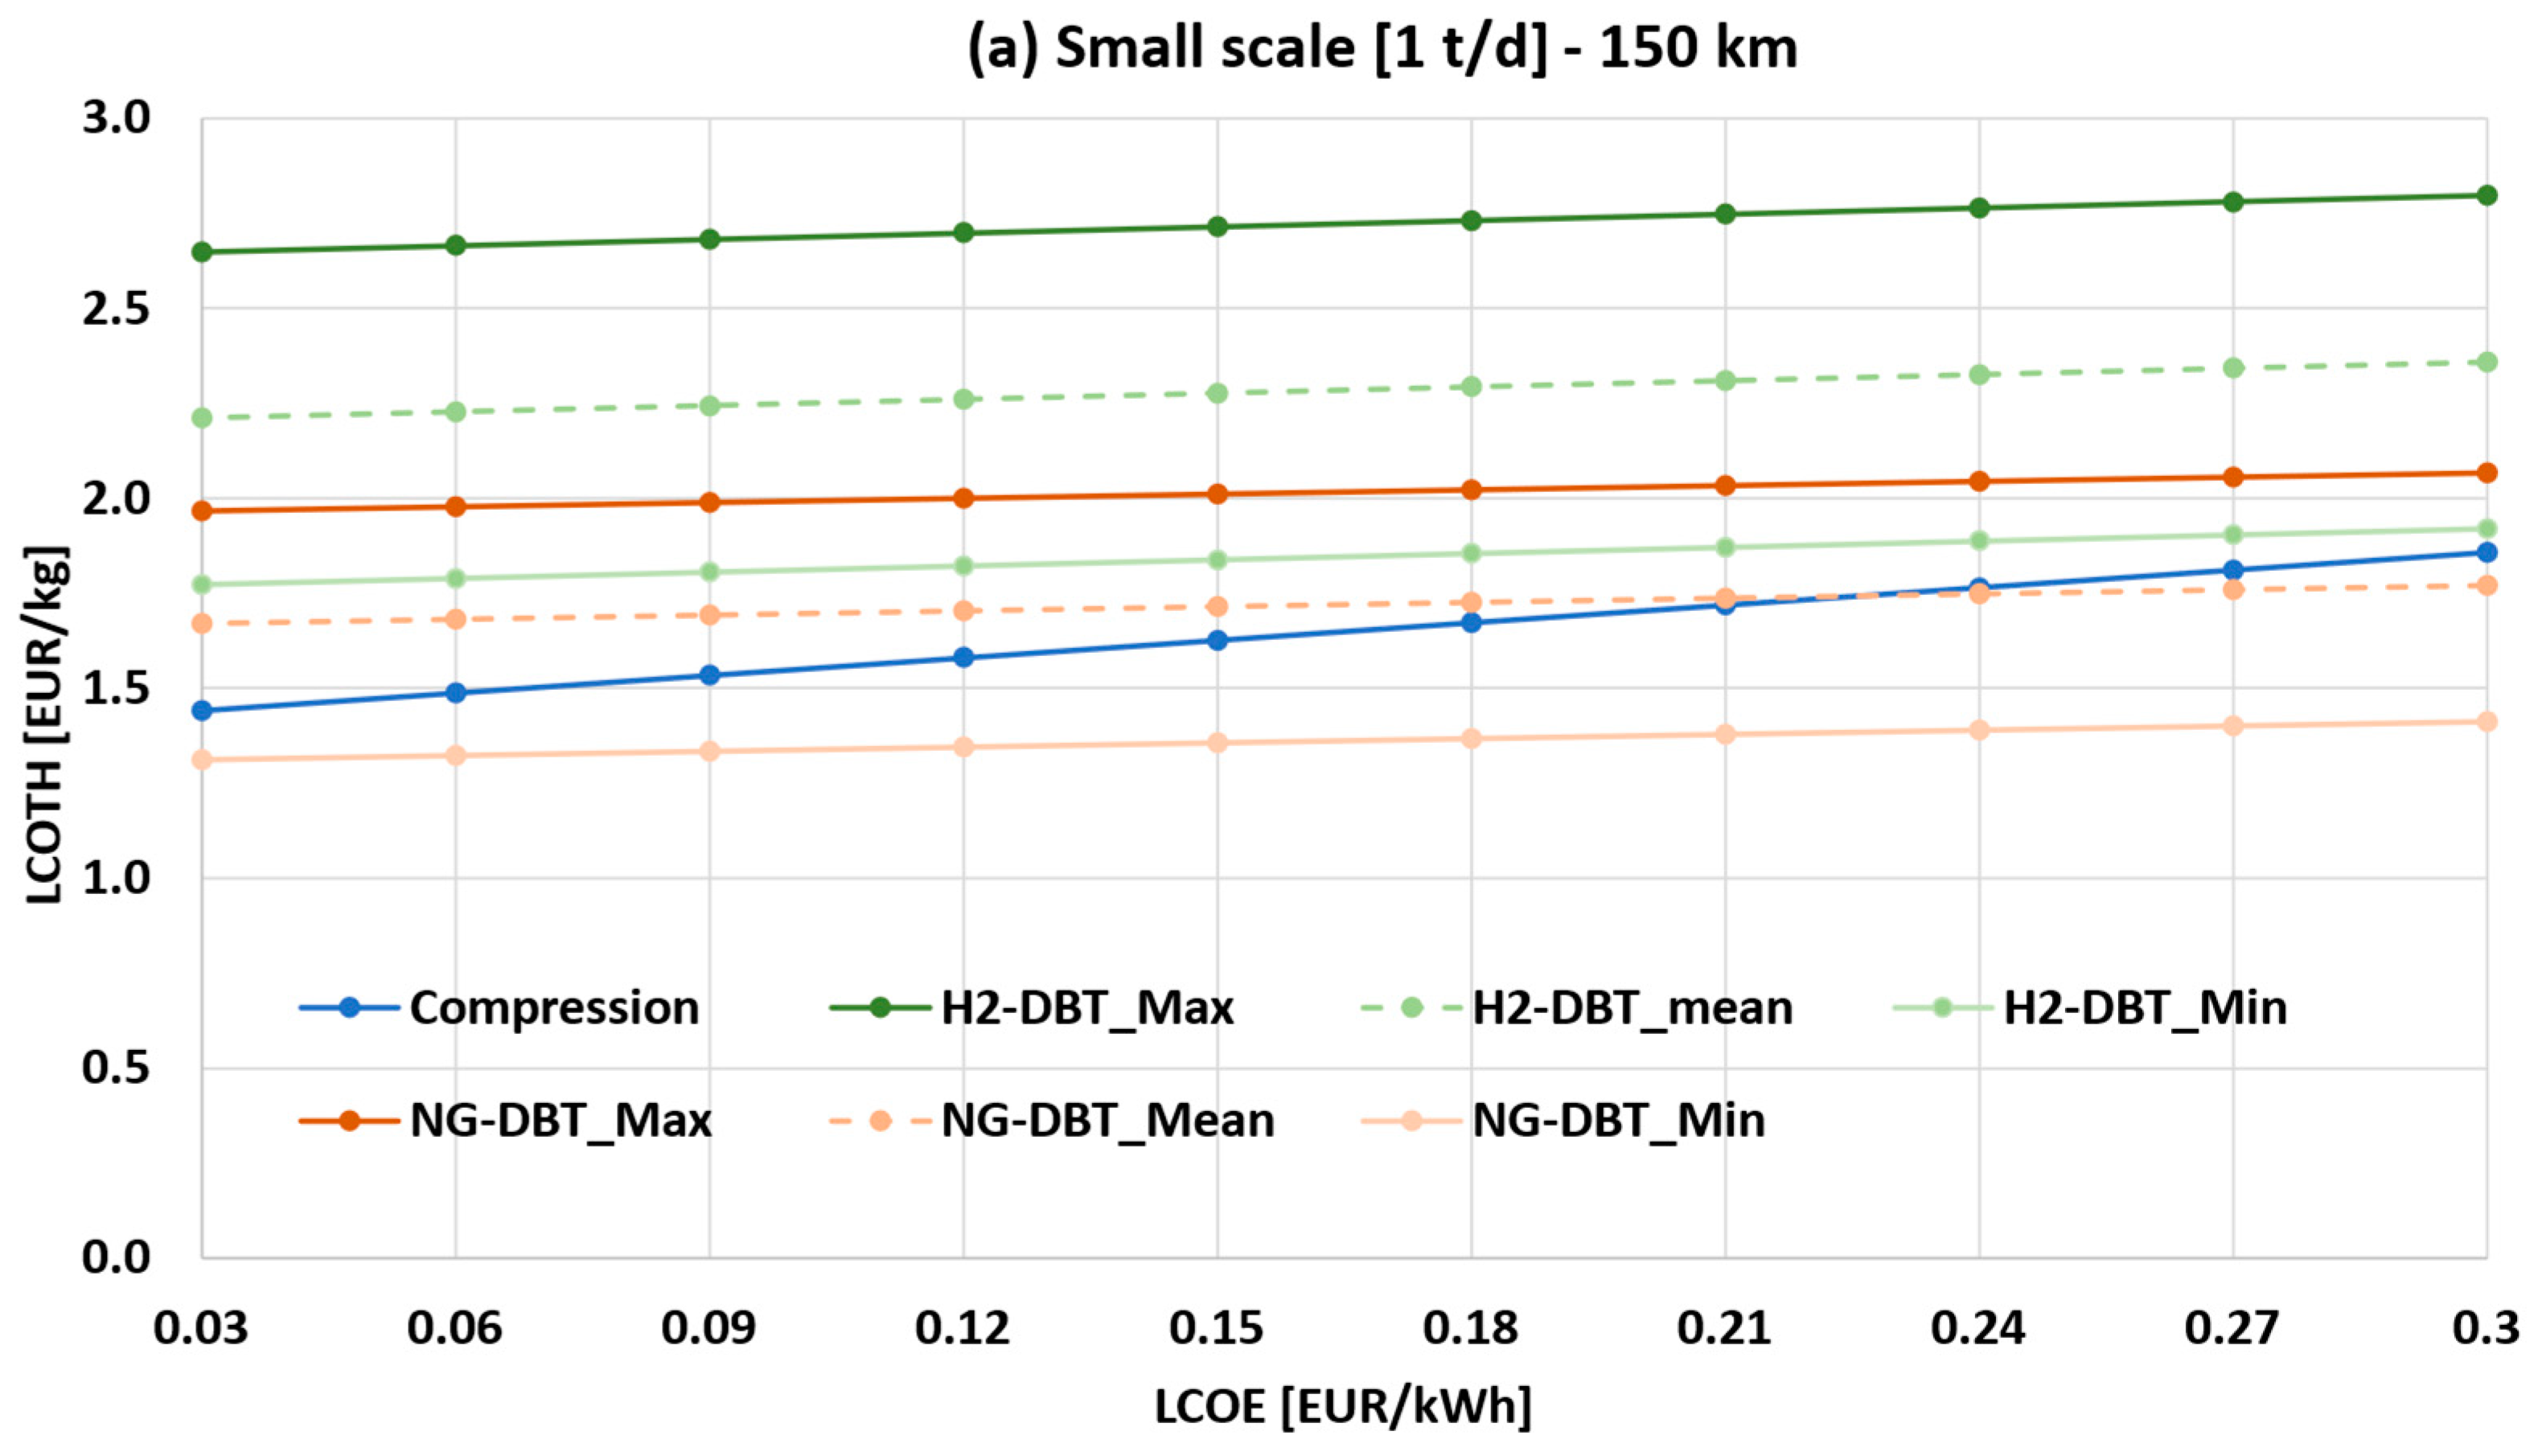
Figure 7a,b show the sensitivity analysis of the LCOTH as a function of LCOE and capital cost assumptions for the DBT/PDBT system (both H
2- and NG-powered systems), at 150 km transport distance for the 1 t/d case (small scale) and 4 t/d case (large scale), respectively. The liquid hydrogen scenario is not reported, as it is consistently uncompetitive within this range.
In
Figure 7a, LOHC transport is more economical than compressed hydrogen only under the NG-DBT_Min scenario for all LCOE in the range. When assuming NG-DBT_Mean, the LCOTH of DBT option intersects the compressed hydrogen curve only at electricity prices of 0.22 EUR/kWh. Above this value, NG-DBT_mean becomes more cost-effective than the compressed option. In contrast, NG-DBT_Max and H2-DBT are never competitive over the entire LCOE range, with LCOTH values consistently above 2 EUR/kg.
In the 4 t/d case (
Figure 7b), scale benefits become evident. Once again, NG-DBT_Min is the most cost-effective solution across nearly the entire LCOE range. However, when the LCOE drops below 0.03 EUR/kWh, the hydrogen compression cost becomes comparable to that of the DBT (0.94 EUR/kg for NG-DBT_Min vs. 0.93 EUR/kg for compression). For NG-DBT_Mean, the intersection with compressed hydrogen occurs at LCOE values up to 0.24 EUR/kWh. As in the small-scale case, NG-DBT_Max and H2-DBT remain uncompetitive, even at the lowest electricity price considered.
These findings confirm that LOHC economic performance is highly sensitive to electricity costs and capital expenditures. Reducing LCOE through long-term PPAs, and minimizing reactor and BOP costs via technological optimization, are key to improving the viability of LOHC-based hydrogen transport.
Notably, the slope of the LCOTH curve for compressed hydrogen is steeper than that of the LOHC solution. This reflects its stronger dependency on electricity prices, as compression is an entirely electrical process. In contrast, the LOHC system relies primarily on thermal energy for dehydrogenation, which is independent of the LCOE in both the NG-powered and H2-powered configurations. Consequently, at low electricity prices and large hydrogen demand, compressed hydrogen becomes increasingly competitive with LOHC even under optimistic CAPEX assumptions for DBT.
4.4.2. LCOH
Figure 8a,b show the sensitivity of the LCOH as a function of the LCOE and IC of the hydrogenation and dehydrogenation plants. As expected, the LCOH increases with higher LCOE values across all configurations.
In the 1 t/d case (
Figure 8a), the NG-DBT_Min configuration is the most economical, with LCOH values ranging from 3.99 to 10.50 EUR/kg, closely followed by compressed hydrogen (4.12–10.77 EUR/kg). The NG-DBT_Mean scenario exhibits slightly higher values, ranging from 4.34 to 10.86 EUR/kg. Overall, the three cost curves remain closely aligned across the entire LCOE range, unlike the H
2-DBT scenarios, which exhibit higher LCOH values. In particular, the H
2-DBT_Min configuration ranges between 4.95 and 11.49 EUR/kg. Among all configurations, the liquefaction option results in the highest LCOH, with values ranging from 6.83 to 14.50 EUR/kg.
For the 4 t/d case (
Figure 8b), scale effects lead to a reduction in LCOH across all configurations. A similar trend is observed, with liquefaction showing the highest LCOH (4.91–12.58 EUR/kg), while NG-DBT_Min, compressed hydrogen, and NG-DBT_Mean exhibit the lowest values, with ranges of 3.46–9.98 EUR/kg, 3.44–10.10 EUR/kg, and 3.69–10.21 EUR/kg, respectively. At low LCOE values (0.03 EUR/kWh), the difference between the LCOH of liquefaction and H
2-DBT_Max becomes very small, making their costs almost equal (4.80 vs. 4.91 EUR/kg).
It is important to note that the H2-powered LOHC scenario is significantly penalized by the internal hydrogen consumption required to supply the thermal demand of the dehydrogenation reactor, which reduces the net hydrogen delivered to the end user by approximately 32%. In this study, this self-consumed hydrogen was treated as a direct loss, thereby increasing the levelized cost. However, such an assumption may be overly conservative, as the internally used hydrogen could be more appropriately accounted for as an operational energy input rather than a reduction in delivered product.
In contrast to the liquid hydrogen option—where boil-off losses are incorporated into the system energy balance—the H2 consumption in the LOHC system is reflected in the final yield, potentially overstating its economic disadvantage. A more consistent modelling approach, treating internal hydrogen consumption as an equivalent thermal energy demand, would likely narrow the LCOH gap between the H2-powered LOHC and other transport options. Future analyses should further investigate this aspect, including the possibility of hybrid configurations exploiting waste heat or alternative thermal sources to improve overall system performance.
5. Conclusions
This study provides a comprehensive techno-economic assessment of hydrogen transportation via LOHCs, comparing it with compressed and liquefied hydrogen for daily demands of 1, 2, and 4 t/d over transport distances of 50, 150, and 300 km. The simulation of the hydrogenation and dehydrogenation systems in Aspen Plus allowed for an in-depth analysis of operating conditions and the calculation of mass and energy balances. For the LOHC transport option, two scenarios are considered: a NG-powered LOHC scenario, where the dehydrogenation reactor is fuelled by natural gas combustion, and a H2-powered LOHC scenario, where part of the hydrogen is used to fuel the dehydrogenation reactor.
The results indicate that for short distances (≤150 km), compressed hydrogen is the most economical option, with LCOTH values ranging from 1.10 to 1.61 EUR/kg. However, at 300 km, the NG-powered LOHC scenario becomes the most cost-competitive solution, with LCOTH between 1.49 and 1.90 EUR/kg compared with 1.81–2.42 EUR/kg for compressed hydrogen. While the LOHC system requires additional transformation steps, it benefits from a smaller fleet size and lower trucking costs at longer distances.
The sensitivity analysis demonstrates that the LCOH is highly sensitive to electricity prices and the capital costs of the hydrogenation and dehydrogenation systems. At 150 km and a demand of 1 t/d, the NG-powered LOHC system becomes more cost-effective than compressed hydrogen when electricity prices exceed 0.22 EUR/kWh. For a daily target of 4 t/d, under favourable CAPEX assumptions (DBT_Min), the LCOTH of LOHC drops to 0.94 EUR/kg, compared with 0.93 EUR/kg for compressed hydrogen. Conversely, at very low electricity prices (e.g., 0.03 EUR/kWh), compressed hydrogen remains the most competitive option. These results underscore the importance of securing long-term power purchase agreements and optimizing system CAPEX to enhance the viability of LOHC-based transport.
The environmental assessment highlights that moving from compressed hydrogen to LOHC or liquid hydrogen transport can substantially reduce CO2 emissions. Specifically, LOHC achieves a 56% reduction, while liquid hydrogen transport leads to a 78% decrease, underscoring their potential role in minimizing the carbon footprint of hydrogen logistics.
Although compressed hydrogen tube trailers remain the most economical solution for distances up to 150 km, the frequent deliveries may present logistical considerations that warrant further evaluation in future studies. Therefore, with advancements in DBT/PDBT technology, reductions in capital costs, and improvements in energy efficiency, LOHC technology could become increasingly competitive, reducing the number of required trips while maintaining a fixed transported hydrogen quantity.
Future research should aim at improving the efficiency of both the hydrogenation and dehydrogenation processes while also reducing system costs. In addition, further studies on the environmental impact and lifecycle assessment of LOHC technologies will be essential to fully understand their potential and support informed decision making for large-scale deployment.


