Abstract
Natural fractures in tight sandstone reservoirs are the key factors controlling hydrocarbon flow and productivity. The Bozi-1 gas reservoir in the Kuqa Depression, as a typical ultra-deep tight sandstone gas reservoir, is characterized by low-porosity and ultra-low-permeability sandstones. This study addresses the limitations of previous fracture characterization, which primarily focused on macro-structural fractures while neglecting medium- and small-scale fractures. We integrate multi-source heterogeneous data, including core, well-logging imaging, seismic, and production observations, to systematically conduct multi-scale natural fracture characterization and modeling. First, the overall geology of the study area is briefly introduced, followed by a detailed description of the development characteristics of large-scale and medium–small-scale fractures, achieving a multi-scale representation of complex curved fracture networks. Finally, the three-dimensional multi-scale fracture model is validated using static indicators, including production characteristics, water invasion features, and well leakage data. The main findings are as follows: (1) Large-scale fractures in the Bozi-1 reservoir are mainly oriented near EW, NE–SW, and NW–SE, acting as the primary hydrocarbon migration pathways. Medium–small-scale fractures predominantly develop near SN, NE–SW, NW–SE, and near EW directions, exhibiting strong heterogeneity. (2) The complex curvature of large-scale fractures was captured by the “adaptive sampling + segmented splicing + equivalent distribution of fracture flow capacity” method, while the distribution of effective medium–small-scale fractures across the study area was represented using “single-well Stoneley wave inversion + seismic machine learning prediction”, achieving an 86% match with actual single-well measurements. (3) Model reliability was further verified through static comparisons, including production characteristics (unimpeded flow vs. effective fracture density, R2 = 0.92), water invasion features (fracture-dominated water invasion matching fracture distribution), and well leakage characteristics (matching rate of high fracture density zones: 84.2%). The results provide key technical support for the precise characterization of fracture systems and establish a model ready for dynamic simulation in ultra-deep tight sandstone gas reservoirs.
1. Introduction
The Tarim Basin serves as the core gas supply area for China’s “West-to-East Gas Transmission” project. The western Kuqa Depression, as a typical foreland thrust belt, contains abundant deep to ultra-deep natural gas resources and represents a strategic replacement area for increasing and sustaining national gas reserves [1]. Within this region, the Bozi-1 gas reservoir, as a representative ultra-deep tight sandstone reservoir of the Cretaceous in the Kuqa Depression, is buried at depths exceeding 7500 m. The reservoir is characterized by low porosity (<10%) and ultra-low permeability (<0.1 mD), making it a key production block for ensuring energy security along the transmission corridor [2]. However, due to the extreme conditions of high temperature and high pressure and the specific properties of tight reservoirs, the natural productivity of Bozi-1 is generally low. Fracture development, scale composition, and spatial connectivity are the primary factors controlling production capacity [3]. Recent attention to fracture–fluid coupling behavior has highlighted multi-source, multi-scale, and dynamically constrained fracture characterization as a critical pathway to improving the precision of tight reservoir development decisions. Therefore, systematic multi-scale characterization and three-dimensional modeling of natural fractures in the Bozi-1 reservoir are of great practical significance for overcoming development bottlenecks in ultra-deep tight sandstone reservoirs and improving resource utilization efficiency. This importance is not only reflected in enhanced single-well productivity but also directly affects the stability and long-term supply capacity of the energy security system along the “West-to-East Gas Transmission” corridor.
In recent years, research on natural fractures in tight reservoirs has formed a multi-scale technical chain spanning micro- to macro-scales. At the microscopic scale, nano- to micron-scale fractures and pore structures are characterized through core thin sections and high-resolution imaging techniques such as FIB-SEM, revealing fracture origins and pore–fracture interactions [4,5]. At the mesoscopic scale, wellbore imaging and acoustic data, such as FMI and CBIL logs, are used to quantitatively identify fracture orientations, densities, and pore-throat connectivity characteristics [6]. At the macroscopic scale, pre-stack seismic anisotropy inversion, geomechanical modeling, and structural analysis enable the prediction of large-scale fracture zones and fault-controlled fracture belts [7,8,9]. In modeling and numerical simulation, traditional engineering techniques such as discrete fracture network (DFN) methods, extended finite element methods (XFEMs), and coupled flow–solid approaches have been widely applied to represent fracture network geometry and its effects on flow fields. Machine learning techniques, including convolutional neural networks (CNNs), have increasingly facilitated multi-source data integration and automated extraction of fracture parameters. Recently, generative adversarial networks (GANs) have emerged as a powerful tool for fracture network reconstruction and upscaling. For instance, the FracGen approach generates realistic fracture networks from limited observations, enabling field-scale upscaling, while conditional GANs (CGANs) have been applied for multi-scale modeling of fracture porosity and permeability tensors, accurately reproducing both geometry and flow characteristics. These approaches complement traditional DFN methods by providing data-driven, high-resolution, and upscalable representations of fracture networks [10,11]. The progressive integration of these methods provides methodological support for high-precision reconstruction and dynamic optimization of multi-scale fracture networks [12,13].
For the Kuqa Depression, particularly the Bozi block, recent regional geological and structural studies provide a solid basis for analyzing the origin of natural fractures. It has been shown that the Kuqa Depression experienced multiple episodes of fracture/fault reactivation and strike–slip interactions during its structural evolution, which exert significant control on fracture occurrence, orientation, and spatial extent [14,15,16]. Local studies on the Bozi-1 reservoir and the surrounding Bashijiqike and Bazigay formations have also made progress [17,18,19]. The Bozi-1 reservoir exhibits clear heterogeneity in fracture development under structural stress redistribution, with large-scale tectonically driven fractures coexisting with medium–small-scale fractures controlled by sedimentary–diagenetic processes, jointly determining the reservoir’s flow pathways [20,21]. Multiple field measurements and numerical analyses indicate that fracture distribution and connectivity have significant impacts on gas productivity and water invasion response: local studies have revealed correlations between effective fracture zones and high-production wells, highlighting the fracture system’s control over production decline and water invasion channel formation under high-pressure injection and production [22,23]. Moreover, fracture scale, dip, and spatial density vary significantly across different structural domains and stratigraphic intervals, underscoring the need to consider both structural evolution history and reservoir heterogeneity when constructing three-dimensional fracture models.
Although several fracture modeling studies have been conducted in the Bozi block, limitations remain. First, existing work often overlooks fracture scales, focusing on macroscopic structural fracture identification and belt delineation, such as analyzing high-angle structural fractures using dipole sonic logs [7] or mapping fracture belts through seismic coherence techniques [24]. Systematic studies on the development patterns of medium–small-scale fractures and the flow connectivity between large-scale fractures are still lacking, limiting the DFN model’s ability to reproduce actual connectivity [21,25]. Second, most fracture models are based on static data (core, well logs, and seismic) for geometric inference, without fully considering fracture effectiveness under ultra-deep high-temperature and high-pressure conditions. In particular, workflows integrating production, water invasion, and well leakage data for inversion and calibration are still insufficient, resulting in uncertainty in predicting flow and recoverable hydrocarbons [8,26]. Third, the coupled effects of tectonic control and sedimentary–diagenetic processes are often simplified in multi-scale modeling, whereas in reality these factors act together and overlap, requiring a comprehensive strategy that integrates geomechanical–geochemical constraints with multi-source observations [14,16]. Finally, although geophysical methods for evaluating fracture permeability (e.g., Stoneley wave-based methods) and production sensitivity analyses have been gradually implemented, their applicability, calibration, and error assessment under ultra-deep conditions require more field measurements and numerical comparisons [27,28,29]. These limitations constrain the refined design of Bozi-1 reservoir development plans, necessitating targeted multi-scale fracture characterization and modeling studies.
To address the above issues, this study focuses on the Bozi-1 reservoir, integrating core, well logs, seismic, and recent production dynamic data to systematically conduct multi-scale natural fracture characterization and modeling. The paper is organized as follows: first, a brief overview of the study area’s geology is presented, followed by a detailed description of large-scale and medium–small-scale fracture development, achieving a multi-scale representation of complex curved fractures. Finally, the three-dimensional multi-scale fracture model is validated through production characteristics, water invasion features, and well leakage data. The results effectively reveal the distribution patterns and formation mechanisms of multi-scale natural fractures, deepen scientific understanding of fracture systems in tight sandstone reservoirs, and provide key technical support for efficient development of the Bozi-1 reservoir.
Compared with previous multi-scale fracture modeling workflows applied in the Bozi–Dabei and Keshen fields, which primarily focus on macroscopic fracture belts or polygonal DFN representation, our study introduces an innovative Adaptive Sampling and Segmented Splicing (AS + SS) approach. The AS + SS method improves geometric fidelity by adaptively sampling along fracture skeletons, preserves fine-scale curved fracture features via segmented fitting, and ensures accurate flow capacity allocation using micro-triangular element splicing. Preliminary benchmarks indicate that AS + SS reduces geometric deviation by more than 60% and flow transmissivity prediction error by approximately 50% compared with conventional workflows. This methodological advancement enables a more accurate and hydraulically representative multi-scale fracture characterization, providing a solid foundation for subsequent reservoir modeling, production prediction, and development planning in ultra-deep tight sandstone reservoirs.
2. Geological Overview
The Kuqa Depression in the Tarim Basin, as a strategic replacement area for ultra-deep natural gas exploration in China, is located at the junction of the southern Tianshan and the Tarim block. It represents a typical foreland thrust belt structural system, characterized by multiple rows of nearly east–west trending thrust fault zones (Figure 1). The Bozi-1 gas reservoir is situated in the western part of the Kelasu structural belt, where the overlying thick Paleogene–Neogene evaporite sequences exhibit plastic flow, forming a three-layer structural system composed of salt-cored thrust folds, salt detachment layers, and underlying reverse fault imbricates.
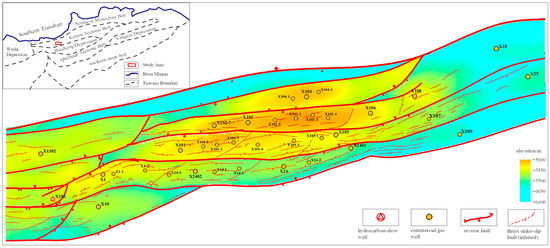
Figure 1.
Location and main structural features of the Bozi-1 block in the Kuqa Depression.
The Cretaceous Bashijiqike and Bazigay formations in this block are generally buried at depths exceeding 6000 m and develop braided river delta front subfacies. Sandbody distribution is controlled by paleotopography, showing NW–SE-oriented ribbon-like trends. The reservoir space is characterized by a dual system of “matrix porosity + structural fractures”, with an average porosity of 6–7% and permeability as low as 0.2–0.3 × 10⁻³ μm2, representing a typical ultra-deep tight sandstone reservoir. Petrographic thin sections indicate that the reservoir is dominated by quartz and feldspathic lithic sandstones, with cement primarily composed of calcite and anhydrite. Kaolinite cement occurs locally, and intense compaction has almost destroyed primary porosity.
The study area underwent three phases of compound deformation from the Late Haixi to Himalayan periods: (1) the Late Permian–Triassic basement-involved thrust formation, (2) Jurassic–Cretaceous detachment fold development in the cover sequence, and (3) the Neogene foreland thrust belt stabilization. The Himalayan tectonic event was the most intense, forming gently sloping thrust fault systems with dip angles of 15–25° in the Bozi area. Fault displacements ranged from 3.2 to 4.8 km, and the interlimb angles of structural cores generally exceeded 150°, creating a weakly deformed structural domain.
3. Description of Multi-Scale Natural Fractures
Based on their scale and identification method, the structural fractures in the Bozi 1 gas reservoir can be divided into large-scale fractures and small- to medium-scale fractures. Large-scale fractures are rarely observed in cores or wellbore imaging, mostly existing at microfracture scales, and are primarily identified through seismic data. In contrast, small- to medium-scale fractures can be recognized using single-well data such as core and wellbore imaging, and their scales are comparable to fractures observed at outcrops.
3.1. Characteristics of Large-Scale Fractures
Large-scale fractures typically extend from hundreds of meters up to several kilometers and play a dominant role in the macroscopic flow characteristics of the reservoir. In ultra-deep tight sandstone reservoirs, large-scale fractures serve as high-efficiency pathways for hydrocarbon migration, and their development characteristics and spatial distribution directly influence exploration and production effectiveness. Currently, seismic attribute analysis is a common method for predicting large-scale fractures, which includes both pre-stack and post-stack attributes. Post-stack attributes are mainly derived from coherence, curvature, variance, ant tracking, and likelihood analyses, emphasizing discontinuities within the strata and effectively identifying potential fracture zones. However, their resolution is inherently limited. Pre-stack data, by contrast, offer higher resolution and can quantify fracture density and aperture, but their use is limited by data quality, acquisition costs, and processing complexity; unfortunately, the Bozi 1 block was not included in available pre-stack data coverage. Therefore, this study primarily relies on post-stack seismic attributes to predict the distribution of large-scale fractures.
Multi-phase composite tectonic deformation affects seismic quality in the Bozi 1 block. To address reflection distortions caused by structural movements, structure-oriented smoothing was applied to the seismic volume. The processed post-stack seismic data have a dominant frequency of 60–80 Hz, a vertical resolution of approximately 15–20 m, and an average S/N of 15–20 dB after filtering and preconditioning. Acquisition parameters include a receiver spacing of 25 m, shot spacing of 50 m, and fold > 60. Multiple post-stack attributes were extracted from these data, including variance, curvature, ant tracking, coherence, AFE, phase cosine, reflection amplitude, instantaneous frequency, and peak frequency. Calibration of fracture attribute responses was performed using single-well fault encounters and lost circulation features. The ant tracking attribute was found to be most sensitive to large-scale fractures and was subsequently used to delineate their development and spatial distribution, as shown in Figure 2a.
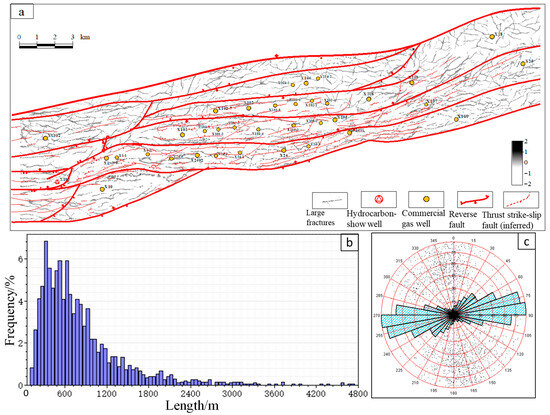
Figure 2.
Large-scale fracture distribution in the Bozi 1 block. (a) Ant tracking attribute: Shows spatial distribution of major fractures, calibrated with well data. (b) Length statistics of large-scale fractures: Horizontal lengths 200–5000 m, most common 200–1200 m. (c) Rose diagram of large-scale fracture orientations: Mainly EW-oriented; eastern and western high-density zones form complex networks (EW, NE–SW, NW–SE); central fractures align with EW-trending faults under near-SN compression. Note: Fracture scale classification: small-scale < 30 m, medium-scale 30–200 m, large-scale ≥ 200 m (seismic-resolvable corridors).
In the study area, large-scale fractures mainly occur as through-layer shear fractures that cut across individual strata. Vertically, their heights generally range from tens of meters to several tens of meters, with apertures of several hundred micrometers or more. Horizontally, their lengths primarily range from 200 to 5000 m, with fractures in the 200–1200 m range being most developed, accounting for 73% of occurrences (Figure 2b). In plan view, fractures are predominantly near east–west (EW) oriented. The eastern and western parts of the block, influenced by superimposed multi-phase arcuate thrust fold belts, show higher fracture densities and development along three main directions: near EW, NE–SW, and NW–SE, forming a complex fracture network. In the central high areas, fractures tend to align closely with the EW-trending faults and mainly develop under near-SN compressive stress fields, where superimposed deformation is relatively weak (Figure 2c).
3.2. Development Characteristics of Medium- and Small-Scale Fractures
Compared with large-scale fractures, medium- and small-scale fractures generally extend only tens of meters or less, exerting a stronger influence on local reservoir flow characteristics. Although individual fractures are limited in size, their high density and strong network connectivity mean they can contribute over 60% of the overall permeability in ultra-deep, low-porosity, low-permeability reservoirs.
Currently, various methods exist for describing and predicting medium- and small-scale fractures, each with distinct advantages. Wellbore imaging techniques are effective for direct identification: Formation MicroImager (FMI) logs can clearly reveal microfeatures of the borehole wall, and analysis of resistivity anomaly streaks allows accurate determination of fracture presence, orientation, and aperture. Acoustic logging techniques can also identify fractures, as fractures alter wave propagation paths, resulting in increased travel times and anomalous amplitude ratios; analyzing changes in P-wave and S-wave travel times and amplitude ratios can reveal fracture development. Additionally, conventional seismic discontinuity attributes, such as coherence and curvature, can be used to evaluate fracture density at these scales.
Previous studies based on core, thin section, and imaging logs indicate three generations of natural fractures in the Bozi area:
- First generation: Formed during the Late Cretaceous–Neogene Jidike Formation deposition under near N–S extension and weak compressional uplift, producing limited E–W tensile fractures and N–S shear fractures. These early fractures were largely mineral-filled with calcite or gypsum, rendering them ineffective.
- Second generation: Developed during the Neogene Kangcun–Kuqa formations under near N–S compression, generating mainly N–S shear fractures. These fractures are partially unfilled, with relatively low effectiveness and limited contribution to production.
- Third generation: Formed during the late deposition of the Kuqa Formation under strong N–S compressive thrusting, producing shear fractures and E–W tensile fractures caused by bending deformation. These fractures are numerous, widely distributed, and characterized by large apertures and low fill, making them the most effective for fluid flow.
The Bozi 1 gas reservoir is located in the central compressive strike–slip segment of the Bozi–Dabei area, where passive strike–slip along faults enhances heterogeneity of fracture development. Fracture orientations vary among fault blocks, primarily developing in four sets: near SN, NE–SW, NW–SE, and near EW directions. Near-fault zones experience local stress concentrations, producing well-oriented and highly developed fractures (e.g., wells X102-1, X24-1, X108). Structural highs are dominated by regional stress, resulting in stable preferred orientations but smaller fracture size (e.g., wells X102, X105, X106). Structural lows, constrained by complex stress and high overburden pressure, show dispersed fracture orientations with weak development (e.g., wells X109, X10, X103) (Figure 3).
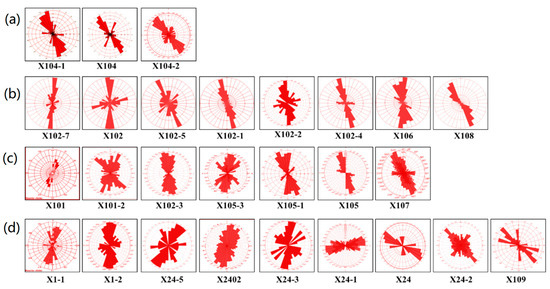
Figure 3.
Planar distribution of single-well fracture orientations in the Bozi 1 Block. (a) Near-SN direction; (b) NE–SW direction; (c) NW–SE direction; (d) Near-EW direction.
To quantitatively characterize fracture orientations, we computed the Fisher distribution parameters for each set. The concentration parameter κ (kappa) indicates orientation clustering, with high κ corresponding to well-aligned fractures and low κ representing dispersed orientations. Standard deviations of strike and dip angles were calculated for all fractures within each set, and orientation probability density functions (PDFs) were generated to represent the likelihood of different orientations in space. For example, near SN fractures in near-fault zones show κ = 25–30, standard deviation σ = 8–12°, and a sharply peaked PDF, reflecting strong alignment. In contrast, fractures in structural lows show κ = 5–10, σ = 20–30°, and a broader PDF, indicating dispersed orientation. These quantitative metrics were used as input parameters in the stochastic DFN simulations, ensuring that the generated medium- and small-scale fracture networks accurately reproduce both dominant orientations and local variability.
4. Multi-Scale Natural Fracture Modeling
4.1. Large-Scale Fracture Model Construction
The Discrete Fracture Network (DFN) method [30] is widely applied in both domestic and international studies for natural fracture modeling. This method represents fractures as planar surfaces with varying geometries, dimensions, orientations, and dips in three-dimensional space. The spatial configuration and interconnection of these planes form a three-dimensional fracture network. DFN models can be either deterministic or stochastic. For large-scale fractures, where parameters such as length, morphology, and aperture are generally well constrained, deterministic DFN modeling is typically employed to construct a network that accurately reflects these properties.
In this study, large-scale fractures were modeled based on seismic ant-tracking attribute volumes combined with automatic fracture extraction techniques. Each extracted fracture plane is characterized by geometric attributes such as orientation, length, and dip, which collectively serve as the foundation for establishing a deterministic DFN model (Figure 4). However, conventional DFN approaches often represent fractures using polygonal surfaces, which inadequately capture curved geometries and fail to reflect heterogeneity along fracture planes, leading to geometric distortion and loss of accuracy.
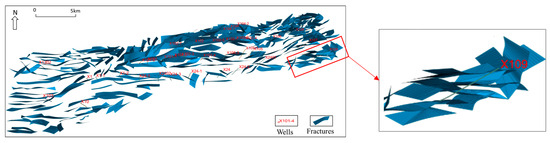
Figure 4.
Deterministic DFN model of large-scale fractures extracted from seismic ant-tracking attributes.
To overcome these limitations, this study adopts and extends the segmented fitting DFN method originally proposed by Luo et al. [31]. The improved approach extracts key geometric feature points along curved fractures, including curvature inflection points (e.g., apexes of arc-shaped fractures or bend points of polygonal fractures), endpoints, and intermediate sampling points. The sampling density is adaptively adjusted according to local curvature, ensuring that fine-scale geometric details are preserved while maintaining computational efficiency.
Building upon this foundation, we propose an enhanced Adaptive Sampling and Segmented Splicing (AS + SS) method. This method integrates adaptive geometric control and segment-level continuity constraints to reconstruct complex large-scale fracture geometries with high fidelity. The AS + SS method demonstrates several key advancements: (1) Adaptive Sampling: Sampling density is dynamically adjusted along the fracture skeleton based on local curvature, achieving accurate representation of geometrical complexity while minimizing computational redundancy. (2) Segmented Fitting: The method automatically identifies geometric boundaries and processes fracture segments individually, effectively preventing shape distortion and feature mixing. (3) Micro-triangular Element Splicing: Each fracture is reconstructed as a surface composed of micro-triangular elements stitched together, mitigating distortion and non-coplanarity issues inherent in rectangular discretization. This approach ensures that the assembled surface closely approximates the original fracture morphology (Figure 5). (4) Equivalent Flow Capacity Allocation: Based on the principle of equivalent permeability, fracture flow capacity, porosity, and aperture are proportionally allocated to each triangular element according to its area, ensuring that the overall transmissivity of the reconstructed network remains consistent with that of the original fractures.
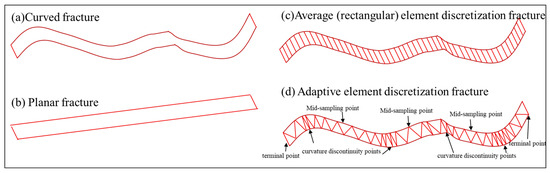
Figure 5.
Schematic diagram of the principle for reproducing arbitrary fracture using the improved DFN method (a) Curved fracture; (b) Planar fracture; (c) Average element discretization fracture; (d) Adaptive element discretization fracture by the improved DFN method.
Mathematically, the AS + SS procedure is defined as follows:
Adaptive Sampling: The sampling interval along the fracture skeleton is controlled by local curvature :
where is the maximum interval in low-curvature regions, is a scaling factor, and is the arc-length parameter along the skeleton. This ensures finer sampling in regions of high curvature.
Segmented Splicing: Each fracture is represented by piecewise parametric curves , for segment . Geometric continuity is enforced at segment boundaries:
Micro-triangular Element Splicing: Each fracture surface is discretized into micro-triangles with areas . The total fracture area is . Equivalent flow capacity is allocated proportionally:
where are the permeability, porosity, and aperture assigned to triangle , and are the properties of the original fracture.
To quantitatively assess the accuracy of the large-scale fracture extraction using the AS + SS method, the reconstructed fractures were compared with manually interpreted fractures from high-resolution seismic slices and core/FMI observations. The mean fracture orientation error is 6.3° ± 2.1°, the relative fracture length error is 8.5% ± 3.7%, and the mean lateral displacement of fracture midpoints is 5.2 m ± 1.8 m. These metrics indicate that the AS + SS method accurately preserves fracture geometry while minimizing deviations in orientation, length, and spatial position. This quantitative evaluation ensures that the fracture reconstruction is reproducible and provides a reliable basis for subsequent DFN modeling and flow simulations.
To explicitly incorporate the mechanical effect of in situ stress on fracture hydraulics, a stress-dependent aperture formulation was added to the DFN workflow. The aperture of the G3 large-scale fractures is computed using a commonly adopted nonlinear stress–aperture relationship:
where is the stress-dependent fracture aperture, is the mechanically open aperture, is the effective normal stress, and is the stress-sensitivity coefficient. This formulation ensures that aperture reduction under increasing normal stress is physically represented when assigning hydraulic properties to micro-triangular elements.
The improved DFN method significantly enhances both the geometric fidelity and hydraulic equivalence of large-scale fracture modeling. Cross-validation with multi-source data—such as well production performance, water-cut responses, and local structural attributes—confirms the reliability of the reconstructed fracture network. The resulting high-precision deterministic DFN model integrates seamlessly with small- and medium-scale DFNs and with machine learning–predicted Effective Fracture Density (EFD) fields, providing a robust geological foundation for subsequent flow simulations and dynamic reservoir response analyses.
To further clarify the dual-porosity flow mechanism associated with the DFN-EFD integrated model, a quantitative assessment of matrix contribution was incorporated. Although the matrix in tight sandstone reservoirs typically exhibits porosity < 12% and permeability ranging from 0.01 to 0.5 mD, the natural fractures mapped and reconstructed in the DFN model commonly show equivalent fracture conductivity on the order of 5–50 D·mm, representing two to three orders of magnitude higher transmissivity.
Based on these widely reported core- and log-scale parameter ranges, we estimated the relative contribution of the matrix and fractures to the total flow capacity. For each simulation grid block, the matrix transmissivity and fracture transmissivity were computed as:
where and denote matrix and fracture permeabilities, the aperture, and the layer thickness. The fracture network geometry and intensity were constrained by the DFN reconstruction combined with the machine-learning–predicted EFD field. Specifically, the machine learning model employed a Support Vector Machine (SVM) algorithm. Input features—including well-log-derived fracture attributes and seismic ant-tracking parameters—were standardized to zero mean and unit variance to ensure balanced contributions across features. The dataset was randomly split into training (70%) and testing (30%) sets, and k-fold cross-validation (k = 5) was applied on the training set to prevent overfitting and optimize hyperparameters. Model performance on the testing set achieved R2 = 0.92, demonstrating high predictive accuracy.
This transparent description ensures that the machine learning workflow is fully reproducible and that the uncertainty of the predicted fracture densities is quantitatively characterized.
Under the representative tight-reservoir conditions evaluated, the matrix contributes approximately 8–20% of the total block-scale transmissivity, while fractures account for 80–92%. This confirms that although the matrix provides a non-negligible storage and slow-release component, the overall flow capacity of the system is fracture-dominated. Incorporating this quantified coupling improves the accuracy of dynamic simulation and enables a more realistic evaluation of pressure response and production behavior.
4.2. Establishment of Medium- and Small-Scale Fracture Models
Compared with large-scale fractures, the attribute parameters of medium- and small-scale fractures are more uncertain, and therefore stochastic simulation methods are commonly used. The three-dimensional modeling of medium- and small-scale fracture intensity is the core of this scale’s modeling, and its accuracy directly affects the precision of the resulting fracture model.
In terms of parameter selection for characterizing the development of medium- and small-scale fractures, existing studies—both domestic and international—mainly focus on fracture density (intensity) in target layers, treating areas with high fracture line density as potential zones for efficient hydrocarbon recovery. However, such approaches often neglect the representation and prediction of actual subsurface fracture apertures. In reality, fracture density alone does not accurately reflect the true flow capacity; the effective fracture aperture has a greater impact on permeability and is the main source of uncertainty in modeling naturally fractured reservoirs. Fracture effectiveness is influenced by multiple factors, including present-day stress magnitude and orientation, fracture formation timing, abnormal fluid pressure, tectonic uplift and erosion, mechanical properties of fracture surfaces, fracture orientation, structural deformation and fault activity, and cementation or filling.
Conventional well logging data alone cannot accurately evaluate fracture effectiveness. Stoneley waves [32,33], sensitive to fluid movement within the wellbore, can provide precise assessments of fracture permeability. Stoneley waves propagate along the borehole wall, with energy exponentially decaying as the distance from the wall increases. At low frequencies, Stoneley waves transform into tube waves, causing radial expansion and contraction of the wellbore. In zones with effective fractures, energy dissipation of tube waves allows fluid to flow into and out of the formation. Differences in Stoneley wave energy attenuation, therefore, reflect the flow capacity and connectivity of fractures. Using single-well Stoneley wave reflections, one can invert the equivalent fracture aperture and permeability, enabling the determination of effective fracture equivalent density.
The Stoneley-wave inversion workflow in this study includes several key components to ensure reliable derivation of fracture aperture and permeability. First, the dominant frequency range of the Stoneley waves (typically 5–20 Hz) is analyzed to maintain sensitivity to fractures with apertures on the order of hundreds of micrometers. Second, waveform processing involves deconvolution to remove source signature effects, band-pass filtering to isolate the Stoneley wave from other borehole and formation waves, and amplitude normalization to account for borehole fluid and tool responses. Third, inversion constraints are applied to stabilize the solution: the fracture aperture is bounded by physically plausible ranges observed from cores and FMI logs, and fracture compliance is constrained using rock elastic moduli. Finally, calibration is performed by comparing inverted fracture properties against FMI image logs and core measurements, applying scaling factors where necessary to reconcile borehole-scale inversion results with actual fracture dimensions. This comprehensive workflow ensures that the derived fracture aperture and permeability are physically consistent, reproducible, and suitable for integration into multi-scale fracture modeling.
To ensure scientific completeness, the governing equation for Stoneley wave propagation along the borehole is expressed as:
where is the particle displacement, is the borehole fluid density, and is the stress tensor incorporating formation and borehole wall properties. Fracture compliance is modeled by relating the stress-induced displacement at fracture interfaces to the effective fracture aperture:
where is the fracture aperture change, is the fracture compliance coefficient, and is the normal stress perturbation across the fracture.
The Stoneley wave inversion algorithm employs an iterative forward–inverse scheme. The forward model simulates Stoneley wave propagation considering borehole fluid properties, formation elastic moduli, and fracture compliance. The inversion iteratively updates fracture aperture and permeability to minimize the difference between observed and modeled Stoneley wave energy spectra.
Calibration is performed using both FMI imaging logs and core-derived fracture measurements. Fractures identified from core and FMI logs are classified by orientation, length, aperture, and connectivity, and are compared with inverted Stoneley properties. A scaling factor is applied to reconcile borehole-scale inversion with core-scale observations.
Assumptions and limitations include: (1) fractures are approximated as planar features within the inversion zone; (2) the method assumes negligible borehole rugosity effects on Stoneley wave propagation; (3) fluid density and viscosity are constant within the inversion interval; and (4) ultra-deep high-pressure, high-temperature conditions may introduce slight deviations in wave attenuation, which are not fully accounted for in this study. Despite these limitations, the approach provides robust estimates of effective fracture density for integration into multi-scale fracture modeling.
The spatial distribution of effective fracture density is jointly controlled by lithology, tectonic stress, and fault activity. It should be noted that pre-stack seismic attributes were not available for the Bozi-1 reservoir, limiting direct measurement of fracture-induced azimuthal anisotropy. To compensate, our workflow integrates multiple post-stack seismic attributes (e.g., curvature, variance, RMS amplitude, phase, sweetness, Trace AGC, likelihood) with well-based fracture orientation measurements derived from FMI/image logs. Stoneley wave inversion results serve as supervised labels, anchoring the seismic-to-fracture mapping in observed physical properties. Furthermore, a Fisher orientation distribution model is applied to propagate fracture orientation information stochastically, allowing the reconstructed medium- and small-scale fracture networks to reflect anisotropy trends despite the absence of pre-stack data. While this approach cannot fully replicate pre-stack-derived anisotropy indicators, it provides a reliable, physically consistent alternative for fracture modeling and prediction. Variations in effective density indirectly affect seismic wave propagation features such as amplitude attenuation, azimuthal anisotropy, and frequency changes. By using single-well Stoneley wave inversion results as “supervised labels” and fracture-sensitive seismic attributes (e.g., curvature, variance, RMS amplitude, phase, sweetness, Trace AGC, and likelihood) as “input features,” a model can learn the nonlinear mapping between seismic attributes and effective fracture density, allowing high-precision single-well results to be extended across the entire seismic coverage. Combined with fracture orientation characteristics from wellbore imaging logs and applying a Fisher orientation distribution model, stochastic simulation generates small-scale fracture elements, producing the medium- and small-scale fracture model for the Bozi-1 gas reservoir.
Table 1 compares the training performance of different seismic attribute combinations. Case 3, which integrates Curvature, Variance, RMS Amplitude, Likelihood, Phase, Sweetness, and Trace AGC, achieves the highest blind-well match rate (0.8601), significantly outperforming other configurations. In this study, the blind-well match rate is calculated by comparing predicted and observed fracture density profiles in five blind wells, randomly selected from the dataset and not used in training. The match rate corresponds to the Pearson correlation coefficient between predicted and measured fracture densities along the wellbore. In addition to the correlation-based match rate, we report the root-mean-square error (RMSE) and coefficient of determination (R2) for each blind well, along with 95% confidence intervals to quantify statistical significance and uncertainty. Error bars in Table 1 represent the standard deviation of predictions across the five blind wells. Case 3 achieves an average RMSE of 0.045, R2 = 0.92, and 95% confidence interval [0.88, 0.94], confirming both high predictive accuracy and robustness of the selected seismic attribute combination. Each attribute contributes distinctively: Curvature highlights structural deformation and potential fracture zones, Variance and RMS Amplitude capture amplitude anomalies due to fracture heterogeneity, Likelihood and Phase quantify reflection coherence and waveform changes, Sweetness emphasizes high-frequency anomalies, and Trace AGC normalizes amplitude variations across the seismic volume. The integration of these attributes enables the model to capture both geometric and seismic response features of fractures, improving prediction reliability.

Table 1.
Comparison of Training Performance for Effective Fracture Density.
The superior blind-well performance demonstrates that the selected attribute combination generalizes effectively to unseen wells, confirming its suitability for constructing medium- and small-scale fracture models. By ensuring physical interpretability and consistency with observed fracture patterns, this multi-attribute approach provides a robust foundation for subsequent reservoir characterization and fracture-based flow modeling.
In the dual-porosity flow formulation, the fluid transfer rate between the matrix and fracture system is governed by the shape factor σ, which represents the effective matrix–fracture exchange area per unit volume. To ensure model reproducibility and physical consistency, σ was parameterized following the classical Warren–Root (1963) and Kazemi (1969) approaches and the implementation used in standard reservoir simulators (e.g., CMG, ECLIPSE, TOUGH2).
For tight clastic systems with characteristic matrix block sizes of 0.3–1.0 m and fracture spacing of 5–20 m, published studies report σ values typically ranging between 0.1 and 10 m−1. Based on these commonly adopted ranges, the present model applies: σ = 1–5 m−1 for most grid blocks, with σ = 2 m−1 used as the base-case value in dynamic flow simulations.
This σ range captures realistic matrix–fracture interface geometries and allows efficient fluid transfer in accordance with the geometric characteristics of the DFN-constrained fracture network. Incorporating σ explicitly ensures that the matrix contribution to flow is quantitatively represented and that the simulation results are reproducible.
After constructing the stochastic model for medium–small scale fractures and the deterministic model for large-scale fractures, the two were superimposed to obtain a multi-scale fracture model for the Bozi-1 gas reservoir. The medium- and small-scale fracture networks were generated using a systematic approach that integrates well log fracture indicators (image logs, gamma-ray logs) and core fracture observations with geostatistical simulation techniques. Fracture occurrence probabilities were first derived from well-based measurements and then spatially propagated using sequential indicator simulation constrained by the reservoir’s structural and sedimentary frameworks. Fracture orientation distributions were informed by in situ observations from cores and outcrop fracture traces, ensuring that the modeled fractures accurately reflect the dominant directions and heterogeneity observed in the field. This methodology allows the small- and medium-scale fracture network to capture both local variability and the broader structural control.
To quantify the reliability of the medium- and small-scale fracture network, the misclassification probability was assessed by comparing simulated fractures with well-log-derived indicators and core observations. The overall misclassification probability is 11.4% ± 3.2%, reflecting uncertainties primarily in areas with sparse well coverage. Incorporating this metric allows the fracture model to explicitly represent uncertainty in fracture identification, enhancing the robustness and interpretability of the multi-scale fracture model.
Figure 6 compares single-well imaging log interpretations with effective fractures inverted from Stoneley wave data, confirming the accuracy and reliability of Stoneley wave inversion for fracture identification. Figure 7 presents the established medium- and small-scale fracture network, revealing the spatial variations in fracture density and dominant orientation across different structural units.
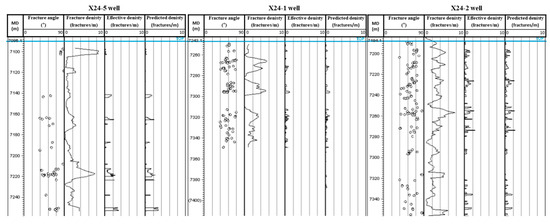
Figure 6.
Comparison between fracture interpretation from single-well imaging logs and effective fractures inverted by Stoneley wave.
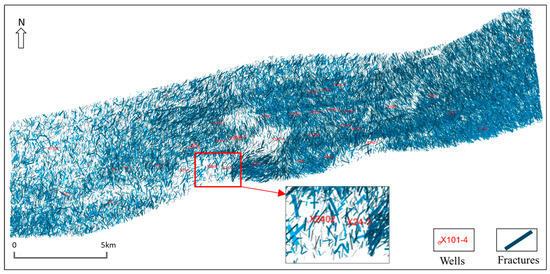
Figure 7.
Model of medium- and small-scale fractures.
Together, Figure 6 and Figure 7 demonstrate the robustness of the proposed multi-scale fracture modeling workflow. The resulting integrated fracture model provides a solid foundation for constructing equivalent fracture property models and conducting reservoir numerical simulations, thereby supporting optimal well placement and efficient reservoir development strategies.
5. Validation and Application of the Model
The model validation is primarily carried out through geological understanding and production data. First, it is necessary to verify whether the predicted fractures at different scales are consistent with observed core data, imaging logs, micro-scale analyses, and geological knowledge. This aspect has already been addressed in the fracture modeling section, where the consistency of the fracture models with collected geological and logging data was demonstrated. Second, the model predictions are validated against production dynamics and single-well productivity.
5.1. Productivity Characteristics
The tight reservoirs of Bozi 1 Gas Reservoir have poor matrix properties. Large-scale fractures act as the “main conduits” for hydrocarbon migration, controlling the upper limit and macroscopic distribution of productivity. Small- and medium-scale fractures form a “secondary network” that connects the matrix to the large-scale fractures, extending the drainage area. Together, they create a “trunk-branch” efficient flow system that directly determines the productivity of individual wells.
The non-restricted flow rate serves as a direct indicator of reservoir productivity, reflecting the overall flow capacity of the system. Statistical analysis demonstrates that the temporal and spatial variation trends of the non-restricted flow rate closely correspond to those of the equivalent effective fracture density. In this study, the effective fracture density was systematically derived through an integrated workflow combining well log interpretation, core fracture characterization, and Stoneley wave inversion. Initially, fractures identified from image logs and core observations were classified according to orientation, aperture, and connectivity. Subsequently, Stoneley wave data were inverted to quantify fracture-induced variations in acoustic velocity, which were calibrated against the directly observed fractures. Finally, a probabilistic integration was performed across all wells to compute the equivalent effective fracture density, accounting for both fracture intensity and connectivity within each structural unit. This methodology ensures that the resulting fracture density represents fractures that actively contribute to fluid flow, thereby providing a more accurate characterization of reservoir productivity.
Figure 8 shows the relationship between single-well effective fracture density and productivity within fault blocks of the Bozi 1 Gas Reservoir. Wells located in zones with higher predicted effective fracture density exhibit correspondingly higher non-restricted flow rates, confirming the model’s capacity to accurately capture the fracture–productivity relationship. Notably, wells in the X101–105, X102–106, and X104 fault blocks display significantly greater productivity than those in the X1–24 fault block, consistent with the spatial distribution of effective fractures predicted by the multi-scale fracture model.
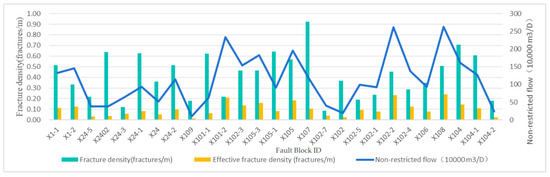
Figure 8.
Single-well effective fracture density and productivity across fault blocks in the Bozi 1 Gas Reservoir.
5.2. Water Invasion Characteristics
Once the reservoir encounters water, water production behavior serves as the most direct dynamic evidence of fracture flow channels. Among the 36 drilled wells in the study area, 10 wells have encountered water, mainly located in the X104 and X1–24 fault blocks. In this study, the water production dynamics of each well were compared with the spatial distribution of high-conductivity fracture zones predicted by the model.
The X104 fault block is largely water-saturated. Wells X104-2, X104-1, and X104 successively encountered water, and their water-producing capacity is strong, indicating fracture-network-controlled water invasion, consistent with the model where fractures are densely developed.
In the X1–24 fault block (Figure 9), the water production status of 11 wells shows significant differences. Five wells have encountered water, while six wells remain dry, reflecting a severe water invasion situation. In the eastern low area, well X109 encountered water during testing, showing chloride anomalies (>100,000 mg/L) and a large, stable water production rate, which is interpreted as formation water. In the central structural waist, well X24 first encountered a south-dipping fault that communicated with a confined southern water body, causing it to encounter water initially. Subsequently, formation water propagated along the east–west-trending fracture to adjacent wells, leading to X24-2 encountering water. Its production pressure drop was significant, and daily water production increased sharply, demonstrating typical fracture-dominated water channeling; the well is located in the model’s dense small- and medium-scale fracture zone.
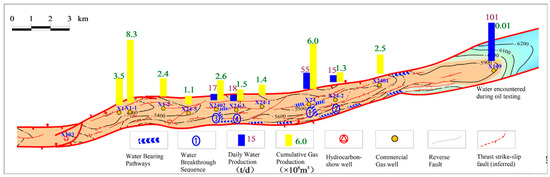
Figure 9.
Water-Bearing Pathways and Historical Reservoir Pressure Profiles in the X1–24 Fault Block.
Well X24-02 has surrounding fractures of lower effectiveness, but due to early production and large pressure difference, edge water moved along north–south fractures to the wellbore, causing water breakthrough. Formation water subsequently advanced along faults, leading to X24-3 encountering water (Figure 9). Conversely, wells X24-01 (structural low) and X24-5 (structural high) maintain higher pressures and have not yet encountered water. The model indicates these wells are situated in relatively isolated matrix blocks with underdeveloped surrounding effective fractures, isolated from major fracture flow channels.
5.3. Wellbore Loss Characteristics
Wellbore losses during drilling in ultra-deep tight sandstone reservoirs are often directly associated with high-permeability fracture zones. The correlation between loss intervals, loss volumes, and fracture-intensive zones predicted by the model provides a key basis for validating the fracture model. The location and intensity of the losses reflect the openness and scale of subsurface fractures.
For the Bozi 1 gas reservoir, drilling loss data from 36 wells indicate that 14 wells experienced losses in intervals coinciding with large-scale fractures and zones of high effective fracture density (effective fracture density > 0.5 fractures/m), yielding a matching rate of 84.2% (Table 2).
Table 2.
Relationship between Wellbore Losses and Effective Fracture Density.
To further quantify the relationship between wellbore losses and fracture characteristics, we performed regression analysis between measured loss volumes and effective fracture apertures predicted by the model. A linear regression yields:
Indicating a strong correlation between fracture aperture and drilling loss severity. Outliers, such as X105-3 with 198.5 m3 lost at 7734.09 m depth, correspond to unusually large-aperture fractures identified in FMI/core logs.
Uncertainty in predicted loss volumes was quantified using 95% confidence intervals, illustrated as error bars in Figure 9, which demonstrate that most observed losses fall within the predicted uncertainty bounds. This analysis reinforces the robustness of the fracture model and validates its predictive capability for wellbore loss behavior.
For example, X24-2 well experienced severe losses (119.5 m3/h) at 7268.10 m depth, corresponding precisely with a near-EW oriented large-scale fracture predicted by the model. Conversely, the 22 wells without losses avoided areas of high fracture density (effective fracture density < 0.5 fractures/m), and imaging logs confirmed no large open fractures in these intervals.
To benchmark the performance of the proposed multi-scale fracture modeling workflow, a comparative experiment was conducted against conventional deterministic DFN modeling. The conventional DFN model constructs large-scale fractures as planar polygons without adaptive sampling or segmented splicing, and medium-scale fractures are generated using standard stochastic simulation. The predicted fracture densities, orientations, and connectivity from both approaches were compared with single-well FMI/core data, non-restricted flow rates, and water-invasion behavior. Results show that the proposed workflow achieves R2 = 0.92 for fracture density prediction (vs. 0.81 for conventional DFN), and the water-invasion match rate improves from 72% to 84.2%. In particular, the proposed workflow better captures curved large-scale fractures and heterogeneous medium-scale fracture distributions, confirming its superior predictive capability for reservoir productivity and fracture connectivity.
It is important to note that the seismic dataset used in this study consists of conventional post-stack volumes with limited azimuthal coverage. Consequently, both vertical and horizontal resolution are restricted, which imposes inherent limitations on fracture characterization. The vertical resolution, primarily controlled by dominant frequency and seismic wavelength, limits the detection of thin fracture zones or closely spaced small- and medium-scale fractures. The horizontal resolution, determined by bin size, trace spacing, and migration aperture, constrains the ability to resolve fine-scale lateral variations and closely spaced fracture segments. As a result, independent anisotropy-based validation—such as amplitude-versus-offset/azimuth (AVO/AVAz) or velocity-versus-azimuth (VVAz) analysis—could not be performed. The absence of wide-azimuth prestack data restricts direct confirmation of fracture orientations through seismic diagnostics. Therefore, the validation framework relies primarily on geological observations, logging evidence, well productivity behavior, water-invasion patterns, and drilling-loss data. While this multi-disciplinary approach provides robust indirect support, the limited vertical and horizontal resolution should be considered when interpreting the fracture distribution and orientation results.
6. Conclusions
This study presents a multi-scale fracture characterization and modeling framework for ultra-deep tight sandstone reservoirs, integrating large-scale complex fractures with medium–small-scale effective fractures. By combining adaptive extraction and segmented stitching of large fractures with single-well Stoneley wave inversion and seismic machine learning for medium–small fractures, a full-field 3D fracture network model was constructed. The results reveal fracture development mechanisms across scales, and the proposed “multi-scale characterization–machine learning” workflow provides a systematic methodology for accurate fracture description. The DFN model is validated statically/kinematically and represents a framework ready for dynamic simulation.
While this study establishes a robust multi-scale fracture characterization and modeling framework, limitations remain in seismic resolution and dynamic validation. Future research will focus on enhancing fracture detectability through pre-stack anisotropy inversion and high-density seismic acquisition, improving uncertainty quantification with machine learning, and validating model transferability across structural domains. Moreover, a forward–inverse coupled simulation framework will be developed to dynamically integrate fracture evolution, flow response, and production optimization.
Author Contributions
Conceptualization, L.D. and X.R.; methodology, L.D., X.R., C.Z., Y.Q., B.S., X.W. and W.T.; writing—original draft preparation, L.D., X.R., C.Z., Y.Q., B.S., X.W. and W.T.; writing—review and editing, L.D., X.R., C.Z., Y.Q., B.S., X.W. and W.T.; visualization, L.D.; supervision, X.R.; project administration, L.D. All authors have read and agreed to the published version of the manuscript.
Funding
This research was funded by the National key R&D Program of China, grant number 2022YFF0801202 and China National Petroleum Corporation Limited Science and Technology Project, grant number 2023ZZ14YJ03.
Data Availability Statement
The original contributions presented in this study are included in the article. Further inquiries can be directed to the corresponding author.
Acknowledgments
The authors have reviewed and edited the output and take full responsibility for the content of this publication.
Conflicts of Interest
Authors Li Dai, Xingnan Ren, Chengze Zhang, Yuanji Qu, Binghui Song, Xiaoyan Wang were employed by the company Tarim Oilfield Company, PetroChina. Authors Li Dai, Xingnan Ren, Yuanji Qu, Binghui Song, Xiaoyan Wang were employed by the company R&D Center for Ultra-Deep Complex Reservoir Exploration and Development, CNPC. The remaining authors declare that the research was conducted in the absence of any commercial or financial relationships that could be construed as a potential conflict of interest. The companies had no role in the design of the study; in the collection, analyses, or interpretation of data; in the writing of the manuscript, or in the decision to publish the results.
References
- Song, T.; Zheng, M.; Huang, F.X.; Ouyang, J.; Li, M.; Zeng, F.; Fan, J.; Liu, C.; Liu, H. Exploration progress and potential of oil and gas in deep–ultradeep clastic rocks of PetroChina. Mar. Orig. Pet. Geol. 2024, 29, 225–235. [Google Scholar] [CrossRef]
- Tian, J.; Wang, Q.H.; Yang, H.J.; Li, Y. Petroleum exploration history and enlightenment in Tarim Basin. Xinjiang Pet. Geol. 2021, 42, 272–282. [Google Scholar] [CrossRef]
- Wang, Q.; Ye, M.N.; Li, N.; Li, N.; Ye, Y.; Dong, J. Research progress of numerical simulation models for shale gas reservoirs. Geol. China 2019, 46, 1284–1299. [Google Scholar]
- Xia, H.B.; Han, K.N.; Song, W.H.; Wang, W.; Yao, J. Pore scale fracturing fluid occurrence mechanisms in multi-scale matrix-fracture system of shale gas reservoir. Reserv. Eval. Dev. 2023, 13, 627–635+685. [Google Scholar] [CrossRef]
- Wu, F.; Chen, X.W.; Zhao, H.; Shi, X.; Liu, J. Computed tomography and image processing based multi-scale fracture extraction method for core samples. Pet. Geol. Exp. 2025, 47, 882–894. [Google Scholar]
- Wang, K.; Zhang, R.H.; Zhao, J.L.; Wang, J.; Zeng, Q.; Huang, Q.; Zhang, Z.; Zhou, L. Influence of strike-slip activity in the Kelasu structural belt on tectonic fractures in Kuqa Depression, Tarim Basin. Nat. Gas Geosci. 2023, 34, 1316–1327. [Google Scholar]
- Chen, D.; Wang, C.L.; Deng, H.C.; Chen, N.; Ding, H.; Hu, X.; Zhang, H.; Yang, Y.; Du, Y.; Gao, Y. Evaluation of characteristics, distribution, and production control of advantageous natural fractures in ultra-deep layers: A case study of the Lower Cretaceous tight sandstone in the Bozi-Dabei area of the Tarim Basin. Nat. Gas Geosci. 2025, 36, 479–492. [Google Scholar] [CrossRef]
- Lv, W.Y.; Zeng, L.B.; Chen, S.Q.; Lv, P.; Dong, S.; Hui, C.; Li, R.; Wang, H. Characterization methods of multi-scale natural fractures in tight and low-permeability sandstone reservoirs. Geol. Rev. 2021, 67, 543–556. [Google Scholar] [CrossRef]
- Dong, S.Q.; Lv, W.Y.; Xia, D.L.; Wang, S.; Du, X.; Wang, T.; Wu, Y.; Guan, C. An approach to 3D geological modeling of multi-scaled fractures in tight sandstone reservoirs. Oil Gas Geol. 2020, 41, 627–637. [Google Scholar]
- Liang, Z.Q. Prediction techniques and application for fractures of multi-scales. J. Shengli Coll. China Univ. Pet. 2022, 36, 33–38. [Google Scholar]
- Liu, J.F.; Wang, P.; Mao, Q.H.; Gui, Z. Comparison of reservoir fracture modelling methods based on fracture scales. Prog. Geophys. 2023, 38, 2071–2079. [Google Scholar]
- Dong, S.Q.; Zeng, L.B.; Cao, H.; Xu, C.; Wang, S. Principle and implementation of discrete fracture network modeling controlled by fracture density. Geol. Rev. 2018, 64, 1302–1314. [Google Scholar] [CrossRef]
- Ren, X.J.; Duan, Y.X.; Sun, Q.F. Convolutional neural network model for faults identification based on 3D seismic imaging. Comput. Digit. Eng. 2022, 50, 1998–2004. [Google Scholar]
- Guo, H.H.; Feng, J.W.; Zhao, L.B. Characteristics of passive strike-slip structure and its control effect on fracture development in Bozi-Dabei area, Tarim Basin. Oil Gas Geol. 2023, 44, 962–975. [Google Scholar]
- Wang, Z.M.; Wang, C.L.; Xu, K.; Zhang, H.; Chen, N.; Deng, H.; Hu, X.; Yang, Y.; Feng, X.; Du, Y.; et al. Characteristics and controlling factors of tectonic fractures of ultra-deep tight sandstone: A case study of the Lower Cretaceous reservoir in Bozi-Dabei area, Kuqa Depression, Tarim Basin. Nat. Gas Geosci. 2023, 34, 1535–1551. [Google Scholar]
- Gong, X. Study on Structural Characteristics of Bozi-Dabei Section in Kelasu Structural Belt, Kuqa Depression [Dissertation]. Master’s Thesis, Xi’an Shiyou University, Xi’an, China, 2022. [Google Scholar]
- Cai, Z.Z.; Wang, J.; Mo, T.; Li, Z.; Wang, C.; Sun, X.; Zhu, W.; Ding, H. Characteristics and diagenesis evolution of ultra-deep Bashijiqike Formation reservoir in Bozi section of Kelasu structural belt, Kuqa Depression. Unconv. Oil Gas 2024, 11, 8–16. [Google Scholar]
- Jiang, X.J.; Shi, L.L.; Mo, T.; Yang, H.; Du, H.; Shi, W.; Dong, G. Characteristics and causes of physical property differences of deep and ultradeep tight sandstone reservoirs: A case study of the Bashijiqike Formation in the Bozi area of the Kuqa Depression. Bull. Geol. Sci. Technol. 2025, 44, 151–164. [Google Scholar]
- Wang, S.Y.; Wang, J.; Li, Y.; Wang, A.; Chen, M.; Liu, K. Evolution of petrophysical properties and coupled hydraulic–mechanical modelling for fault-related anticline reservoirs: Example from Cretaceous reservoirs in the Kelasu structural belt, Kuqa Depression. J. Northeast Pet. Univ. 2025, 49, 30–45. [Google Scholar]
- Yang, H.J.; Shi, W.Z.; Du, H.; Shai, L.; Wang, X.; Dong, G.; Mo, T.; Zuo, T.; Xu, L.; Jiang, J. Hydrocarbon charging periods and maturities in Bozi-Dabei area of Kuqa Depression and their indications to the structural trap sequence. Acta Pet. Sin. 2024, 45, 1480–1491. [Google Scholar]
- Zhang, G.J.; Zhang, B.X.; Xu, K.; Shen, C.; Zhang, H.; Yin, G.; Wang, H.; Wang, Z.; Liu, J. Fracture characteristics of ultra-deep tight sandstone reservoirs in the Bozi Block, Kuqa Depression of Tarim Basin, and effects on oil-gas production. Bull. Geol. Sci. Technol. 2024, 43, 75–86. [Google Scholar]
- Xu, X.T.; Zeng, L.B.; Dong, S.Q.; Diwu, P.; Li, H.; Liu, J.; Han, G.; Xu, H.; Ji, C. Fracture development characteristics and their influence on water invasion of ultra-deep tight sandstone reservoirs in Keshen gas reservoir of Kuqa Depression, Tarim Basin. Pet. Geol. Exp. 2024, 46, 812–822. [Google Scholar]
- Xu, K.; Zhang, H.; Ju, W.; Yin, G.; Wang, H.; Wang, Z.; Wang, Z.; Li, C.; Yuan, F.; Zhao, W. Distribution patterns of effective fractures in ultra-deep reservoirs of Bozi X Block, Kuqa Depression, and their effects on natural gas production. Earth Sci. 2023, 48, 2489–2505. [Google Scholar]
- Li, F.; Lyu, B.; Qi, J.; Verma, S.; Zhang, B. Seismic Coherence for Discontinuity Interpretation. Surv. Geophys. 2021, 42, 1229–1280. [Google Scholar] [CrossRef]
- Zeng, L.B.; Lv, P.; Qu, X.F.; Fan, J. Multi-scale fractures in tight sandstone reservoirs with low permeability and geological conditions of their development. Oil Gas Geol. 2020, 41, 449–454. [Google Scholar]
- Blasingame, T.A. The Characteristic Flow Behavior of Low-Permeability Reservoir Systems. In Proceedings of the SPE Unconventional Reservoirs Conference, Keystone, CO, USA, 10–12 February 2008. [Google Scholar] [CrossRef]
- Yang, B.; Zhang, C.G.; Cai, M.; Gan, Q.; Cai, D.; Zhu, L. Research on evaluation method of fracture permeability based on Stoneley wave energy attenuation. Prog. Geophys. 2019, 34, 1127–1131. [Google Scholar]
- Lu, H.; Lu, X.S.; Fan, J.J.; Wang, X.; Fu, X.; Wei, H.; Zhang, B. The controlling effects of fractures on gas accumulation and production in tight sandstone: A case of Jurassic Dibei gas reservoir in the East Kuqa Foreland Basin. Nat. Gas Geosci. 2015, 26, 1047–1056. [Google Scholar]
- Hu, S.Y.; Liu, H. Analysis on water invasion patterns and sensitivity of drainage parameters in fractured gas reservoirs with edge/bottom water. Xinjiang Pet. Geol. 2025, 46, 478–484. [Google Scholar]
- Yin, T.; Chen, Q. Simulation-based investigation on the accuracy of discrete fracture network (DFN) representation. Comput. Geotech. 2020, 121, 103487. [Google Scholar] [CrossRef]
- Luo, Q.; Tang, H.F.; Liu, Q.M.; Yin, Y.; Wang, L.; Shang, H. Multi-scale fracture modeling method and its application: A case study of tight sandstone reservoir in Keshen 2 Gas Field, Tarim Basin. Nat. Gas Geosci. 2024, 35, 1000–1013. [Google Scholar]
- Banerjee, A.; Chatterjee, R. Fracture analysis using Stoneley waves in a coalbed methane reservoir. Near Surf. Geophys. 2022, 20, 710–722. [Google Scholar] [CrossRef]
- Hornby, B.E.; Johnson, D.L.; Winkler, K.W.; Plumb, R.A. Fracture evaluation using reflected Stoneley-wave arrivals. Geophysics 1989, 54, 1274–1288. [Google Scholar] [CrossRef]


Disclaimer/Publisher’s Note: The statements, opinions and data contained in all publications are solely those of the individual author(s) and contributor(s) and not of MDPI and/or the editor(s). MDPI and/or the editor(s) disclaim responsibility for any injury to people or property resulting from any ideas, methods, instructions or products referred to in the content. |
© 2025 by the authors. Licensee MDPI, Basel, Switzerland. This article is an open access article distributed under the terms and conditions of the Creative Commons Attribution (CC BY) license (https://creativecommons.org/licenses/by/4.0/).