Abstract
This study aimed to enhance the extraction efficiency and elucidate the mechanism of ultrasound-assisted extraction (UAE) of taxanes from Taxus chinensis by natural deep eutectic solvents (NADES). The processes of kinetics and thermodynamics were systematically investigated. These extractions adhered to a pseudo-second-order kinetic model (R2 > 0.972), with intraparticle diffusion identified as the dominant mechanism. Key parameters such as temperature, ultrasonic power, and solid/liquid ratio significantly improved the effective diffusion coefficient (De) and mass transfer coefficient (KT), reaching values of 6.21 × 10⁻⁹ m2/s and 4.14 × 10⁻³ m/s, respectively. A high Biot number (Bi > 59.21) confirmed that internal diffusion is the rate-determining step. Thermodynamic analysis indicated that the process is endothermic (ΔH > 0), irreversible (ΔS > 0), and spontaneous (ΔG < 0). These results elucidate the underlying mechanisms of UAE and establish a foundational framework for its industrial-scale implementation.
1. Introduction
Taxanes, a class of diterpenoid compounds originally derived from the bark of Taxus chinensis, have become important natural anticancer agents in clinical practice for treating various malignancies such as ovarian and breast cancers due to their broad-spectrum antitumor activity, significant therapeutic efficacy, and favorable safety profile [1,2]. In our previous study, the experimental conditions and process parameters for extracting taxanes from Taxus chinensis by ultrasound-assisted extraction (UAE) with natural deep eutectic solvents (NADES) were optimized [3]. However, existing research has primarily focused on the empirical optimization of process conditions. At the same time, a systematic understanding of the intrinsic kinetic mechanisms and thermodynamic characteristics of this extraction system remains limited. Key questions, particularly concerning interfacial solute transfer rates, diffusion control mechanisms, energy changes during extraction, and spontaneity, still require in-depth elucidation [4,5,6,7,8].
In the development of natural product extraction technologies, kinetic and thermodynamic analyses have become indispensable tools for process design and optimization [9]. Kinetic models of pseudo-first-order, pseudo-second-order, and intraparticle diffusion can effectively investigate how the extraction rate is influenced by the time, revealing the mass transfer control mechanisms [10]. In Nie’s study [11], using brown seaweed Sargassum as the raw material, different green solvents were employed for ultrasonic-assisted extraction. An optimal model for the second-order kinetic parameters was successfully established to describe the dynamic ultrasonic extraction process under different operating conditions. The application of Fick’s diffusion laws provides a theoretical framework for quantifying the effective diffusion coefficient (De), mass transfer coefficient (KT), and Biot number (Bi), aiding in the identification of rate-limiting steps. To enhance the extraction process, the feasibility of UAE for obtaining phenolic antioxidants from Moringa oleifera leaves was examined by Albarri’s study. This assessment was based on a detailed study of the underlying kinetics, thermodynamics, mass transfer, and effective diffusion mechanisms [12]. Meanwhile, thermodynamic parameters of Gibbs free energy change (ΔG), enthalpy change (ΔH), and entropy change (ΔS) quantify the spontaneity, heat transfer, and molecular disorder of a process, thereby providing critical insights for assessing its feasibility and energy efficiency. Furthermore, the activation energy (Ea) was quantified to assess the process feasibility and intrinsic nature.
Based on this foundation, the current research systematically investigated the effects of extraction temperature, ultrasonic power, with solid/liquid ratios to establish the optimal process conditions for maximizing taxane yield. Kinetic models and Fick’s laws were comprehensively applied to analyze the kinetic behavior and diffusion mechanisms. Furthermore, thermodynamic parameters (ΔG, ΔH, ΔS) and activation energy (Ea) were determined to assess the spontaneity, energy requirements, and underlying mechanisms of the process. Finally, high-performance liquid chromatography (HPLC) was applied to the analysis of target taxane compounds.
Meanwhile, this study represents the first integrated kinetic and thermodynamic analysis of the taxane extraction process using a NADES-UAE system. The findings not only provide a theoretical foundation for understanding the mechanisms of this green extraction technology, but also establish a technical basis for developing efficient and sustainable production processes for taxanes.
2. Materials and Methods
2.1. Materials
Newly picked branches and leaves of Taxus chinensis were obtained from the plantation at Hanjiang Normal University (Hubei, China). The plant material was cut into segments about 2 cm in length and dried in a thermostatic oven (DHG-9030A, Shanghai Yiheng Scientific Instrument Co., Ltd., Shanghai, China) with 6 h at 60 °C [13]. The dried sample was then pulverized to a fine powder (180 μm) using a grinder (FW100, Yongkang, China) and stored in an airtight container at room temperature. Chromatographic-grade methanol was supplied by Tedia Company (Tedia Way, Fairfield, OH, USA), while analytical-grade ethanol was acquired from a supplier in Shanghai, China.
Choline chloride (ChCl, 98%) and malic acid (Ma, 98%) were procured from Yuanye Bio-Technology Company (Shanghai, China). Taxane standards, including 10-deacetylbaccatin III (10-DAB III, 98%), baccatin III (98%), 7-xylosyl-10-deacetyltaxol (DXT, 99.65%), 10-deacetyltaxol (10-DAT, 98%), paclitaxel (98%), and cephalomannine (98%), were obtained from Anagei Pharmaceutical Chemical Co., Ltd. (Shanghai, China). Deionized water was manufactured by Wahaha Company (Hangzhou, China).
2.2. Extraction Procedures
UAE was performed using the following optimized procedure: precisely 0.35 g powder of Taxus chinensis was transferred into a conical flask and mixed with 7 mL of NADES solution composed of ChCl/Ma (1:1, v/v). The mixture was subjected to UAE in an ultrasonic bath (Model SCQ-7201C, Shanghai Shengyan Ultrasonic Instrument Co., Ltd., Shanghai, China) under fixed conditions: ultrasonic power of 240 W, solid/liquid ratios of 1:20 g/mL, and extraction temperature of 40 °C. These parameters were selected based on the methodology established by Guo et al. [3], which demonstrated high taxane extraction efficiency.
At fixed time intervals, 20 µL of the solution was taken out, and a high-speed centrifuge (Model TDZ5-WS, Xiangyi Laboratory Instrument Development Co., Ltd., Changsha, China) was used to process these extract solutions for 10 min. Absorbance of the diluted extract taxanes was quantified with an ultraviolet–visible spectrophotometer at 227 nm (UV–Vis, Model 7200, Shanghai Meipuda Instrument Co., Ltd., Shanghai, China). The measured absorbance against the standard curve determined the yield of taxanes. T. chinensis powder samples were extracted under UAE at different temperatures (20, 30, 40, and 50 °C), ultrasound powers (160, 200, 240, and 280 W), and solid/liquid ratios (1:10, 1:15, 1:20, and 1:25 g/mL). For each parameter value investigated, extraction time was changed continuously (10, 15, 20, 25, 30, 40, 50, and 60 min). When changing one extraction condition, the other conditions remained fixed.
2.3. HPLC Analysis of Taxanes
The yields of individual taxanes in the extracts were determined using HPLC (UltiMate 3000 Separations Module, Hangzhou Puyu Technology Development Co., Ltd., Hangzhou, China) under the technique presented by Loganathan et al. [14].
Separation was achieved using an Inertsil ODS-3 C18 column (250 mm × 4.6 mm, 5 μm, Shanghai Chuding Analytical Instrument Co., Ltd., Shanghai, China), which was maintained at 30 °C, with a mobile phase of water (A, 30%) and methanol (B, 70%). A gradient elution program was used under the following conditions: injection volume of 10 μL, flow rate of 0.8 mL/min, and detection wavelength of 227 nm.
Standard curves were established using six taxane reference compounds (10-DAB III, baccatin III, 10-DAT, DXT, cephalomannine, and paclitaxel). Each standard (10 mg) was dissolved in 10 mL of methanol and subsequently diluted to concentrations of 1.25, 6.25, 12.5, 22.5, and 125 μg/mL [15]. HPLC analysis at 227 nm enabled the construction of calibration curves by plotting peak areas against corresponding concentrations. The concentration of each taxane in the samples was determined using these curves, and the total taxane yield calculation was given by the following Equation (1):
where C (μg/mL) represents the concentration of the six major taxanes, V (mL) denotes the volume of the extraction solution, and W (g) corresponds to the mass of the Taxus chinensis powder.
Taxane yields (μg/g) = C × V/W
2.4. Establish the Standard Curve of Paclitaxel
A series of standard paclitaxel solutions (5, 10, 20, 40, 60, 80, and 100 μg/mL) was prepared in methanol [16]. A calibration curve for paclitaxel was established by measuring the absorbance of standard solutions at 227 nm using a UV–Vis spectrophotometer from Shanghai Meipuda Instrument Co., Ltd. (Shanghai, China), with concentration plotted on the x-axis and absorbance on the y-axis [17,18,19]. The extracted taxane yield (mg/g) from Taxus chinensis was derived from the established standard curve.
2.5. Kinetic Model
In extraction studies, the application of mathematical models to experimental data is essential for analyzing kinetic behavior. This investigation employed three kinetic models: the pseudo-first-order (Equation (2), Table 1) [20], the pseudo-second-order (Equation (3), Table 1) [21,22], and the intraparticle diffusion (Equation (4), Table 1) [23]. Mass transfer parameters were further characterized by determining the effective diffusion coefficient (De) and mass transfer coefficient (KT) using Fick’s first and second laws (Equations (5) and (6), Table 1) [12,24]. Additionally, the Biot number (Bi) was used to assess the relative magnitudes of the external and internal resistances to mass transfer (Equation (7), Table 1) [25].

Table 1.
Equations for parameter estimation.
Table 1 presents the equations employed in parameter estimation in this study. The goodness of fit of each model was quantitatively evaluated using the coefficient of determination (R2), root mean square deviation (RMSD, Equation (8)), residual sum of squares (RSS, Equation (12)), and Akaike information criterion (AIC, Equation (13)) [26]. Higher R2 values, lower RMSD values, and lower RSS [27] indicate better consistency between model predictions and experimental data. When comparing multiple models, a smaller AIC value indicates a better balance between goodness of fit and model simplicity [28].
2.6. Activation Energy and Thermodynamic Parameters
Activation energy (Ea), derived from the Arrhenius equation (Equation (9), Table 1), was complemented by a thermodynamic analysis (ΔH, ΔS, ΔG) to elucidate the energy landscape and spontaneity of the extraction [29]. This assessment provides critical insights into the endothermic or exothermic nature of the process and the energy input required for optimal performance [30].
From the Van’t Hoff equation (Equation (10), Table 1) [31,32], the standard enthalpy and entropy changes were derived; these figures were then applied to calculate the standard Gibbs free energy [32]. This thermodynamic profiling enables a comprehensive understanding of the energy dynamics and feasibility of the taxane extraction process.
3. Results and Discussion
3.1. HPLC Analysis
As shown in Figure 1a,b, six major taxane compounds were successfully identified and separated: 10-deacetylbaccatin III (10-DAB III, peak 1), baccatin III (peak 2), 10-deacetyltaxol (10-DAT, peak 3), 7-xylosyl-10-deacetyltaxol (DXT, peak 4), cephalomannine (peak 5), and paclitaxel (peak 6). These analyses were conducted at the detection wavelength of 227 nm.
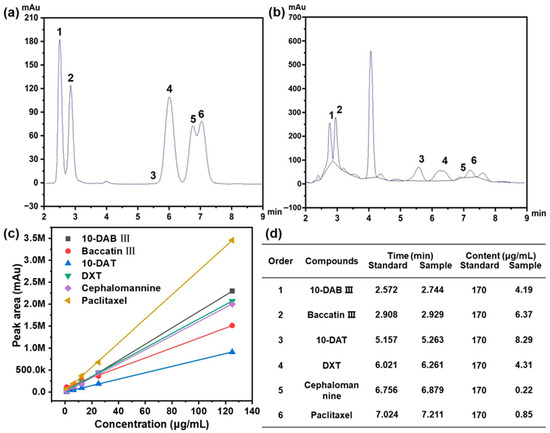
Figure 1.
(a) HPLC analysis for six kinds of taxane standards with order of 1 to 6; (b) HPLC analysis for real sample of extraction with order of 1 to 6; (c) the standard curve for six kinds of taxanes characterized by HPLC; (d) retention time and content for six kinds of taxanes with order of 1 to 6.
The concentration of each taxane in the extracts was quantified by respective standard calibration curves (Figure 1c), with regression equations established for accurate determination (Figure 1d). As summarized in Table 2, the elution order reflected the polarity differences among these compounds. 10-DAB III, possessing the highest polarity, eluted first, followed by baccatin III, which has a similar molecular weight to 10-DAB III. 10-DAT possesses a molecular weight inferior to that of DXT, and the peak in HPLC was observed earlier than that of DXT.
Table 2.
Quantification parameters and standard curve of the six taxane compounds with order of 1 to 6 validated by HPLC.
The chromatographic separation behavior was consistent with the chemical structures: paclitaxel, containing the fewest polar functional groups, exhibited the longest retention time, while cephalomannine, with a relatively higher polarity, eluted earlier. The developed HPLC method demonstrated excellent reliability and achieved baseline separation of all six taxanes with satisfactory resolution, confirming its suitability for accurate quantification of these compounds in complex extracts.
3.2. Analysis of Extraction Kinetics
To enhance the extraction efficiency of taxanes from Taxus chinensis, a systematic investigation was conducted to evaluate the effects of extraction temperature, ultrasonic power, and solid/liquid ratio.
As presented in Figure 2a, the taxane yield substantially increased as the temperature rose from 20 to 40 °C, which can be attributed to enhanced molecular kinetic energy facilitating the solid–liquid mass transfer of taxanes. However, elevating the temperature further to 50 °C caused a decline in yield, the likely explanation being thermal degradation processes such as oxidation or the structural decomposition of taxanes [33].
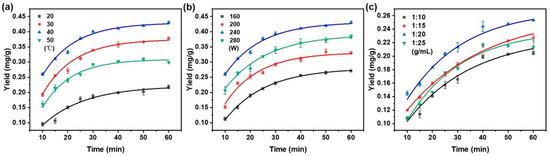
Figure 2.
Effect of (a) extraction temperature; (b) ultrasonic power; and (c) solid/liquid ratio on taxanes yield with the increasing extraction time. When changing one extraction condition, the other conditions remained fixed with extraction temperature (40 °C), ultrasonic power (240 W), and solid/liquid ratio (1:20 g/mL).
It is indicated that raising the ultrasonic power from 160 W to 240 W significantly enhanced the extraction yield of taxanes (Figure 2b). This enhancement is ascribed to intensified cavitation effects and mechanical vibrations, which promote solvent penetration and disrupt plant cell walls [34]. Beyond 240 W, the yield decreased, possibly due to structural damage or degradation of the target compounds by excessive ultrasonic energy [35].
Figure 2c illustrates that the extraction yield of taxanes increased significantly as the solid/liquid ratio varied from 1:10 to 1:20 g/mL. This enhancement can be attributed to improving the solute-to-solvent contact between taxanes and NADES, which promoted the solubilization of paclitaxel [36]. By increasing the solvent volume, paclitaxel extraction was enhanced by a more significant solute–solvent concentration gradient, promoting greater diffusion and extraction efficiency [37,38]. A decline in extraction yield was observed at a solid/liquid ratio of 1:25 g/mL. The lower concentration of taxanes per unit volume of solvent ultimately reduces the overall extraction yield.
In summary, Figure 2 delineates the influence of key operational parameters on the extraction efficiency of taxanes from Taxus chinensis. Using the optimized conditions for an extraction temperature of 40 °C, ultrasonic power of 240 W, and a solid/liquid ratio of 1:20 g/mL, the highest yield of taxanes was achieved. As the extraction time progressed, the extraction rate gradually decreased, reaching equilibrium at 40 min, indicating stabilizing extraction efficiency after 40 min [39]. These findings offer valuable theoretical insights and practical guidance for the scaling and optimization of industrial extraction processes.
The experimental data for the UAE of taxanes from Taxus chinensis were analyzed with pseudo-first-order and pseudo-second-order kinetic models. The applicability of each model was evaluated based on R2, RMSD, RSS, and AIC. Higher R2 and lower RMSD and RSS values indicated a better fit with the experimental data. A smaller AIC value indicated a better balance between goodness of fit and model simplicity.
As illustrated in Figure 3, the kinetic behavior under varying extraction temperature, ultrasonic power, and solid/liquid ratio was plotted according to the pseudo-first-order model as ln(Ce − Ct) vs. time. Correspondingly, Figure 4 shows the same set of conditions represented in the form of t/Ct vs. time for the pseudo-second-order model. The kinetic parameters, including k1, k2, and Ce were derived from the slopes and intercepts of the respective linear regressions.
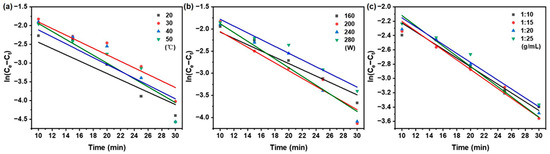
Figure 3.
Pseudo-first-order kinetics model of taxanes from Taxus chinensis in UAE extract for (a) extraction temperature; (b) ultrasonic power; (c) solid/liquid ratio.
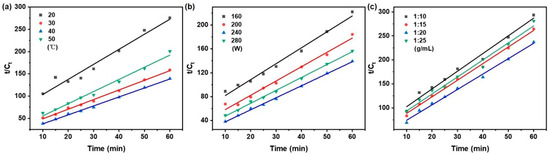
Figure 4.
Pseudo-second-order kinetics model of taxanes from Taxus chinensis in UAE extract for (a) extraction temperature; (b) ultrasonic power; (c) solid/liquid ratio.
A regression analysis was performed on the experimental data using the pseudo-first-order and pseudo-second-order models using Equations (2) and (3) in Table 1, respectively. The corresponding kinetic parameters, obtained from linear regression analysis, can be found in Table 3. Compared with the pseudo-first-order model, the pseudo-second-order model showed superior consistency with the experimental data, as evidenced by a higher coefficient of determination (R2 > 0.972), lower root mean square deviation and residual sum of squares (RSS), and a smaller Akaike information criterion (AIC) (RMSD < 0.012, RSS < 0.00110, AIC: −65.102~−79.517).
Table 3.
Parameters of pseudo-first-order and pseudo-second-order model for the UAE-NADES of taxanes from Taxus chinensis.
The pseudo-first-order model was only valid during the first phase of the extract processes [40], the pseudo-second-order model was deemed more appropriate for describing the entire extraction process of taxanes from Taxus chinensis and was therefore employed for subsequent kinetic analysis in this study.
The yield of taxanes is governed by three critical parameters: extraction temperature, ultrasonic power, and solid/liquid ratios. To quantitatively evaluate their influence on the extraction kinetics, a systematic analysis was performed employing the key parameters of rate constant (k2), initial extraction rate (h), and equilibrium concentration (Ce), derived from the pseudo-second-order kinetic model.
As summarized in Figure 4 and Table 3, the kinetic parameters (k2, h, Ce) governing the extraction process were significantly influenced by variations in extraction temperature, ultrasonic power, and solid/liquid ratios. In the temperature range of 20 to 50 °C, the extraction temperature exerted a pronounced effect on the extraction kinetics. The rate constant (k2) exhibited an increasing trend with rising temperature, indicating that the extraction of taxanes is an endothermic process. This behavior can be attributed to the enhanced disruption of plant matrix interactions and the facilitated release of target compounds under higher thermal conditions. Moreover, elevated temperature reduces solvent viscosity, thereby improving its diffusivity into the cellular structure and promoting mass transfer of taxanes [8,41]. Concurrently, the initial extraction rate (h) increased as the temperature rose from 20 to 40 °C, reflecting an accelerated extraction process achievable within a shorter duration [11]. This degradation in ‘h’ at 50 °C is likely a consequence of the initiation of thermal breakdown in sensitive constituents. A similar trend was observed for the equilibrium concentration (Ce), which increased gradually up to 40 °C, reaching a maximum value of 0.498 mg/mL, but decreased to 0.364 mg/mL at 50 °C. This reduction suggests that excessive temperatures may induce compound degradation or volatilization, ultimately diminishing extraction efficiency. These findings align with the report by McKay [40], confirming that overly high temperatures can adversely affect the recovery of heat-sensitive natural products.
The extraction kinetics exhibited a non-linear dependence on ultrasonic power from 160 to 280 W. Elevating the power to 240 W increased k2 from 0.120 to 0.228 mL/(g·min) and h from 0.017 to 0.057 mg/(mL·min), a phenomenon driven by enhanced cavitation and solvent penetration. Beyond this optimum, both kinetic parameters were attenuated at 280 W, likely due to molecular degradation or thermal effects. This non-monotonic behavior was also reflected in the equilibrium concentration (Ce), underscoring the role of power in defining extraction efficiency and compound stability [42].
In contrast to temperature and ultrasonic power, the solid/liquid ratios exhibited a comparatively minor influence on the extraction parameters within the tested range (1:10–1:25 g/mL). The kinetic parameters (k2, h, Ce) all reached their maxima at 1:20 g/mL, suggesting that this condition provides an optimal contact efficiency between the plant matrix and solvent. Conversely, a further increase to 1:25 g/mL led to a decline in all parameters, which is likely attributable to solvent dilution that reduced the concentration gradient and consequently weakened the driving force for mass transfer [43].
The pseudo-second-order kinetic analysis revealed the optimal extraction conditions as 40 °C, 240 W, and a solid/liquid ratio of 1:20 g/mL, under which the kinetic parameters (k2, h, Ce) collectively reached their maxima. This synergy signifies the highest extraction efficiency and affirms the critical role of kinetic modeling in rationally guiding process optimization to maximize yield while ensuring compound stability.
3.3. Determination of Rate-Limiting Step
To elucidate the mass transfer mechanism during solid–liquid extraction, the intraparticle diffusion model was employed to the experimental data [44]. According to Equation (4) in Table 1, the plot of qt vs. t1/2 exhibited a linear relationship with a slope of kp [45]. The fit is offset from the origin, indicating that while intraparticle diffusion plays a role, it is not the exclusive rate-limiting factor of this process [46]. As illustrated in Figure 5, the extraction process exhibited a multi-linear profile, indicative of three consecutive stages: (1) the washing stage, characterized by fast solute dissolution from the external surface of the solid into the solvent, governed by external mass transfer; (2) the intraparticle diffusion stage, during which solutes diffuse from the internal pores of the solid matrix to the surface—this stage is generally rate-limiting due to its prolonged duration; and (3) the equilibrium stage, in which solute transfer slows significantly as the system approaches equilibrium. This final stage is typically rapid and does not control the overall extraction rate [47]. Therefore, the overall mass transfer kinetics are jointly influenced by both the washing and intraparticle diffusion stages [48,49,50].
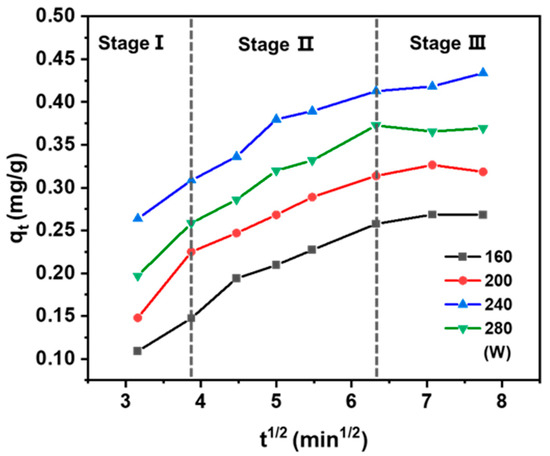
Figure 5.
Plot of intraparticle diffusion divided into three stages for the UAE of taxanes at 40 °C in different powers.
In conventional solvent extraction, these stages proceed sequentially with clear distinctions between them. In contrast, UAE blurs this separation, enabling the washing and intraparticle diffusion stages to occur almost concurrently. The mechanical and cavitation effects induced by ultrasound enhance solute release from the solid matrix and facilitate intra-particle diffusion, thereby accelerating mass transfer throughout both stages. Consequently, optimizing ultrasonic power not only improves the extraction rate but also significantly increases process efficiency.
As shown in Table 4, in the ultrasonic power range of 160 to 280 W, the rate constant of the washing step (kp1) was significantly higher than that of the intraparticle diffusion step (kp2). Given that kp2 exerts a more pronounced influence on the rate-determining step, it follows that the extraction process is predominantly governed by intraparticle diffusion. This further corroborates that the extraction process within this power range is primarily governed by internal diffusion mechanisms. With increasing ultrasonic power, both kp1 and kp2 showed a consistent upward trend, reflecting the enhanced mass transfer efficiency promoted by ultrasonic energy. Notably, kp2 reached its maximum value of 0.053 mg/g·min1/2 at 240 W, suggesting the most rapid intraparticle diffusion and thus the highest extraction efficiency under this condition. Conversely, a further power increase to 280 W exerted a detrimental effect on the extraction rate. This is likely due to structural disruption of the plant matrix or excessive solvent evaporation caused by overly intense ultrasonic energy. Therefore, 240 W was established as the optimal ultrasonic power, providing key kinetic insights for the rational design of efficient extraction processes.
Table 4.
Parameter of intraparticle diffusion for the UAE of taxanes at 40 °C in different powers.
3.4. Determining the Effective Diffusion and Mass Transfer Coefficient
The mass transfer and diffusion behavior of taxanes from Taxus chinensis during UAE extraction was systematically evaluated based on Fick’s first and second laws of diffusion. The effect of key extraction parameters—temperature, ultrasonic power, and solid/liquid ratios—on the effective diffusion coefficient (De), mass transfer coefficient (KT), and Biot number (Bi) was thoroughly investigated. According to Equations (5)–(7) in Table 1, the variation in taxane concentration under different extraction conditions was determined from the linear relationship between ln (Ce/(Ce − Ct)) and extraction time (t) (Figure 6 and Figure 7). The resulting values of De, KT, and Bi are concluded in Table 5.
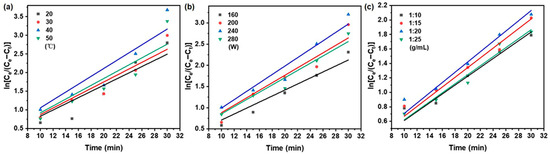
Figure 6.
Fick’s first law model on the effect of (a) extraction temperature; (b) ultrasonic power; (c) solid/liquid ratio on taxanes from Taxus chinensis in UAE extract.
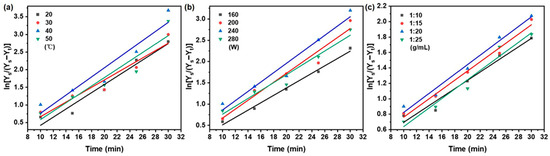
Figure 7.
Fick’s second law on the effect of (a) extraction temperature; (b) ultrasonic power; (c) solid/liquid ratio on taxanes from Taxus chinensis in UAE extract.
Table 5.
Values of the De, KT, Bi obtained for the UAE of taxanes from Taxus chinensis.
As summarized in Table 5, the apparent diffusivity (De) increased from 4.50 × 10⁻⁹ to 6.21 × 10⁻⁹ m2/s as the temperature rose from 20 to 40 °C, primarily due to enhanced molecular motion and reduced solvent viscosity [51,52]. Beyond 40 °C, the De value declined, likely due to thermal degradation of taxanes reducing the solid–liquid concentration gradient [53]. This trend aligns with reports on phenolic [43] and cyanidin glycoside [54] extraction. The mass transfer coefficient (KT) showed greater sensitivity to temperature than De, increasing from 3.01 × 10⁻³ to 4.14 × 10⁻³ m/s over the same range. This stronger response reflects the combined effect of improved diffusivity and reduced viscosity on interfacial transfer [55,56].
Ultrasonic power also significantly influenced mass transfer. Raising power from 160 to 240 W increased De from 3.85 × 10⁻⁹ to 4.68 × 10⁻⁹ m2/s and KT from 2.77 × 10⁻³ to 3.89 × 10⁻³ m/s, attributable to cavitation-enhanced solvent penetration [57]. Further power increase to 280 W reduced both parameters, as excessive energy may cause the thermal degradation of paclitaxel and transition from effective cavitation to turbulent agitation [58].
The solid/liquid ratio was varied between 1:10 and 1:20 g/mL and improved De (2.59 × 10⁻⁹ to 3.05 × 10⁻⁹ m2/s) and KT (2.48 × 10⁻³ to 2.84 × 10⁻³ m/s) due to enhanced particle swelling and a steeper concentration gradient [59,60,61,62]. Further dilution to 1:25 g/mL reduced mass transfer efficiency due to diminished concentration driving force and ultrasonic energy per unit volume [61,62].
Biot number (Bi) values ranged from 59.21 to 85.08, significantly higher than those reported in previous studies [63,64], confirming that internal diffusion is the dominant rate-limiting step, with external resistance being negligible [55]. These findings collectively identify 40 °C, 240 W, and 1:20 g/mL as optimal extraction conditions, under which internal diffusion controls the extraction kinetics.
3.5. Analysis of Extraction Thermodynamics
Based on the linear relationship in Equation (9) (Table 1), the Arrhenius plot of lnk2 vs. 1/T was built over the temperature range of 20 to 50 °C (Figure 8a). A strong linear relationship (R2 = 0.933) was obtained by linear regression, demonstrating a pronounced dependence of the extraction rate on temperature. The magnitude of Ea reflects the underlying extraction mechanism: values above 40 kJ/mol suggest a solubilization-controlled process, while those below 20 kJ/mol are characteristic of diffusion-controlled extraction [64]. The measured Ea of 18.84 kJ/mol (Table 6) clearly situates the process within the diffusion-controlled regime, consistent with earlier findings on similar systems [65].
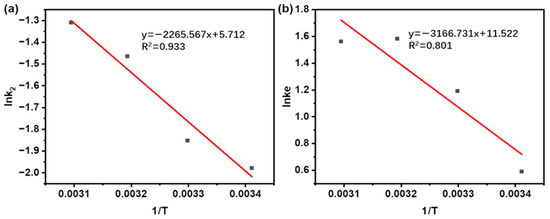
Figure 8.
(a) Calculation of Ea by Arrhenius equation during the UAE of taxanes from Taxus chinensis. (b) Calculation of ΔH and ΔS changes determined from the temperature dependence of the equilibrium constant during the UAE of taxanes from Taxus chinensis.
Table 6.
Thermodynamic parameters for UAE of taxanes from Taxus chinensis.
To deeper evaluate the feasibility and thermodynamic properties of the extraction process, thermodynamic parameters of ΔG, ΔH, and ΔS were calculated. These parameters were derived from the Van’t Hoff relation (Equation (10)) in Table 1, with ΔH and ΔS obtained by the linear fit of ln Ke vs. 1/T (Figure 8b), and ΔG subsequently calculated.
As summarized in Table 6, the equilibrium constant (Ke) increases with temperature up to 40 °C, reaching a maximum value that identifies this as the optimal extraction temperature. This trend reflects the thermodynamically favored forward shift of the extraction equilibrium upon heating. Beyond this point, a slight decrease in Ke is observed at 50 °C. This phenomenon can be primarily ascribed to the incipient thermal degradation of target compounds. Similar trends were observed during paclitaxel extraction from Taxus chinensis by Lee [66] and in the extraction of sciadopitysin from fir by Wei [67].
The positive ΔH (26.33 kJ/mol) confirms the endothermic nature of the extraction, while the large positive ΔS (95.79 J/mol·K) reflects increased system disorder as solute molecules transfer from the ordered solid matrix into the solvent [67]. The negative ΔG values at all temperatures studied (−1.44, −2.90, −3.86, and −3.81 kJ/mol at 20, 30, 40, and 50 °C, separately) demonstrate that the process is spontaneous and feasible [68]. This thermodynamic trend aligns with findings from studies on the UAE of bioactive molecules from Moringa leaves [62] and the UAE of polysaccharides from Dendrobium officinale [69]. Elevated temperatures tend to drive endothermic processes, enhance mass transfer efficiency, and facilitate the mass transfer of target molecules [66]. Therefore, the evaluation of thermodynamic parameters (ΔG, ΔH, and ΔS) provides critical insight into the spontaneity, energy requirements, and practical viability of the extraction process.
3.6. Comparison of the Fitting Effects of the Peleg Model and the Second-Order Kinetic Model in the Extraction of Paclitaxel
In this study, the extraction kinetics of paclitaxel were found to exhibit biphasic characteristics. As shown in Table 7, both the Peleg model and the second-order kinetic model provided satisfactory overall fits to the biphasic extraction data, suggesting that the kinetic behavior aligns with each model’s formulation. This observation is consistent with earlier reports by Lee [66] and Kim [50]. Nevertheless, notable differences exist in the specific fitting parameters and their physical interpretability. A detailed comparison based on Table 7 reveals that the second-order model yielded higher R2 values (>0.98) compared with the Peleg model (>0.95), indicating closer agreement with the mechanistic assumptions of second-order kinetics rather than the adsorption-based description of the Peleg model—a finding also supported by Arimalala [70].
Table 7.
The fitting effects of the Peleg model and the second-order kinetic model in the extraction of paclitaxel.
In terms of error metrics (RMSD, RSS, and AIC), the Peleg model performed marginally better (Equation (11), Table 1), with RMSD values between 0.005 and 0.052, RSS ranging from 0.00018 to 0.02182, and a minimum AIC of −81.522. Although the differences are subtle, they suggest slightly refined fitting detail in the Peleg model. Beyond statistical performance, the two models differ fundamentally in physical interpretability. The Peleg model is largely empirical, lacking a clear physicochemical mechanism and offering limited insight into the underlying extraction process [71]. In contrast, the second-order kinetic model incorporates parameters (k2, Ce, h) with well-defined physical meanings. These parameters are interrelated through the expression h = k2·Ce2, enabling mutual verification and enhancing the reliability of the estimated values. Therefore, while both models can describe the kinetic data adequately, the second-order kinetic model offers a more mechanistically meaningful representation of the paclitaxel extraction process and is considered more suitable for this system.
4. Conclusions
This study established a reliable HPLC-based quantitative method for analyzing taxanes extracted from Taxus chinensis and systematically elucidated the kinetic mechanisms and thermodynamic behavior of the UAE-NADES. The optimal conditions were determined as follows: temperature of 40 °C, ultrasonic power of 240 W, and solid/liquid ratios of 1:20 g/mL, showing strong consistency with single-factor experimental results.
Kinetic analysis revealed that the pseudo-second-order model supplied a more accurate explanation of the extraction process relative to the pseudo-first-order model. Based on Fick’s second law and the internal diffusion model, the extraction was found to be primarily controlled by internal diffusion. Key parameters, including the effective diffusion coefficient (De), mass transfer coefficient (KT), and Biot number (Bi), were calculated to characterize the diffusion behavior. Under experimental conditions ranging from 20 to 40 °C, 160 to 240 W, and solid/liquid ratios of 1:10 to 1:20 g/mL, both De and KT increased significantly with rising temperature, ultrasonic power, and solid/liquid ratios. High Biot numbers (59.21~85.08) indicated negligible external mass transfer resistance, confirming efficient solute–solvent mixing and internal diffusion as the rate-limiting step. Thermodynamic analysis demonstrated that the extraction process was endothermic (ΔH > 0), irreversible (ΔS > 0), and spontaneous (ΔG < 0). In this study, the extraction of paclitaxel exhibited biphasic kinetic characteristics. The Peleg model and the second-order model both had excellent fits. The second-order model had a clearer mechanism and greater adaptability, making it more suitable for this extraction process.
This research establishes a theoretical basis and a technical roadmap for the industrial extraction of taxanes. By combining systematic process optimization with kinetic and thermodynamic modeling, it supports the sustainable production of taxanes while reducing the reliance on wild Taxus resources, offering both economic and environmental benefits.
Supplementary Materials
The following supporting information can be downloaded at: https://www.mdpi.com/article/10.3390/pr13124074/s1, Table S1: Equations used for parameter estimation.
Author Contributions
Conceptualization, Y.G. and J.Q.; methodology, Y.G., W.S., L.H. and J.Q.; software, Y.G. and W.S.; validation, Y.G. and J.Q.; formal analysis, Y.G., W.S., L.H. and J.Q.; investigation, Y.G., W.S., L.H., R.L., I.A.A.H. and J.Q.; resources, Y.G., W.S., L.H. and J.Q.; data curation, W.S., L.H. and R.L.; writing—original draft preparation, Y.G., W.S., L.H. and R.L.; writing—review and editing, Y.G., W.S., L.H., R.L., I.A.A.H. and J.Q.; visualization, Y.G., W.S., L.H., R.L., I.A.A.H. and J.Q.; supervision, Y.G., I.A.A.H. and J.Q.; project administration, Y.G., I.A.A.H. and J.Q.; funding acquisition, Y.G. and J.Q. All authors have read and agreed to the published version of the manuscript.
Funding
This research was funded by the Natural Science Foundation of Hubei Province (2024AFB476, 2025AFD186, 2025AFD243), the Hubei Provincial Higher Education Outstanding Young and Middle-aged Scientific and Technological Innovation Team (T2024030), the Scientific Research Projects of the Hubei Provincial Department of Education (B2022221), the key discipline construction fund of Hanjiang Normal University (XJ2022S01), and the Open Project of Hubei Key Laboratory of Wudang Local Chinese Medicine Research, Hubei University of Medicine (WDCM2024026).
Institutional Review Board Statement
Taxus chinensis were used in this study. Fresh branches and leaves of Taxus chinensis selected from ‘Hanjiang Normal University’ (Shiyan, China).
Data Availability Statement
The original contributions presented in this study are included in the article/Supplementary Materials. Further inquiries can be directed to the corresponding author.
Conflicts of Interest
The authors declare no conflicts of interest.
References
- Christensen, S.B. Drugs that changed society: Microtubule-targeting agents belonging to taxanoids, macrolides and non-ribosomal peptides. Molecules 2022, 27, 5648. [Google Scholar] [CrossRef]
- Yang, Y.H.; Mao, J.W.; Tan, X.L. Research progress on the source, production, and anti-cancer mechanisms of paclitaxel. Chin. J. Nat. Med. 2020, 18, 890–897. [Google Scholar] [CrossRef] [PubMed]
- Guo, Y.; Hamid, I.A.A.; Kee, C.M.; Quan, J.X. RSM-rCCD Optimizing for Paclitaxel Extraction from Taxus chinensis byNatural Deep Eutectic Solvents and Studying Antioxidant Activity. Curr. Anal. Chem. 2025, 21, e15734110367450. [Google Scholar] [CrossRef]
- Šavikin, K.; Janković, T.; Ćujić, N.; Menković, N. Optimization of ultrasound-assisted extraction of polyphenolic compounds from pomegranate peel using response surface methodology. Sep. Purif. Technol. 2018, 194, 40–47. [Google Scholar] [CrossRef]
- Park, J.M.; Kim, J.H. Ultrasound-assisted micellar extraction for paclitaxel purification from Taxus chinensis. Korean Chem. Eng. Res. 2021, 59, 106–111. [Google Scholar] [CrossRef]
- Zhao, Z.R.; Zhang, Y.J.; Li, W.L.; Tang, Y.H.; Meng, H.W.; Wang, S.J. Improving the extraction yield of taxanes from Taxus cuspidata needles using cold plasma. J. Appl. Res. Med. Aromat. Plants 2023, 34, 100457. [Google Scholar] [CrossRef]
- Zhang, Y.; Zhao, Z.; Meng, H.; Li, W.; Wang, S. Ultrasonic extraction and separation of taxanes from Taxus cuspidata optimized by response surface methodology. Separations 2022, 9, 193. [Google Scholar] [CrossRef]
- Li, L.; Chen, Y.; Ma, Y.; Wang, Z.; Wang, T.; Xie, Y. Optimization of taxol extraction process using response surface methodology and investigation of temporal and spatial distribution of Taxol in Taxus mairei. Molecules 2021, 26, 5485. [Google Scholar] [CrossRef]
- Milićević, N.; Kojić, P.; Sakač, M.; Mišan, A.; Kojić, J.; Perussello, C.; Tiwari, B. Kinetic modeling of ultrasound-assisted extraction of phenolics from cereal brans. Ultrason. Sonochem. 2021, 79, 105761. [Google Scholar] [CrossRef] [PubMed]
- Wang, H.; Shen, H.T.; Shen, C.; Li, Y.N.; Ying, Z.F.; Duan, Y.F. Kinetics and Mechanism Study of Mercury Adsorption by Activated Carbon in Wet Oxy-Fuel Conditions. Energy Fuels 2019, 33, 1344–1353. [Google Scholar] [CrossRef]
- Nie, J.G.; Chen, D.T.; Ye, J. Optimization and kinetic modeling of ultrasonic-assisted extraction of fucoxanthin from edible brown algae Sargassum fusiforme using green solvents. Ultrason. Sonochem. 2021, 77, 105671. [Google Scholar] [CrossRef]
- Zhou, P.; Li, X.Z.; Zhou, J.; Yang, Y.H.; Zhi, J.; Shen, L.Q. Mass transfer mechanism of the multivariate consecutive extraction process of pectin and hesperidin from Citrus aurantium L.: Kinetics, thermodynamics, diffusion and mass transfer coefficients. Sep. Purif. Technol. 2023, 311, 123339. [Google Scholar] [CrossRef]
- Alrugaibah, M.; Yagiz, Y.; Gu, L.W. Use natural deep eutectic solvents as efficient green reagents to extract procyanidins and anthocyanins from cranberry pomace and predictive modeling by RSM and artificial neural networking. Sep. Purif. Technol. 2021, 255, 117720. [Google Scholar] [CrossRef]
- Loganathan, D.; Yi, R.; Patel, B.; Zhang, J.; Kong, N. A sensitive HPLC-MS/MS method for the detection, resolution and quantitation of cathinone enantiomers in horse blood plasma and urine. Anal. Bioanal. Chem. 2021, 413, 1618–1632. [Google Scholar] [CrossRef]
- Theodoridis, G.; Haasnoot, W.; Cazemier, G.; Schilt, R.; Jaziri, M.; Diallo, B.; Papadoyannis, I.N.; de Jong, G.J. Immunoaffinity chromatography for the sample pretreatment of Taxus plant and cell extracts prior to analysis of taxanes by high-performance liquid chromatography. J. Chromatogr. A 2002, 948, 177–185. [Google Scholar] [CrossRef]
- Zhang, Y.; Zhao, Z.; Li, W.; Tang, Y.; Meng, H.; Wang, S. Purification of Two Taxanes from Taxus cuspidata by Preparative High-Performance Liquid Chromatography. Separations 2022, 9, 446. [Google Scholar] [CrossRef]
- Quan, J.X.; Nie, G.R.; Xue, H.; Luo, L.; Zhang, R.P.; Li, H.B. Macroscopic Chiral Recognition by Calix [4] arene-Based Host-Guest Interactions. Chem. A Eur. J. 2018, 24, 15502–15506. [Google Scholar] [CrossRef]
- Quan, J.X.; Yan, H.W.; Periyasami, G.; Li, H.B. A Visible-Light Regulated ATP Transport in Retinal-modified Pillar[6] arene Layer-by-Layer Self-assembled Sub-nanochannel. Chem.-A Eur. J. 2024, 30, e202401045. [Google Scholar] [CrossRef]
- Li, W.; Li, G.; Xu, W.; Li, Z.; Qu, H.; Ma, C.; Zhang, H.; Cai, M.; Noruzi, E.B.; Quan, J. Visible Light-Gating Responsive Nanochannel for Controlled Release of the Fungicide. Small 2024, 20, 2401503–2401508. [Google Scholar] [CrossRef] [PubMed]
- Zahari, N.A.; Chong, G.H.; Abdullah, L.C.; Chua, B.L. Ultrasonic-assisted extraction (UAE) process on thymol concentration from Plectranthus amboinicus leaves: Kinetic modeling and optimization. Processes 2020, 8, 322. [Google Scholar] [CrossRef]
- Thakur, R.; Gupta, V.; Dhar, P.; Deka, S.C.; Das, A.B. Ultrasound-assisted extraction of anthocyanin from black rice bran using natural deep eutectic solvents: Optimization, diffusivity, and stability. J. Food Process. Preserv. 2022, 46, e16309. [Google Scholar] [CrossRef]
- Giri, S.; Dash, K.K.; Raj, G.B.; Kovács, B.; Mukarram, S.A. Ultrasound assisted phytochemical extraction of persimmon fruit peel: Integrating ANN modeling and genetic algorithm optimization. Ultrason. Sonochem. 2024, 102, 106759. [Google Scholar] [CrossRef] [PubMed]
- Min, H.S.; Kim, J.H. Study of the extraction kinetics and calculation of effective diffusivity and mass transfer coefficient in negative pressure cavitation extraction of paclitaxel from Taxus chinensis. Biotechnol. Bioprocess Eng. 2022, 27, 111–118. [Google Scholar] [CrossRef]
- Yang, Y.C.; Wang, C.S.; Wei, M.C. A green approach for the extraction and characterization of oridonin and ursolic and oleanolic acids from Rabdosia rubescens and its kinetic behavior. Food Chem. 2020, 319, 126582. [Google Scholar] [CrossRef]
- Krishnan, R.Y.; Rajan, K.S. Microwave assisted extraction of flavonoids from Terminalia bellerica: Study of kinetics and thermodynamics. Sep. Purif. Technol. 2016, 157, 169–178. [Google Scholar] [CrossRef]
- Liao, J.; Guo, Z.; Yu, G. Process intensification and kinetic studies of ultrasound-assisted extraction of flavonoids from peanut shells. Ultrason. Sonochem. 2021, 76, 105661. [Google Scholar] [CrossRef] [PubMed]
- Leveneur, S. Kinetic modelling: Regression and validation stages, a compulsory tandem for kinetic model assessment. Can J Chem Eng. 2023, 101, 7078–7101. [Google Scholar] [CrossRef]
- Xiao, P.; Yu, Z.X.; Chen, T.X.; Yu, L.; He, Y.; Jin, W.F. Systematic evaluation and platform construction of kinetics modeling for herbal extraction in phytomedicine. Ultrason. Sonochem. 2025, 123, 107646. [Google Scholar] [CrossRef] [PubMed]
- Raj, G.B.; Dash, K.K. Ultrasound-assisted extraction of phytocompounds from dragon fruit peel: Optimization, kinetics and thermodynamic studies. Ultrason. Sonochem. 2020, 68, 105180. [Google Scholar] [CrossRef] [PubMed]
- Lima, E.C.; Gomes, A.A.; Tran, H.N. Comparison of the nonlinear and linear forms of the van’t Hoff equation for calculation of adsorption thermodynamic parameters (∆S and ∆H). J. Mol. Liq. 2020, 311, 113315. [Google Scholar] [CrossRef]
- Bullerjahn, J.T.; Hanson, S.M. Extracting thermodynamic properties from van’t Hoff plots with emphasis on temperature-sensing ion channels. Temperature 2024, 11, 60–71. [Google Scholar] [CrossRef]
- Krishnan, R.Y.; Chandran, M.N.; Vadivel, V.; Rajan, K.S. Insights on the influence of microwave irradiation on the extraction of flavonoids from Terminalia chebula. Sep. Purif. Technol. 2016, 170, 224–233. [Google Scholar] [CrossRef]
- Sahin, S.; Samlı, R. Optimization of olive leaf extract obtained by ultrasound-assisted extraction with response surface methodology. Ultrason. Sonochem. 2013, 20, 595–602. [Google Scholar] [CrossRef] [PubMed]
- Zhao, Z.; Zhang, Y.; Li, W.; Tang, Y.; Wang, S. Parameter Optimization of Ultrasonic–Microwave Synergistic Extraction of Taxanes from Taxus cuspidata Needles. Molecules 2023, 28, 7746. [Google Scholar] [CrossRef]
- Liu, H.; Zhong, D.; Zhang, R.; Wang, G.; Zhang, Y. Extraction and purification of polyphenols and determination of antioxidant activity. Trans CSAE 2020, 36, 324–332. [Google Scholar] [CrossRef]
- Sun, Q.; Du, B.; Wang, C.; Xu, W.; Zhang, H. Ultrasound-Assisted Ionic Liquid Solid-Liquid Extraction Coupled with Aqueous Two-Phase Extraction of Naphthoquinone Pigments in Arnebia euchroma (Royle) Johnst. Chromatographia 2019, 82, 1777–1789. [Google Scholar] [CrossRef]
- Cai, Z.; Han, M.; Zhang, X.; Gao, X.; Wang, F.; Pang, M. Extraction of Anthraquinone Compounds from Chinese Chestnut by Using Ultrasonic-assisted Technology. J. Plant Sci. 2019, 7, 43–47. [Google Scholar] [CrossRef]
- Wang, Y.G.; Wang, C.L. Comparative analysis of three kinds of extraction kinetic models of crude polysaccharides from Codonopsis pilosula and evaluate the characteristics of crude polysaccharides. Biomass Convers. Biorefinery 2023, 13, 12917–12933. [Google Scholar] [CrossRef]
- Cheung, Y.C.; Wu, J.Y. Kinetic models and process parameters for ultrasound-assisted extraction of water-soluble components and polysaccharides from a medicinal fungus. Biochem. Eng. J. 2013, 79, 214–220. [Google Scholar] [CrossRef]
- McKay, G.; Ho, Y.S.; Ng, J.C.Y. Biosorption of copper from wastewater: A review. Sep. Purif. Methods 1999, 28, 87–125. [Google Scholar] [CrossRef]
- Singh, N.; Kumar, S.; Patle, D.S. Intensification of extraction of bioactive compounds from pomegranate peel using an ultrasound-microwave assisted extraction approach: Parametric optimization, kinetics and thermodynamics. Sep. Purif. Technol. 2025, 359, 130681. [Google Scholar] [CrossRef]
- Zou, Y.; Yang, H. Effect of ultrasound power on extraction kinetic model, and physicochemical and structural characteristics of collagen from chicken lung. Food Prod. Process. Nutr. 2020, 2, 3. [Google Scholar] [CrossRef]
- Alara, O.R.; Abdurahman, N.H. Microwave-assisted extraction of phenolics from Hibiscus sabdariffa calyces:Kinetic modelling and process intensification. Ind. Crops Prod. 2019, 137, 528–535. [Google Scholar] [CrossRef]
- Weber, J.; Morris, J.C. Kinetics of adsorption on carbon from solution. J. Sanit. Eng. Div. 1963, 89, 31–59. [Google Scholar] [CrossRef]
- Amadi, O.K.; Odih, C.; Nwachukwu, O.U. Kinetics and mechanism modelling of pb (ii) and ni (ii) ions sorption from aqueous medium: Evaluating the performance of curcuma longa rhizome in the treatment of waste water. J. Chem. Soc. Niger. 2024, 49, 1. [Google Scholar] [CrossRef]
- Lach, J.; Okoniewska, E. Equilibrium, kinetic, and diffusion mechanism of lead (II) and cadmium (II) adsorption onto commercial activated carbons. Molecules 2024, 29, 2418. [Google Scholar] [CrossRef] [PubMed]
- Kavitha, D.; Namasivayam, C. Experimental and kinetic studies on methylene blue adsorption by coir pith carbon. Bioresour. Technol. 2007, 98, 14–21. [Google Scholar] [CrossRef]
- Asheghmoalla, M.; Mehrvar, M. Adsorption of a Multicomponent Pharmaceutical Wastewater on Charcoal-Based Activated Carbon: Equilibrium and Kinetics. Water 2024, 16, 2086. [Google Scholar] [CrossRef]
- Dulo, B.; De Somer, T.; Moyo, M.; Nakyese, E.; Githaiga, J.; Raes, K.; De Meester, S. Kinetic modeling of phenolic compounds extraction from nutshells: Influence of particle size, temperature and solvent ratio. Biomass Convers. Biorefinery 2024, 14, 23565–23579. [Google Scholar] [CrossRef]
- Yoo, K.W.; Kim, J.H. Kinetics and mechanism of ultrasound-assisted extraction of paclitaxel from Taxus chinensis. Biotechnol. Bioprocess Eng. 2018, 23, 532–540. [Google Scholar] [CrossRef]
- Hou, F.; Song, S.; Yang, S.; Wang, Y.; Jia, F.; Wang, W. Study on the Optimization, Extraction Kinetics and Thermodynamics of the Ultrasound-Assisted Enzymatic Extraction of Tremella fuciformis Polysaccharides. Foods 2024, 13, 1408. [Google Scholar] [CrossRef]
- Huang, C.; Wang, Y.; Zhou, C.; Sun, Q.; Zhang, L.; Niu, Y.; Ma, H. Ultrasonic vacuum synergistic assisted ethanol extraction of steviol glycosides and kinetic studies. Ind. Crops Prod. 2024, 221, 119385. [Google Scholar] [CrossRef]
- Hobbi, P.; Okoro, O.V.; Delporte, C.; Alimoradi, H.; Podstawczyk, D.; Nie, L.; Shavandi, A. Kinetic modelling of the solid–liquid extraction process of polyphenolic compounds from apple pomace: Influence of solvent composition and temperature. Bioresour. Bioprocess. 2021, 8, 114. [Google Scholar] [CrossRef]
- Thaisamak, P.; Jaturonglumlert, S.; Varith, J.; Taip, F.S.; Nitatwichit, C. Kinetic model of ultrasonic-assisted extraction with controlled temperature of c-phycocyaninfrom s. platensis. Int. J. GEOMATE 2019, 16, 176–183. [Google Scholar] [CrossRef]
- Wang, Y.G.; Xinjian Wang, X.J.; Kang Zhang, K.; Xuan Zhang, X.; Li, S.W.; Li, Y.L.; Fan, W.G.; Leng, F.F.; Yang, M.J.; Chen, J.X. Extraction kinetics, thermodynamics, rheological properties and anti-BVDV activity of the hot water assisted extraction of Glycyrrhiza polysaccharide. Food Funct. 2020, 11, 4067–4080. [Google Scholar] [CrossRef] [PubMed]
- Ji, J.B.; Lu, X.H.; Cai, M.Q.; Xu, Z.C. Improvement of leaching process of Geniposide with ultrasound. Ultrason. Sonochem. 2006, 13, 455–462. [Google Scholar] [CrossRef]
- Charpe, T.W.; Rathod, V.K. Kinetics of ultrasound assisted extraction of wedelolactone from Eclipta alba. Braz. J. Chem. Eng. 2016, 33, 1003–1010. [Google Scholar] [CrossRef]
- Patil, S.S.; Pathak, A.; Rathod, V.K. Optimization and kinetic study of ultrasound assisted deep eutectic solvent based extraction: A greener route for extraction of curcuminoids from Curcuma longa. Ultrason. Sonochem. 2021, 70, 105267. [Google Scholar] [CrossRef]
- Lasunon, P.; Sengkhamparn, N. Effect of Ultrasound-Assisted, Microwave-Assisted and Ultrasound-Microwave-Assisted Extraction on Pectin Extraction from Industrial Tomato Waste. Molecules 2022, 27, 1157. [Google Scholar] [CrossRef]
- Merouani, S.; Dehane, A.; Hamdaoui, O. A review on the integration of ultrasonication in hybrid systems for enhanced hydrogen yield. Ultrason. Sonochem. 2025, 121, 107552. [Google Scholar] [CrossRef]
- Singla, M.; Singh, A.; Sit, N. Effect of microwave and enzymatic pretreatment and type of solvent on kinetics of ultrasound assisted extraction of bioactive compounds from ripe papaya peel. J. Food Process Eng. 2023, 46, e14119. [Google Scholar] [CrossRef]
- Albarri, R.; Şahin, S. Kinetics, thermodynamics, and mass transfer mechanism of the ultrasound-assisted extraction of bioactive molecules from Moringa oleifera leaves. Biomass Convers. Biorefinery 2023, 13, 7919–7926. [Google Scholar] [CrossRef]
- Jo, Y.J.; Kim, J.H. Effective diffusivity and mass transfer coefficient during the extraction of paclitaxel from Taxus chinensis using methanol. Biotechnol. Bioprocess Eng. 2019, 24, 818–823. [Google Scholar] [CrossRef]
- Reche, C.; Rosselló, C.; Umaña, M.M.; Eim, V.; Simal, S. Mathematical modelling of ultrasound-assisted extraction kinetics of bioactive compounds from artichoke by-products. Foods 2021, 10, 931. [Google Scholar] [CrossRef]
- González-Centeno, M.R.; Comas-Serra, F.; Femenia, A.; Rosselló, C.; Simal, S. Effect of power ultrasound application on aqueous extraction of phenolic compounds and antioxidant capacity from grape pomace (Vitis vinifera L.): Experimental kinetics and modeling. Ultrason. Sonochem. 2015, 22, 506–514. [Google Scholar] [CrossRef] [PubMed]
- Lee, S.H.; Kim, J.H. Kinetic and thermodynamic characteristics of microwave-assisted extraction for the recovery of paclitaxel from Taxus chinensis. Process Biochem. 2019, 76, 187–193. [Google Scholar] [CrossRef]
- Wei, M.; Zhao, R.; Peng, X.; Feng, C.; Gu, H.; Yang, L. Ultrasound-assisted extraction of taxifolin, diosmin, and quercetin from abies nephrolepis (trautv.) maxim: Kinetic and thermodynamic characteristics. Molecules 2020, 25, 1401. [Google Scholar] [CrossRef] [PubMed]
- Singh, N.; Patle, D.S.; Sushil Kumar, S. Microwave- and Ultrasonication-Based Intensified and Synergetic Approaches for Extraction of Bioactive Compounds from Pomegranate Peels: Parametric and Kinetic Studies. Ind. Eng. Chem. Res. 2024, 63, 9214–9224. [Google Scholar] [CrossRef]
- Guo, X.; Liu, S.; Wang, Z.; Zhang, G. Ultrasonic-assisted extraction of polysaccharide from Dendrobium officinale: Kinetics, thermodynamics and optimization. Biochem. Eng. J. 2022, 177, 108227. [Google Scholar] [CrossRef]
- Arimalala, A.F.; Hervé, R.P.; Rafihavanana, R. Modeling and kinetics study of Avocado oil extraction from Madagascar using different mathematical models. S. Afr. J. Chem. Eng. 2022, 41, 93–97. [Google Scholar] [CrossRef]
- Satao, N.T.; Mahindrakar, K.V.; Rathod, V.K. Extraction of phenolics from Spilanthes Acmella plant: Kinetic studies using Peleg’s model. J. Indian Chem. Soc. 2025, 102, 101634. [Google Scholar] [CrossRef]


Disclaimer/Publisher’s Note: The statements, opinions and data contained in all publications are solely those of the individual author(s) and contributor(s) and not of MDPI and/or the editor(s). MDPI and/or the editor(s) disclaim responsibility for any injury to people or property resulting from any ideas, methods, instructions or products referred to in the content. |
© 2025 by the authors. Licensee MDPI, Basel, Switzerland. This article is an open access article distributed under the terms and conditions of the Creative Commons Attribution (CC BY) license (https://creativecommons.org/licenses/by/4.0/).