Abstract
Natural gas desulfurization is critical for pipeline safety. The spray direct injection of triazine solution is more cost-effective for marginal wells and small-scale pipelines. However, the sprayer parameters in confined spaces still need to be explored. In this study, CFD (Computational Fluid Dynamics) simulations employing the DPM (Discrete Phase Model) within ANSYS 2022R2Fluent are conducted to simulate the injection and behavior of triazine solution particles via sprayers in an 80 mm diameter pipeline. The effects of the initial particle size, gas flow rate, spray angle, and spray direction on particle behavior are analyzed. The results show that 50 μm particles can prolong the residence time through gas entrainment, while 500 μm particles are conducive to forming wall films. Reducing the spray angle and decreasing the gas flow rate can increase residence time, but higher gas velocities can enhance secondary particle breakage to increase the specific surface area. The spray direction has a minimal impact on particle behavior. In pipelines longer than 5 m, all particles will finally form wall films; for pipelines shorter than 5 m, the optimal parameters include 50 μm initial particles, a narrowed spray angle, and an increased gas velocity. This study offers valuable design references for desulfurization spray systems in small-diameter natural gas pipelines.
1. Introduction
Natural gas is a significant fossil fuel in global energy resources [1,2]. However, obtained natural gas often contains impurities such as CO2, H2S, etc. High contents of these impurities and prolonged exposure to them will lead to serious corrosion, which in turn poses a serious threat to equipment systems and may even lead to breakage of the pipeline. Evidence shows that corrosion is the primary contributing factor to pipeline failures, accounting for 46.6% and 70.7% of incidents in natural gas and crude oil pipelines, respectively [3]. To meet the standards of pipeline transportation and quality requirements of natural gas products, it is essential to remove these impurities from natural gas [4,5,6]. With the worldwide trend of unconventional natural gas development, the proportion of low-sulfur, sour gas, and sweet gas wells with an H2S content of 1000 mg/m3 ≤ 0.5% v/v has increased to more than 27%. These resources are mostly found in relatively remote places with inadequate facilities or at the latter stage of exploitation, characterized by limited processing capacity and unsuitability for large-diameter pipelines. Transportation pipe diameters are often small, such as DN100 or DN80, urgently necessitating low-cost desulfurization technology [7,8]. The conventional amine process based on a renewable liquid absorbent and the MDEA desulfurization process cannot play an important role in diminishing the economic efficiency of gas wells with a daily output of less than 50,000 m3, which is attributed to the high construction cost and operational complexity of the absorption tower [9]. Meanwhile, low-concentration dry desulfurization technology using iron oxide, zinc oxide, and activated carbon, though simple in terms of equipment structure, is limited by the low sulfur capacity utilization rate of below 40% and the difficulties of solid waste disposal [10,11]. Due to their irreversible reaction characteristic and advantage of having liquid products which can be directly reinjected into the formation, triazine-based liquid desulfurizers [12,13] have gradually become good tools for low-sulfur and low-flow wells. In field operations in the Sichuan Basin, triazine-based liquid desulfurizers have been proven to show reliable performance in keeping the H2S level below 6 mg/m3 and have achieved total compliance with the Class I gas standard of GB17820-2018 [14,15]. However, relevant research on this technology mainly focuses on the preparation and reaction mechanism of triazine solution [16,17,18]. In contrast, few studies have directly investigated the operating parameters for injecting triazine solution into the pipeline to optimize desulfurization, especially in small-diameter pipelines. Additionally, there is a lack of a comprehensive and systematic understanding of the transient coupling of spray, mass transfer, and reaction in enclosed spaces [19].
For the direct injection process of pipes with DN80 and smaller diameters, pipe tees, pipe sleeves, or sprayed nozzles can be utilized to introduce the purging agent into the pipeline. Jamal Aqil et al. conducted research and found that the liquid particles reaching the pipe wall provide a larger contact area compared to sprayed nozzles, which can enhance the desulfurization effect [20]. Campus Esbjerg et al. carried out a study through CFD (Computational Fluid Dynamics) using the Discrete Phase Model (DPM) on the possible absorption effects in straight and curved pipes under co-current and counter-current spray injection conditions. They suggested that the size of the sprayed particles should be controlled and that spraying onto the pipe wall should be avoided as much as possible [21]. Dennis Leppin et al. explored a model for directly injecting a triazine solution into the pipeline for H2S removal and discovered that pipes with smaller diameters resulted in better removal efficiency [22]. Harald Linga et al. investigated desulfurization by installing a mixer inside the pipeline and showed the significance of an efficient injection mixer in achieving a high removal rate [23]. From what has been mentioned above, it is evident that in the method of inserting sprayed nozzles into the pipeline, most existing studies overlook the impact of particle secondary breakage and the formation of liquid films on the wall. Moreover, the coupled mechanisms involving multiple parameters remain unresolved. Specifically, there is a lack of systematic research on the effects of crucial factors such as nozzle geometry, spray direction, and the gas–liquid velocity ratio. Significantly, CFD has demonstrated its ability to address the above multiparameter coupling challenges in the gas absorption, liquid breakage, and gas–liquid transport processes. Umuteme et al. used Fluent to investigate hydrogen dispersion with different velocities in DN50 natural gas pipelines [24], and later, they applied Fluent to reveal the formation stress mechanisms of CO2 hydrates in subsea CO2 transportation pipelines and their impact on corrosion [25]. Davidy et al. employed COMSOL to simulate CO2 absorption in ionic liquid based membranes [26]. Xie et al. utilized Fluent to couple an Eulerian–Eulerian model with a single-particle model for H2S removal in packed-bed bioreactors [27]. Teuber et al. implemented OpenFOAM with a modified VOF (Volume of Fluid) method to analyze H2S mass transfer at air–water interfaces within sewer networks [28]. Zhang et al. applied the DPM to simulate droplet motion and the Eulerian Wall Film (EWF) model for liquid film breakup and re-entrainment in a two-phase flow study for U-tube spray cooling optimization [29]. Rao et al. adopted the DPM to simulate particle motion in their investigation of gas–liquid spiral annular flow patterns and flow pattern transitions in horizontal tubes with twist tapes [30].
Therefore, this study focuses on establishing a numerical simulation model for small-diameter nozzle spray desulfurization. It aims to trace the entire process from particle injection to fragmentation by employing the DPM approach. The study systematically quantifies the influence of the sprayed particle size, natural gas flow rate, spray angle, and spray direction on particle characteristics. The results of this study can offer valuable design references for desulfurization spray systems in small-diameter natural gas pipelines.
2. Mathematical Model
This section establishes the computational framework for simulating gas–liquid–particle interactions in pipeline systems by addressing governing equations, turbulence closure, and multiphase modeling strategies.
2.1. Governing Equations
The governing equations for the continuous phase dynamics are based on the conservation laws, excluding energy conservation to account for high-pressure decompression effects.
All flows abide by fundamental conservation laws, including mass and momentum [31,32]. In the simulation case, because of the high-pressure conditions and decompression components, the gas phase is set as an ideal gas.
The mass conservation equation is
The momentum conservation equation is
where ρ denotes the density of the fluid; t represents the time variable; and u, v, and w are the velocity components of the fluid along the x, y, and z directions, respectively. P refers to the pressure acted on the fluid microelement; τ represents the viscous stress; and F stands for the volume force.
2.2. Turbulence Model
The Shear Stress Transport (SST) k-ω turbulence model offers closure for wall-bounded flows with moderate separation. It combines the precision of the k-ω model near walls with the robustness of the k-ε model in the core flow regions. To avoid overestimating turbulence at boundaries, its equations include special limiters. The SST k-ω model is widely used in gas flow research, such as in the aerodynamic analysis of stationary gas turbine exhaust systems [31] and the analysis of combustion dynamics related to radical formations in swirl burners [32].
The turbulence kinetic energy (k) and specific dissipation rate (ω) are governed by the following transport equations:
Here, Γk and Γω denote effective diffusivities; Gk and Gω represent generation terms; Yk and Yω quantify turbulence dissipation; Gb and Gωb account for buoyancy effects; and Sk and Sω are optional source terms.
2.3. Multiphase Model
A mathematical model was developed to simulate sprayed liquid particles in a gas–liquid two-phase flow system. In this model, the gas phase was treated as the continuous phase, while the liquid was represented as a discrete phase. The discrete phase was modeled using the Discrete Phase Model (DPM) within a Lagrangian framework, which allowed for the tracking of individual particle trajectories. Moreover, Fluent’s DPM wall film model was utilized to simulate the behavior of particles upon impact with the pipe walls. Accurately modeling the changes in particle size is crucial for simulating triazine injection in small-diameter pipelines as the processes of particle breakup and their continuous impact on the walls significantly influence the H2S removal efficiency. When the liquid desulfurizer is injected into the gas stream through nozzles, it is modeled as discrete particles using the DPM. When some particles strike the pipe walls, the wall film model predicts their interaction with the surface, leading to the formation or growth of thin liquid films on the wall. These films are then tracked within the DPM framework. The outcome of particle–wall impingement (whether the particles strike, splash, or form a film) is influenced by factors such as collision energy and the thickness of the existing film.
Particle dynamics in the DPM are governed by force balance calculations. The motion equation for particles is
where is the continuous fluid phase velocity, m/s; is the particle velocity, m/s; is the component of gravitational acceleration in the z direction, m/s2; is the fluid density, kg/m3; is the particle density, kg/m3; is the drag force on the particles; and is the other forces on the particles (such as Brownian force, additional mass force, Saffman lift force, etc.). Brownian force becomes negligible for particles exceeding 1 μm in size, which applies to the current study’s particle range. Virtual mass forces remain inactive since the particle density of triazine solution in the pipeline is much greater than that of natural gas. Saffman lift forces require consideration due to perpendicular velocity gradients relative to particle motion in flow fields.
Among them, the drag force formulation is fundamentally important for accurate trajectory predictions [33], and it can be quantified by
where is the particle diameter, m. Re corresponds to the relative Reynolds number:
When droplet breakup is considered, we choose the “Dynamic-drag” drag coefficient model in Fluent, and the drag coefficient can be expressed as follows:
Spray processes induce droplet deformation, causing departure from spherical geometry. Drag coefficient magnitude exhibits strong dependence on droplet morphology. During transport, droplet evolution toward disk-like configurations elevates drag relative to spherical counterparts. Thus, the following relation is defined:
3. Numerical Simulation Settings
3.1. Physical Model and Mesh Generation
This study constructed a three-dimensional (3D) physical model of a horizontal straight pipeline with a diameter of 80 mm and a length of 28,000 mm. This model is designed to simulate the gas–liquid interaction patterns of sprayed triazine solution particles in pipelines of different lengths. Natural gas flows steadily into the pipeline from one end and, after passing through a spray nozzle, forms a gas–liquid mixing zone and before continuously exiting from the opposite end. The spray nozzle is positioned at the centerline of the pipe, 2000 mm downstream from the gas inlet—a distance determined through technical consultation to ensure sufficient development length for complete droplet dispersion in all spray directions prior to absorption. The sprayer is realized using DPM in Fluent. In this model, the nozzle is conceptually treated as an injection source rather than a physically modeled geometry. This method enables the configuration of key parameters at any specified position within the computational domain. Parameters such as spray direction, spray angle, particle size distribution, injection velocity, nozzle diameter, and injection duration can be defined by setting these key values. For the liquid triazine solution, we specified material properties such as density, viscosity, and surface tension. Geometric modeling and topology generation were accomplished in Gambit 2.4.6 software, as depicted in Figure 1. Additionally, five monitoring planes were established at various distances from the inlet to track particle variations along the pipeline. This framework facilitates a fully parametric numerical analysis of particle distribution patterns, trajectory characteristics, residence time distribution, and overall gas–liquid contact efficiency.
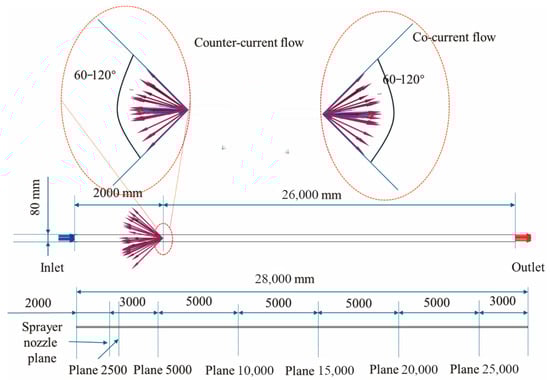
Figure 1.
Structure diagram of the pipeline with sprayer.
The mesh generation for this study was carried out using Gambit 2.46 software. Considering the simple geometry of the single tube and the physical features of gas–liquid two-phase flow and discrete particle motion, a fully hexahedral mesh was adopted, as shown in Figure 2.
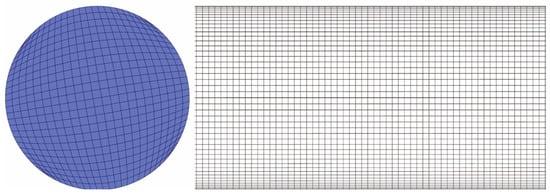
Figure 2.
The meshing condition of the pipeline.
To verify the grid independence of the simulation results, three grid resolutions were used: 869,232 cells (coarse grid), 5,781,397 cells (medium grid), and 12,549,654 cells (fine grid). The minimum mesh sizes were 5 mm, 2 mm, and 1.5 mm, respectively. The distribution of the particle flow rate at different planes (particle size: 200 μm; natural gas flow rate: 10,000 Sm3/d, 90° counter-current injection) under different grid systems is compared in Figure 3. The results show that the particle flow rate predicted by the coarse grid differs significantly from those of the medium and fine grids, while the differences between the medium and fine grids are negligible. This consistency confirms that when the grid size is sufficiently small, simulation results remain stable despite further grid refinement. Considering computational economy in terms of time and resources, the medium grid with 5,781,397 cells is considered appropriate to ensure grid-independent results and is used for the subsequent simulations in this study.
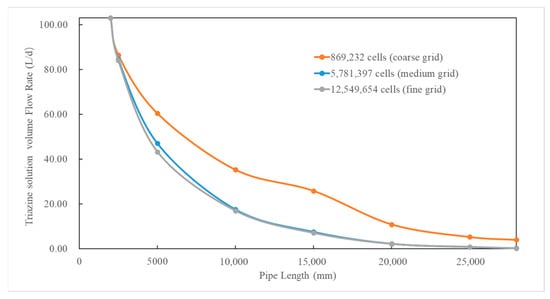
Figure 3.
Comparison between the simulation results of the distribution of particle flow rate at different planes using different grids.
3.2. Material Properties and Boundary Conditions
The physical parameters and boundary conditions were all set in detail using Fluent 2022 R2 software. The gas phase consists of a mixture of compressed methane and hydrogen sulfide, with the operating pressure set at 2.0 MPa·G, based on an industrial case. The gas density and viscosity were automatically calculated using the real gas model integrated into the software. The physical properties of the triazine solution were retrieved from the MSDS (Material Safety Data Sheet) table, and the density was calculated as 1154.9 kg/m3 through a weighted calculation method. The viscosity and surface tension were set as 0.001 Pa·S and 0.072 N/m, respectively.
For the DN80 pipe diameter, the fluid inlet condition was set as Velocity Inlet (0.68 to 6.81 m/s), calculated from the standard gas flow rate (5000 to 50,000 Sm3/d) via a real gas state equation and pipe cross-section area (0.005026 m2). The turbulence parameters were set with an intensity of 5% and a hydraulic diameter of 0.08 m. The outlet was set as Pressure Out, where the gauge pressure was maintained at the corresponding working condition value and the back pressure fluctuation was kept below 0.1%. All walls were assigned to no-slip boundary conditions, and the near-wall region was set with the Enhanced Wall Treatment model.
For the DPM particles (triazine solution) in the liquid phase, the particle diameters range from three scales: 50 μm, 200 μm, and 500 μm. Based on an actual operating condition, the triazine solution dosing volume in the DN80 pipe is set as 103 L/day. The nozzle simulated in this research is BETE series nozzle (Betespray Nozzles, Inc., Greenfield, MA, USA), PJ6 series, with an orifice diameter of 0.152 mm. The spray angle was set to 60°, 90°, or 120°, and the spray direction can be co-current or counter-current relative to the gas flow. For each case, the initial particle velocity was determined based on the nozzle pressure drop and is equal to 65.7 m/s. Considering turbulence effects near the nozzle, the Fluent options “discrete random walk model” and “random eddy life” were enabled, which simulate droplet dispersion in turbulent flow by predicting random velocity fluctuations and controlling particle–eddy interaction times, respectively. The wall boundary condition processing rules for DPM are as follows: the inlet and outlet boundaries are set as Escape. In the early stage of the simulation, it was assumed that the particles would be absorbed when hitting the wall, and the boundary condition was set as Trap. In the later stage, it was assumed that some of the particles could form a liquid film upon wall impact, and the wall boundary condition was set to employ the wall film model to simulate the formation of liquid films from particles.
3.3. Solution Methods and Numerical Strategy
The governing equations were solved using the pressure-based solver in Fluent, employing the COUPLED algorithm for pressure–velocity coupling and the Least Squares Cell-Based method for gradient computation. Spatial discretization utilized a SEC-OND-ORDER scheme for pressure and SECOND-ORDER Upwind schemes for momentum, turbulent kinetic energy, and specific dissipation rate. At the beginning of the simulation, a steady-state solution for single-phase gas flow was obtained to establish a stable flow field. Once a converged steady solution was achieved, the calculation transitioned to unsteady state mode with a fixed time step of 0.001 s, at which point Discrete Phase Model (DPM) particles were introduced for the subsequent simulation.
4. Results and Discussion
4.1. The Influence of Sprayed Particle Size
In the DN80 pipe, when the PJ6 type nozzle with a spray angle of 90 degrees and a nozzle diameter of 0.152 mm is used, triazine solutions of three different particle sizes—50 μm, 200 μm, and 500 μm—are injected into the nozzle, and the movement trajectories of the fluid particles in the pipe are presented in Figure 4.
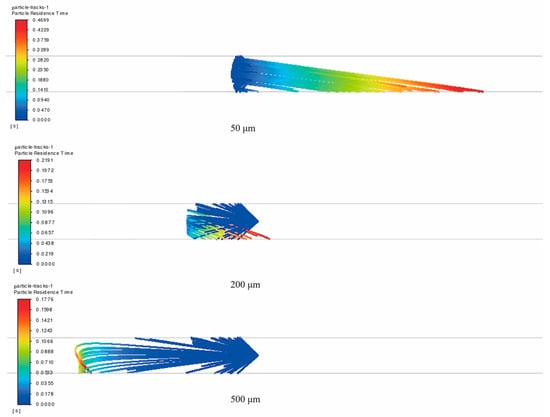
Figure 4.
Trajectories of triazine solution particles with different sprayed particle sizes in pipeline without considering secondary breakage (particle size: 50, 200, and 500 μm; natural gas flow rate: 10,000 Sm3/d; 90° counter-current injection).
As can be seen from Figure 4, when secondary particle breakage is not considered, particles of various sizes all reach the pipe wall after being injected. However, the sprayed particle size has a notable influence on their motion behavior.
For the triazine solution with a sprayed particle size of 50 μm, the particles have relatively weak inertial force due to their small size. When encountering the upcoming natural gas, these particles are easily carried by the gas flow and travel along the pipeline behind the nozzle. Eventually, under the influence of gravity, these small particles gradually deposit on the bottom wall area. In contrast, triazine solutions with sprayed particle sizes of 200 μm and 500 μm exhibit different movement characteristics. Due to their greater inertial force, after being sprayed, the larger particles move against the gas flow direction for a certain distance until the inertial force gradually fades away. Simultaneously, these larger particles are less easily entrained by the gas flow and therefore settle rapidly to the bottom of the pipe wall under the influence of gravity. The larger the sprayed particle size, the more obvious the effect of gravity, which further verifies the dominant role of particle size in the particle movement behavior.
From the perspective of particle residence time and movement trajectory, small sprayed particle sizes exhibit a longer residence time and more complex, extended movement paths. This property provides more opportunities for the triazine solution to make full contact and react with hydrogen sulfide. In contrast, large sprayed particle sizes, due to the dominant effects of inertia and gravity, follow relatively shorter movement paths and have shorter residence times, which may impact the completeness of the reaction.
4.2. The Influence of the Spray Angle
The spray angle of the sprayer is defined as the angle between the tangents of the two spray arcs, which is shown in Figure 1. When the spray angle is too large, the sprayed particles will exceed the required spray range, resulting in the loss of the working medium and the reduction in spray efficiency. Conversely, when the spray angle is too small, the sprayed particles will be overly concentrated in the spray area, leading to uneven distribution in the target area. Therefore, it is necessary to explore a reasonable spray angle. In the simulation, as shown in Figure 5, the movement trajectories of 50 μm triazine solution fluid particles inside the pipeline were analyzed for spray angles of 90°, 60°, and 120°. As we can see, for small pipes such as DN80, different spray angles have a limited effect on particle motion. For 50 μm particles, the maximum residence time varies by less than 10%. The longest residence time occurs at a 60° spray angle, followed by 120°, and the shortest is at 90°. This indicates that there is potential for optimizing the spray angle.
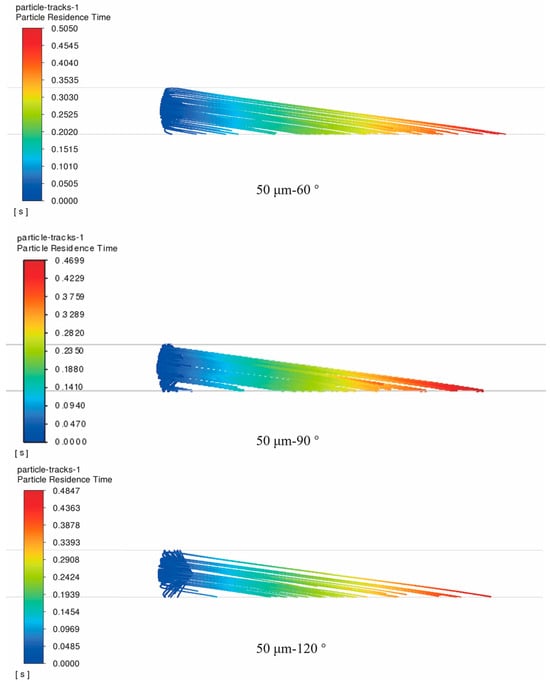
Figure 5.
Trajectories of triazine solution particles within the pipeline under different spray angles without considering secondary breakage (particle size: 50 μm; natural gas flow rate: 10,000 Sm3/d; 60°, 90°, and 120° counter-current injection).
4.3. The Influence of Natural Gas Flow Rate
Figure 6 depicts the residence time of 50 μm particles within the pipeline. These particles are injected at a 90° spray angle through the nozzle under natural gas flow rates of 5000, 10,000, and 15,000 Sm3/d, respectively.
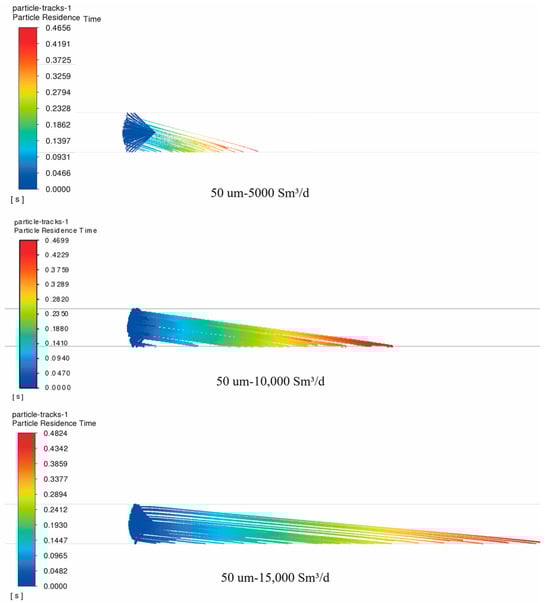
Figure 6.
Trajectories of triazine solution particles in the pipeline under different natural gas flow rates without considering secondary breakage (particle size: 50 μm; natural gas flow rate: 5000, 10,000, and 15,000 Sm3/d; 90° counter-current injection).
As shown in Figure 6, as the flow rate increases, the movement path of fluid particles in the pipeline lengthens and their maximum residence time also increases. This indicates that a higher flow rate can promote more thorough contact between the gas and liquid, which may influence chemical reactions. This effect may be related to the influence of flow rate on the attenuation of particle inertial force and particle breakage. When the natural gas flow rate is high, the high-speed flow of natural gas significantly increases the aerodynamic force on the particles. As a result, the attenuation rate of their inertial force slows, enabling the particles to travel a longer movement path in the pipeline. Moreover, a higher flow rate may also lead to more intense particle breakage, breaking the particles into smaller fragments. This breakage effect can remarkably increase the specific surface area of the particles, providing a larger contact interface for mass transfer and chemical reactions between the gas and liquid, potentially enhancing reaction efficiency.
4.4. The Influence of Spray Direction (Co-Current and Counter-Current)
Figure 7 shows the movement trajectories of particles of different sizes passing through the nozzle at a 90° spray angle when the spray direction is counter-current and co-current. As can be seen, under different flow conditions, there are notable differences in the maximum residence time and movement trajectories of particles of various sizes.
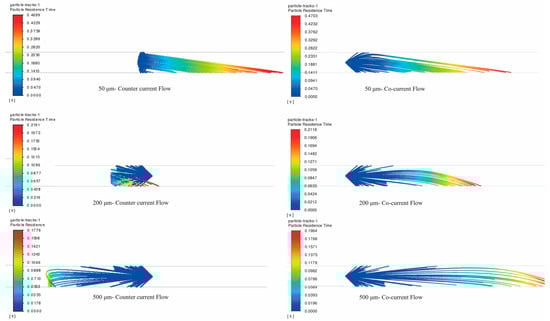
Figure 7.
Trajectories of triazine solution particles in the pipeline under co-current and counter-current flow without considering secondary breakage (particle size: 50, 200, and 500 μm; natural gas flow rate: 10,000 Sm3/d; 90° counter-current and co-current injection).
Under the counter-current condition, for 50 μm particles, the influence of inertial force and gravity is minimal, and they are easily carried by the gas flow, resulting in little change in their residence time and trajectory. For 200 μm particles, the residence time remains unchanged, but their trajectories shift. The capture points move backward due to the conflict between particle inertia and the reverse gas flow, causing them to deposit near the nozzle rear. As for 500 μm particles, they show a significantly increased residence time and accelerated deposition. This is because the larger size enhances the counterflow drag resistance and gravitational effects, which reduces the gas–liquid contact efficiency. In co-current flow, all particles move forward and deposit near the front of the nozzle.
4.5. The Influence of Multiple Parameters
The average residence time of the triazine solution particles in the pipeline under different spray angles, co-current/counter-current, sprayed particle sizes, and natural gas flow rates is shown in Table 1.

Table 1.
Average residence time of triazine solution particles in DN80 pipeline under multiple factors.
After comprehensively analyzing Table 1 and Section 4.1, Section 4.2, Section 4.3 and Section 4.4, it is evident that the sprayed particle size, spray angle, spray direction, and natural gas flow rate all significantly influence the average residence time of particles. Specifically, when the sprayed particle size expands from 50 to 500 μm, the residence time drops sharply from 0.171 s to 0.023 s, representing an 86% reduction. When the spray angle widens from 60° to 120°, the residence time decreases from 0.107 s to 0.059 s, representing a 48% reduction. When the gas flow rate increases from 5000 to 15,000 Sm3/d, the residence time slightly decreases from 0.083 s to 0.075 s, representing a 10% reduction. Moreover, the average residence time across all co-current flow cases is 0.0775 s, which is approximately 4% lower than the average value for counter-current flow (0.0807 s). If particle secondary breakup is not considered, the order of influence is as follows: sprayed particle size > spray angle > flow rate > spray direction. To make the liquid stay longer in the pipeline for more effective gas–liquid contact, priority should be given to reducing the particle size, followed by adopting narrower spray angles and moderately lowering gas velocity where process conditions allow. Meanwhile, the spray direction can be flexibly configured due to its relatively minor impact.
4.6. The Influence of Particle Breakage and Film Formation
Through transient numerical simulations, triazine solution particles were steadily injected at the nozzle (position at 2000 mm) for 2 s. After taking into consideration the effects of particle secondary breakage and wall film formation, particle concentration and size distribution data were collected at five monitoring planes (Plane 2500 to Plane 25,000), as shown in Figure 1. Figure 8, Figure 9 and Figure 10 display the simulation results under 90° counter-current injection (sprayed particle size: 200 μm; natural gas flow rate: 10,000 Sm3/d). As can be seen, compared with earlier models that ignored particle breakup, the residence time of triazine particles in the pipeline increased significantly by orders of magnitude. It rose from milliseconds (less than 0.1 s), as shown in Table 1, to tens of seconds. Some particles were carried by the gas flow to the outlet 28 m downstream, while some particles smaller than 4 μm remained suspended in the pipe throughout the entire calculation period. This may be due to the detachment of the liquid film from the pipe wall and its re-entrainment into the flow field, where it undergoes Brownian motion. In addition, the fragmentation of particles along the pipeline can also be observed in Figure 8. After entering the pipeline at the 2000 mm nozzle position, the size of the triazine particles decreases rapidly. At 2500 mm in Plane1, the particle diameter drops below 20 μm, and then it further falls below 10 μm at 5000 mm in Plane2. After that, the subsequent fragmentation keeps the diameters under 2 μm until the particles reach the outlet. This indicates that larger particles, especially those much larger than 10 μm, are more likely to be dominated by gravity or form liquid films due to wall collisions. On the other hand, particles smaller than 5 μm have better gas-following characteristics because the Stokes drag is dominant. It is worth noting that when the particle size breaks below 10 μm, their suspended state provides a much larger specific surface area than wall-adhering liquid films. Thus, keeping the particles in droplet flow instead of forming liquid film on the wall is more beneficial for H2S absorption within limited pipeline lengths.
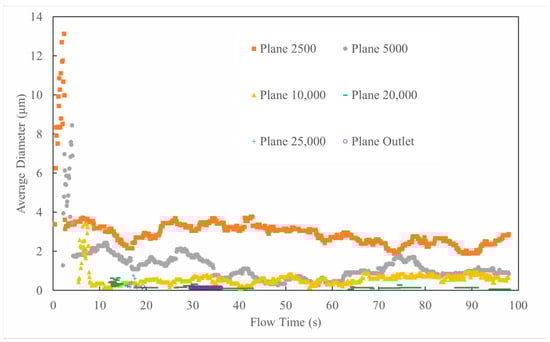
Figure 8.
Average particle diameter distribution on different cross-sections along pipeline (particle size: 200 μm; natural gas flow rate: 10,000 Sm3/d; 90° counter-current injection).
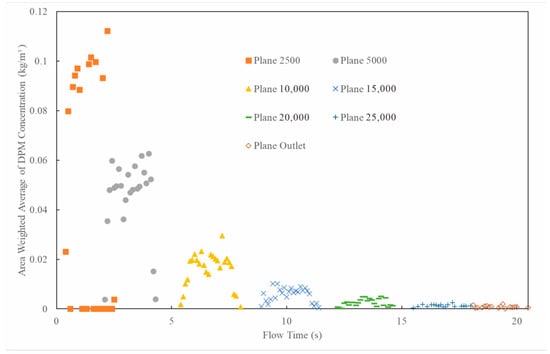
Figure 9.
Particle concentration distribution on different cross-sections along pipeline over flow time (particle size: 200 μm; natural gas flow rate: 10,000 Sm3/d; 90° counter-current injection).
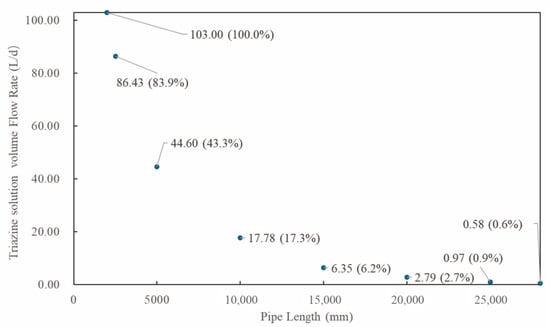
Figure 10.
The distribution of triazine solution particle flow rate along pipeline (particle size: 200 μm; natural gas flow rate: 10,000 Sm3/d, 90° counter-current injection).
Figure 9 and Figure 10 show the distribution patterns of particle concentration across different cross-sections over time and along the pipeline length, respectively. It can be seen from the figures that as the gas flows, the particle concentration at 5000 mm plane has dropped to below 50% compared to the initial concentration of the triazine particle solution at the nozzle (103 L/d) and continues to decline along the pipeline. By the outlet cross-section, less than 1% of the triazine solution particles are carried out by the gas flow. This demonstrates that most triazine particles have deposited on the pipe wall, while only a minimal proportion of smaller particles (<2 μm) can reach and exit through the outlet. Thus, when the pipe length is sufficient, the triazine solution will be completely consumed during the injection process, achieving efficient absorption of H2S.
The distribution of particle conditions under different operating conditions along the pipeline is shown in Figure 11, Figure 12 and Figure 13.
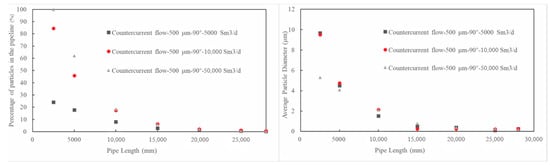
Figure 11.
The distribution of triazine solution particles along the pipeline under different natural gas flow rates.
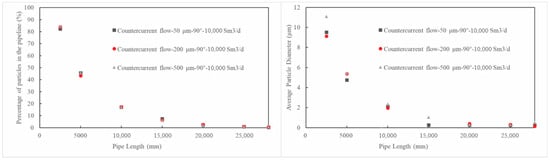
Figure 12.
The distribution of triazine solution particles along pipeline under different injected particle sizes.
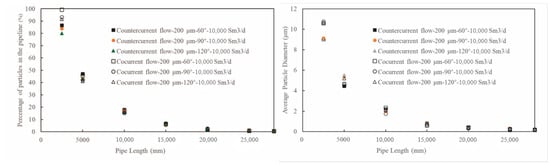
Figure 13.
The distribution of triazine solution particles along the pipeline under different spray settings.
As can be seen from Figure 11, the concentration of the triazine particle solution decreases along the pipe length at all gas flow rates; however, as the flow rate decreases, the rate of concentration decline increases. This indicates that if more triazine particles are to be maintained in the pipe, the flow rate should be increased appropriately; however, it should also be noted that at various flow rates, the triazine particles in the pipe are almost exhausted near the outlet. Additionally, increasing the flow rate also benefits the degree of secondary breakage of the particles, which increases the specific surface area of the particles to promote H2S absorption. For example, at the 2500 mm plane and a flow rate of 50,000 Sm3/d, the particle diameter has been broken down to below 4 μm, whereas at 10,000 and 5000 Sm3/d, the particle diameter remains around 10 μm.
Figure 12 shows that the initial sprayed particle size has a negligible effect on the distribution of particles along the pipe length. However, closer to the spray nozzle (such as at 2500 mm), the average particle diameter of the secondary breakage particles produced by a larger initial sprayed particle size (500 μm) is still slightly larger than that from a smaller initial particle size (9.1 μm when it is 200 μm and 9.5 μm when it is 50 μm), indicating that a smaller initial sprayed particle size promotes secondary breakage of the particles more effectively. Figure 13 shows that the spray angle and spray direction have little overall impact on the distribution and breakage of particles in the pipe, except near the nozzle, when a counter-current spray and a small angle is used, the particle concentration in the pipe is slightly higher and the formed secondary breakage particle diameter is slightly smaller. This may benefit the reaction of the solution in the pipe.
5. Conclusions
This study employs CFD simulation with the DPM to investigate the desulfurization process through sprayed nozzles in small-diameter pipelines. We systematically investigate the effects of the four key parameters: initial sprayed particle diameter (50–500 μm), spray angle (60°, 90° and 120°), natural gas flow rate (5000–50,000 Sm3/d), and spray direction (co-current/counter flow) on particle behavior in DN80 pipelines. The key findings are as follows.
Whether or not particle secondary breakup is considered, the initial sprayed particle diameter is the most crucial factor affecting gas–liquid contact efficiency. Smaller droplets (50 μm), which have weak inertial forces, can be easily entrained by the gas flow, and larger droplets (500 μm) are more likely to hit the pipeline wall and form liquid films. The sprayed angle has a secondary impact. Compared to a 120° wide-angle injection, a 60° narrow-angle injection can increase the average residence time of particles. Although higher natural gas flow rates shorten the residence time, they significantly promote droplet breakup—particularly at higher flow rates (50,000 Sm3/d), where droplets rapidly break up into sizes below 4 μm and substantially expand the reaction interfaces. The spray direction (co-current/counter flow) has the least impact. The differences in residence time, the particle distribution along the pipeline, and particle size between the counter-current and co-current modes are all less than 4%.
When the particles hit the wall, primary and secondary particles larger than 10 μm tend to deposit on the pipe wall as liquid films, whereas those smaller than 5 μm mainly stay suspended in the pipe. These suspended particles have much larger specific surface areas, making them more effective than wall films for H2S absorption.
When the pipeline is sufficiently long (for example, 28 m in this simulation), less than 1% of ultrafine droplets (smaller than 2 μm) will exit the pipe outlet. Most of the particles are consumed through forming wall films or reacting. When the pipeline is short (less than 5 m), the selection of the nozzle structure should consider the balance of the effects of particle breakage and wall filming. The recommended sprayer parameters are an initial particle size of about 50 μm, a 60° spray injection, and a high natural gas flow rate.
Author Contributions
Conceptualization, J.L.; methodology, Y.H.; software, X.W.; validation, X.W. and J.M.; formal analysis, Z.P.; investigation, J.L. and C.Y.; resources, X.W. and J.M.; data curation, Z.P.; writing—original draft preparation, J.L.; writing—review and editing, C.Y. and Y.H.; visualization, Z.P.; supervision, J.L.; project administration, J.L. All authors have read and agreed to the published version of the manuscript.
Funding
This research was funded by the Research Institute of Natural Gas Technology, grant number [JS2024-145].
Data Availability Statement
The original contributions presented in this study are included in the article. Further inquiries can be directed to the corresponding author.
Acknowledgments
This work was financially supported by the Research Institute of Natural Gas Technology Research Project JS2024-145.
Conflicts of Interest
Authors Junqiang Li, Chaoyue Yang, Ya Huang were employed by the Research Institute of Natural Gas Technology, PetroChina Southwest Oil & Gasfield Company. Author Zicheng Peng was employed by the PetroChina Southwest Oil & Gasfield Company. Authors Xin Wen and Jie Min were employed by the Natural Gas Purification Plant General, PetroChina Southwest Oil & Gasfield Company. The research was conducted in the absence of any commercial or financial relationships that could be construed as a potential conflict of interest. The companies had no role in the design of the study; in the collection, analyses, or interpretation of data; in the writing of the manuscript, or in the decision to publish the results.
References
- Kemfert, C.; Praeger, F.; Braunger, I.; Hoffart, F.M.; Brauers, H. The Expansion of Natural Gas Infrastructure Puts Energy Transitions at Risk. Nat. Energy 2022, 7, 582–587. [Google Scholar] [CrossRef]
- Cardinale, R. From Natural Gas to Green Hydrogen: Developing and Repurposing Transnational Energy Infrastructure Connecting North Africa to Europe. Energy Policy 2023, 181, 113623. [Google Scholar] [CrossRef]
- Vakili, M.; Koutník, P.; Kohout, J. Addressing Hydrogen Sulfide Corrosion in Oil and Gas Industries: A Sustainable Perspective. Sustainability 2024, 16, 1661. [Google Scholar] [CrossRef]
- Abdulrahman, A. Process Simulation and Optimization of Dimethyl Ether (DME) Synthesis Utilizing Highly Contaminated Natural Gas as Feedstock. Processes 2025, 13, 1872. [Google Scholar] [CrossRef]
- Xu, L.; Wen, S.M.; Huang, H.F.; Tang, Y.F.; Wang, Y.F.; Pan, C.F. Corrosion Failure Prediction in Natural Gas Pipelines Using an Interpretable XGBoost Model: Insights and Applications. Energy 2023, 325, 136157. [Google Scholar] [CrossRef]
- Lei, Y.; Du, L.; Liu, X.Y.; Yu, H.S.; Liang, X.D.; Kontogeorgis, G.M.; Chen, Y.Q. Natural Gas Sweetening Using Tailored Ionic Liquid–Methanol Mixed Solvent with Selective Removal of H2S and CO2. Chem. Eng. J. 2023, 476, 146424. [Google Scholar] [CrossRef]
- Mei, X.; Luo, Z.Q.; Xu, Q.; Tian, X.P.; Tang, Y. Optimization and High-Efficiency Application of Dry Method Desulfurizer for Remote Gas Wells with Medium and Low Sulfur Content. Chem. Eng. Oil Gas 2021, 50, 1–6. [Google Scholar]
- Du, X.L.; Dai, X.J.; Li, Z.C.; Du, X.F.; Shi, H.B.; Wu, J.Y.; Lou, H.; Feng, X.; Zhao, L.; Li, Z.N. Corrosion Analysis and Anti-Corrosion Measures of Oil Casing of Sulfur Content Gas Wells: A Case Study of Daniudi Gas Field in the Ordos Basin. Energy Rep. 2021, 7, 1280–1292. [Google Scholar] [CrossRef]
- Abotaleb, A.; Gladich, I.; Alkhateeb, A.; Mardini, N.; Bicer, Y.; Sinopoli, A. Chemical and Physical Systems for Sour Gas Removal: An Overview from Reaction Mechanisms to Industrial Implications. J. Nat. Gas Sci. Eng. 2022, 106, 104755. [Google Scholar] [CrossRef]
- Lincke, M.; Petasch, U.; Gaitzsch, U.; Tillmann, A.; Tietze, M.; Niebling, F. Chemoadsorption for Separation of Hydrogen Sulfide from Biogas with Iron Hydroxide and Sulfur Recovery. Chem. Eng. Technol. 2020, 43, 1564–1570. [Google Scholar] [CrossRef]
- Shingan, B.; Timung, S.; Jain, S.; Singh, V.P. Technological Horizons in Natural Gas Processing: A Comprehensive Review of Recent Developments. Sep. Sci. Technol. 2024, 59, 1216–1240. [Google Scholar] [CrossRef]
- Saji, V.S. Research Advancements in Sulfide Scavengers for Oil and Gas Sectors. Rev. Chem. Eng. 2021, 37, 663–686. [Google Scholar] [CrossRef]
- Roman, M.N.; Diaz, M.A.; Coll, D.S. Study of the Reaction Mechanism of Triazines and Associated Species for H2S Scavenging. ACS Omega 2023, 8, 12165–12172. [Google Scholar] [CrossRef]
- Liu, G.H.; Zhu, L.; Cao, W.H.; Liu, H.M.; He, Y.D. New Technique Integrating Hydrate-Based Gas Separation and Chemical Absorption for the Sweetening of Natural Gas with High H2S and CO2 Contents. ACS Omega 2021, 6, 26180–26190. [Google Scholar] [CrossRef] [PubMed]
- GB17820-2018; Natural Gas. The State Administration for Market Regulation (SAMR); Standardization Administration of China: Beijing, China, 2018. Available online: https://openstd.samr.gov.cn/bzgk/gb/newGbInfo?hcno=C7F5861DFDE1788307F7B8E64C9B039C (accessed on 20 November 2025).
- Fiorot, R.G.; Carneiro, J.W.d.M. The Mechanism for H2S Scavenging by 1,3,5-Hexahydrotriazines Explored by DFT. Tetrahedron 2020, 76, 131112. [Google Scholar] [CrossRef]
- Ahmed, A.; Elkatatny, S.; Onaizi, S. Evaluating Diethylamine and Triethylamine as Alternative Amine-Based H2S Scavengers for Safe and Efficient Drilling in Sour Conditions. ACS Omega 2025, 10, 31492–31500. [Google Scholar] [CrossRef] [PubMed]
- Koue, A.M.; Szlek, K.A.; Kucheryavskiy, S.; Maschietti, M.; Pedersen, C.M. Urea Derivatives as H2S Scavengers. Molecules 2025, 30, 906. [Google Scholar] [CrossRef]
- Eylander, J.G.R.; Holtman, H.A.; Salma, T.; Yuan, M.; Callaway, M.; Johnstone, J.R. The Development of Low-Sour Gas Reserves Utilizing Direct-Injection Liquid Hydrogen Sulphide Scavengers. In Proceedings of the SPE Annual Technical Conference and Exhibition, New Orleans, LA, USA, 30 September–3 October 2001. [Google Scholar]
- Jamal, A.; Leppin, D.; Fisher, K. Design of Direct Injection H2S Scavenging Systems. In Proceedings of the Laurance Reid Gas Conditioning Conference, Norman, OK, USA, 14–16 February 2005; pp. 279–303. [Google Scholar]
- Campus, E. CFD Simulation of H2S Scavenger Injection. Master’s Thesis, Aalborg University, Campus Esbjerg, Esbjerg, Denmark, 2019. [Google Scholar]
- Leppin, D.; Fisher, K.; Matonis, D. Modeling Direct Injection of H2S Scavenger in Pipelines: Laboratory Investigations and Improved Computer Model. In Proceedings of the 88th Annual GPA Convention, San Antonio, TX, USA, 23–26 March 2009. [Google Scholar]
- Linga, H.; Nilsen, F.P. Prediction Model Optimises H2S Scavenger Injection Strategy. In Proceedings of the Sulphur Conference, Banff, AB, Canada, 2–5 November 2003. [Google Scholar]
- Umuteme, O.M. Computational Fluid Dynamics (CFD) Transient Pressure and Temperature Simulation of a Natural Gas–Hydrogen Gas Blend Transportation Pipeline. Int. J. Innov. Res. Dev. 2020, 9, 112–116. [Google Scholar] [CrossRef]
- Umuteme, O.M.; Islam, S.Z.; Hossain, M.; Karnik, A. Computational Fluid Dynamics Simulation of Natural Gas Hydrate Sloughing and Pipewall Shedding Temperature Profile: Implications for CO2 Transportation in Subsea Pipeline. Gas Sci. Eng. 2023, 116, 205048. [Google Scholar] [CrossRef]
- Davidy, A. CFD Simulation of Hydrogen Sulfide (H2S) Desulfurization Using Ionic Liquids and Graphene Oxide Membrane. Fuels 2023, 4, 363–375. [Google Scholar] [CrossRef]
- Xie, L.; Zhu, J.D.; Ramírez, M.; Jiang, C.W. CFD-Single Particle Modeling and Simulation of the Removal of H2S in a Packed-Bed Bioreactor. J. Environ. Chem. Eng. 2021, 9, 105692. [Google Scholar] [CrossRef]
- Teuber, K.; Broecker, T.; Bentzen, T.R.; Stephan, D.; Nützmann, G.; Hinkelmann, R. Using Computational Fluid Dynamics to Describe H2S Mass Transfer Across the Water–Air Interface in Sewers. Water Sci. Technol. 2019, 79, 1934–1946. [Google Scholar] [CrossRef] [PubMed]
- Haijun, Z.; Hao, H.; Pengfei, W.; Wensheng, Z. Numerical investigation of gas–liquid two-phase flow in a U-tube of a spray cooling system. Ann. Nucl. Energy 2025, 213, 111111. [Google Scholar]
- Yongchao, R.; Shuli, W.; Lijun, L. Numerical Simulation of the Flow Pattern of Spiral Annular Flow with a Guide Strip by Spiral On-Way. ACS Omega 2022, 7, 31961–31973. [Google Scholar] [CrossRef]
- Chernikov, V.; Semakina, E. Experimental and Numerical Studies of the Aerodynamics of Stationary Two-Shaft Gas Turbine Exhaust System. Energies 2023, 16, 3671. [Google Scholar] [CrossRef]
- Vigueras-Zuniga, M.O.; Tejeda-del-Cueto, E.M.; Mashruk, S.; Kovaleva, M.; Ordonez-Romero, C.L.; Valera-Medina, A. Methane/Ammonia Radical Formation During High Temperature Reactions in Swirl Burners. Energies 2021, 14, 6624. [Google Scholar] [CrossRef]
- Volodymyr, B.; Ievgen, M. Terminal velocity and drag coefficient of a smooth steel sphere moving in the water-filled vertical and inclined glass pipe (Newton regime). Powder Technol. 2024, 446, 120120. [Google Scholar] [CrossRef]
Disclaimer/Publisher’s Note: The statements, opinions and data contained in all publications are solely those of the individual author(s) and contributor(s) and not of MDPI and/or the editor(s). MDPI and/or the editor(s) disclaim responsibility for any injury to people or property resulting from any ideas, methods, instructions or products referred to in the content. |
© 2025 by the authors. Licensee MDPI, Basel, Switzerland. This article is an open access article distributed under the terms and conditions of the Creative Commons Attribution (CC BY) license (https://creativecommons.org/licenses/by/4.0/).