Abstract
Three-dimensionally printed (3DP) samples with quartz sand effectively avoid the heterogeneity of reservoir rocks in underground gas storage (UGS), providing reliable supports for rock mechanics research under cyclic injection–production pressures. A study on the mechanical properties of 3DP rock samples was conducted by coupling triaxial tests with discrete element method (DEM) simulation. Key results are as follows: (1) The graded particle model (GPM) based on actual particle size distribution (PSD) closely matched experimental data, with an average peak strength error of 1.13%. (2) Cyclic saturation post-processing with silica sol significantly enhanced mechanical properties, increasing peak strength from 5.70 to 52.84 MPa and inducing a plastic-to-brittle failure transition. A power-law relationship was identified between saturation cycles and macroscopic strength. (3) DEM simulations revealed that bond effective modulus linearly controls Young’s modulus. The influence of cohesion on peak strength is greater than that of the friction angle, and the bond stiffness ratio regulates shear failure threshold. The cohesion force is 50 MPa, and the peak strength has been increased to 107.89 MPa. (4) Enhancing particle cohesive strength was key to improving the mechanical properties of 3DP rock samples. This study provides a reliable framework for customized 3DP rock preparation and UGS-related mechanical simulations.
1. Introduction
Natural rock, as a heterogeneous porous medium, is the key medium for UGS reservoirs, caprocks, and wellbore surrounding rocks; its complex mechanical response directly determines the safety of UGS cyclic gas injection–production, the stability of reservoir space, and the sealing performance of caprocks. A thorough understanding of the rock’s mechanical properties is of vital importance for ensuring the safe operation and stable development of UGS [1]. The intricate mineral composition, inherent heterogeneity, variable porosity, anisotropy, grain size distribution, cementation degree, and pre-existing microcracks of natural rock collectively make the accurate characterization of rock mechanical parameters and the determination of the mechanical failure mechanism during rock damage evolution a challenging task [2,3]. Currently, laboratory experimentation and in situ testing are the most straightforward and effective methods for acquiring mechanical parameters from natural rock samples for UGS engineering. However, these tests are usually destructive: for example, laboratory triaxial tests can only obtain the mechanical response of rock samples under a single stress path, which cannot fully simulate the dynamic stress environment of UGS rocks during long-term injection–production cycles; in situ testing of deep UGS reservoirs is also limited by high cost and difficult sampling. These limitations further increase the uncertainty of the experimental results on heterogeneous rock samples, which in turn affects the reliability of UGS numerical simulations and the optimization of injection–production schemes.
Three-dimensional printing technology has been applied by researchers in the fields of rock mechanics and geological engineering [4,5,6,7,8,9]. Three-dimensional printing technology enables precise control over the size of rock samples, greatly reduces sample preparation time, accurately controls material usage, and avoids variability caused by the heterogeneity of natural rock masses [10,11,12]. To explore the applicability of 3D printing technology in the field of rock mechanics, researchers have chosen various types of polymers as raw materials for 3DP rock samples [13,14,15,16,17]. The 3DP rock samples based on gel materials exhibit strong ductility [18,19], while the 3DP rock samples made from resin materials and gypsum powder have mechanical properties closer to those of natural rocks [20,21]. However, existing studies primarily focus on two isolated aspects: either structural fabrication of 3DP rocks or DEM simulations inversed from natural rock parameters. Few efforts have quantified the links between 3DP rocks’ mechanical properties and their raw material parameters or post-processing conditions. This gap limits the customized preparation of 3DP rocks for UGS-specific stress scenarios. Additionally, the coupling of 3DP samples with controlled PSD and DEM to predict elastoplastic behavior remains understudied, hindering reliable UGS numerical simulations. Focusing on material suitability and process control, Song et al. [22] demonstrated that 3DP coated silica beads align with high-permeability sedimentary rocks in properties, while gypsum powder emulates shale and mudstone, a conclusion that dovetails with Primkulov et al. [23]’s work on furfuryl alcohol resin–sand systems, where 80 °C curing was identified as optimal and underscored how material composition and post-processing jointly dictate mechanical performance. For fluid–rock interaction properties, Ardila et al. [24] linked binder saturation in silica sand and poly-furfuryl alcohol samples to wettability variations via spontaneous imbibition tests, and this focus on binder effects extends to Gomez et al. [25]’s observation that 3DP silica sand cores exhibit greater compressibility and permeability resilience than natural sandstones. When addressing defects and structural design, Sharafisafa et al. [26] used digital imaging and experiments to show that flawed material compositions enhance load-bearing capacity and that defect morphology governs microcrack evolution, a finding that informed Zhang et al. [27]’s comparative analysis of printing technologies. Vogler et al. [28] verified through the Brazilian splitting test that 3D-printed samples exhibited tensile damage and had the same weak characteristics as natural sandstone. Ahmed et al. [29] further refined this understanding, indicating that its elastic modulus is related to the ratio of span to thickness, jointly confirming that 3D-printed samples based on sandstone are reliable substitutes. Across these investigations, a consistent thread emerges: silica sand-based 3DP samples closely mirror natural rocks in macro–micro properties [30,31,32]. Three-dimensionally printed rock samples can serve as a good substitute for natural rock materials in certain studies of rock mechanical properties.
In recent years, advancements in numerical simulation methodologies have provided an alternative tool for the study of microfracture mechanisms of rock, which could visualize the stress and strain fields within the rock and illustrate its structural changes [33]. From the perspective of continuum mechanics, these methods can be broadly classified as follows: the finite element method [34,35,36,37], the boundary element method [38,39], the finite difference method [40], and the extended finite element method [41,42]. From the perspective of discontinuous mechanics, the DEM [43,44,45] and discontinuous deformation analysis [46] are particularly significant. Additionally, novel methodologies have been proposed, such as the finite discrete element method, which integrates both finite element and discrete element approaches [47,48]. Among these numerical techniques, the particle-based DEM is a widely used approach for simulating the micromechanical properties of rocks [49]. The evolution of microcracks in sandstone with non-coplanar orientations can be effectively studied by integrating discrete element software with laboratory uniaxial compression experiments [50]. Haeri et al. [51] used PFC2D software to simulate three-point bending tests on samples with pre-existing cracks. The results demonstrated that the DEM is effective in modeling crack propagation. Hou et al. [52] used discrete element numerical simulations to analyze the effects of different gravel particle sizes on the failure of surrounding rock and the propagation of wellbore fractures. Liu et al. [53] proposed an improved fluid flow model for fractured porous media and coupled it with the DEM model to simulate the interaction between fluids and adjacent fractures at a constant injection rate. Huang et al. [54] developed two distinct two-dimensional models using the DEM to investigate the influence of rock particle size on fracture propagation during hydraulic fracturing. Li et al. [55] proposed a microstructural model of multistage parallel-bound particles to study the mechanical response characteristics and failure behavior of rock materials at the particle scale. Abdellah et al. [56] applied DEM to calibrate natural rock mechanics via uniaxial/triaxial tests, focusing on grain shape effects. Additionally, Vasyliev et al. [57] proposed an improved method to calculate uniaxial compressive strength of cylindrical rocks by correcting for end effects. Existing studies have mostly focused on either 3D printing-based structural fabrication of rock-like specimens or DEM simulations inversed from macroscopic parameters of natural rocks, but they lack quantitative coupling between 3DP samples with controlled PSD and DEM.
This study integrates 3D printing technology with DEM numerical simulation. It achieves material controllability and accurate simulation of rock failure and microfracture propagation, providing critical technical support for simulating the mechanical behavior of rocks in key parts of UGS. The established graded particle models and homogeneous particle models are verified by experiments, laying a foundation for UGS numerical simulations. Further 3D simulations explore how rock microscopic parameters and heterogeneity affect macroscopic properties, helping reveal UGS reservoir rock mechanical deterioration under cyclic injection–production pressures and caprock microfracture laws. Additionally, the study quantifies binder post-treatment’s regulatory effect on microscopic cohesion via cyclic saturation experiments, providing a basis for solving UGS engineering problems such as reservoir rock bonding attenuation and caprock cohesion decline.
2. Materials and Methods
2.1. Sample Preparation and Experimental Setup
In this study, quartz sand was selected as the raw material for the 3DP rock samples, which consisted of 95% quartz sand and 5% resin polymer. Quartz sand is typically a gray-black sphere, with silica as its main component. Its characteristics of high-temperature resistance and chemical inertness not only support potential applications in complex engineering environments but also ensure the stability of samples, avoiding interference of the raw material’s own chemical reactions on mechanical test results [58]. Its spherical-like morphology facilitates the simplification of the particle contact model in DEM simulations, reducing the complexity of parameter calibration. The preparation of 3DP rock samples was carried out using the VX-2000 3D printing (Voxeljet (Suzhou) 3D Printing Co., Ltd., Suzhou, China) machine. The standard core size of 25 mm × 50 mm was input into the controller, with a printing resolution of 600 dpi and a layer thickness of 0.1 mm. After printing, the samples were cured at 60 °C for 24 h to ensure resin solidification. This size follows the International Society for Rock Mechanics standard for rock triaxial compression tests.
2.2. Analysis of Experimental Results
Triaxial compression testing was performed under confining pressures of 3 MPa, 6 MPa, and 9 MPa, and the stress–strain curves of the 3DP rock samples were obtained. Simultaneously, the cohesion (C) and internal friction angle (φ) were determined by fitting the confining pressure and the maximum principal stress from the experimental data. The results showed that, under different confining pressures, the triaxial peak strengths of the three 3DP rock samples were 22.39 MPa, 33.82 MPa, and 46.14 MPa, respectively. The Young’s moduli were 2.93 GPa, 4.73 GPa, and 6.06 GPa, respectively. The Poisson’s ratios were 0.234, 0.257, and 0.209, respectively. The cohesion was 2.30 MPa, and the angle of internal friction was 41.62°.
From the stress–strain curve in Figure 1 and the photographs of the damaged core, it can be observed that the failure mode of the 3DP rock samples is partial crushing, with distinct shear cracks, exhibiting typical plastic behavior. This phenomenon is linked to the sample preparation process. The initial epoxy resin bonding between quartz sand particles is weaker than natural cementation in sandstones. The accumulation of spherical quartz sand particles results in a greater frictional force between the particles, leading to a higher internal friction angle. “Low-cohesion, high-friction” are the typical characteristics of 3DP rock samples, as they balance the weak artificial binder and strong granular interlocking. The macroscopic mechanical parameters of the 3DP rock samples, obtained from the triaxial compression testing, will provide a basis for calibrating the microscopic parameters in the subsequent discrete element numerical simulation.
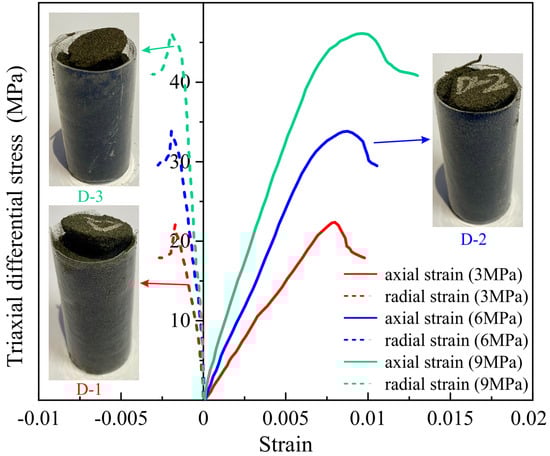
Figure 1.
Stress–strain curve of 3DP rock samples.
3. Numerical Simulation of Rock Mechanics Based on DEM
Numerous laboratory triaxial test results indicate that the stress–strain curves of rock samples follow an elastic–plastic constitutive model. Based on DEM numerical simulations, this chapter further examines the influence of the micromechanical parameters of 3DP rock samples on their mechanical properties. Section 3.1 primarily discusses the theory underlying DEM simulations, while Section 3.2 details the model construction and verification process.
3.1. Numerical Simulation Methodology of DEM
The parallel bond model in PFC3D 5.0 software is applied to simulate 3DP rock samples. This model characterizes the cementation of microscopic minerals by establishing bonds between particles [59]. The schematic diagram of the linear parallel bond model is shown in Figure 2. Core assumptions include the following: (1) particles are homogeneous, isotropic, and rigid; (2) bonds transmit force/moment and break when stress exceeds tensile/shear strength; (3) contact stiffness is determined by the bond effective modulus and stiffness ratio. This model is selected because it accurately captures the granular–binder interaction of 3DP rocks, which is dominated by interparticle bonding failure [49].
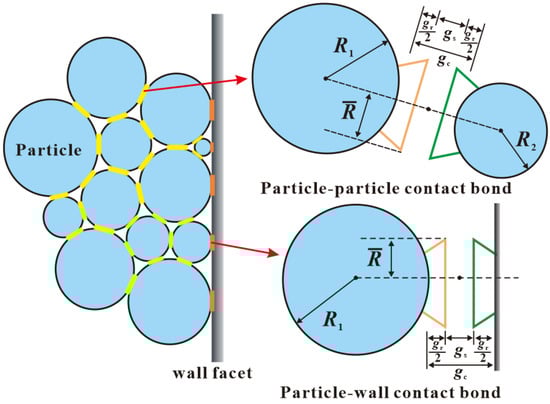
Figure 2.
Schematic of the linear parallel bond model.
The parallel bond model can accurately and effectively simulate the micromechanical properties of rock particles and their interparticle cementation. Therefore, this model can be used to simulate the triaxial compression testing of the 3DP rock samples, verify the accuracy and applicability of the model parameters, and study the influence of different microscopic parameters on the mechanical properties of rock.
To clarify the microscopic parameters used in DEM simulations, Table 1 summarizes the key parameters of particles and walls, with values determined based on physical properties of quartz sand, conventional ranges of rock DEM simulations, and preliminary matching between pre-simulations and experimental data.

Table 1.
Microscopic parameters of particles and walls in DEM simulations.
3.2. Modeling and Validation
The DEM model is established based on a standard cylindrical rock sample with dimensions of 25 mm in diameter and 50 mm in height. The DEM in PFC3D 5.0 software is constructed using the microscopic properties of the discrete particle units, while the macromechanical response characteristics of the rock are represented through the interactions of these microscopic particles. The size of the microscopic particles affects the results of the model calculations, so it is necessary to account for particle heterogeneity. In this study, two types of rock models are developed for analysis. The first model is a graded particle model (GPM), designed according to the particle grading standard of quartz sand, as shown in Figure 3a. The primary aim of this model is to calibrate the macromechanical parameters of the rock obtained from experiments, which will then be used to determine the corresponding micro-parameter values for the numerical simulation. These values are compared with the triaxial compression experimental data of the 3DP rock samples to refine the DEM model. The second model is a homogeneous particle model (HPM), as shown in Figure 3b.
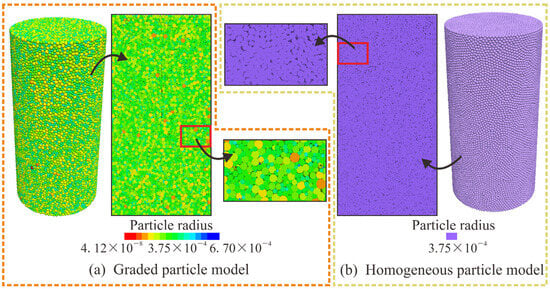
Figure 3.
Schematic of the DEM triaxial compression model.
For the GPM, the particle radii strictly adhere to the particle gradation characteristics of the 3DP samples, as shown in Figure 4. For the HPM, the particle radius is set to 0.75 based on calculations to ensure the average particle radius of the two models remains consistent. The HPM is not intended to replicate real PSD; instead, it serves as a control to isolate the effect of particle gradation heterogeneity. By matching the HPM’s average particle radius to the GPM, we eliminate the influence of particle size magnitude, focusing solely on whether gradation dispersion affects macroscopic properties.
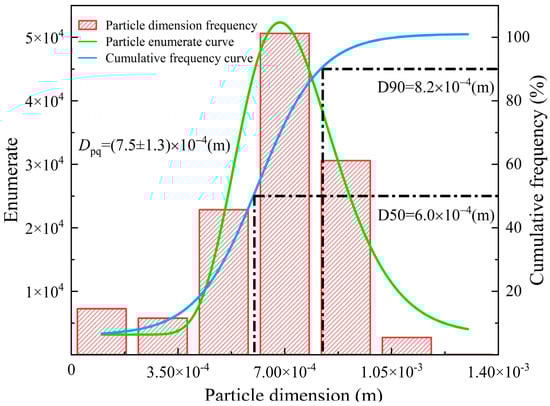
Figure 4.
Histogram of particle gradation.
The numerical simulations were based on the calibrated baseline parameters listed in Table 1. As shown in Figure 5, for the GPM, the average relative error of peak strength compared with experimental results was 1.13%, and that of peak axial strain was 4.14%. The cohesion and internal friction angle of GPM were 2.23 MPa and 41.84°, respectively, with relative errors of 3.04% and 0.53% compared to experimental values, confirming the reliability of the calibrated parameters.
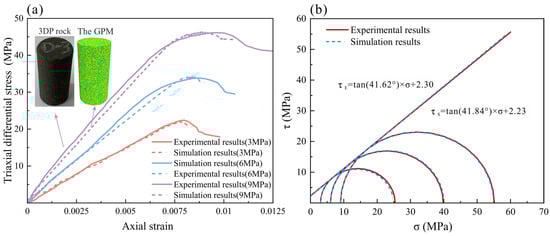
Figure 5.
Comparison between experiments and numerical simulations. (a) Stress–strain curve. (b) Mohr circle.
It is worth noting that the average relative error in the peak axial strain between the numerical simulation and experimental results is 4.14%, which differs from the error in the peak strength. This discrepancy arises because the actual 3DP rock samples inevitably exhibit variations due to the influence of the printing process. These factors cannot be eliminated and may cause fluctuations in the experimental curve. Taking the sample under a confining pressure of 6 MPa as an example, at the beginning of the experiment, the sample is in a compacted state, and Young’s modulus is low. As the experiment progresses, the sample becomes fully compacted, and Young’s modulus increases and eventually stabilizes. Simultaneously, due to the typical plastic behavior of the 3DP rock samples, after reaching the peak strength, the stress–strain curve fluctuates horizontally for a prolonged period before gradually decreasing. In contrast, the GPM does not exhibit variations due to the printing process and can be treated as an ideal elastoplastic material. In the numerical simulation, the stress increases linearly with axial strain, and Young’s modulus remains constant at a stable value. After reaching the peak strength, the stress–strain curve of the GPM also decreases slowly; however, its horizontal fluctuation is much smaller than that observed in the 3DP rock samples. This phenomenon demonstrates that slight differences still exist between 3DP rock and ideal elastoplastic materials.
3.3. Relationship Between Binder and Cohesion in 3DP Rock Samples
The binder’s chemical composition and physical properties critically affect the strength of 3DP rock, with variations in type (e.g., epoxy, furan) and concentration directly influencing their mechanical properties [60,61,62]. The post-processing of binders plays a crucial role in regulating the mechanical strength of 3DP rock. Furan resin solidifies at elevated temperatures; however, if the temperature exceeds a critical threshold, the chemical bonds within the furan resin degrade, leading to a loss of structural integrity [63]. Research indicates that the optimal curing temperature range for furan resins, ensuring maximum curing efficiency and specimen strength, is between 78 °C and 80 °C [23,64]. Experimental studies have demonstrated that a combined post-treatment approach involving “resin infiltration followed by low-temperature curing” yields the most significant improvement in the compressive strength of sand-based 3DP specimens using furan resin as a binder [65]. Given that different binder post-processing techniques substantially influence the mechanical properties of 3DP rock, addressing the inherent limitations of binders and enhancing core strength through optimized post-processing is crucial for advancing 3D printing applications in rock mechanics.
In the cyclic saturation tests, the 3DP rock samples were immersed in a 30% mass fraction silica sol solution. One saturation cycle was defined as 12 h of immersion followed by 6 h of drying at 50 °C. The samples were subjected to zero, one, two, three, and five cyclic saturation treatments, respectively, and then subjected to uniaxial compression tests to evaluate the mechanical property changes. The experimental results are presented in Table 2. As the number of cyclic saturation cycles increased, the peak strength of the samples gradually increased from 5.70 MPa to 52.84 MPa, while Young’s modulus rose from 0.36 GPa to 1.66 GPa. Additionally, the failure transitioned from plastic to brittle, as shown in Figure 6a. These results can be attributed to the presence of numerous intergranular pores within the 3DP rock structure. Repeated cyclic saturation allowed the binder to progressively infiltrate and fill these pores, strengthening the cementing interface and improving particle bonding, which ultimately enhanced the mechanical properties of the 3DP rock samples.
Table 2.
Experimental and numerical simulation results with different cyclic saturation cycles.
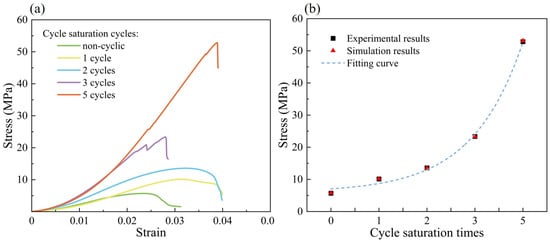
Figure 6.
Experimental and numerical simulation results under different cyclic saturation cycles of binder. (a) Stress–strain curve. (b) Fitting curve.
To further verify the mechanical strength evolution of 3DP rock samples after cyclic saturation, a DEM simulation was conducted using the GPM model based on the experimental results. By adjusting the microscopic cohesion parameter in the GPM model, the peak strength of 3DP rock samples corresponding to different cyclic saturation cycles was obtained. The experimental results are presented in Table 2. The fitting error for each data point was below 1%, indicating that the GPM model exhibits high predictive accuracy in simulating rock mechanics behavior under varying conditions. A clear power-law relationship exists among the number of cyclic saturation cycles (N) and macroscopic peak strength (σp) of 3DP rock samples, as shown in Figure 6b. This relationship can be expressed by the following equation:
where σp is the macroscopic peak strength of 3DP rock samples, N is the number of cyclic saturation cycles, and a1, b1, and c1 are empirical parameters determined by the 3DP material and binder type.
By combining the stress–strain curves and strength enhancement patterns in this study, the penetration path of the binder can be inferred to be consistent with the sample’s pore distribution. During the initial cycle, the binder preferentially fills the sample’s surface and large pores, and interparticle bonding mainly takes the form of point contact; this leads to limited improvement in cohesion. During multiple cycles, the binder penetrates into the internal small and medium pores under the drive of capillary action, gradually filling the contact gaps between particles. The bonding form then evolves from point contact to surface contact, which results in significant improvement in cohesion. This mechanism can be indirectly verified through the power-law relationship between strength and cycle number, as well as the plastic-to-brittle transition observed in this study.
4. Microscopic Parameter Analysis
The numerical results indicate that the GPM closely aligns with the experimental data of the 3DP rock samples, verifying the model’s accuracy. In the following sections, the microscopic characteristics of discrete particles are analyzed to evaluate their influence on the macroscopic mechanical properties of rock. By comparing the GPM with the HPM, the effect of inherent heterogeneity on rock mechanical parameters is investigated. It should be noted that the stiffness ratio (κ*), friction coefficient (μ*), cohesion (C*), internal friction angle (φ*), and bond effective modulus (E*) discussed in this section pertain to the microscopic properties of discrete particle elements and differ from the macroscopic rock mechanical parameters obtained in rock mechanics experiments.
4.1. Bond Effective Modulus
In the parallel bond model, microparticle units are assumed to be homogeneous and isotropic. The effective modulus and bond stiffness ratio are combined to calculate the normal and tangential stiffness of the model particles. The effective modulus specifically controls the normal stiffness of the particles. While the effective modulus is not equivalent to Young’s modulus of macroscopic materials, it directly influences Young’s modulus.
The bond effective moduli are set to 1 GPa, 3 GPa, 5 GPa, 7 GPa, and 9 GPa, and the numerical simulations of the triaxial compression tests on both the GPM and the HPM are carried out. The resulting stress–strain curves and the comparison between the effective modulus and peak differential stress are shown in Figure 7. Note that the stepwise increase in stress during the initial loading phase is an artifact of the simulation software. To ensure system stability during the confining pressure loading phase, the software automatically maintains a stable pressure state at specified time steps when the confining pressure reaches a certain value, resulting in the observed stepwise increase in the stress curve.
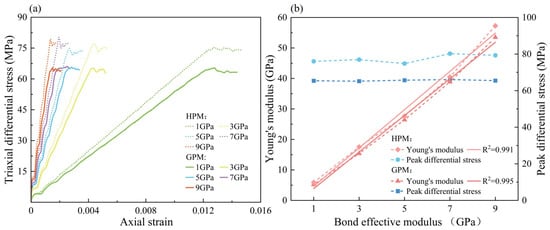
Figure 7.
Comparison of numerical simulations with different bond effective modulus. (a) Stress–strain curve. (b) Young’s modulus and peak differential stress.
The increase in the effective modulus has little effect on the peak strength. The peak strength of the GPM is 66.57 MPa, while that of the HPM is 77.65 MPa. The relationship between Young’s modulus and the effective modulus is linear. As the effective modulus increases from 1 GPa to 9 GPa, the Young’s modulus of the GPM increases from 5.22 GPa to 53.48 GPa, while the Young’s modulus of the HPM increases from 5.89 GPa to 57.27 GPa. However, the effective modulus significantly influences Young’s modulus. The stress–strain curve shifts significantly to the left as the effective modulus increases. The bond effective modulus directly determines the normal stiffness of particles during the elastic stage, thereby linearly controlling the macroscopic Young’s modulus of the rock.
4.2. Bond Stiffness Ratio
The bond stiffness ratio of the particles determines the tangential stiffness and maximum tangential stress, which in turn control the changes in stress and displacement, ultimately affecting the mechanical properties of the rock. Figure 8a presents the stress–strain curves of both the GPM and the HPM for bond stiffness ratios of 0.2, 0.4, 0.6, 0.8, and 1.0. The peak strength of both models increases with the bond stiffness ratio. The overall strength of the HPM exceeds that of the GPM, indicating that the inherent heterogeneity of the rock influences its mechanical properties.
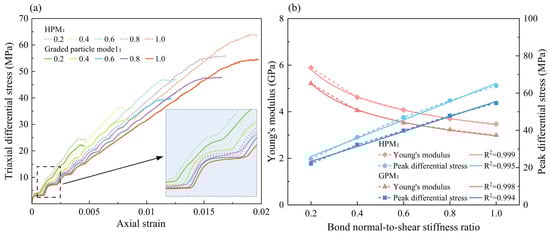
Figure 8.
Comparison of numerical simulations with different bond stiffness ratio. (a) Stress–strain curve. (b) Young’s modulus and peak differential stress.
To further explore the effect of the bond stiffness ratio on the macroscopic mechanical properties of the rock, the calculated Young’s modulus and peak strength values are plotted in Figure 8b. As the bond stiffness ratio increases from 0.2 to 1.0, Young’s modulus of the GPM decreases by 42.61%, from 5.21 GPa to 2.99 GPa, while that of the HPM decreases by 41.09%, from 5.89 GPa to 3.47 GPa. The peak strength of the GPM increases from 22.22 MPa to 54.66 MPa, and that of the HPM increases from 24.74 MPa to 63.93 MPa. Data fitting indicates that the bond stiffness ratio has a negative correlation with Young’s modulus (following a power function) and a positive linear correlation with peak strength, with the effect on peak strength being particularly pronounced.
4.3. Friction Coefficient
The coefficient of friction directly determines the shear strength of the particles. When the bond between particles is broken and they enter a state of extrusion, the sliding between the particles is influenced by the friction coefficient. The stress–strain curves for different friction coefficients are shown in Figure 9a, and the comparison between Young’s modulus and peak strength is shown in Figure 9b. It can be observed that as the friction coefficient increases, the peak strength and Young’s modulus of both models increase gradually. When the friction coefficient increases from 0.2 to 1.0, Young’s modulus and peak strength of the GPM increase from 5.21 GPa and 22.22 MPa to 6.21 GPa and 33.40 MPa, respectively. The Young’s modulus and peak strength of the HPM increase from 5.89 GPa and 24.74 MPa to 6.94 GPa and 38.83 MPa, respectively. The coefficient of friction shows a linear relationship with both Young’s modulus and peak strength, although its influence is relatively small.
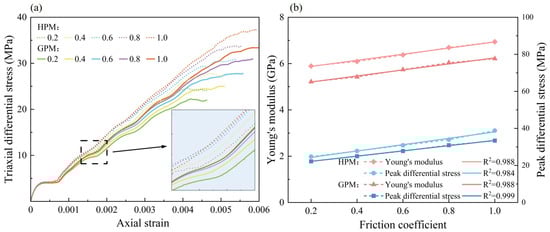
Figure 9.
Comparison of numerical simulations with different friction coefficient. (a) Stress–strain curve. (b) Young’s modulus and peak differential stress.
4.4. Cohesion
In the parallel bond model, both cohesion and the internal friction angle of the particle elements directly affect the degree of bonding between the particles and are crucial microscopic parameters for shear failure. Figure 10 shows the stress–strain curves of the GPM and the HPM for different cohesion values. It can be observed that the peak strength increases as cohesion increases. When the cohesion increases from 10 MPa to 50 MPa, the peak strength of the GPM rises from 22.22 MPa to 107.89 MPa, while the peak strength of the HPM increases from 24.74 MPa to 127.36 MPa. A strong linear positive correlation exists between cohesion and peak strength. Young’s modulus remains stable, with the GPM’s Young’s modulus at 5.22 GPa and that of the HPM at 5.90 GPa. Therefore, cohesion has a significant impact on the peak strength of both models but has a minimal effect on Young’s modulus.
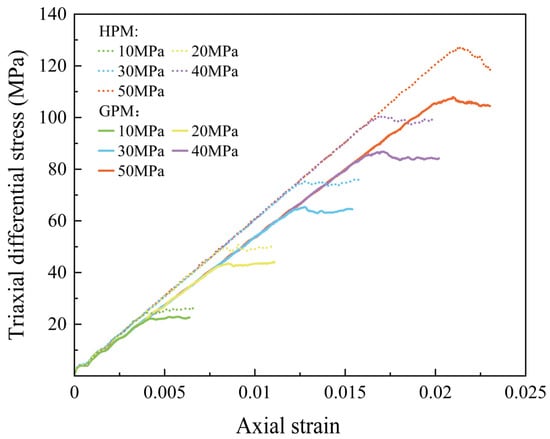
Figure 10.
Stress–strain curves of GPM and HPM with different cohesion.
It is important to note that changes in cohesion affect both the brittleness and plasticity of the rock. When the cohesion is 10 MPa, the stress–strain curve exhibits typical plastic behavior. As cohesion increases, the stress–strain curve gradually adopts a more brittle character, meaning that after reaching peak strength, the curve exhibits a rapid decay phase. This phenomenon is more pronounced in HPM. This change can be visualized using a discrete fracture network (DFN) implemented in the simulation. Figure 11a illustrates the evolution of microcracks in GPM under various cohesion levels during the simulation process. When the cohesion is 10 MPa, the cracks formed during compression are primarily shear fractures, and the rock core samples typically exhibit microcracking. As cohesion increases, the total number of microcracks decreases while the number of tensile cracks increases. The ratio of tensile to shear cracks approaches 1:1, and the rock samples develop visible macroscopic cracks. As cohesion increases further, the percentage of tension cracks rises from 7.55% to 40.63%, and the total number of cracks decreases significantly. As shown in Figure 11b, the crack density decreases linearly from 2.96 cracks/mm3 to 1.71 cracks/mm3 as cohesion increases. This trend is consistent with the plastic-to-brittle transition of macroscopic mechanical behavior. This quantitative relationship further confirms that improved cohesion changes the failure mode of 3DP samples from shear-dominated to mixed tension–shear.
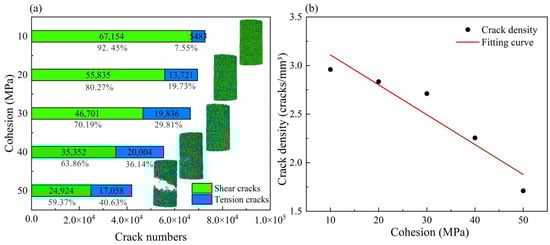
Figure 11.
Comparison of numerical simulations with different cohesion. (a) Cloud map of crack distribution. (b) Crack density.
4.5. Angle of Internal Friction
Increasing the internal friction angle results in a higher stress required for shear failure of the interparticle bonds, which, in turn, affects the peak strength of the core. A comparison of the obtained Young’s modulus and peak strength is shown in Figure 12. As the internal friction angle increases, the peak strength of the GPM increases from 22.22 MPa to 35.98 MPa, while the peak strength of the HPM increases from 24.74 MPa to 41.47 MPa. However, the Young’s modulus of both models remains largely unchanged, staying at 5.21 GPa and 5.59 GPa, respectively. Data fitting reveals a power-law relationship between the internal friction angle and peak strength. The influence of the internal friction angle on the macroscopic mechanical properties of the rock is similar to that of cohesion. Both parameters primarily affect the peak strength of the rock, with minimal impact on Young’s modulus. The key difference is that cohesion exhibits a strong linear positive correlation with peak strength, with a more pronounced influence, whereas the internal friction angle follows a power-law relationship with peak strength, and its influence is relatively smaller.
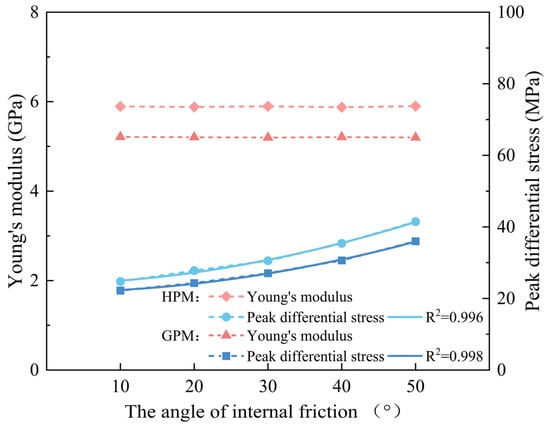
Figure 12.
The relationship between Young’s modulus and peak differential stress and angle of internal friction.
To better investigate the effects of microscopic parameters and rock inherent heterogeneity on the macroscopic mechanical properties of rocks, the relationships between peak strength, peak strain, and Young’s modulus for the two model types were obtained through numerical simulation. In terms of peak strength, all microscopic parameters, except for the effective bond modulus, show a positive correlation with peak strength. Among these, cohesion has the greatest influence, followed by the bond stiffness ratio and the internal friction angle, with the friction coefficient having the least influence, as shown in Figure 13a. Regarding peak strain, an increase in the effective bond modulus leads to a significant logarithmic decrease in peak strain, whereas the remaining four microscopic parameters exhibit a positive linear correlation with peak strain. The order of influence is cohesion, bond stiffness ratio, internal friction angle, and friction coefficient, as shown in Figure 13b. The relationship between microscopic parameters and Young’s modulus is complex. There is a positive correlation between the bond effective modulus and the friction coefficient with Young’s modulus, with the bond effective modulus exerting a greater influence. The relationship between the bond stiffness ratio and Young’s modulus is characterized by a negative power-law correlation. However, the values of cohesion and internal friction angle do not affect the macroscopic Young’s modulus of the rock, as shown in Figure 13c.
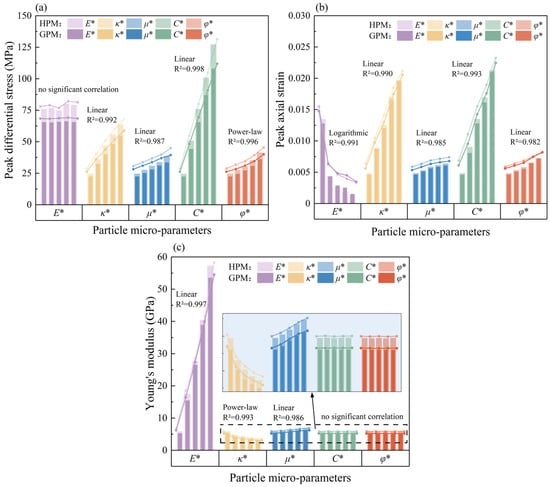
Figure 13.
The relationship between different microscopic parameters of particles. (a) Peak differential stress. (b) Peak axial strain. (c) Young’s modulus.
A comparison of the two models reveals that HPM exhibits greater overall strength than GPM, while their peak strains are similar. This indicates that inherent particle gradation heterogeneity primarily reduces the mechanical strength of macroscopic rock materials, so the PSD of quartz sand should be controlled in actual 3D printing.
Within the tested parameter ranges, the bond effective modulus and bond stiffness ratio show distinct effects on macroscopic mechanical properties. The bond effective modulus determines the normal stiffness of particles, linearly increasing Young’s modulus without changing peak strength. In contrast, the bond stiffness ratio decreases Young’s modulus while linearly increasing peak strength.
Cohesion and internal friction angle mainly affect peak strength and peak strain, with no significant impact on Young’s modulus. Cohesion shows a strong linear correlation with peak strength. Its sensitivity is four times that of the friction angle. The friction coefficient weakly correlates with all macroscopic parameters, exhibiting both elastic and plastic characteristics.
5. Conclusions
This study investigated the elastoplastic properties optimization of quartz sand-based 3DP rock and its influencing factors via integrated experiments and DEM simulations. Key conclusions are drawn as follows:
- The GPM constructed based on the actual PSD closely matched the experimental data, with an average peak strength error of 1.13%, validating DEM’s reliability in characterizing heterogeneous 3DP rocks with plastic-dominated failure.
- Cyclic saturation post-processing with silica sol effectively improved mechanical properties, with peak strength and Young’s modulus increased to 52.84 MPa and 1.66 GPa, respectively. The power-law relationship between saturation cycles, microscopic cohesion, and macroscopic strength clarified the binder penetration strengthening mechanism.
- The DEM simulations indicated that the bond effective modulus dominates Young’s modulus (elastic stage), while cohesion and the bond stiffness ratio are the primary factors controlling peak strength and shear failure (plastic stage). The friction coefficient and internal friction angle have minor effects.
- The established experimental DEM framework can provide customized 3DP rocks, solving the problems of natural rock sample scarcity and parameter dispersion, and supporting its potential application in the rock mechanics experiments of UGS reservoirs.
Author Contributions
Conceptualization, J.S. and R.S.; Methodology, J.S. and R.S.; Writing—original draft, J.S.; Writing—review and editing, J.L. All authors have read and agreed to the published version of the manuscript.
Funding
The authors are grateful for the financial support from National Science and Technology Major Project of China (Grant No. 2024ZD1004300), National Natural Science Foundation of China (Grant Nos. 52474086, 52241602).
Data Availability Statement
The original contributions presented in this study are included in the article. Further inquiries can be directed to the corresponding author.
Conflicts of Interest
The authors declare that they have no known competing financial interests or personal relationships that could have appeared to influence the work reported in this paper.
References
- Liu, J.J.; Yang, C.H.; Song, R. Advances of Geological Storage Engineering and Technology. GeoStorage 2025, 1, 1–26. [Google Scholar] [CrossRef]
- Sharafisafa, M.; Aliabadian, Z.; Tahmasebinia, F.; Shen, L. A comparative study on the crack development in rock-like specimens containing unfilled and filled flaws. Eng. Fract. Mech. 2021, 241, 107405. [Google Scholar] [CrossRef]
- Jiang, X.; Zhu, H.H.; Yan, Z.G.; Zhang, F.S.; Ye, F.; Li, P.N.; Zhang, X.H.; Dai, Z.R.; Bai, Y.; Huang, B.S. A state-of-art review on development and progress of backfill grouting materials for shield tunneling. Dev. Built Environ. 2023, 16, 100250. [Google Scholar] [CrossRef]
- Shakor, P.; Chu, S.H.; Puzatova, A.; Dini, E. Review of binder jetting 3D printing in the construction industry. Prog. Addit. Manuf. 2022, 7, 643–669. [Google Scholar] [CrossRef]
- Chu, S.H.; Li, L.G.; Kwan, A.K.H. Development of extrudable high strength fiber reinforced concrete incorporating nano calcium carbonate. Addit. Manuf. 2021, 37, 101617. [Google Scholar] [CrossRef]
- Ishutov, S.; Hasiuk, F.J. 3D Printing Berea Sandstone: Testing a New Tool for Petrophysical Analysis of Reservoirs. Petrophysics 2017, 58, 592–602. [Google Scholar]
- Song, R.; Wang, Y.; Tang, Y.; Peng, J.J.; Liu, J.J.; Yang, C.H. 3D Printing of natural sandstone at pore scale and comparative analysis on micro-structure and single/two-phase flow properties. Energy 2022, 261, 125226. [Google Scholar] [CrossRef]
- Ju, Y.; Xi, C.D.; Zheng, J.T.; Gong, W.B.; Wu, J.H.; Wang, S.J.; Mao, L.T. Study on three-dimensional immiscible water–Oil two-phase displacement and trapping in deformed pore structures subjected to varying geostress via in situ computed tomography scanning and additively printed models. Int. J. Eng. Sci. 2022, 171, 103615. [Google Scholar] [CrossRef]
- Chu, S.H.; Lam, W.L.; Li, L.; Poon, C.S. Packing density of ternary cementitious particles based on wet packing method. Powder Technol. 2022, 405, 117493. [Google Scholar] [CrossRef]
- Zhou, T.; Zhu, J. An Experimental Investigation of Tensile Fracturing Behavior of Natural and Artificial Rocks in Static and Dynamic Brazilian Disc Tests. Procedia Eng. 2017, 191, 992–998. [Google Scholar] [CrossRef]
- Jiang, Q.; Feng, X.T.; Song, L.B.; Gong, Y.H.; Zheng, H.; Cui, J. Modeling rock specimens through 3D printing:Tentative experiments and prospects. Acta Mech. Sin. 2016, 32, 101–111. [Google Scholar] [CrossRef]
- Almetwally, A.G.; Jabbari, H. Experimental investigation of 3D printed rock samples replicas. J. Nat. Gas Sci. Eng. 2020, 76, 103192. [Google Scholar] [CrossRef]
- Ishutov, S.; Hasiuk, F.J.; Harding, C.; Gray, J.N. 3D printing sandstone porosity models. Interpret. A J. Subsurf. Charact. 2015, 3, SX49–SX61. [Google Scholar] [CrossRef]
- Liu, P.; Ju, Y.; Ranjith, P.G.; Zheng, Z.M.; Wang, L.; Wanniarachchi, A. Visual representation and characterization of three-dimensional hydrofracturing cracks within heterogeneous rock through 3D printing and transparent models. Int. J. Coal Sci. Technol. 2016, 3, 284–294. [Google Scholar] [CrossRef]
- Ishutov, S.; Gray, J.N.; Harding, C.; Hasiuk, F.J.; Buono, A.S.; Fullmer, S.M. Resurrection of a reservoir sandstone from tomographic data using three-dimensional printing. AAPG Bull. 2017, 101, 1425–1443. [Google Scholar] [CrossRef]
- Feng, X.; Gong, Y.; Zhou, Y.; Li, Z.; Liu, X. The 3D-Printing Technology of Geological Models Using Rock-Like Materials Rock. Mech. Rock Eng. 2019, 52, 2261–2277. [Google Scholar] [CrossRef]
- GuoWei, M.; Li, W.; Yang, J. State-of-the-art of 3D printing technology of cementitious material—An emerging technique for construction. Sci. China (Technol. Sci.) 2018, 61, 475–495. [Google Scholar]
- Gao, Y.-T.; Wu, T.-H.; Zhou, Y. Application and prospective of 3D printing in rock mechanics: A review. Int. J. Miner. Metall. Mate 2021, 28, 1–17. [Google Scholar]
- Kharat, V.J.; Singh, P.; Raju, G.S.; Yadav, D.K.; Gupta, M.S.; Arun, V.; Majeed, A.H.; Singh, N. Additive manufacturing (3D printing): A review of materials, methods, applications and challenges. Mater. Today Proc. 2025, in press. [Google Scholar] [CrossRef]
- Zhou, T.; Zhu, J. Identification of a Suitable 3D Printing Material for Mimicking Brittle and Hard Rocks and Its Brittleness Enhancements. Rock Mech. Rock Eng. 2018, 51, 765–777. [Google Scholar] [CrossRef]
- Song, R.; Wang, Y.; Sun, S.; Liu, J. Characterization and microfabrication of natural porous rocks: From micro-CT imaging and digital rock modelling to micro-3D-printed rock analogs. J. Pet. Sci. Eng. 2021, 205, 108827. [Google Scholar] [CrossRef]
- Song, R.; Wang, Y.; Ishutov, S.; Zambrano-Narvaez, G.; Hodder, K.J.; Chalaturnyk, R.J.; Sun, S.Y.; Liu, J.J.; Gamage, R.P. A Comprehensive Experimental Study on Mechanical Behavior, Microstructure and Transport Properties of 3D-printed Rock Analogs. Rock Mech. Rock Eng. 2020, 53, 5745–5765. [Google Scholar] [CrossRef]
- Primkulov, B.E.A.; Chalaturnyk, J.; Chalaturnyk, R.; Zambrano Narvaez, G. View Correspondence. 3D printed sandstone strength: Curing of furfuryl alcohol resin-based sandstones. 3D Print. Addit. Manuf. 2017, 4, 149–155. [Google Scholar] [CrossRef]
- Ardila, N.; Zambrano-Narvaez, G.; Chalaturnyk, R.J. Wettability Measurements on 3D Printed Sandstone Analogues and Its Implications for Fluid Transport Phenomena. Transp. Porous Media 2019, 129, 521–539. [Google Scholar] [CrossRef]
- Gomez, J.S.; Chalaturnyk, R.J.; Zambrano-Narvaez, G. Experimental Investigation of the Mechanical Behavior and Permeability of 3D Printed Sandstone Analogues Under Triaxial Conditions. Transp. Porous Media 2018, 129, 541–557. [Google Scholar] [CrossRef]
- Sharafisafa, M.; Shen, L.; Xu, Q. Characterisation of mechanical behaviour of 3D printed rock-like material with digital image correlation. Int. J. Rock Mech. Min. Sci. 2018, 112, 122–138. [Google Scholar] [CrossRef]
- Zhang, K.; Ye, J.; Liu, X. Exploration of Stereolithography Apparatus 3D Printing Technology in the research of Complex Fractured Rock Mass. Mater. Rep. 2022, 36, 122–127. [Google Scholar]
- Vogler, D.d.e.c.; Walsh, S.D.C.; Dombrovski, E.; Perras, M.A. A comparison of tensile failure in 3D-printed and natural sandstone. Eng. Geol. 2017, 226, 221–235. [Google Scholar] [CrossRef]
- Ahmed, W.F.; Sghaier, M.B.H.; Allaoui, S. Investigation of the effect of three-point bending testing parameters on the behavior of 3D printed sand. Int. J. Adv. Manuf. Technol. 2022, 121, 1415–1428. [Google Scholar] [CrossRef]
- Hodder, K.J.; Sanchez-Barra, A.J.; Ishutov, S.; Zambrano-Narvaez, G.; Chalaturnyk, R.J. Increasing Density of 3D-Printed Sandstone through Compaction. Energies 2022, 15, 1813. [Google Scholar] [CrossRef]
- Zhu, J.B.; Zhou, T.; Liao, Z.Y.; Sun, L.; Li, X.B.; Chen, R. Replication of internal defects and investigation of mechanical and fracture behaviour of rock using 3D printing and 3D numerical methods in combination with X-ray computerized tomography. Int. J. Rock Mech. Min. Sci. 2018, 106, 198–212. [Google Scholar] [CrossRef]
- Hodder, K.J.; Nychka, J.A.; Chalaturnyk, R.J. Improvement of the unconfined compressive strength of 3D-printed model rock via silica sand functionalization using silane coupling agents. Int. J. Adhes. Adhes. 2018, 85, 274–280. [Google Scholar] [CrossRef]
- Ju, Y.; Wang, H.; Yang, Y.; Hu, Q.; Peng, R. Numerical simulation of mechanisms of deformation, failure and energy dissipation in porous rock media subjected to wave stresses. Sci. China-Technol. Sci. 2010, 53, 1098–1113. [Google Scholar] [CrossRef]
- Carrier, B.; Granet, S. Numerical modeling of hydraulic fracture problem in permeable medium using cohesive zone model. Eng. Fract. Mech. 2012, 79, 312–328. [Google Scholar] [CrossRef]
- Wu, M.Y.; Liu, J.J.; Lv, X.F.; Shi, D.; Zhu, Z.W. A study on homogenization equations of fractal porous media. J. Geophys. Eng. 2018, 15, 2388–2398. [Google Scholar] [CrossRef]
- Chen, Z.; Bunger, A.P.; Zhang, X.; Jeffrey, R.G. Cohesive zone finite element-based modeling of hydraulic fractures. Acta Mech. Solida Sin. 2009, 22, 443–452. [Google Scholar] [CrossRef]
- Muliadi, A.R.; Litster, J.D.; Wassgren, C.R. Modeling the powder roll compaction process: Comparison of 2-D finite element method and the rolling theory for granular solids (Johanson’s model). Powder Technol. 2012, 221, 90–100. [Google Scholar] [CrossRef]
- Zhang, X.; Jeffrey, R.G.; Thiercelin, M. Deflection and propagation of fluid-driven fractures at frictional bedding interfaces: A numerical investigation. J. Struct. Geol. 2006, 29, 396–410. [Google Scholar] [CrossRef]
- Kresse, O.; Weng, X. Numerical Modeling of 3D Hydraulic Fractures Interaction in Complex Naturally Fractured Formations. Rock Mech. Rock Eng. 2018, 51, 3863–3881. [Google Scholar] [CrossRef]
- Liu, X.; Liu, S.; Ji, H. Numerical research on rock breaking performance of water jet based on SPH. Powder Technol. 2015, 286, 181–192. [Google Scholar] [CrossRef]
- Lecampion, B.; Bunger, A.; Zhang, X. Bunger and X. Zhang, Numerical methods for hydraulic fracture propagation: A review of recent trends. J. Nat. Gas Sci. Eng. 2018, 49, 66–83. [Google Scholar] [CrossRef]
- Jiang, H.X.; Zhao, H.H.; Gao, K.D.; Wang, O.G.; Wang, Y.X.; Meng, D.G. Numerical investigation of hard rock breakage by high-pressure water jet assisted indenter impact using the coupled SPH/FEM method. Powder Technol. 2020, 376, 176–186. [Google Scholar] [CrossRef]
- Jia, L.H.; Chen, M.; Zhang, W.; Xu, T.; Zhou, Y.; Hou, B.; Jin, Y. Experimental study and numerical modeling of brittle fracture of carbonate rock under uniaxial compression. Mech. Res. Commun. 2013, 50, 58–62. [Google Scholar] [CrossRef]
- Wang, T.; Zhou, W.B.; Chen, J.H.; Xiao, X.; Li, Y.; Zhao, X.Y. Simulation of hydraulic fracturing using particle flow method and application in a coal mine. Int. J. Coal Geol. 2014, 121, 1–13. [Google Scholar] [CrossRef]
- Zhou, Z.Y.; Zhang, F.S.; Fu, H.F.; Xiu, N.L.; Guan, B.S.; Cai, B. A thermal–mechanical coupled DEM model for deep shale reservoir: The effects of temperature and anisotropy. Rock Mech. Rock Eng. 2024, 57, 3707–3726. [Google Scholar] [CrossRef]
- Xia, Y.; Yang, Y. Modeling the failure process of rock masses using a 3D nodal-based continuous-discontinuous deformation analysis method. Comput. Methods Appl. Mech. Eng. 2024, 425, 116968. [Google Scholar] [CrossRef]
- Lisjak, A.; Kaifosh, P.; He, L.; Tatone, B.S.A.; Mahabadi, O.K.; Grasselli, G. A 2D, fully-coupled, hydro-mechanical, FDEM formulation for modelling fracturing processes in discontinuous, porous rock masses. Comput. Geotech. 2017, 81, 1–18. [Google Scholar] [CrossRef]
- Chen, Y.; Ma, G.; Zhou, W.; Wei, D.H.; Zhao, Q.; Zou, Y.X.; Grasselli, G. An enhanced tool for probing the microscopic behavior of granular materials based on X-ray micro-CT and FDEM. Comput. Geotech. 2021, 132, 103974. [Google Scholar] [CrossRef]
- Potyondy, D.O.; Cundall, P.A. A bonded-particle model for rock. Int. J. Rock Mech. Min. Sci. 2004, 41, 1329–1364. [Google Scholar] [CrossRef]
- Yang, S.; Tian, W.; Huang, Y.; Ranjith, P.; Ju, Y. An Experimental and Numerical Study on Cracking Behavior of Brittle Sandstone Containing Two Non-coplanar Fissures Under Uniaxial Compression. Rock Mech. Rock Eng. 2016, 49, 1497–1515. [Google Scholar] [CrossRef]
- Haeri, H.; Sarfarazi, V.; Zhu, Z.; Hedayat, A.; Nezamabadi, M.; Karbala, M. Simulation of crack initiation and propagation in three point bending test using PFC2D. Struct. Eng. Mech. 2018, 66, 453–463. [Google Scholar] [CrossRef]
- Hou, B.; Jin, Y.; Li, S.; Zeng, C. Failure mechanisms of borehole wall rocks in gravel beds with different grain sizes. Nat. Gas Ind. 2015, 35, 66–70. [Google Scholar] [CrossRef]
- Liu, G.; Sun, W.C.; Lowinger, S.; Zhang, Z.H.; Huang, M.; Peng, J. Coupled flow network and discrete element modeling of injection-induced crack propagation and coalescence in brittle rock. Acta Geotech. 2019, 14, 843–868. [Google Scholar] [CrossRef]
- Huang, L.; Liu, J.; Zhang, F.; Dontsov, E.; Damjanac, B. Exploring the influence of rock inherent heterogeneity and grain size on hydraulic fracturing using discrete element modeling. Min. Miner. Depos. 2023, 17, 176–177. [Google Scholar] [CrossRef]
- Li, G.; Liu, S.Q.; Ma, F.S.; Guo, J. A multilevel parallel bonded-grain based model (Multi Pb-GBM) accounting for microstructure failures of typical crystalline rocks. Bull. Eng. Geol. Environ. 2022, 81, 475. [Google Scholar] [CrossRef]
- Abdellah, W.R.; Bader, S.A.; Kim, J.-G.; Ali, M.A.M. Exploring the influence of rock inherent heterogeneity and grain size on hydraulic fracturing using discrete element modeling. Min. Miner. Depos. 2023, 17, 1–11. [Google Scholar]
- Vasyliev, L.; Malich, M.; Vasyliev, D.; Katan, V.; Rizo, Z. Improving a technique to calculate strength of cylindrical rock samples in terms of uniaxial compression. Min. Miner. Depos. 2023, 17, 43–50. [Google Scholar] [CrossRef]
- An, M.; Zhang, F.; Dontsov, E.; Elsworth, D.; Zhu, H.; Zhao, L. Stress perturbation caused by multistage hydraulic fracturing: Implications for deep fault reactivation. Int. J. Rock Mech. Min. Sci. 2021, 141, 104704. [Google Scholar] [CrossRef]
- Holt, R.M.; Kjølaas, J.; Larsen, I.; Li, L.; Pillitteri, A.G.; Sønstebø, E. Comparison between controlled laboratory experiments and discrete particle simulations of the mechanical behaviour of rock. Int. J. Rock Mech. Min. Sci. 2005, 42, 985–995. [Google Scholar] [CrossRef]
- Donval, E.; Schneider, M.; Grimm-Strele, H.; Godehardt, M.; Burger, R.; Lechner, P.; Günther, D.; Andrä, H. A directional contraction method to model sand-based binder jet 3D printed materials. Int. J. Solids Struct. 2025, 312, 113260. [Google Scholar] [CrossRef]
- Ma, G.; Hu, T.; Li, Z. Binder jetting 3D printing rock analogs using magnesium phosphate cement. Constr. Build. Mater. 2024, 420, 135620. [Google Scholar] [CrossRef]
- Tabbakhzadeh, M.N.; Esmaeilzadeh, F.; Zabihi, R.; Mowla, D. Experimental study of chemical sand consolidation using epoxy and furan resins for oil wells: Experimental design models. Int. J. Rock Mech. Min. Sci. 2020, 135, 104486. [Google Scholar] [CrossRef]
- Gandini, A.; Belgacem, M.N. Furans in polymer chemistry. Prog. Polym. Sci. 1997, 22, 1203–1379. [Google Scholar] [CrossRef]
- Zhuang, D.; Ning, Z.; Chen, Y.; Li, J.; Li, Q.; Xu, W. Investigation on mechanical properties regulation of rock-like specimens based on 3D printing and similarity quantification. Int. J. Min. Sci. Technol. 2024, 34, 573–585. [Google Scholar] [CrossRef]
- Tian, W.; Wang, X.; Yun, W.; Cheng, X. Mechanical properties of sand 3D printed rock-like samples based on different post-processing methods. Rock Soil Mech. 2023, 44, 5. [Google Scholar]


Disclaimer/Publisher’s Note: The statements, opinions and data contained in all publications are solely those of the individual author(s) and contributor(s) and not of MDPI and/or the editor(s). MDPI and/or the editor(s) disclaim responsibility for any injury to people or property resulting from any ideas, methods, instructions or products referred to in the content. |
© 2025 by the authors. Licensee MDPI, Basel, Switzerland. This article is an open access article distributed under the terms and conditions of the Creative Commons Attribution (CC BY) license (https://creativecommons.org/licenses/by/4.0/).