Abstract
One of the main processes of shoe-sole production is injection molding, in which the desired shape is achieved by injecting a heated thermoplastic polymer in a highly plastic state under high pressure into the mold cavity. The study shows the energy analysis and share of electricity costs in the process of injection into the mold cavity to achieve the desired shape and describe the production process of PVC. Although fairly accurate energy-consumption comparison in the injection-molding process is almost unachievable since it depends on the type of machine, feedstock and molded product, it is still crucial for optimizing energy efficiency. The analysis showed that the basic process requirements of shoe-sole injection molding requires electrical energy in the amount of 5.76 kWh per pair of produced soles, while an increase in energy efficiency and environmental pollution reduction can be achieved by the return of process condensate, with a return share of Y = 80%. The price of electricity per pair of manufactured shoe soles is calculated, and given the fluctuations regarding fossil fuel market, the heat recovery potential leading to fossil-fuel savings in PVC production is analyzed.
1. Introduction
Today’s footwear is manufactured to provide the greatest possible comfort and safety to feet in all wearing conditions. Polymers are used as an alternative in footwear production to not only meet the market demand for footwear but to also eliminate the shortcomings of leather. Footwear consist of components such as the upper, the midsole or lining and the sole that are joined together, and polymers can be found in all parts of footwear. Polymers must meet certain properties to be suitable for functional use in footwear such as strength, flexibility and also comfort. Polymer materials find wide use since footwear is subject to repeated force due to the weight of the wearer during walking and additional force during running. Polymer materials include a range of polymers from natural to synthetic that are processed so that they can meet the required requirements for a particular component. The most common materials, which account for more than 50% in footwear production, are poly(vinyl chloride) (PVC), thermoplastics (styrene–butadiene), ethylene vinyl acetate (EVA) and polyurethane (PU). Thanks to research and development in the field of polymer chemistry and injection molding, which consists of one component, footwear based on 100% polymer foams have been developed. Given the large landfills, great efforts are being made in the research of biodegradable synthetic polymers to prevent bad environmental consequences [1].
Shoe soles are the lower part of shoes in direct contact with the ground, and are made of thermoplastic synthetic polymers, mainly due to the accessibility and low cost of raw materials. Another significant factor in the widespread use of soles made of polymer materials is the achievement of specific physical and mechanical properties, which are in many respects superior to materials from natural sources such as leather [2]. Polymers are classified as thermoplastic materials made from various petroleum-based monomers, and the most well-known for the footwear industry are polyethylene (PE), polyisoprene (IR), synthetic polystyrene (PS), thermoplastic polyurethane (TPU), polyurethane foams, EVA and PVC [3]. Synthetic polymers are made from various petroleum-based monomers, and polymers have become the main specialized materials for the footwear industry [4].
PVC is the oldest and, for more than 70 years, one of the most important polymers on the world market [5] and one of the most important plastics on the world market with an installed global production capacity of 32 million tons per year [6]. Although PE is slowly replacing it on the world market, PVC retains its title as the most versatile plastic, both in terms of the number of processing methods and the variety of end products, thanks to the wide range of available types of PVC resins and the ability of PVC to be modified by adding various additives, incomparably better than any other plastic [7]. One of the main processing industries is the production of shoe soles, especially with regard to the production of sports shoes. PVC shoe soles are known for their excellent properties: they are easy to shape and have good water and moisture resistance, high elasticity, high shock absorption, excellent thermal insulation properties, high durability, resistance to low temperatures and resistance to cracking. PVC is one of the most commonly used thermoplastic elastomers for making soles due to its durability and low cost, although it lags behind some other materials in terms of aesthetics. PVC is produced by the suspension polymerization of vinyl chloride, where the reaction mixture is continuously stirred and cooled due to its exothermic nature. The molding of soles is usually carried out by injection molding [1].
The product development of modern footwear is based on scientific research to provide the user with maximum protection and comfort. Such footwear protects the foot from adverse conditions and enables safe movement in everyday situations. Depending on the production methods, the physical properties of PVC change from flexible and elastomeric to a tough and hard material, and due to its easy miscibility with plasticizers and other additives, as well as easy processability and low price, PVC is the most widely used vinyl polymer [8].
The resulting PVC mixture is dried and formed into granules, and then further processed by adding various additives to obtain the desired properties of the final product. The process of making PVC soles is carried out by injection molding, similar to TPR but with adjusted process parameters [9]. During the 1950s, a series of discoveries in the field of polymer science continued with the development of new synthetic polymers and their production processes. Although PVC soles show good technical properties, health and environmental challenges associated with plasticizers, especially phthalates, represent a limitation to their widespread use and recycling. The molding of TPR and PVC soles is carried out by injection molding [1].
The PVC production process in suspension accounts for about 80%, and the remaining 20% refers to the production process in emulsion, mass and solution [8]. The two basic polymerization mechanisms are addition (chain) polymerization and condensation polymerization [10,11]. The largest share of the total production of synthetic polymers refers to addition polymers. Their advantage is their low cost of production.
The monomer vinyl chloride was first mentioned by Liebig and Regnault in 1835, but it was not yet known that this monomer could be polymerized. It was not until 1878 that Baumann discovered that exposing vinyl chloride to sunlight produced a white solid, which was the first indication of its ability to form polymers [12]. The first commercial production of PVC began in the late 1920s in the United States, with rapid expansion during the 1930s. Pilot production of PVC resins was started in Germany in 1931. The real technical progress was achieved thanks to patents filed in 1933 and 1934 by Waldo Semon of BF Goodrich and Reid of Carbide and Carbon Chemicals. They discovered that PVC, when heated in the presence of high-boiling liquids (e.g., phthalate esters), became flexible and rubber- or leather-like. This opened the way for the production of plasticized PVC, suitable for processing at acceptable temperatures, and, at the same time, permanently soft and flexible [13].
Vinyl chloride is a simple compound consisting of carbon, hydrogen and chlorine atoms. Its chemical formula is C2H3Cl (mono-chloroethane), (Figure 1).
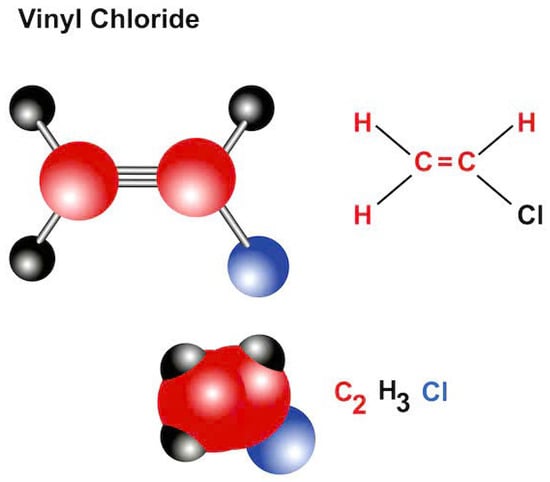
Figure 1.
Chemical structure of mono-chloroethane (vinyl chloride) (VC) (Source: EuP Egypt Industries S.A.E).
PVC owes its popularity to its low cost, excellent physical properties, unique ability to mix with additives and usefulness for a wide range of applications and processability by various techniques [14].
PVC Production Process
PVC is produced by the polymerization of vinyl chloride by free-radical processes in suspension, emulsion or mass. At the world level, 80% of PVC is produced by suspension polymerization, 12% by emulsion polymerization, and 8% by mass polymerization [5]. First, in 1950, the process of producing PVC by emulsion polymerization in autoclave reactors at a temperature of 40 to 50 °C was invented. The process takes place in an aqueous monomer emulsion with a water-soluble initiator (ammonium persulfate, potassium persulfate or redox initiator system), and sodium lauryl sulfate or synthetic detergents are used as emulsifiers. The polymer is separated from the resulting latex by coagulation in the presence of an electrolyte or by spray drying [10]. The PVC production process in suspension accounts for about 80%, and the remaining 20% refers to the production process in emulsion, mass and solution [8].
Suspension polymerization is carried out in autoclave reactors with a volume of up to 200 m3 in an aqueous medium in the presence of stabilizing agents for dispersed particles of the highly reactive monomer vinyl chloride using organic colloids such as cellulose derivatives, starch, poly(vinyl alcohol) or insoluble inorganic salts. Polymerization reaction initiators are low decomposition temperature initiators soluble in monomer. Through the process of polymerization in suspension, droplets of liquid monomer are gradually transformed into a gelatinous mass by increasing the proportion of insoluble polymer [15,16]. Protective colloids create a stabilizing layer around the monomer droplets formed by mixing [6]. The remaining monomer is also soluble in the resulting polymer, so the reaction takes place in the monomer phase and in the monomer solution in the polymer. When the conversion from liquid monomer to insoluble polymer reaches about 70%, the reaction continues with solution polymerization. At the same time, the pressure drops sharply and the speed of the reaction increases, which leads to the sudden evaporation of the remaining monomer and the formation of porous polymer particles, and such porosity favors the absorption of additives. The polymerization process of PVC in suspension lasts 12 to 14 h. Then, the remaining unreacted monomer is separated, which after cleaning is returned to the process, and the polymer grain is centrifuged and dried [15,16]. The newest and most applicable polymerization process of PVC is bulk polymerization, which was originally patented as a discontinuous process by the French company Pechiney.
PVC is processed by all common plastomer-processing processes, most notably extrusion, calendering, injection molding, blow molding, compression molding, and vacuum forming at temperatures of 140 to 190 °C. Protective coatings are applied from solutions or directly by sintering the powder. The mechanical properties of PVC depend on its formulation and strength [17,18]. Grained PVC is most common type of PVC raw material distributed on the market. The first stage of PVC granulate production consists of creating long pipes from materials made in a special extrusion plant. The next step consists of cutting the plastic into granules, Figure 2.
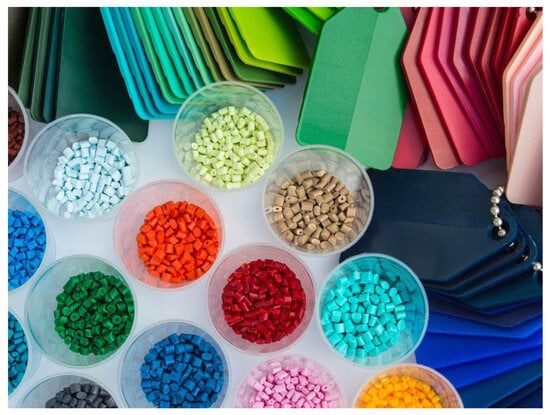
Figure 2.
PVC granules (Source: Oxoplast™).
To produce 1 kg of suspension PVC requires 10.34 MJ of electricity and 2.81 MJ of natural gas [19]. The average electricity consumption for the injection molding process was reported as 1.47 kWh/kg of polymer material [20], although this value can lead to significant variations with regard to the type of molded product, whether bottle or shoe sole, for instance. Specific energy consumption in kWh/kg varies according to the polymer material used, the type of injection molding machine (hydraulic, hybrid or electric IMM) and process parameters [20]. An all-electric injection molding machine reports lower energy consumption as opposed to hydraulic IMMs [21]. Traditional hydraulic injection molding machines (IMMs) are less efficient than electric machines because they consume more energy, even when inactive, and show more energy losses through auxiliary parts.
2. Materials and Methods
2.1. PVC Molding
Molding is a process in the shaping of polymer materials, especially in the footwear industry.
The main processes for shaping shoe soles are [4]
- compression molding (direct),
- transfer molding (indirect) and
- injection molding (injection molding).
All three pressing processes are used in the molding of thermosets, while injection molding is also an important process in the processing of plastomers. Today, injection molding is the dominant process for shaping shoe soles made of synthetic polymers in mass production due to the absence of raw-material losses because utilization is complete. Molds are most often made of non-corrosive metals such as steel, aluminum or stainless steel. Injection molding is only economically viable in the case of large production quantities. The advantages of injection molding include better dimensional control, less waste and shorter cycle times. Due to the high cost of molds, large production quantities are required to justify injection molding [4].
Schematic representation of the parts of the IMM (Figure 3) [22]:
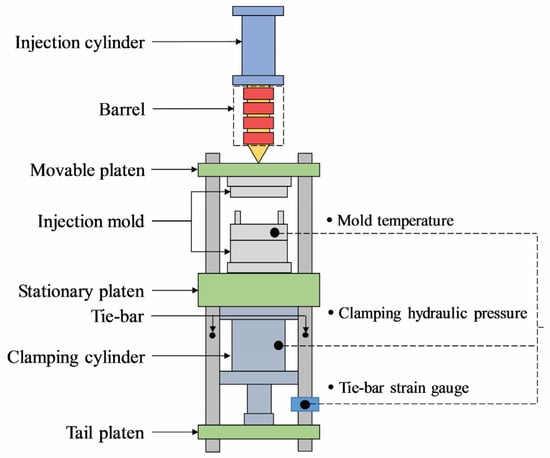
Figure 3.
Injection-molding machine [22].
- injection unit
- mold clamping unit (press).
The injection unit consists of a tube, which is fed by a hopper for feeding plastic pellets. Inside the tube is a reciprocating rotating unit that rotates and heats the polymer by injecting the molten polymer into the mold. The mold clamping unit contains two plates, a fixed and a movable plate, placed in a regular relationship with each other, and holds the mold closed during injection by applying a clamping force, which is sufficient to resist the injection force and open and close the mold [4]. The average injection cycle for each mold is approximately 7 min, so a multi-station machine can achieve faster and more efficient production [23].
2.2. Technological Process of Suspension PVC Production
In general, the production process of suspension PVC goes through four main stages of the production flow: (1) the reaction part of the production process (polymerization zone), (2) the residual vinyl-chloride monomer recovery stage, (3) the vinyl-chloride monomer purification stage and (4) the PVC drying section. For the purposes of calculation, the rate of production of suspended PVC in water suspension in the amount of 518,400 tons per year is foreseen [24]. The plant works 8 h a day, 25 days a month or τ = 2400 h per year, i.e., β = 27.4%.
The suspension-PVC production process starts in the mixing tank at a constant temperature of 32 °C [5,23,24]. The polymerization zone consists of eight polymerization reactors (volume of 70.5 m3 connected in parallel and operating cycle of 4 to 5 h) operating at a temperature of 50 to 70 °C and a pressure of 7.9 to 9.8 bar [25,26]. A mixture of pure (VC) and recovered (VCR) liquefied vinyl-chloride monomer at a temperature of 22 °C and a pressure of 4.4 bar enters the mixer, as well as demineralized water in the amount of 1440 tons of water per day at a temperature of 85 °C and a pressure of 3.4 bar and a protective colloid (poly (vinyl alcohol)) and polymerization initiators at a temperature of 31 °C and a pressure of 9.8 bar.
The polymerization reaction is exothermic, so the excess energy is removed by transferring heat to the cooling medium—water—and the conversion of the reaction is carried out from 80% to 90% of the conversion of monomer to polymer. At the end of the reaction, a heterogeneous mixture of suspended PVC, unreacted vinyl-chloride monomer, water and initiator at a temperature of 70 °C and a pressure of 3.4 bar is obtained, because the end of the reaction is determined by the drop in pressure in the reaction system [5,25].
The remaining unreacted PVC is removed from the mixture in accordance with safety protocols, due to its carcinogenicity, by gasification in a recovery unit at a pressure of 1.77 bar. In this process, the vinyl-chloride monomer in the gaseous state is separated from the liquid suspension and separated into a recovery line (consisting of a stripping column, separator, first condenser, distiller and second condenser). The recovered vinyl-chloride monomer is then returned to the polymerization [5,23].
The remaining PVC suspension is separated further into a storage tank, then into a de-monomerization system, since it still contains up to 5% vinyl-chloride monomer. The monomerized suspension is stored in tanks for homogenization of the suspension, then centrifuged and, with a moisture content of about 25%, sent to a dryer, where it is dried with a stream of hot air. Then, it follows the procedure of separation and processing and packaging. The waste suspension is treated in a wastewater treatment plant or recycled back into the process [5,25,26]. The general flow diagram of suspension-PVC production is shown in Figure 4.
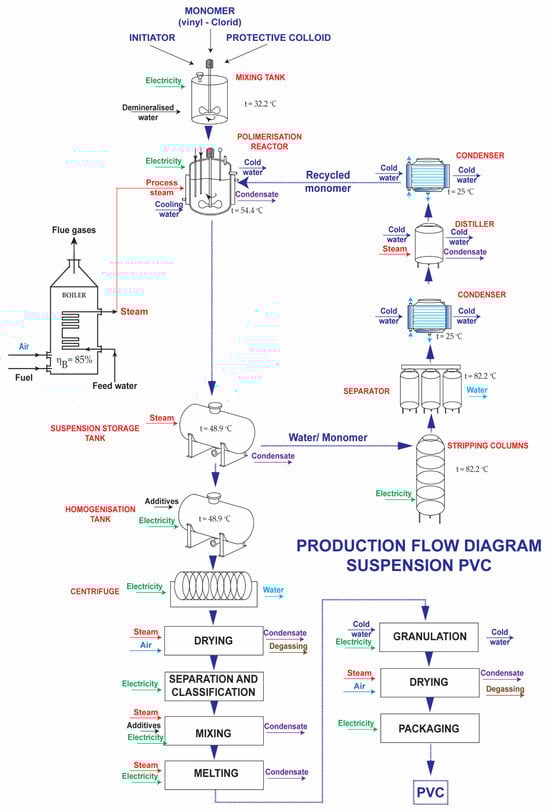
Figure 4.
General flow diagram of suspension PVC production [26].
The condensate recovery process uses 59.4 m3 of natural gas per ton of PVC [23] and electricity [19], which is mainly used to operate the reactor, mixing tank, melter, separation unit, granulate unit and column for stripping (Figure 5). The boiler generates steam at a temperature of 121 °C (enters the polymerization reactor, distiller and mixer), 146 °C (enters the melter) and 188 °C (required for dryers) and a pressure of 13.7 bar [25]. The minimum amount of water used to produce 1 kg of S-PVC resin is 14.72 L [27], and the average daily production is 1150 tons of suspended PVC per day. The basic process requires electricity [25,26]: . The mass of water required to produce 1 kg of PVC [25,26]: . The process also indirectly uses cooling water [25,26]: . The boiler produces steam [25,26]: .
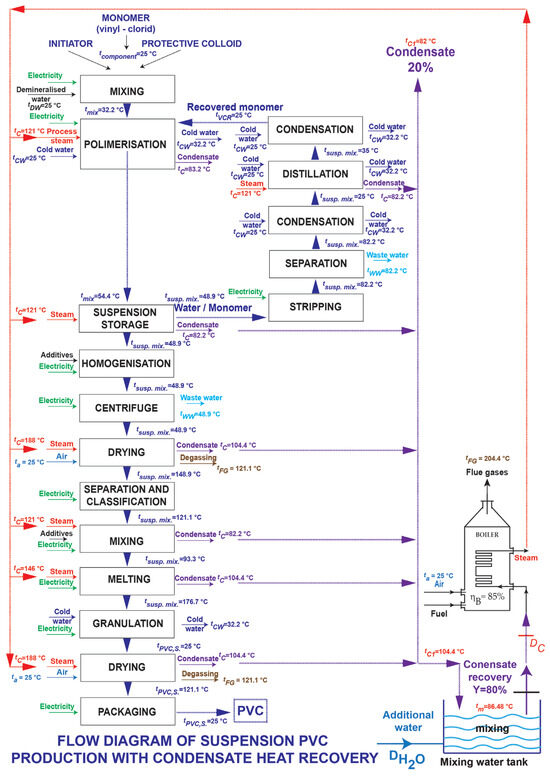
Figure 5.
Flow chart of suspension-PVC production with condensate heat recovery [26].
2.3. Technological Process of Shoe-Sole Injection Molding
The shoe-sole IMM is equipped with three working chambers (Figure 6), which are called “nests” in production. The melt is prepared in a mixer using a heating system that heats the material in the form of granules at a temperature of 140–160 °C while the mold is raised, lowered and closed by hydraulic systems, maintaining a constant melt temperature of 175 to 185 °C [26]. In order to maintain a stable temperature and prevent overheating, a cooling liquid is used, and the precise temperature regulation depends on the type of granulate and the manufacturer’s recommendations. The granulate, most often PU and PVC, comes in different colors.
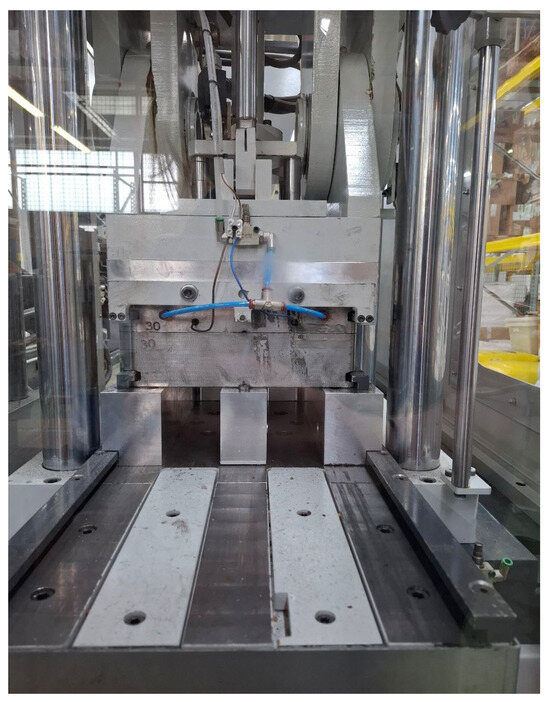
Figure 6.
Working chamber of the shoe-sole IMM [26].
The molds are made of aluminum and are prone to wear due to mechanical friction during closing. Over time, they can wear out, which can lead to inaccuracies and leakage of the mixture. To ensure proper function, the molds are regularly ground so that they fit perfectly into each other.
Each mold has built-in sensors that signal on the screen when the space is filled with melt. The operating parameters of the machine, such as temperature and cooling time (from 50 to 120 s), are adjusted via the screen, depending on the size and type of mold.
Changing the mold according to requested shoe size takes approximately 10 to 15 min. When changing the color of the granulate (e.g., from black to white), 30–40 pairs of soles are discarded due to the remnants of the previous color in the system, while for more similar tones (e.g., when changing from yellow to brown), the loss is significantly lower—about 3 to 4 pairs. It takes approximately half an hour to even out the color when changing the color of the material, and another half hour to remove all residues with inhomogeneous coloring.
The shoe-sole IMM operates continuously in three shifts, which allows for high production capacity, resulting in approximately 3600 pairs per day on two machines.
In shoe-sole IMM, energy is consumed to power the injection motors (in the case of this specific machine, three electric motors), hydraulic pump motor, extruder height adjustment motor and barrel heaters.
The specific parameters are adjusted depending on the desired sole strength. The shoe-sole IMM is equipped with a crusher/mill that allows the recycling of defective sole residues (e.g., incompletely filled molds) [26].
These residues are crushed and mixed again with new granulate in the ratio prescribed by the manufacturer (usually up to 10%) without compromising the quality of the product. During operation, burnt material (“soot”) deposits on the nozzle over time, which can cause contamination of the melt. For this reason, special granulate for cleaning the channels is used approximately once a week, which cleans the machine without dismantling it, while discarding 2 to 3 pairs of soles. Continuous operation ensures process stability and minimal deviations in quality, which is crucial for the serial production of footwear parts.
The shoe-sole IMM is equipped with three injection units equipped with a mold-clamping unit (press) with a clamping force of 1176/1470 kN (120/150 tons). It is powered by three-phase current with a neutral conductor, at a voltage of 380 V and a frequency of 50 Hz, with the total power required at full capacity 18 kW.
The main part of the drive consists of three electric motors of the injection units—each with a power of 11 kW (~15 HP) with a supply voltage of 400/690 V, consumption of 23.3/13.4 A, an operating speed of 1464 rpm and a frequency of 50 Hz. In addition, the machine includes a 7.5 kW (~10 HP) hydraulic pump motor for the mold-clamping unit and a 0.09 kW auxiliary motor for adjusting the height of the injector with a supply voltage of 380/220 V, a consumption of 0.37/0.63 A, an operating speed of 1280 rpm and a frequency of 50 Hz. The injection zones are heated by nine 300 W heaters, powered by single-phase 240 V, arranged so that five heaters cover the rear zone and four the front zone. A five-conductor cable is required to connect the machine to the electrical network—three for phases, one for neutral and one for ground. The power supply must be protected by a 4 × 125 A circuit breaker or fuses of the same rating, and the recommended conductor cross-section is 35 mm2 for phases (black) and 16 mm2 for neutral (blue). It is important to ensure proper grounding via the equipment inside the control cabinet, with the total resistance not exceeding 20 Ω to ensure safe operation of the device and prevent possible damage. Connection to the electrical network must be carried out by qualified personnel only, in compliance with current safety standards. Improper grounding can cause serious damage to the machine and safety risks, for which the manufacturer cannot be held responsible [26,28].
To connect the machine to the electrical network, a cable consisting of a total of 5 conductors must be used: 3 for the phases, 1 for the neutral conductor and 1 for the earth (equipotential conductor). The electrical characteristics of the machine are as follows: supply voltage of 380 V and frequency of 50 Hz, with a three-phase system and neutral conductor. The machine’s consumption during operation is 18 kW, with an average power factor cosφ = 0.76 [26].
3. Results
3.1. Energy Analysis of the Technological Production Process of Suspension PVC
The energy analysis of the basic production process is regarded as first step to further comparison in regard to three crucial operating parameters: fuel consumption, the total volume of the exhaust flue gases per unit of product rejected to the surrounding and flue gases’ outlet temperature.
A boiler with an efficiency of uses gaseous fuel of the composition
The boiler produces superheated steam, which passes through the process units (polymerization reactor, suspension storage tank, dryers, mixing tanks and distiller) and returns to the boiler as process condensate with a temperature of °C and and a pressure . Fuel combustion takes place with an excess of air of 20%, i.e., . The utilization rate of the power plant . Superheated steam with a temperature of 121 °C and a pressure of 13.7 bar enters the polymerization reactor. The air required for fuel combustion goes into the combustion chamber with a temperature of while the temperature of the exhaust flue gases is .
The calculated lower heating value (LHV of gaseous fuel (kJ/m3) is [29]
The specific consumption of gaseous fuel is [25]
The heat delivered to the boiler is then
With return condensate of Y = 80%, temperature and assuming adiabatic mixing with 20% additional water temperature , the temperature at the boiler inlet is
The specific fuel consumption per unit of steam is
The plant use factor is β = 85%, so the annual operating time is
Considering the production rate , steam production (steam mass flow) is
The total heat supplied to the boiler is
The specific fuel consumption per unit of water is
Considering the production rate , steam production amounts to
Volume flow of fuel consumption from the boiler balance:
The annual fuel consumption with the annual operating time τ = 7446 h (310.25 days) amounts to
Assuming that the mass flow of steam is equal to the mass flow of condensate () in the process with condensate return, heat enters the boiler:
Annual heat entering the boiler:
An increase in energy efficiency while reducing environmental pollution can be achieved by the previously described return of process condensate Y = 80% and also by the application of cogeneration and heat recovery of flue gases. The heat of the flue gases can be used to preheat the feed water of the boiler and preheat the air for the combustion of gaseous fuel in the boiler’s combustion chamber.
3.2. Analysis of Fuel Combustion Products in the PVC Production Process
The fuel combustion by-products are mostly gaseous, and they originate from burning carbon-based fuels. The combustion process releases harmful pollutants such as carbon dioxide, sulfur dioxide and nitrogen oxides. The exhaust product analysis shows the volume and composition percentage of each component in exhaust flue gases. In the basic production process, the exhaust flue gases’ volume per unit of the product are rejected to the environment; however, they can serve as a valuable thermal energy source, and this waste heat can be used for air or feed-water preheating. Future studies can focus on further waste-heat utilization, resulting in carbon-footprint reduction.
The minimum oxygen volume is calculated as [28,29]
Theoretical (minimum) air volume:
The actual volume of air with excess air coefficient :
Volume of individual flue gas components:
The total volume of triatomic gases in flue gases [28,29]:
Volume of carbon dioxide:
Volume of water vapor:
where moisture content in air is and water vapor density is .
Actual volume of nitrogen in flue gases:
Actual volume of oxygen:
Volume of wet flue gases:
Volume fractions of flue gas components [28,29]:
3.3. Electricity Consumption During Shoe Soles Injection Molding
The shown injection-molding shoe-sole machine works continuously in three shifts. Energy consumption in the production of shoes is carried out at a rate of n = 1800 pairs/day (n = 75 pairs/h) for each IMM. The plant works 24 h a day, 25 days a month, so the annual operating time is τ = 7200 h per year [26].
The plant use factor:
The electrical power of the device (electrical work per unit time) with losses neglected is
The consumed work is indirectly calculated as
The daily specific effective electricity consumption of the device for one injection molding of shoe soles is
Electricity consumption per unit of product (unit energy used) is calculated as
The basic process requires electrical energy in the amount of 5.76 kWh per pair of produced soles, which is supplied from the grid. If two shoe-sole IMMs work in three shifts, they will consume 864 of electrical energy per day, as calculated:
or
or
where n is number of shoe-sole pairs per hour, N is the number of operating IMMs, P is machine-power rating (nominal power), H is operating hours per day (24 h in a day, working three shifts) and LF is load factor (LF is 80%).
3.4. Share of the Price of Electricity in the Production Process
According to publicly available data from the European Commission for network users in the business category, with annual consumption between 500 MWh (megawatt hours) and 2000 MWh, in 2024, the average price of electricity was EUR 0.1899 per kWh of electricity [30].
If the previously calculated electricity consumption per product unit of 5.76 kWh per pair is taken for calculation purposes, the electricity costs per pair of manufactured shoe sole is
For the total daily production n = 3600 pairs/day, the electricity costs are
Typical consumption of PVC granules for standard molded soles with thicker footbeds (adults) is 1.2 kg per pair, so the electricity consumption per kg of PVC granules becomes 4.8 kW/kg of PVC. According to survey [31], specific energy consumption (SEC) measured over a period of twelve months decreased from 4.2 kW/kg for the smaller machines to 2.5 kW/kg for the medium and large machines. A 100-ton machine used in this study falls in the scope of small IMMs, so the increase in clamping force would reduce the SEC value.
4. Discussion
The transition from energy-intensive and environmentally burdensome production of polymer materials and products to more energy-efficient and environmentally friendly systems begins from the very beginning of plant and product life-cycle management. The concept of sustainable development envisages production in accordance with a high quality of life and increased care for natural resources. In addition to current economic trends, this forces outdated industrial plants in the polymer industry to undergo technological modernization and take the necessary measures to conserve energy. Waste heat recovery has a positive energy, environmental and economic impact, which leads to a reduction in the consumption of the primary source, a reduction in costs and a reduction in the thermal load on the environment. The favorable results recorded in various studies explain the reduction in greenhouse gas emissions by reducing dependence on fossil fuels by optimizing available energy sources [32,33]. An integrated approach to the production cycle with the implementation of energy conservation measures forces manufacturers to look beyond a mere energy-management system. The heat of the flue gases can also be used to preheat the feed water of the boiler and preheat the air for the combustion of gaseous fuel in the boiler’s combustion chamber. Since the obvious rise in electricity prices for industry consumers in the EU market from 2008 to 2024, it is advisable to consider the implementation of more renewables in order to replace outdated energy sources, especially with regard to reducing carbon emissions as well as nullifying the impact of the unstable energy market [34].
Energy saving for IMMs are based on two general approaches, one suggesting the machine design changes and the other one related to the optimization of process settings (reduction in waste time for loading and unloading, increasing the hydraulic pump and cooling circulation pump efficiency or heat loss reduction) [35,36].
5. Conclusions
The paper presents an energy analysis and the share of electricity costs in the production process of PVC and shaping PVC shoe soles as the final product. The calculation of energy consumption in chemical industry plants is very important because the industrial production of synthetic polymers is a very energy-intensive process and consumes energy that is mainly generated from fossil fuels. It is estimated that the PVC market will reach 65.48 million tons by 2030. In 2024, suspension PVC contributed as much as 75% of revenue [37]. Gradual growth of the polyvinyl-chloride market is expected through changes in production processes with an emphasis on energy savings and resistance to climate change.
The paper also describes the production of suspension PVC and calculates the annual fuel consumption of and conducts exhaust flue gas analysis. The energy saving potential further focuses on the application of the return condensate process. Further improvements could be made by preheating the air and feed water using the heat recovery of smoke gases in the production process in order to achieve energy savings through reduced water consumption, fuel and chemical savings. The process of shaping shoe soles by injection molding is also presented, in which the desired shape is achieved by injecting heated PVC in a highly plastic state under high pressure into the mold cavity. Based on data on the average daily capacity of pairs of soles produced, a calculation of the share of the electricity price in the sole injection-molding production process is presented. Energy consumption in shoe-sole injection molding was carried out at a rate of 3600 pairs/day by two injection-molding machines and showed electrical energy requirements in the amount of 5.76 kWh per pair of produced soles. Two shoe-sole injection-molding machines working in three shifts will consume 864 kWh of electrical energy per day.
Author Contributions
Research concept, A.M.-B. and I.Š.; Figures, I.Š.; methodology, A.M.-B., L.Š. and I.Š.; results design, L.Š. discussion, L.Š.; preparation of paper for submission, I.Š. All authors have read and agreed to the published version of the manuscript.
Funding
This research was funded by the institutional project Transformation and recycling of waste assortment into secondary hit (TRASH) by the University of Zagreb Faculty of Textile Technology.
Data Availability Statement
The data presented in this study are openly available in DABAR repository (https://repozitorij.ttf.unizg.hr/object/ttf:1509) accessed on 2 December 2025.
Acknowledgments
This research was carried out within the framework of the master thesis by co-author Lucija ŠIPRAK “Energy analysis of the shoe sole production process”.
Conflicts of Interest
The authors declare no conflicts of interest.
References
- Gnanasundaram, S.; Ranganathan, M. Footwear. In Encyclopedia of Polymer Applications; Mishra, M., Ed.; CRC Press: Boca Raton, FL, USA; Taylor and Francis Group: Abingdon, UK, 2019; Volume 2, pp. 1444–1469. ISBN 978-1-4987-2993-2. [Google Scholar]
- Golubeva, O.; Pogorelova, A. Analysis of the quality of modern polymer materials of sole. In E3S Web of Conferences: Proceedings of the XIV International Scientific and Practical Conference “State and Prospects for the Development of Agribusiness-INTERAGROMASH 2021”, Rostov-on-Don, Russia, 24–26 February 2021; Rudoy, D., Olshevskaya, A., Ugrekhelidze, N., Eds.; EDP Sciences: Les Ulis Cedex A, France, 2021; Volume 273, pp. 1–7. [Google Scholar] [CrossRef]
- Karkalic, R.; Radulovic, J.; Jovanovic, D. Characteristics of polyurethane and elastomer parts for shoe industry produced by liquid injection molding technology. Vojn. Glas. 2017, 65, 948–967. [Google Scholar] [CrossRef]
- Groover, M.P. Fundamentals of Modern Manufacturing: Materials, Processes and Systems, 4th ed.; John Wiley and Sons Inc.: Hoboken, NJ, USA, 2010; ISBN 978-0470-467002. [Google Scholar]
- Kovačić, T.; Andričić, B. Suspension poly(vinyl chloride) and the risks of its production. Polymers 2005, 26, 128–132. [Google Scholar]
- Eyerer, P.; Weller, M.; Hübner, C. (Eds.) Polymers–Opportunities and Risks II: Sustainability, Product Design and Processing; Springer: Berlin/Heidelberg, Germany, 2010; ISBN 978-3-642-02796-3. [Google Scholar]
- Grossman, R.F. (Ed.) Handbook of Vinyl Formulating; John Wiley and Sons, Inc.: Hoboken, NJ, USA, 2008; ISBN 978-0-471-71046-2. [Google Scholar]
- Janović, Z. Polimerizacije i Polimeri; Hrvatsko Društvo Kemijskih Inženjera i Tehnologa (HDKI): Zagreb, Croatia, 1997; ISBN 9789539604156. [Google Scholar]
- Suresha, B.; Hemanth, R.; Nithin, K.S. Automotive Applications: Reinforced Material Components. In Encyclopedia of Polymer Applications; Mishra, M., Ed.; CRC Press: Boca Raton, FL, USA; Taylor and Francis Group: Abingdon, UK, 2019; Volume 1, pp. 1444–1469. ISBN 978-1-4987-2993-2. [Google Scholar]
- Chanda, M.; Roy, S.K. Plastics Fundamentals, Properties, and Testing; CRC Press: Boca Raton, FL, USA; Taylor and Francis Group: Abingdon, UK, 2009; ISBN 978-1-4200-8060-5. [Google Scholar]
- Wypych, G. Handbook of Polymers; ChemTec Publishing: Toronto, ON, Canada, 2012; ISBN 978-1-895198-47-8. [Google Scholar]
- Akovali, G. Advances in Polymer Coated Textiles; Smithers Rapra Technology Ltd.: Shawbury, UK, 2012; ISBN 978-1-84735-497-6. [Google Scholar]
- Patrick, S. Practical Guide to Polyvinyl Chloride; Smithers Rapra Technology Ltd.: Shawbury, UK, 2005; ISBN 1-85957-511-01. [Google Scholar]
- Sen, A.K. Coated Textiles: Principles and Applications, 2nd ed.; CRC Press: Boca Raton, FL, USA; Taylor and Francis Group: Abingdon, UK, 2008; ISBN 978-1-4200-5345-6. [Google Scholar]
- Mishra, M.K.; Yagci, Y. Handbook of Vinyl Polymers: Radical Polymerization, Process, and Technology, 2nd ed.; CRC Press: Boca Raton, FL, USA; Taylor and Francis Group: Abingdon, UK, 2009; ISBN 978-0-8247-2595-2. [Google Scholar]
- Mishra, M.K.; Yagci, Y. Handbook of Radical Vinyl Polymerization; Marcel Dekker, Inc.: New York, NY, USA, 1998; ISBN 0-8247-9464-8. [Google Scholar]
- Klein, P.; Kennedy, M. Fundamentals of Plastics Thermoforming; Springer Nature: Berlin/Heidelberg, Germany, 2009; ISBN 978-3-031-63527-4. [Google Scholar]
- Biron, M. Thermosets and Composites: Technical Information for Plastics Users; Elsevier Ltd.: Oxford, UK, 2004; ISBN 1856174115. [Google Scholar]
- The European Council of Vinyl Manufacturers (ECVM) and Plastics Europe. Eco-Profiles of the European Plastics Industry: POLYVINYL CHLORIDE (PVC) (SUSPENSION POLYMERISATION). 2005. Available online: https://www.inference.org.uk/sustainable/LCA/elcd/external_docs/spvc_60635d04-5246-45d7-90a5-59a203bd9369.pdf (accessed on 13 April 2025).
- Elduque, A.; Elduque, D.; Pina, C.; Clavería, I.; Javierre, C. Correction: Elduque, A., et al. Electricity Consumption Estimation of the Polymer Material Injection-Molding Manufacturing Process: Empirical Model and Application. Materials 2020, 13, 2548. [Google Scholar] [CrossRef] [PubMed]
- Socks, M. The Promise of All-Electric Injection Molding Machines: A Promise Kept? ACEEE Summer Study on Energy Efficiency in Industry. 2005. Available online: https://www.aceee.org/files/proceedings/2005/data/papers/SS05_Panel01_Paper15.pdf (accessed on 29 November 2025).
- Chen, J.-Y.; Yang, K.-J.; Huang, M.-S. Optimization of clamping force for low-viscosity polymer injection molding. Polym. Test. 2020, 90, 106700. [Google Scholar] [CrossRef]
- Ferreira, É.J.; Dias, M.D.M.; Schneider, E.L. Analysis of Non-Uniform Expansion Behavior of Injected EVA. Acad. J. Polym. Sci. 2018, 1, 555569. [Google Scholar] [CrossRef]
- Herrera-Rodríguez, T.C.; Ramos-Olmos, M.; González-Delgado, Á.D. A joint economic evaluation and FP2O technoeconomic resilience approach for evaluation of suspension PVC production. Results Eng. 2024, 24, 103069. [Google Scholar] [CrossRef]
- Aguilar-Vásquez, E.; Ramos-Olmos, M.; González-Delgado, Á.D. A Joint Computer-Aided Simulation and Water-Energy-Product (WEP) Approach for Technical Evaluation of PVC Production. Sustainability 2023, 15, 8096. [Google Scholar] [CrossRef]
- Šiprak, L. Energy Analysis of the Shoe Sole Production Process. Master’s Thesis, Faculty of Textile Technology, University of Zagreb, Zagreb, Croatia, 2025. [Google Scholar]
- Olapiriyakul, S. Assessing Water Consumption of S-PVC Resin Manufacturing Process by Life Cycle Assessment. Adv. Mater. Res. 2014, 931–932, 619–623. [Google Scholar] [CrossRef]
- Mihelić-Bogdanić, A.; Špelić, I. Energy Conversion and Process Optimization in the Process Industry, Textbook with Examples of Solved Problems. Školska knjiga d.d: Zagreb, Croatia, 2022; ISBN 978-953-0-30899-2. [Google Scholar]
- Mihelić-Bogdanić, A.; Špelić, I. Energy efficiency optimization in polyisoprene footwear production. Sustainability 2022, 14, 10799. [Google Scholar] [CrossRef]
- Eurostat. Electricity Price Statistics. Available online: https://ec.europa.eu/eurostat/statistics-explained/index.php?title=Electricity_price_statistics#Electricity_prices_for_non-household_consumers (accessed on 5 August 2025).
- Reduced Energy Consumption in Plastics Engineering–2005 European Benchmarking Survey of Energy Consumption and Adoption of Best Practice. 2005. Available online: https://pieweb.plasteurope.com/members/pdf/P204063.PDF (accessed on 29 November 2025).
- Firth, A.; Zhang, B.; Yang, A. Quantification of global waste heat and its environmental effects. Appl. Energy 2019, 235, 1314–1334. [Google Scholar] [CrossRef]
- Viswanathan, V.V.; Davies, R.W.; Holbery, J.D. Opportunity Analysis for Recovering Energy from Industrial Waste Heat and Emissions; U.S. Department of Energy, Office of Scientific and Technical Information (OSTI): Washington, DC, USA, 2006.
- BusinessEurope. High Cost of Energy. World Wide Web. Available online: https://www.businesseurope.eu/media-room/data-hub/high-cost-of-energy/ (accessed on 27 October 2025).
- Mianehrow, H.; Abbasian, A. Energy monitoring of plastic injection molding process running with hydraulic injection molding machines. J. Clean. Prod. 2017, 148, 804–810. [Google Scholar] [CrossRef]
- Muralitharan, T. Energy Conservation in Plastic Injection Moulding Machines. Int. J. Appl. Eng. Res. 2015, 10, 769–782. [Google Scholar]
- Polyvinyl Chloride Market Size & Share Analysis-Growth Trends & Forecasts (2025–2030). Available online: https://www.mordorintelligence.com/industry-reports/polyvinyl-chloride-pvc-market (accessed on 8 May 2025).


Disclaimer/Publisher’s Note: The statements, opinions and data contained in all publications are solely those of the individual author(s) and contributor(s) and not of MDPI and/or the editor(s). MDPI and/or the editor(s) disclaim responsibility for any injury to people or property resulting from any ideas, methods, instructions or products referred to in the content. |
© 2025 by the authors. Licensee MDPI, Basel, Switzerland. This article is an open access article distributed under the terms and conditions of the Creative Commons Attribution (CC BY) license (https://creativecommons.org/licenses/by/4.0/).