Abstract
Municipal solid waste (MSW) composition and properties play a critical role in determining the efficiency and environmental impact of waste incineration processes. However, the effects of moisture variation in MSW on combustion performance in full-scale grate systems remain insufficiently understood. To reveal how the moisture variation in municipal solid waste (MSW) properties affects the combustion process in full-scale grate systems, a 50 t/d mechanical grate incinerator was modeled. The influence of MSW inlet moisture content (42.85%, 35.71%, and 28.57%) was investigated. When the moisture content is 35.71%, the horizontal and vertical temperature gradient of the incinerator was least pronounced, and the high-temperature zone in the incinerator would not be locally concentrated. The moderate ignition position could reduce the corrosion of the front and rear arches of the grate incinerator. In the combustion process of three moisture contents, the complete evaporation positions were located at X = 4.23 m in the combustion section, X = 3.15 m in the drying section and X = 2.63 m in the drying section, the corresponding ignition points were X = 6 m, X = 4.47 m, and X = 3.74 m in the combustion section, respectively. After the moisture content was reduced to 35.71% and 28.57%, the drying process was advanced by 25.5% and 37.8%, respectively; the ignition points were advanced by 25.5% and 37.7%, respectively. It is recommended that the moisture content of MSW be maintained within the range of 33.8% to 41.6% under practical operating conditions. With the decrease in the moisture content of the MSW, the O2 content at the incinerator outlet decreased; the CO2 content increased. The findings offer quantitative guidance on feed pre-treatment for MSW incineration plants.
1. Introduction
With the acceleration of the urbanization process in China and the continuous improvement in residents’ living standards and consumption ability, the production of municipal solid waste (MSW) continues to rise. In 2023, China’s MSW clearance volume reached 254.08 million tons [1], 47.39% higher than in 2013. MSW incineration is currently the most important MSW disposal method in China. According to the data of National Bureau of Statistics of China, in 2022, the amount of harmless treatment of MSW through incineration accounts for 79.9% of the total amount of MSW, and the number of harmless treatment plants for MSW incineration has increased to 648. However, there are still some problems in MSW treatment facilities, such as insufficient processing capacity and unbalanced regional development. There are only 349 harmless treatment plants for MSW incineration in townships of China and the amount of harmless treatment of MSW through incineration accounts for only 62.6%. At present, there is still a big gap in the treatment of MSW incineration in most township–level regions in China, and the market of MSW incineration equipment has great potential [2]. There are mainly four types of MSW incinerators: fluidized bed incinerator, rotary kiln incinerator, pyrolysis gasification incinerator and mechanical grate incinerator [3]. Among them, the mechanical grate incinerator is widely used because of its large processing capacity and high adaptability to a wide range of MSWs [4].
Due to the advantages of low investment cost, high efficiency, detailed data and high accuracy [5], the numerical simulation method is gradually replacing the traditional engineering test method and becoming the preferred tool for the optimization and design of grate MSW incinerator. The process of MSW incineration is often divided into the gas–solid combustion process of the grate bed and the gas phase combustion process in the incinerator. The gas–solid combustion process mainly adopts the Continuous Medium Method [6,7,8] (CM) and the Discrete Element Method [9,10,11] (DEM). In the choice of the continuum method, most researchers used the two–dimensional transient model developed by Yang et al. [12], which was developed into FLIC (Fluid Dynamics Incinerator Code) software. The combustion process of the MSW was divided into four phases, namely, drying, volatile release, volatile combustion, and coke combustion. Based on the approximate reaction mechanism, Ma et al. [13] developed the BASIC (bulk accumulated solids incineration code) model to simulate the physicochemical reaction of MSW particles on the grate bed. The Discrete Element Method (DEM) mainly uses EDEM, ROCKEY, etc., to track the movement of bed particles. Simsek et al. [14] and Wissing et al. [15] used the DEM to couple the transient DEM simulation with ANSYS FLUENT gas phase flow field simulation above the bed. The simulated gas temperature above the bed is consistent with the actual measurement results. The gas phase combustion process in the incinerator is generally simulated by computational fluid dynamics software such as ANSYS FLUENT or CFX.
In practical application, the optimization of the various operating parameters is of great significance to improve the incineration characteristics. Yan et al. [16] studied the effect of preheating temperature of primary air in the range of 453~513 K on the combustion characteristics of MSW. Studies have shown that the higher primary air temperature improves combustion efficiency; however, the benefit becomes marginal when the temperature is further increased. Accordingly, it is determined that the primary air temperature of 453 K is the optimal working condition. Liu et al. [17] analyzed the effects of different primary and secondary air ratios, air volume and incident angle on the combustion process and nitrogen oxide emissions. The results show that with the increase in air volume in the second combustion section of the grate, a larger area of local high-temperature zone will be formed above the grate, and the mass fraction of CO will decrease, thus promoting the formation of NO. Xia et al. [18] investigated the effects of different operating conditions on the distribution and emission level of dioxins in the incinerator. The results show that the MSW feeding rate, grate speed and primary airflow rate had a significant effect on the emission of dioxins. Yang et al. [19,20] explored the effects of different air supply methods on combustion state, NOx, and selective non–catalytic reduction denitrification. Studies have shown that optimized air supply can suppress initial NOx formation and enhance selective non–catalytic reduction denitrification efficiency.
Similarly, the heterogeneity of MSW physical and chemical properties will significantly affect the combustion results. Wang et al. [21] studied the influence of moisture content and inlet temperature on the incineration characteristics of MSW. With the increase in MSW content, the incineration process is delayed, and the secondary combustion area in the incinerator moves to the rear arch, which increases the corrosion risk of the incinerator rear arch. MSW incineration has the best effect when the feed temperature is 40 °C. However, in actual operation, it is recommended to use a feed temperature of 30 °C, which will reduce the risk of incinerator wall coking. Gu et al. [22] studied the combustion characteristics in the incinerator after the moisture content was reduced from 45.40% to 39.2%. It was found that reducing the moisture content of garbage without changing the combustion conditions would lead to unreasonable utilization of oxygen, uneven temperature distribution and poor flue gas mixing in the incinerator. Xu et al. [23] also found that as the moisture increased from 25% to 40%, the outlet flue gas temperature decreases by 140 K. Lin et al. [24] studied the characteristics of mixed combustion of high nitrogen content sludge and MSW. The results showed that increasing the proportion of sludge blending reduced the incinerator temperature, which was not conducive to NOx emission control. It is recommended that the maximum sludge blending ratio of the incinerator should not exceed 13%. Liu et al. [25] found that, due to sludge mixing, the mass percentage of the remaining garbage on the grate and the NOx formation rate increased, the char combustion rate, and the volatile release rate decreased, resulting in a decrease in the combustion temperature.
Despite previous studies providing optimization directions for incineration, the following research gaps remain: (1) In the current calculation method of grate–incinerator coupling, the incinerator is usually divided into two parts and modeled separately, ignoring the strong coupling effect between the grate and the incinerator. (2) The Continuous Medium Method is usually used to simulate the MSW on the grate bed, which regarded MSW as a fluid, ignoring the discreteness of the MSW. (3) Most studies have simplified the geometric model of the grate, ignoring the influence of the grate structure on the gas–solid combustion under turbulent conditions.
This paper developed a 50 t/d mechanical grate incinerator model to conduct the simulation and experimental study. The simulations of MSW incineration characteristics are carried out by using CFD method The innovative points of this research are as follows: (1) A full-scale simulation of the MSW incineration process is conducted, in which grate combustion and furnace combustion are directly coupled to minimize computational errors and enhance simulation accuracy. (2) The Lagrangian approach is employed to discretize MSW particles, better reflecting the actual combustion behavior. (3) The geometric model of the small grate on the three sections is simulated, and the influence of the grate structure on gas–solid combustion under turbulent conditions is considered. (4) Model reliability was confirmed by comparing measured and predicted temperatures at the monitoring locations. The results of the study provide a comprehensive understanding of MSW combustion in a full-scale incinerator.
2. Material and Methods
2.1. Incinerator Operating Conditions and MSW Properties
As shown in Figure 1, the study focused on a 50 t/d reciprocating grate incinerator from Tianyun Low–carbon New Energy Technology Co., Ltd. Dalian, Liaoning, China. The grate had three sections with lengths of 3.15 m, 4.22 m, and 2.12 m, respectively, which were the drying section, the combustion section, and the burnout section. Each section was composed of 5, 8, and 4 groups of fixed grates and moving grates alternately assembled. The grate inclination angle was 18°. The grate moved in the same direction as the MSW; both its speed and cycle could be adjusted to vary the residence time according to MSW characteristics and combustion behavior.
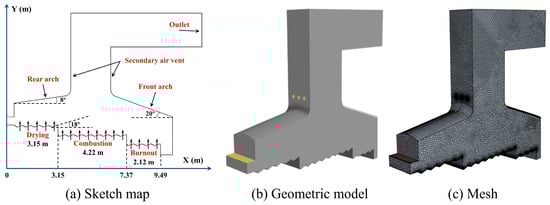
Figure 1.
Parameters (a), geometric model (b) and mesh division (c) of incinerator.
The primary air preheated by hot flue gas was sent into the lower air chamber of the grate, and blown out through the gap between the grate blocks and the pores on the grate. The three sections’ inlet air volumes were 0.44 kg/s, 1.22 kg/s, 0.55 kg/s, and the inlet air temperature was 473 K. The secondary air nozzles were arranged on the front and rear walls of the secondary combustion chamber. The number of nozzles was 4 on each side, and the total air inlet was 0.54 kg/s. The proximate analysis and ultimate analysis of MSW are shown in Table 1.

Table 1.
The proximate analysis and ultimate analysis of MSW.
2.2. Methods
In this study, the commercial software Star CCM+ was used to simulate the grate bed combustion process and the gas phase combustion process in the incinerator. The geometric model was constructed at 1:1 to the real incinerator. The primary and secondary air inlets were set as the mass flow inlet, and the incinerator outlet was set as the pressure outlet. The standard κ–ε turbulence model was used to model the turbulence, the gas phase combustion was modeled by the Hybrid Eddy Break-Up model in the species transport model, the DO model was used as the radiative heat transfer model, and the SIMPLE algorithm was adopted to solve the pressure–velocity coupling between continuity equation and Navier–Stokes equation.
2.3. Grid–Independent Verification and Model Validation
To save computational resources while ensuring accurate results, a grid–independence study was performed. Six grid densities were generated: Grid 1 (59,710), Grid 2 (84,510), Grid 3 (102,590), Grid 4 (124,050), Grid 5 (166,855) and Grid 6 (252,980). The temperature and mass fraction of O2 distribution along the MSW transport direction at height 0.5 m above the drying section are shown in Figure 2. The results show that the temperature and the mass fraction of O2 variation became negligible once the grid exceeds 124,050 cells; therefore, Grid 4 (124,050 cells) was selected for all subsequent simulations.
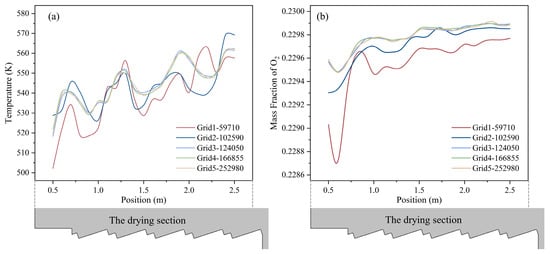
Figure 2.
The temperature (a) and mass fraction of O2 (b) distribution along the MSW transport direction at height 0.5 m above the drying section (position is the distance to the inlet).
To verify the accuracy of the simulation, the simulated temperature of the front arch, rear arch, and secondary combustion chamber was compared with the measured temperature, as shown in Figure 3. The simulation results showed that the temperature of the simulation results was close to the measured temperature, which verified the accuracy of the simulation.
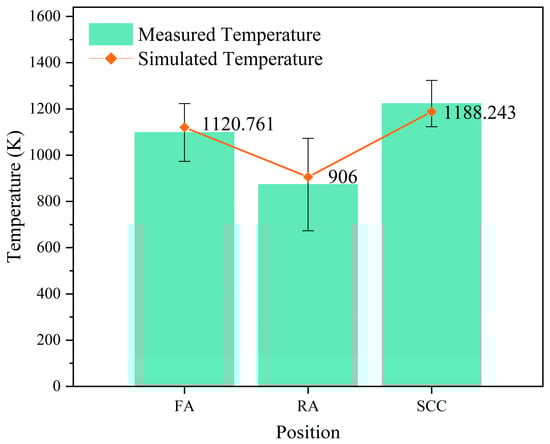
Figure 3.
Comparison of measured temperature and simulated temperature at FA (front arch), RA (rear arch), and SCC (second combustion chamber).
3. Mathematical Model
3.1. Model Assumption
The process of MSW incineration involves solid phase and gas phase reactions, and it is necessary to simplify the MSW incineration model reasonably. The assumptions in this paper are as follows:
MSW was homogeneous particles and the MSW components were simplified to moisture, volatile, fixed carbon, and ash.
The MSW pyrolysis products were simplified to CO, CO2, N2, O2, SO2, H2.
3.2. Transport Equations
The Eulerian model and the Lagrangian model used different transport equations [26], as shown in Figure 4. The solid phase transport equations are presented as follows.
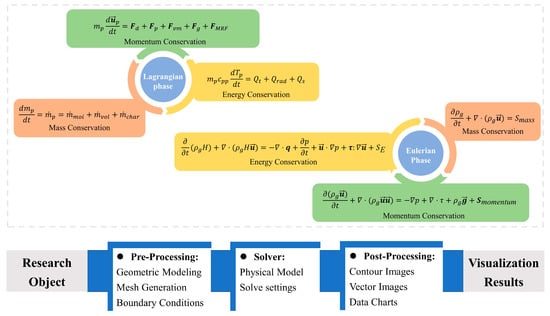
Figure 4.
Workflow for multiphase flow and thermochemical reaction simulation.
- (1)
- Mass conservation equation
- (2)
- Momentum equation
is the instantaneous particle velocity, m/s; is the drag force, N, expressed as follows:
where = − is the particle slip velocity, m/s; is the projected area of the particle, m2; is the drag coefficient of the particle. In this study, we used the Schiller–Naumann correlation to define the drag coefficient, which is suitable for calculating the drag coefficient of particles moving in fluid. is the pressure gradient force, N:
where is the volume of the particle, m3; is the static pressure in the continuous phase, Pa; is the virtual mass force, N, is an inertial force produced by relative motion between different phases in two–phase flow or multiphase flow:
is the virtual mass coefficient.
- (3)
- Energy equation
is the specific heat capacity of particles, J/(kg·K); is the temperature of particle, K; is the other sources; is the rate of convective heat transfer to the particle from the continuous phase, expressed as follows:
is the particle surface area, m2; is a mass transfer correction; is the heat transfer coefficient, W/(m2·K), which is given in terms of the particle Nusselt number:
is formulated by Ranz–Marshall correlation:
where is the Prandtl number of the continuous phase, expressed as follows:
is constant pressure heat capacity of the continuous phase, J/(kg·K); is the rate of radiative heat transfer:
where is the absorption efficiency of the particle, W; is the incident radiative heat flux, W/m2; is Stefan–Boltzmann constant. In this study, the Discrete Ordinates Method model is used, which is suitable for the medium that can absorb and emit thermal radiation.
3.3. Solid Bed Combustion Mechanism
The combustion process of MSW on the grate includes moisture evaporation, volatile pyrolysis, and fixed carbon combustion. The reaction mechanism of each stage is as follows.
3.3.1. Moisture Evaporation
The moisture evaporation process in the MSW uses the moisture evaporation model in the software. The rate of change in moisture mass can be written as :
where is the Spalding transfer number [27]; is the mass transfer conductance. The moisture evaporation model is divided into two modes.
- (1)
- Heat Transfer Limited Evaporation
When the vapor on the surface of MSW particles is saturated, the latent heat of evaporation of moisture is balanced with convection and radiation heating, and the surface temperature of MSW particles is maintained at saturation temperature. The condition of vapor saturation is that the surface equilibrium mole fraction of vapor exceeds 1:
where is the vapor saturation pressure at the MSW surface temperature, Pa, which is defined by Antoine Equation [28]:
A, B and C are the coefficients of the equation and in this study, A, B and C are 11.95, 3978.2 and −39.8, respectively. Under this condition, the Spalding transfer number is as follows:
is the moisture latent heat of vaporization, (J/kg), which is obtained by the Clausius–Clapeyron method [28]. is expressed as follows:
- (2)
- Vapor Diffusion Limited Evaporation
When the vapor on the surface of MSW particles is not saturated, the evaporation rate depends on the ratio of vapor diffusion from MSW particles. Spalding is expressed as follows [29]:
where is the vapor mass fraction; is the surface equilibrium vapor mass fraction.
is the molecular weight of vapor at the MSW particle surface; is the molecular weight of gas mixture at the MSW particle surface; is expressed as follows:
where is the molecular diffusivity of the vapor, m2/s; is the Sherwood number of particle:
is the Schmidt number of the continuous phase:
is the molecular diffusivity of the continuous phase, m2/s.
3.3.2. Volatile Pyrolysis
Volatile pyrolysis is dominated by different mechanisms in different temperature regions. The two competing reaction models [30] can be used to predict the phenomenon of low–temperature slow release and high–temperature rapid release at the same time. Otherwise, the simulation results will be seriously out of line with the experiment.
is the maximum volatile mass in MSW; and are the volatile fraction at low temperature and high temperature, respectively; and are the reaction rate constants of pyrolysis process at low temperature and high temperature, respectively, which are defined by Arrhenius equation. and are the pre-exponential factors of pyrolysis process at low temperature and high temperature, respectively, 1/s; and are the activation energy of pyrolysis process at low temperature and high temperature, respectively, J/mol; is gas constant, 8.314 J/(mol·K).
3.3.3. Char Combustion
The oxidant diffuses to the surface of the particles and reacts with char. Reaction rates of char oxidation reactions are shown in Table 2. The three oxidants considering the oxidation reaction of char are , and . The specific reaction equation is as follows:
is the rate constant of char oxidation reaction, which is defined by the kinetic triplets of Arrhenius equation. The reaction rate of the char oxidation process is determined by the combined effect of the Arrhenius reaction rate and the diffusion rate of the reactant of gas phase to the particle surface [31]. In this study, half–order char oxidation model was used and the specific expression is as follows:
is the ratio of stoichiometric number of solid phase and gas phase reactants in coke oxidation reaction; is the molecular weight of char; is the concentration of oxidant, kmol/m3; is the mass transfer coefficient, m/s, calculated by the gas phase Sherwood number:
is the molecular diffusivity of oxidant, m2/s; is the Sherwood number of continuous phase:
Table 2.
Reaction rates of char oxidation reactions [32].
Table 2.
Reaction rates of char oxidation reactions [32].
| Reaction Rate | (1/s) | (J/kmol) | |
|---|---|---|---|
| 2.3 | 9.29 × 10⁷ | 0 | |
| 1.33 | 1.47 × 10⁸ | 0 | |
| 3.149 | 1.3 × 10⁸ | 0 |
3.4. Incinerator Gas Combustion Mechanism
The gas phase reactions used in this study are as follows:
The combustible gas is first mixed with the surrounding primary air after being released from the grate bed, so the reaction rate of the gas phase is controlled by the reaction kinetic rate and the turbulent mixing rate. The Eddy Break–Up (EBU) model has significant advantages in predicting temperature field and flame shape [33,34]. The Hybrid EBU model assumes that the minimum value of mixing and chemical kinetic time scale is rate-limiting. Based on this, this study used the Hybrid EBU model to take the minimum value of the mixing time scale and the kinetic reaction rate as the final reaction rate .
is the kinetic reaction rate of reaction . For the reactions like , the expression is as follows:
and are the reaction rate constants of forward and reverse reactions, respectively; is the pre–exponential factor of gas phase reaction, 1/s; is the activation energy of gas phase reaction, J/kmol; is the concentration of the reactant or product, = ; is the reaction index; is the turbulent mixing time scale reaction rate of reaction , and is expressed as follows:
is the turbulence dissipation rate; is the turbulent kinetic energy; and are EBU coefficients; , and are the mass of fuel, oxidant, and product, respectively; , and are the chemical stoichiometric coefficients of fuel, oxidant, and product, respectively; , and are the mass fraction of fuel, oxidant, and product, respectively. Reaction rates of gas combustion reactions are shown in Table 3.
Table 3.
Reaction rates of gas combustion reactions [35].
4. Results and Discussion
4.1. Solid Bed Component Distribution
The temperature distribution of MSW particles when the inlet moisture content of MSW is 42.85% is shown in Figure 5a. In the drying section, the MSW temperature raised slowly. On the one hand, the flue gas temperature was low, and the driving force of convective heat transfer was insufficient; on the other hand, the specific heat capacity of moisture in MSW was high, and the presence of a large amount of moisture significantly inhibited the heating rate. When the surface temperature of the MSW reached the saturation temperature, the moisture evaporation process suppressed the increase in particle temperature. The current operating parameters of the drying section were difficult to match the drying characteristics of such MSW particles, and the moisture of the particles was delayed until reaching X = 4.23 m in the combustion section. The dried MSW continued to be heated by the high–temperature flue gas in the combustion section. Currently, the convective heat transfer temperature gradient increased sharply, and the specific heat capacity of the MSW particles after drying was greatly reduced, which made the MSW temperature rise rapidly.
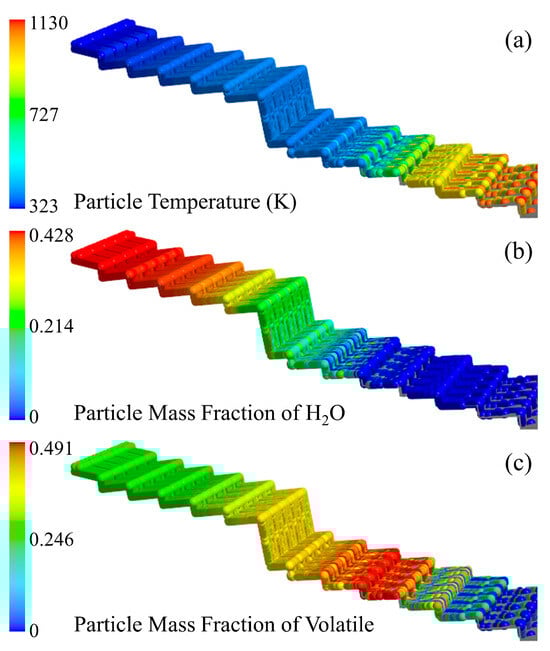
Figure 5.
MSW particle temperature (a), H2O mass fraction (b) and volatile matter mass fraction (c) distribution when the inlet moisture content of the MSW is 42.85%.
The moisture distribution of MSW particles when the inlet moisture content of MSW is 42.85% is shown in Figure 5b. After the MSW entered the incinerator, it gradually heated up under the convective heat transfer of the flue gas and the radiation of the incinerator. Before the temperature of the MSW reached the saturation temperature of moisture, the evaporation rate of moisture was slow; when the temperature raised to the saturation temperature of moisture, the moisture evaporated rapidly, and the content of moisture of the MSW on the fourth group of grates in the drying section changed significantly. This was mainly because the evaporation rate was limited by the diffusion of vapor before reaching the saturation temperature, and the driving force was limited. After reaching the saturation temperature, the heat absorbed by the MSW particles was all used for the latent heat required for moisture evaporation, and the evaporation rate exhibited a giant leap.
It could be seen from the distribution of volatile matter in solid phase when the inlet moisture content of MSW is 42.85% in Figure 5c that the mass change in volatile matter in the drying section was not obvious. With the evaporation of moisture, the proportion of volatile matter increased. After the MSW particles moved to X = 5.35 m in the combustion section, the volatile matter began to release and decompose obviously, and it released completely at the end of the combustion section.
4.2. Distribution of Thermal and Fluid Dynamic Properties
The temperature distribution in the incinerator when the inlet moisture content of the MSW is 42.85% is shown in Figure 6. In the drying section, the temperature near the grate was slightly lower than the primary air temperature due to the evaporation of moisture. The minimum temperature was located near X = 1.7 m in the drying section, and the minimum temperature was the particle saturation temperature (T = 385 K). At the end of the drying section, the radiation effect of the incinerator was significantly enhanced and the temperature was raised. Due to the continuous evaporation of moisture, the temperature in the area X = 1.08 m before the combustion section did not increase significantly. With the complete evaporation of moisture, the flue gas temperature above the grate raised. Under the action of convective heat transfer and incinerator radiation, the volatile matter in the MSW was steadily released and burned. The combustible gas burned most violently at X = 2.85 m in the combustion section above the grate. The highest temperature reached 1390 K, and a high–temperature tongue–like zone was formed. The high-temperature zone rose to the throat of the front side of the incinerator, and the temperature did not increase significantly due to the gradual reduction in primary air and the radiation heat dissipation to the surrounding lower temperature of gas. The throat secondary air was injected at high speed, and the unburned combustible gas was quickly mixed with the secondary air and burned again, so that the flue gas temperature reached the peak and rose to 1590 K. Then the flue gas entered the flue, the temperature decreased along the way, and the average temperature of the outlet section was 1075 K.
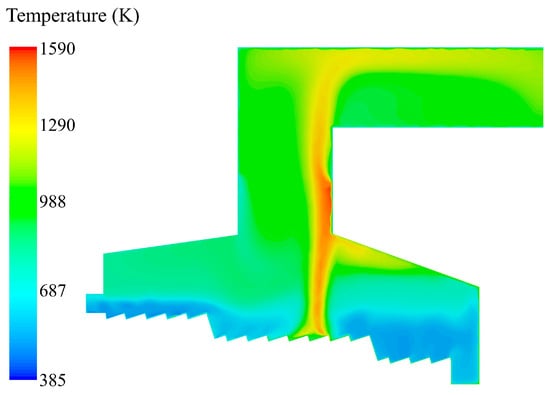
Figure 6.
Temperature distribution in the incinerator when the inlet moisture content of the MSW is 42.85%.
Due to the long drying process of moisture in the MSW, it was not completely dried until reaching the front of the combustion section, resulting in the delay of the ignition point of the MSW. It could be seen from the temperature distribution that the flue gas temperature of the front arch was higher than that of the rear arch, and the maximum temperature reached 1300 K, which would cause the corrosion of the front arch and reduce the life of the refractory bricks. The high temperature in the arch area would cause a large amount of combustible gas to burn above the grate surface. This would cause a list of side effects in the incinerator. The concentration of combustible gas entering the throat would decrease; the combustion intensity of the secondary combustion chamber would decrease; and the carbon content of the fly ash would increase. Subsequently, the combustion characteristics were optimized based on the different moisture contents of the MSW.
In the design of MSW incinerator, the temperature and residence time of flue gas are parameters. The flue gas must remain for more than 2 s in a high-temperature zone greater than 850 °C to ensure the complete cracking of highly toxic organic compounds such as dioxins and furans. In engineering practice, the 3T principle (temperature ≥ 850 °C, residence time ≥ 2 s, turbulence intensity) is usually adopted. As shown in Figure 7b, the residence time of flue gas at the outlet was more than 12 s. Combined with Figure 6, the flue gas temperature in the high-temperature zone from the secondary air inlet to the top of the incinerator was above 1290 K (997 °C), so this incinerator design and the operating condition could meet the regulatory benchmark.
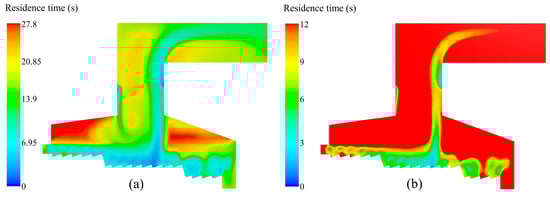
Figure 7.
Gas residence time distribution in the incinerator when the inlet moisture content of the MSW is 42.85%: (a) the maximum residence time is 27.8 s; (b) the maximum residence time is 12 s.
As shown in Figure 8, the flue gas velocity distribution showed that the airflow velocity above the grate bed in the combustion section was significantly higher than that in the drying section and the burnout section. This was due to the rapid increase in gas volume caused by volatilization and combustion. In the meantime, the flue gas temperature here was higher, and the volume expansion further accelerated the flow rate. In the position near the throat of the incinerator, the cross–sectional area of the incinerator reduced, and the flue gas was accumulated, which made the flue gas flow rate increase. With the addition of the secondary air, the flue gas flow rate was up to 7.9 m/s.
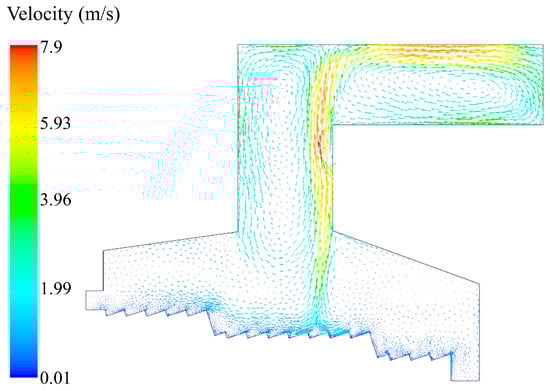
Figure 8.
Velocity distribution in the incinerator when the inlet moisture content of the MSW is 42.85%.
As shown in Figure 9, the turbulent kinetic energy distribution shows that a low-intensity vortex is formed above the bed after the primary air was blown in. As the flue gas was collected at the throat and was mixed by the high–speed secondary air, multiple large vortices were formed. The turbulent mixing intensity in the secondary combustion chamber of the incinerator increased progressively from bottom to top. After the high–speed flue gas hit, the top of the incinerator and the vortex shear strength increased sharply, and the turbulent kinetic energy reached up to 3.5 J/kg, so that the unburned combustible components were fully mixed with oxygen again, which significantly promoted the subsequent combustion reaction.
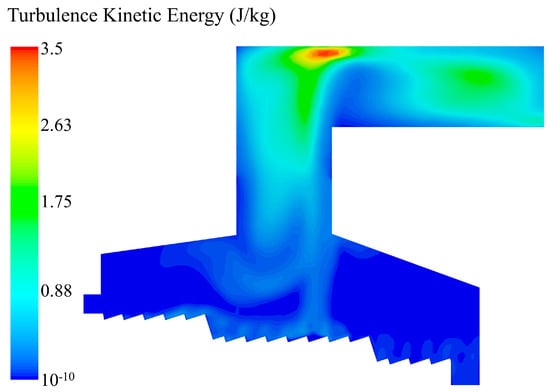
Figure 9.
Turbulent kinetic energy distribution in the incinerator when the inlet moisture content of the MSW is 42.85%.
As shown in Figure 10, the moisture evaporated slowly after the MSW entered the incinerator, and the vapor in the front section of the drying section was little. In the region from X = 2.07 m in the drying section to X = 4.23 m in the combustion section, a large amount of vapor accumulated above the grate bed, so that the moisture evaporation was the fastest in this interval, and the mass fraction of vapor could reach up to 56.7%. After the moisture in the MSW released completely, the volatile matte started to release and be burned to produce vapor, so the vapor content increased again. Until the MSW ran to X = 6.35 m in the combustion section, the volatile matter was released completely and the vapor was no longer generated. After that, the vapor content above the grate was around 0.
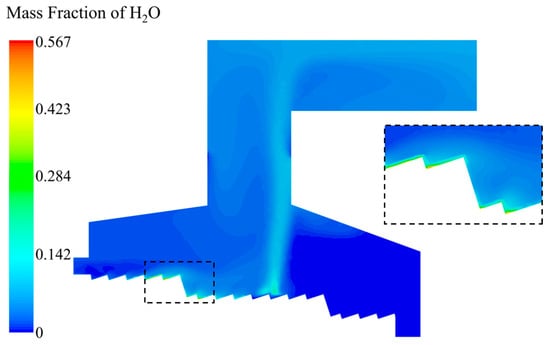
Figure 10.
H2O mass fraction distribution in the incinerator when the inlet moisture content of the MSW is 42.85%.
The distribution of O2 is shown in Figure 11. In the area above the drying section, the O2 content decreased compared with the initial state due to the dilution effect of vapor generated. When the volatile matter began to release, O2 was consumed due to the interaction with CO. At the ignition point of the combustion section, the O2 content was consumed down to 0. The longitudinal O2 content in the incinerator increased progressively with the decrease in the CO content. After the ignition point, the consumption of O2 gradually decreased. The oxidation reaction of the remaining coke still consumed part of O2 until the coke was completely burned out, and the mass fraction of O2 rose to 23% at the slag outlet. At the throat of the incinerator, the mass fraction of O2 supplemented by secondary air was slightly lower than 23% after mixing and consuming with the residual combustible gas.
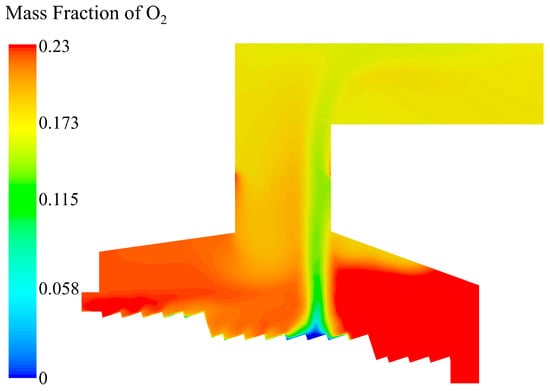
Figure 11.
O2 mass fraction distribution in the incinerator when the inlet moisture content of the MSW is 42.85%.
As shown in Figure 12, at X = 5.35 m in the combustion section, the CO content on the bed increased as the volatile matter in the MSW released and decomposed. The CO content reached the peak at X = 6 m in the combustion section. After the volatile matter in the MSW released completely, the CO content decreased. The remaining coke in the MSW continued to be oxidized and produced CO. As CO diffused in the incinerator, it steadily mixed with O2 and burned, and the CO content in the longitudinal direction of the incinerator gradually decreased. After reaching the secondary air inlet, the residual CO was fully mixed with the O2 replenished by the secondary air, and the CO was almost burned out.
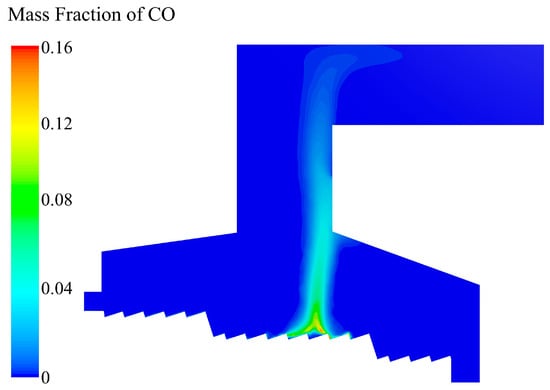
Figure 12.
CO mass fraction distribution in the incinerator when the inlet moisture content of the MSW is 42.85%.
As shown in Figure 13, the CO2 content increased g with the escape of CO, and the highest content was also on the bed at X = 6 m in the combustion section. The increase in temperature in the incinerator mainly came from the combustion process of CO, so the distribution of the CO2 content was basically consistent with the distribution of temperature field.
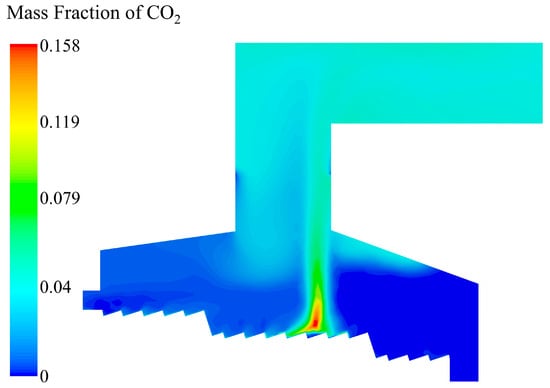
Figure 13.
CO2 mass fraction distribution in the incinerator when the inlet moisture content of the MSW is 42.85%.
The moisture content of 42.85% was the measured value of the on–site MSW, and the simulation has been carried out under this working condition to verify the reliability of the model. The incinerator could treat MSW with different moisture content; however, with the change in moisture content, the temperature distribution, ignition position and pollutant emission in the furnace would be significantly different.
4.3. Comparison of Simulation Results of Different Moisture Content
To explore the influence of moisture content on the combustion characteristics of MSW, MSW with different moisture content was simulated. The moisture content of MSW under the other two operating conditions was 35.71% and 28.57%, which were denoted as case 2 and 3, respectively. The specific distribution of MSW components is shown in Table 4.
Table 4.
MSW component distribution in three moisture content distribution.
Figure 14 shows the temperature distribution of the combustion process by feeding three different moisture content MSW. It can be seen from the temperature distribution that as the moisture content of the MSW decreased, the overall temperature of the incinerator increased significantly, the average temperature of the secondary combustion chamber increased from 1160 K to 1320 K and 1445 K, respectively. This trend was in agreement with the research results of Xu et al. [23]. The moisture content decreased and the temperature in the furnace increased. The decrease in moisture content promoted the ignition point to move forward. There were two reasons: after the decrease in moisture content, the evaporation process would be shortened, and the MSW finished drying earlier and entered the pyrolysis ignition zone; after the moisture content decreased, the specific heat capacity of the mixed MSW decreased. Under the convection and radiation heating conditions, the rate of temperature increase accelerated and reached the ignition temperature of the volatile faster. After the moisture content was reduced to 35.71%, the ignition point was advanced to X = 4.47 m in the combustion section. It reduced the erosion of rear arch by hot flue gas and enhanced the drying and ignition effect of MSW. After the moisture content was reduced to 28.57%, the ignition position of the bed moved further to the upstream, and the ignition point was located at X = 3.74 m in the combustion section. The temperature of the rear arch reached more than 1500 K. When the moisture content is too low, the moisture will evaporate prematurely, and the ignition point will be greatly shifted towards the rear arch, reaching the ignition point at the feeding side of the combustion section. The rear arch area was originally a low flue gas temperature radiation area, and suddenly changed into a high-temperature reaction area, which might increase the risk of chemical erosion and structural damage to the rear arch. As the moisture content became lower, the calorific value of the MSW became higher, the combustion in the incinerator became more intense, and the high-temperature area became wider. The outlet temperature was up to 1320 K. The wall temperature of the heating surface raised. Under the combined action of high temperature and corrosive gases such as SO2, the high-temperature corrosion rate might be accelerated significantly and the service life of the equipment might be shortened. Wang et al. [21] simulated the combustion of MSW with five moisture contents. With the increase in moisture content of MSW, the ignition position above the grate gradually moved forward, which was consistent with the results of this study.
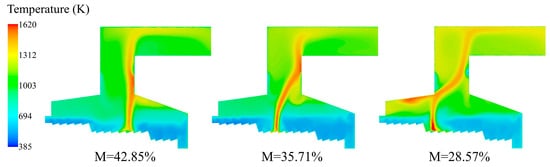
Figure 14.
The temperature distribution of incinerator under three different moisture contents (M = 42.85%, M = 35.71%, M = 28.57%).
Figure 15 shows the average temperature distribution of the combustion section at height 0.5 m above the grate bed under three moisture content conditions. It can be seen more intuitively that under the three moisture content conditions, the positions of the ignition points were X = 6 m, X = 4.47 m, and X = 3.74 m in the combustion section, respectively. When the moisture content decreased to 35.71% and 28.57%, the ignition points were advanced by 25.5% and 37.7%, respectively.
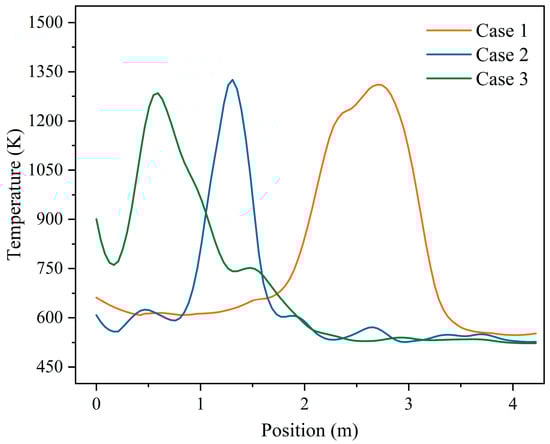
Figure 15.
The average distribution of temperature at height 0.05 m above the grate in the combustion section under three different moisture contents (M = 42.85%, M = 35.71%, M = 28.57%).
As shown in Figure 16, with the decrease in moisture content in the MSW, the vapor content in the incinerator decreased bit by bit, the vapor distribution area gradually decreased, and the vapor content at the outlet also reduced. After entering the incinerator, the moisture progressively evaporated, and the moisture content above the grate increased progressively. When the MSW temperature reached the volatile matter pyrolysis temperature, the volatile matter in the MSW released and burned steadily, and the vapor content above the grate increased again. The positions of complete moisture evaporation in the three conditions were located at X = 4.23 m in the combustion section, X = 3.15 m, and X = 2.63 m in the drying section. After the moisture content is reduced to 35.71% and 28.57%, the drying process is advanced by 25.5% and 37.8%, respectively.
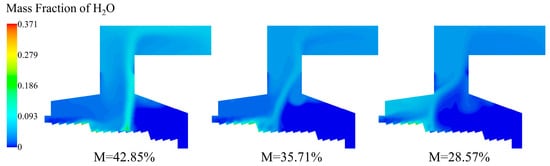
Figure 16.
H2O distribution of incinerator under three different moisture content (M = 42.85%, M = 35.71%, M = 28.57%).
Figure 17 shows the average H2O distribution in the drying section at height 0.05 m above the grate under three moisture content conditions. Due to the dilution effect of the primary air inlet, the vapor content at that location decreased, leading to fluctuations in vapor content above the drying section under all three operating conditions. Since the moisture evaporation process was mainly concentrated in the combustion section under the condition of moisture content of 42.85%, the moisture evaporation in the drying section was less, so the vapor content above the drying section was the lowest under this condition. At the moisture content of 35.71%, the vapor content above the drying section progressively increased. Compared with the moisture content of 28.57%, the condition with a moisture content of 35.71% has a higher moisture content of the MSW; although its moisture evaporation efficiency was lower, the vapor content above the drying section did not drop below that of the 28.57% condition.
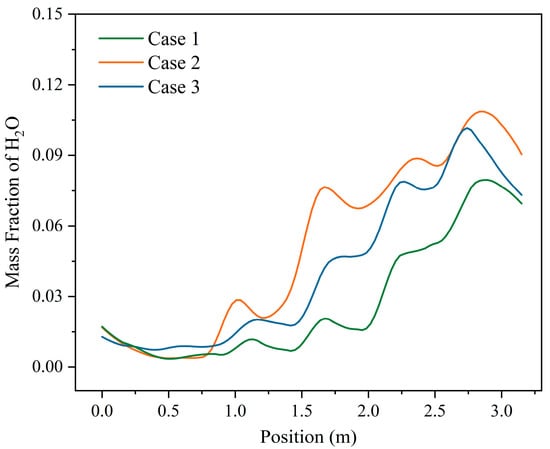
Figure 17.
The average distribution of H2O at height 0.05 m above the grate in the drying section under three different moisture contents (M = 42.85%, M = 35.71%, M = 28.57%).
As the temperature of the MSW particles reached the pyrolysis temperature of the volatile matter, the volatile matter in the MSW released gradually. As shown in Figure 18, the concentrated release positions of volatiles under the three moisture content conditions were different, which correspond to the ignition positions under the three conditions one by one.
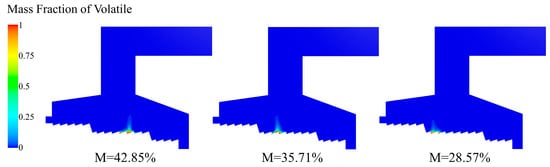
Figure 18.
Volatile distribution of incinerator under three different moisture contents (M = 42.85%, M = 35.71%, M = 28.57%).
Figure 19 shows the CO distribution of incinerator under three different moisture content. As the moisture content in the MSW decreased, the volatile matter content increased and pyrolyzed, and the CO mass fraction in the incinerator increased. Under the three moisture content conditions, the highest-CO-concentration area corresponded to the respective ignition point position.
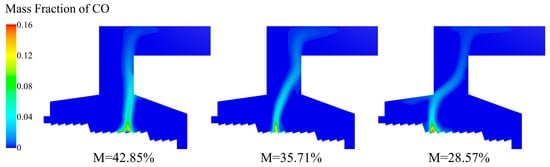
Figure 19.
CO distribution of incinerator under three different moisture contents (M = 42.85%, M = 35.71%, M = 28.57%).
As shown in Figure 20, as the moisture content of the MSW decreased, the mass fraction of CO2 increased and the distribution range expanded synchronously. Under the condition of moisture content of 28.57%, the CO2 was mainly concentrated near the rear arch because the combustion ignition position was too early. Because CO2 carried a lot of sensible heat, the high-value area of CO2 basically coincided with the high-temperature area.
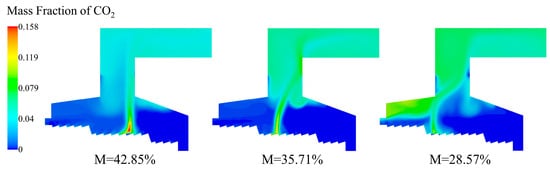
Figure 20.
CO2 distribution of incinerator under three different moisture contents (M = 42.85%, M = 35.71%, M = 28.57%).
From the O2 distribution under different moisture contents in Figure 21, the position of the main combustion area could be clearly judged. The lower the O2 content was, the more intense the combustion was. When the moisture content was 42.85% and 35.71%, the main combustion area of the bed was mostly located above the combustion section, while the combustion position was forward under the condition of 28.57% moisture content, and the area of low-oxygen zone was larger, and the zone where oxygen was consumed in the incinerator was concentrated in the rear arch.
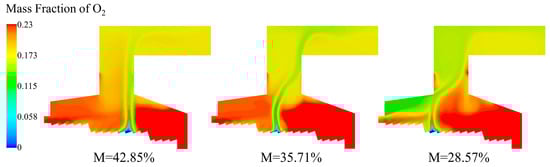
Figure 21.
O2 distribution of incinerator under three different moisture contents (M = 42.85%, M = 35.71%, M = 28.57%).
The average mass fraction of O2 and CO2 at the incinerator outlet under different moisture contents was obtained. As can be seen from Figure 22, with the decrease in the moisture content, the O2 and CO2 at the outlet of the incinerator followed the opposite change rule. With the decrease in the moisture content, the O2 content decreased gradually, reaching a minimum of 16.3% when the moisture content is 28.57%. This was mainly because the high-temperature area in the incinerator was the largest and the calorific value was highest when the moisture content is 28.57%, resulting in an increase in O2 consumption, so that the outlet O2 content was the lowest. With the decrease in the moisture content of the MSW, the CO2 content increased to 6.4% when the moisture content is 28.57%. This is mainly because the combustible gas content in the incinerator increased, and the amount of CO2 produced increased.
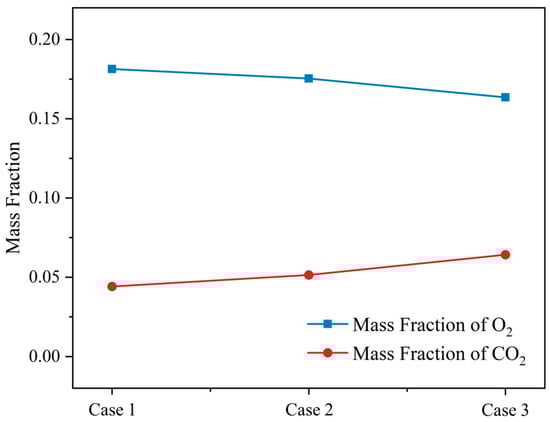
Figure 22.
The mass fraction of O2 and CO2 at the outlet under three different moisture contents (M = 42.85%, M = 35.71%, M = 28.57%).
4.4. Moisture Content Suggestions
The high temperature zone was found to shift toward the rear or front arch under excessive or insufficient moisture content, respectively. Simulation results indicated that a moisture content of 35.7% enabled stable peak temperature localization within the secondary combustion chamber. Elevated temperatures at both the front and rear arches significantly increased the risks of slagging and high temperature corrosion. Based on the correlation between moisture content and ignition position along the grate, it is recommended that the moisture content of MSW be maintained within the range of 33.8% to 41.6% under practical operating conditions. This range effectively mitigates corrosion risks at the front and rear arches. When the moisture content is too high, the running speed of the grate can be appropriately slowed down. This will make the MSW stay on the grate longer, and the MSW ignition point will be advanced. When the moisture content is too low, the opposite method is suggested to be used to delay the ignition point of the grate by reducing the residence time of the MSW on the grate. In terms of cost, as the MSW moisture content is reduced, it is possible to reduce the consumption of auxiliary fuel and directly reduce the operating cost, but at the same time, it is necessary to avoid too low MSW content. In addition, reducing the corrosion probability of front arch and back arch can prolong the service life of refractory, reduce maintenance costs and furnace shutdown losses.
5. Conclusions
To explore the combustion characteristics in a small MSW incinerator, a mechanical grate incinerator with a daily processing capacity of 50 tons was simulated by Eulerian–-Lagrangian method. The combustion characteristics of three kinds of MSW with different moisture contents were compared. The combustion performance of the MSW with a moisture content of 35.7% was significantly better than that of the other two groups; The horizontal and vertical temperature gradients in the furnace were the smallest. The high-temperature zone was not locally concentrated. Instead, it was evenly distributed. A moderate ignition position helped reduce corrosion of the front and rear arches. After the moisture content was reduced to 35.71% and 28.57%, the drying process was advanced by 25.5% and 37.8%, respectively. The ignition points were also advanced by 25.5% and 37.7%. As the moisture content decreased, the oxygen content at the incinerator outlet gradually dropped. Meanwhile, the carbon dioxide content gradually increased. It is recommended that the moisture content of MSW be maintained between 33.8% and 41.6% under practical conditions. The ignition position of MSW with too high or too low moisture content can be controlled by adjusting the grate speed. A moderate reduction in moisture content can lower operating costs. Reducing arch corrosion also lowers maintenance costs and downtime losses. Investigating the ignition position of MSW with different moisture content distributions is essential. Studying the performance optimization of MSW incinerators is of great practical significance.
Author Contributions
J.D.: conceptualization, software, validation, writing—original draft preparation, visualization. Y.D.: conceptualization, resources, data curation. Y.X.: funding acquisition, resources, data curation, formal analysis, visualization. D.Z.: methodology, investigation, writing—original draft preparation, visualization. L.L.: visualization. Y.G.: supervision, writing—review and editing. G.J.: conceptualization, methodology, formal analysis, writing—review and editing, funding acquisition, project administration. All authors have read and agreed to the published version of the manuscript.
Funding
This research was financially supported by fund from Liaoning Provincial Science and Technology Plan Project [2023JH1/10400007] and Key Laboratory of Hubei Province for Coal Conversion and New Carbon Materials (Wuhan University of Science and Technology) [WKDM202506].
Data Availability Statement
The original contributions presented in this study are included in the article. Further inquiries can be directed to the corresponding author(s).
Acknowledgments
The financial support from Liaoning Provincial Science and Technology Plan Project [2023JH1/10400007] and Key Laboratory of Hubei Province for Coal Conversion and New Carbon Materials (Wuhan University of Science and Technology) [WKDM202506].
Conflicts of Interest
Author Yingnan Du was employed by the Tianyun Low-carbon New Energy Technology Co., Ltd. Author Li Liu was employed by the Anhui Conch Biomass Energy Technol Co., Ltd. The remaining authors declare that the research was conducted in the absence of any commercial or financial relationships that could be construed as a potential conflict of interest.
Nomenclature
| mass of MSW particles, kg | |
| rate of mass change in MSW particle, kg/s | |
| rate of mass change in moisture in MSW particle, kg/s | |
| rate of mass change in volatiles in MSW particle, kg/s | |
| rate of mass change in char in MSW particle, kg/s | |
| time, s | |
| instantaneous particle velocity, m/s | |
| gravity force, N | |
| drag force, N | |
| pressure gradient force, N | |
| virtual mass force, N | |
| particle slip velocity, m/s | |
| projected area of the particle, m2 | |
| drag coefficient of the particle | |
| volume of the particle, m3 | |
| static pressure in the continuous phase, Pa | |
| virtual mass coefficient | |
| specific heat capacity of particles, J/(kg·K) | |
| constant pressure heat capacity of the continuous phase, J/(kg·K) | |
| temperature of particle | |
| rate of convective heat transfer to the particle from the continuous phase, W | |
| particle surface area, m2 | |
| mass transfer correction | |
| heat transfer coefficient, W/(m2·K) | |
| particle Nusselt number | |
| Prandtl number of the continuous phase | |
| rate of radiative heat transfer, W | |
| incident radiative heat flux, W/m2 | |
| Spalding transfer number | |
| mass transfer conductance | |
| moisture latent heat of vaporization, (J/kg) | |
| vapor mass fraction | |
| surface equilibrium vapor mass fraction | |
| molecular weight of vapor at the MSW particle surface | |
| molecular weight of gas mixture at the MSW particle surface | |
| molecular diffusivity of the vapor, m2/s | |
| Sherwood number of particle | |
| Schmidt number of the continuous phase | |
| molecular diffusivity of the continuous phase, m2/s | |
| reaction rate constants of pyrolysis process at low temperature | |
| reaction rate constants of pyrolysis process at high temperature | |
| pre-exponential factors of pyrolysis process at low temperature, 1/s | |
| pre-exponential factors of pyrolysis process at high temperature, 1/s | |
| activation energy of pyrolysis process at low temperature, J/mol | |
| activation energy of pyrolysis process at high temperature, J/mol | |
| gas constant | |
| molecular weight of char | |
| concentration of oxidant, kmol/m3 | |
| mass transfer coefficient, m/s | |
| molecular diffusivity of oxidant | |
| pre-exponential factor of gas phase reaction, 1/s | |
| activation energy of gas phase reaction, J/kmol | |
| EBU coefficient | |
| Stefan–Boltzmann constant | |
| volatile fraction at low temperature | |
| volatile fraction at high temperature | |
| ratio of stoichiometric number of solid phase and gas phase reactants |
References
- National Bureau of Statistics of People’s Republic of China. China Statistical Yearbook. 2023. Available online: https://data.stats.gov.cn/index.htm (accessed on 18 November 2024).
- Sarabhorn, P.; Sitthichirachat, P.; Siripaiboon, C.; Khaobang, C.; Somkeattikul, K.; Ding, L.; Areeprasert, C. Community-scale co-incineration of pre-sorted MSW with wood pellet using a decoupling gasifier and integrated burner for syngas combustion. J. Clean. Prod. 2025, 487, 144588. [Google Scholar] [CrossRef]
- Cheng, S.; Ding, X.; Dong, X.; Zhang, M.; Tian, X.; Liu, Y.; Huang, Y.H.; Jin, B. Immigration, transformation, and emission control of sulfur and nitrogen during gasification of MSW: Fundamental and engineering review. Carbon Resour. Convers. 2023, 6, 184–204. [Google Scholar] [CrossRef]
- Blasenbauer, D.; Huber, F.; Mühl, J.; Fellner, J.; Lederer, J. Comparing the quantity and quality of glass, metals, and minerals present in waste incineration bottom ashes from a fluidized bed and a grate incinerator. Waste Manag. 2023, 161, 142–155. [Google Scholar] [CrossRef] [PubMed]
- Smith, J.D.; Sreedharan, V.; Landon, M.; Smith, Z.P. Advanced design optimization of combustion equipment for biomass combustion. Renew. Energy 2020, 145, 1597–1607. [Google Scholar] [CrossRef]
- Tang, J.; Zhuang, J.; Aljerf, L.; Xia, H.; Wang, T.; Gao, B. Numerical simulation modelling on whole municipal solid waste incineration process by coupling multiple software for the analysis of grate speed and air volume ratio. Process Saf. Environ. Prot. 2023, 176, 506–527. [Google Scholar] [CrossRef]
- Ismail, T.M.; Abd El-Salam, M.; El-Kady, M.A.; El-Haggar, S.M. Three dimensional model of transport and chemical late phenomena on a MSW incinerator. Int. J. Therm. Sci. 2014, 77, 139–157. [Google Scholar] [CrossRef]
- Álvarez-Bermúdez, C.; Chapela, S.; Gómez, M.A.; Porteiro, J. CFD simulation of a 4 MW biomass grate furnace using an Eulerian fixed-bed model: Validation of in-bed and freeboard results. Fuel 2025, 387, 134378. [Google Scholar] [CrossRef]
- Zhang, H.; Okuyama, K.; Higuchi, S.; Soon, G.; Lisak, G.; Law, A.W.-K. CFD-DEM simulations of municipal solid waste gasification in a pilot-scale direct-melting furnace. Waste Manag. 2023, 162, 43–54. [Google Scholar] [CrossRef]
- Scherer, V.; Wirtz, S.; Krause, B.; Wissing, F. Simulation of Reacting Moving Granular Material in Furnaces and Boilers an Overview on the Capabilities of the Discrete Element Method. Energy Procedia 2017, 120, 41–61. [Google Scholar] [CrossRef]
- Eslami, A.; Kazemi, S.; Hamidani, G.; Zarghami, R.; Mostoufi, N. CFD-DEM modeling of biomass pyrolysis in a DBD plasma fluidized bed. Int. J. Hydrogen Energy 2025, 196, 152553. [Google Scholar] [CrossRef]
- Yang, Y.B.; Goh, Y.R.; Zakaria, R.; Nasserzadeh, V.; Swithenbank, J. Mathematical modelling of MSW incineration on a travelling bed. Waste Manag. 2002, 22, 369–380. [Google Scholar] [CrossRef] [PubMed]
- Ma, W.; Liu, X.; Ma, C.; Gu, T.; Chen, G. BASIC: A Comprehensive Model for SOx Formation Mechanism and Optimization in Municipal Solid Waste (MSW) Combustion. ACS Omega 2022, 7, 3860–3871. [Google Scholar] [CrossRef]
- Simsek, E.; Brosch, B.; Wirtz, S.; Scherer, V.; Krüll, F. Numerical simulation of grate firing systems using a coupled CFD/discrete element method (DEM). Powder Technol. 2009, 193, 266–273. [Google Scholar] [CrossRef]
- Wissing, F.; Wirtz, S.; Scherer, V. Simulating municipal solid waste incineration with a DEM/CFD method—Influences of waste properties, grate and furnace design. Fuel 2017, 206, 638–656. [Google Scholar] [CrossRef]
- Yan, M.; Antoni; Wang, J.; Hantoko, D.; Kanchanatip, E. Numerical investigation of MSW combustion influenced by air preheating in a full-scale moving grate incinerator. Fuel 2021, 285, 119193. [Google Scholar] [CrossRef]
- Liu, J.; Xie, Z.; Guo, B.; Xu, Y.; Wang, Q.; Guo, X.; Bai, L.; Long, J. The effect of air distribution on the characteristics of waste combustion and NO generation in a grate incinerator. J. Energy Inst. 2024, 117, 101827. [Google Scholar] [CrossRef]
- Xia, H.; Tang, J.; Aljerf, L.; Chen, J. Unveiling dioxin dynamics: A whole-process simulation study of municipal solid waste incineration. Sci. Total Environ. 2024, 954, 176241. [Google Scholar] [CrossRef]
- Yang, X.; Liao, Y.; Ma, X.; Zhou, J. Effects of air supply optimization on NOx reduction in a structurally modified municipal solid waste incinerator. Appl. Therm. Eng. 2022, 201, 117706. [Google Scholar] [CrossRef]
- Yang, X.; Liao, Y.; Wang, Y.; Chen, X.; Ma, X. Research of coupling technologies on NOx reduction in a municipal solid waste incinerator. Fuel 2022, 314, 122769. [Google Scholar] [CrossRef]
- Wang, Y.; Ma, H.; Zeng, W.; Bu, Q.; Yang, X. Influence of moisture content and inlet temperature on the incineration characteristics of municipal solid waste (MSW). Appl. Therm. Eng. 2025, 258, 124677. [Google Scholar] [CrossRef]
- Gu, T.; Ma, W.; Berning, T.; Guo, Z.; Andersson, R.; Yin, C. Advanced simulation of a 750 t/d municipal solid waste grate boiler to better accommodate feedstock changes due to waste classification. Energy 2022, 254, 124338. [Google Scholar] [CrossRef]
- Xu, F.; Teng, L.; Yang, M.; Ye, N.; Yin, L.; Liu, Z.; Chen, D. Research on combustion characteristics and parameter optimization of a 500 t/d municipal solid waste incinerator. Energy 2025, 331, 137074. [Google Scholar] [CrossRef]
- Lin, T.; Liao, Y.; Dai, T.; Ma, X. Investigation on co-disposal technology of sludge and municipal solid waste based on numerical simulation. Fuel 2023, 343, 127882. [Google Scholar] [CrossRef]
- Liu, J.; Xie, Z.; Xu, Y.; Zhang, Q.; Han, Y.; Wang, Q.; Cui, E.; Chen, G. Synergetic effect of sludge co-combustion and flue gas recirculation in a waste incinerator: Combustion optimization and NOx reduction. Fuel 2026, 407, 137454. [Google Scholar] [CrossRef]
- Zhang, D.; Anjum, T.; Chu, Z.; Cross, J.S.; Ji, G. Simulation of multiphase flow with thermochemical reactions: A review of computational fluid dynamics (CFD) theory to AI integration. Renew. Sustain. Energy Rev. 2025, 221, 115895. [Google Scholar] [CrossRef]
- Artemov, V.; Beale, S.B.; de Vahl Davis, G.; Escudier, M.P.; Fueyo, N.; Launder, B.E.; Leonardi, E.; Malin, M.R.; Minkowycz, W.J.; Patankar, S.V.; et al. A tribute to D.B. Spalding and his contributions in science and engineering. Int. J. Heat Mass Transf. 2009, 52, 3884–3905. [Google Scholar] [CrossRef]
- Wisniak, J. Historical development of the vapor pressure equation from dalton to antoine. J. Phase Equilibria 2001, 22, 622–630. [Google Scholar] [CrossRef]
- Sirignano, W.A. Fluid Dynamics and Transport of Droplets and Sprays. J. Fluids Eng. 2000, 122, 190. [Google Scholar] [CrossRef]
- Kobayashi, H.; Howard, J.B.; Sarofim, A.F. Coal devolatilization at high temperatures. Symp. Combust. 1977, 16, 411–425. [Google Scholar] [CrossRef]
- Smoot, L.D.; Smith, P.J. Coal Combustion and Gasification; Plenum Press: New York, NY, USA, 1985; Volume 64, 480p. [Google Scholar] [CrossRef]
- Chen, C.; Horio, M.; Kojima, T. Numerical simulation of entrained flow coal gasifiers. Part I: Modeling of coal gasification in an entrained flow gasifier. Chem. Eng. Sci. 2000, 55, 3861–3874. [Google Scholar] [CrossRef]
- Su, Y.; Chen, C.; Su, A. Simulation of High Temperature Air Combustion with modified Eddy-Break-Up combustion model. Energy Procedia 2012, 14, 127–132. [Google Scholar] [CrossRef]
- Holler, T.; Komen, E.M.J.; Kljenak, I. The role of CFD combustion modelling in hydrogen safety management—VIII: Use of Eddy Break-Up combustion models for simulation of large-scale hydrogen deflagration experiments. Nucl. Eng. Des. 2022, 388, 111627. [Google Scholar] [CrossRef]
- Wu, Y.; Smith, P.J.; Zhang, J.; Thornock, J.N.; Yue, G. Effects of Turbulent Mixing and Controlling Mechanisms in an Entrained Flow Coal Gasifier. Energy Fuels 2010, 24, 1170–1175. [Google Scholar] [CrossRef]
Disclaimer/Publisher’s Note: The statements, opinions and data contained in all publications are solely those of the individual author(s) and contributor(s) and not of MDPI and/or the editor(s). MDPI and/or the editor(s) disclaim responsibility for any injury to people or property resulting from any ideas, methods, instructions or products referred to in the content. |
© 2025 by the authors. Licensee MDPI, Basel, Switzerland. This article is an open access article distributed under the terms and conditions of the Creative Commons Attribution (CC BY) license (https://creativecommons.org/licenses/by/4.0/).