Abstract
This study systematically investigates the evolution of mechanical damage and the permeability response of tight sandstone under triaxial compression and alternating load conditions, with a focus on the safety and stability of deep underground tight sandstone gas storage reservoirs in China subjected to complex geological environments and alternating stress conditions. By integrating conventional triaxial testing, cyclic loading experiments, CT scanning, and fractal dimension analysis, this study elucidates the enhancement effects and transformation mechanisms of confining pressure on the strength behavior and failure patterns of sandstone. It identifies the influence mechanisms of fault roughness on permeability and its convergence behavior under high-stress conditions and comprehensively characterizes the three-stage evolution of sandstone damage at the microscale under cyclic loading. Experimental results showed that with increasing confining pressure, both the peak strength and elastic modulus of sandstone displayed an increasing trend. With confining pressure increasing from 10 MPa to 40 MPa, the peak deviatoric stress increased from 98.42 MPa to 171.00 MPa and the elastic modulus rose from 8.70 GPa to 12.65 GPa. The failure mode transitioned from brittle shear failure under low confining pressure to a ductile-plastic failure pattern under high confining pressure. Alternating loading resulted in a 17.23% reduction in sandstone strength (from 98.42 MPa to 81.46 MPa at 10 MPa confining pressure). At confining pressures > 25 MPa, the permeability differences among faults with different roughness converged to within 10%. These research findings offer a robust experimental foundation and theoretical framework for evaluating the long-term stability and predicting the sealing performance of deep underground gas storage reservoirs.
1. Introduction
With the strategic restructuring of the energy consumption pattern and the progressive implementation of the dual-carbon goals, underground gas storage facilities serve an irreplaceable and critical function in mitigating seasonal supply–demand imbalances and ensuring the security and resilience of the national natural gas supply chain [1,2]. Compared with regions such as North America and Europe, underground gas storage facilities in China are subjected to more complex and challenging geological conditions. Storage facilities in Western countries generally benefit from geologically favorable conditions, including structurally stable formations, relatively shallow burial depths, and low geothermal gradients. In contrast, China’s existing and under-construction gas storage facilities exhibit distinct geological characteristics, including extremely complex fault systems, deeply buried reservoirs (typically exceeding 2500 m), elevated formation temperatures, high operating pressures, and low pressure coefficients [3,4]. This unique geological setting, characterized by the “four highs and one low” pattern, determines that the development of gas storage facilities in China primarily depends on the conversion of existing deep tight sandstone gas reservoirs. Consequently, a comprehensive understanding of the mechanical response behavior of deep tight sandstone reservoirs under high-pressure cyclic injection–production loads, the evolutionary characteristics of internal damage, and the mechanisms governing permeability variation has become a pressing scientific priority and a critical research task. Such knowledge is essential for the optimal design of storage site locations, the long-term evaluation of sealing performance, and the effective control of operational safety [5,6].
In deep underground mining environments characterized by high stress, the elevated confining pressure acting on the surrounding rock represents one of its most essential mechanical features [7]. As mining depth increases, the “three-highs” effects—namely high stress, elevated temperature, and high pore pressure—become progressively more pronounced within the rock mass. Among these factors, the elevated confining pressure resulting from high in situ stress fundamentally controls the mechanical response and failure modes of the surrounding rock [8]. The mechanical response of tight sandstone under complex stress paths has become a central research focus in rock mechanics. Extensive studies have demonstrated that its mechanical properties are predominantly controlled by the effects of confining pressure, cyclic loading–unloading, and post-peak failure behavior. Specifically, increasing confining pressure significantly enhances the strength and deformation modulus of sandstone, suppresses brittle failure tendencies, and facilitates the transition of the failure mode from tensile fracture to shear-dominated or plastic flow behavior [9,10,11]. Secondly, relative to monotonic loading, cyclic loading–unloading paths induce irreversible damage accumulation in rock as a result of fatigue effects. This is manifested through phenomena including elasticity modulus decay, Poisson’s ratio variation, and reduction in peak strength [12,13,14]. For example, Yang et al. [15] demonstrated through triaxial cyclic experiments that the evolution of tight sandstone’s elastic modulus and Poisson’s ratio occurs in four characteristic stages: material strengthening, degradation, failure, and structural slip. Furthermore, the complete stress–strain curve of sandstone, especially the post-peak strain-softening and volumetric expansion behavior, is essential for elucidating its internal damage evolution.
Faults and their associated fracture zones constitute potential risk factors compromising the integrity of gas storage reservoirs. Their permeability is highly sensitive to variations in effective stress and to the geometric configuration of the fault planes. Walsh [16] established the theoretical relationship between crack permeability and effective stress. Subsequent studies have shown that, with increasing effective stress, crack closure leads to an exponential decrease in permeability [16]. In recent years, fracture surface roughness has attracted considerable attention as a critical factor controlling their mechanical and hydraulic behavior. Quantifying this roughness through fractal dimension analysis has emerged as an effective means of linking its geometric characteristics to hydraulic conductivity [17,18]. However, a comprehensive characterization of the systematic evolution and closure behavior of permeability in faults with different roughness under full stress paths, spanning low to high confining pressures, remains unavailable.
On the other hand, periodic injection and withdrawal operations during reservoir exploitation impose long-term alternating loads on the tight sandstone formation, leading to progressive fatigue damage in its mechanical properties [19]. However, current studies remain limited in their ability to fully elucidate the entire process of damage evolution. Acoustic emission (AE) monitoring provides an effective means to capture the spatiotemporal evolution of microfractures through ringing counts, energy release, and localization data [20]. Nevertheless, direct characterization of pore structure and crack morphology remains challenging. Nuclear magnetic resonance (NMR) technology enables precise quantification of pore size distribution and fluid occupancy, providing distinct advantages for characterizing micropore evolution [21]. However, its spatial resolution remains relatively low, limiting the ability to achieve three-dimensional localization and visualization. Although scanning electron microscopy (SEM) provides microscopic morphological information at the micrometer to nanometer scale, revealing cracks between mineral grains and damage to cementing materials, its observational scope is limited [22]. Typically restricted to localized sampling of post-experimental fracture surfaces, SEM cannot achieve real-time, full-field monitoring. The introduction of real-time X-ray computed tomography (real-time CT) provides a breakthrough solution to this limitation. Compared to the aforementioned methods, real-time CT offers distinct advantages, being non-destructive, three-dimensional, dynamic, and quantitative [23,24]. It synchronizes with mechanical loading equipment to dynamically capture the initiation, propagation, and closure of microcracks throughout the stress–strain process, while simultaneously enabling precise calculation of overall porosity and damage distribution via grayscale analysis and three-dimensional reconstruction. This permits visual tracking of damage evolution pathways [25,26]. Therefore, integrating CT scanning with triaxial mechanical testing allows for the “freezing” and in situ observation of damage during loading, offering direct evidence for elucidating rock failure mechanisms.
In summary, existing research remains limited in the following aspects: (1) the absence of quantitative, visual characterization of the entire sandstone damage process; (2) the lack of systematic experimental analysis of the coupling between fracture roughness and permeability. Based on these gaps, this study addresses the key technical challenges associated with complex stress conditions in deep, tight sandstone gas reservoirs. Representative sandstone samples were selected from a certain gas storage reservoir. Systematic triaxial compression and cyclic loading tests were conducted in combination with real-time CT three-dimensional reconstruction, enabling quantitative characterization of damage evolution. Simultaneously, fractal dimension calculations were performed on shear fracture surfaces to investigate the coupling patterns between roughness and permeability. The results provide a scientific basis for assessing mechanical stability and predicting sealing integrity during gas reservoir operation.
2. Materials and Methods
2.1. Rock Samples
Rock samples were collected from the target stratum of a gas storage reservoir, with brown siltstone as the predominant lithology. All core samples were obtained from a depth interval of 2955.0–3016.8 m and meticulously processed into standard cylindrical specimens (Φ25 mm × 50 mm). After polishing, the specimens displayed uniform, fine-grained surfaces, flat end faces, and no visible natural fractures. XRD analysis (Figure 1) indicates that the primary constituents of sandstone in this stratum are quartz (37.84%), sodium feldspar (22.81%), and microcline feldspar (21%), with minor quantities of calcite and clay minerals. Porosity and permeability measurements show that the representative samples possess an average porosity of 16.76% and a gas permeability of 0.6329 mD (As shown in Table 1). These results indicate that the reservoir is of low permeability, exhibiting a weak correlation between porosity and permeability. To evaluate sample homogeneity and minimize experimental variability, wave velocity measurements were performed on all rock specimens. The measured velocities ranged from 2401.77 to 2607.3 m/s, indicating overall good consistency among the specimens.
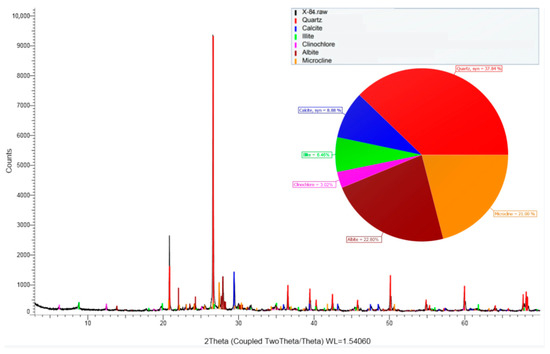
Figure 1.
XRD test results.

Table 1.
Sample parameter information.
2.2. Testing Equipment
2.2.1. Mechanical Testing
Triaxial compression tests were performed using the XT-01 high-temperature, high-pressure triaxial rheometer (Figure 2b). The rheometer has a maximum axial load capacity of 2000 kN, a maximum confining pressure of 100 MPa, and a maximum temperature of 200 °C. Axial deformation was monitored using a small displacement sensor that tracked changes in the position of the loading steel plate, whereas lateral deformation was measured with strain gauges attached to the sample surface via chains. During testing, a thin thermoplastic tube was wrapped around the specimen surface to prevent atmospheric humidity from influencing its mechanical properties and to avoid specimen debris detachment.
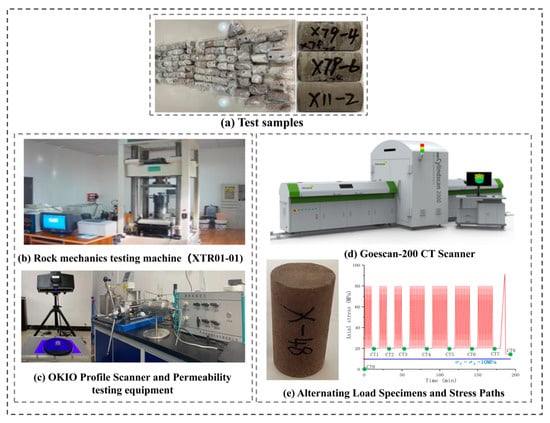
Figure 2.
Schematic of samples and test equipment.
2.2.2. Computed Tomography (CT) Scan
X-ray CT scanning is a non-destructive technique capable of providing accurate imaging and three-dimensional data. To characterize the damage distribution and evolution patterns of tight sandstone reservoir under alternating loading, a full-diameter core X-ray CT system was employed to perform triaxial experiments. By combining staged loading/unloading with real-time CT scanning, the experiments enabled quantitative characterization of sandstone damage evolution. The CT system (Goescan-200) has an annular pressure capacity of <30 MPa, axial pressure < 100 MPa, resolution of 100 μm, scanning speed of 15 min/m, and accommodates specimens up to 36 × 80 mm (Figure 2d).
2.3. Definition of Fractal Dimension
In this study, the box-counting method is adopted to calculate the fractal dimension of shear fault surfaces, and the calculation formula is given as follows:
where is the box scale; is the minimum number of boxes required to cover the fault surface at scale ; is the fractal dimension. The closer is to 2, the smoother the fault surface; the closer is to 3, the rougher the fault surface and the more pronounced the undulations.
2.4. Testing Process
The experiments were performed in strict accordance with the “Code for Rock Testing in Hydraulic and Hydroelectric Engineering” (SL65-2001) [27,28]. Before initiating the triaxial tests, the specimen diameter and height were input into the experimental control system to enable automatic calculation of axial stress and strain. After installation, the specimen was placed into the triaxial pressure chamber, sealing bolts were tightened, and hydraulic oil was injected to ensure complete purging of air. Once the chamber was fully pressurized, confining pressure was applied first. Axial loading proceeded at a rate of approximately 5 MPa/min to predetermined levels (10, 20, 30, 40 MPa), followed by continued loading at a constant axial strain rate of 10−6/s (equivalent to 10−4 mm/s) to determine mechanical properties under different confining pressures.
Due to the presence of numerous faults in the target study area, shear-fractured specimens obtained from prior triaxial compression tests were selected as research subjects to investigate the stress-permeability evolution of fault zones. Initially, a high-precision OKIO 3D morphology scanner (Figure 2c) was employed to automatically acquire and reconstruct fault plane geometry based on their geometric features. The reconstructed fault plane data consisted of coordinates and corresponding elevations of the fault surfaces. The data were visualized using a Python 3.9 script. Concurrently, fractal dimension analysis was conducted to quantify fault surface roughness. Subsequently, a permeability tester was used to measure permeability at each confining pressure level (5–40 MPa with 5 MPa increments) under a constant axial load of 3 MPa. This procedure enabled characterization of the stress-dependent behavior of fault permeability.
To replicate sandstone damage induced by gas storage injection and withdrawal under laboratory conditions, triaxial cyclic loading–unloading tests were performed on X48 samples, which are brown siltstone from Sublayer 6 of the Sha IV Formation. Based on conventional triaxial test results (unconfined stress of 98.42 MPa at 10 MPa confining pressure), the confining pressure for this experiment was set at 10 MPa. Axial stress was applied cyclically between 20 and 80 MPa for 55 cycles, followed by continuous loading until specimen failure. Damage was monitored throughout the experiment using an X-ray CT system, with a total of nine scans: one at the initial stage, one after failure, and one scan every 5 or 10 cycles during the process. The specific loading–unloading path and scanning schedule are detailed in Figure 2e and Table 2.
Table 2.
CT scan protocol.
3. Results and Analysis
3.1. Conventional Triaxial Test Stress–Strain Curve
Figure 3 presents the complete stress–strain curves of the X1 series samples under varying confining pressures, fully characterizing the mechanical response of the rock throughout the entire process, from initial deformation to ultimate failure. The test results indicate that the complete stress–strain curve can be divided into four distinct phases: Phase I (OA) represents the primary microfracture consolidation stage, characterized by concave nonlinear deformation; Phase II (AB) denotes the linear elastic stage, in which stress and strain exhibit an approximately linear relationship; Phase III (BC) corresponds to the plastic yielding stage, where the curve gradually deviates from linearity; Phase IV (CD) represents the post-peak stress drop and failure stage, illustrating the progressive loss of the rock’s bearing capacity.
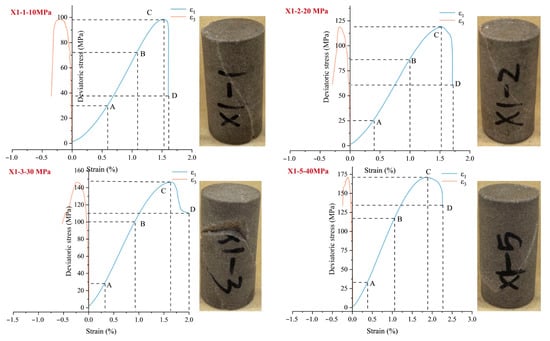
Figure 3.
Complete stress–strain curves under different confining pressure conditions.
As shown in Table 3, as the confining pressure increased from 10 MPa to 40 MPa, the peak deviatoric stress of the sandstone increased from 98.42 MPa to 171.00 MPa, while the elastic modulus rose from 8.70 GPa to 12.65 GPa, indicating a typical confining-pressure-induced strengthening effect. Concurrently, the failure mode of the specimens underwent a distinct transition with increasing confining pressure. At low confining pressures, the specimens showed a single oblique shear plane characterized by clear friction marks. Under high confining pressures, the specimens displayed plastic deformation features without a prominent principal fracture plane, suggesting that the brittle behavior of sandstone was suppressed under high-stress conditions. This finding provides important implications for assessing the long-term stability of gas reservoirs under cyclic injection and production operations.
Table 3.
Triaxial compression test results.
3.2. Stress-Permeability Evolution Characteristics of Rocks Containing Fracture Surfaces
3.2.1. Fractal Dimension
The morphology of rock fault surfaces demonstrates statistical self-similarity, meaning that they exhibit comparable structural complexity across multiple observation scales, which makes them particularly suitable for quantitative characterization using fractal geometry. The fractal dimension acts as a key quantitative indicator for describing the geometric complexity and surface irregularity of fault structures.
The results of the shear plane reconstruction are shown in Figure 4, and the corresponding fractal dimension values are summarized in Table 4. The analysis reveals that the fractal dimension () of all fault planes ranges from 2.1091 to 2.2699, indicating a relatively low degree of overall roughness. This finding suggests that the topographic morphology of the fault planes exhibits relatively gentle and smooth undulations. Minor variations were still observed among the specimens, with sample X1-3 exhibiting the highest average fractal dimension (2.2246), indicating relatively greater roughness on its fault surface. Conversely, sample X1-5 exhibited the lowest average value (2.1626), suggesting a smoother fault plane. Overall, the fractal dimensions of the fracture surfaces were approximately 2, reflecting a geometric morphology more akin to a two-dimensional smooth surface rather than a highly irregular one. This relatively low degree of roughness facilitated the rapid closure of fracture surfaces under high confining pressure, resulting in a significant reduction in permeability.
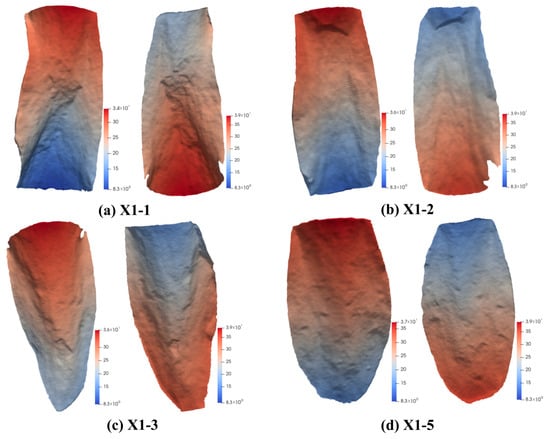
Figure 4.
Shear plane reconstruction results.
Table 4.
Fractal dimension calculation results.
3.2.2. Permeability
Figure 5 illustrates the evolution of permeability in the samples under different confining pressures. The results show that all specimens exhibited pronounced stress sensitivity in permeability, which decreased exponentially as confining pressure increased from 5 MPa to 40 MPa. As the confining pressure increased, the previously opened macroscopic fracture surfaces progressively closed, resulting in tighter contact between the hanging wall and footwall of the faults. This led to a stepwise reduction in permeability. When the confining pressure reached 40 MPa, the fracture closure effect became dominant. The permeability differences among fault surfaces with different roughness values were significantly reduced, ultimately converging to the same order of magnitude. This phenomenon indicated that under high-stress conditions, such as those encountered during the long-term operation of underground gas storage reservoirs, even highly rough fault surfaces exhibited a markedly reduced flow capacity, thereby ensuring excellent sealing performance of the fault zones.
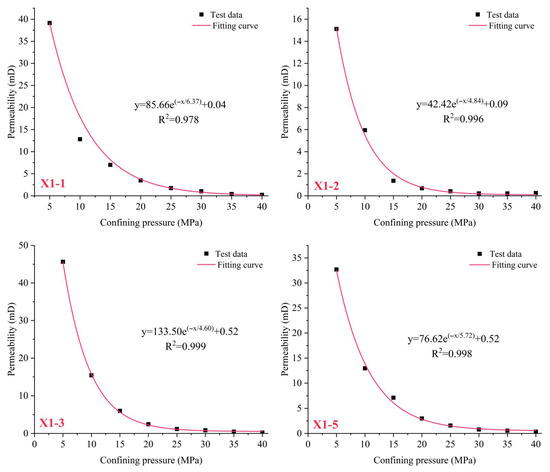
Figure 5.
Evolution of shear surface permeability under different confining pressures.
3.3. Damage Evolution Characteristics of Tight Sandstone Reservoir Under Alternating Loading
Figure 6 shows the stress–strain response of sample X48 under 10 MPa confining pressure and 55 cycles of loading and unloading (20–80 MPa). Compared to conventional triaxial loading paths, the alternating loading inflicted significant fatigue damage on the rock sample, causing its peak strength to decrease from 98.42 MPa to 81.46 MPa, representing a strength degradation rate of 17.23%. This result confirms that cyclic injection and withdrawal operations during reservoir service significantly weaken the mechanical bearing capacity of sandstone formations. Further analysis of the deformation behavior reveals that during cyclic loading and unloading, the cumulative plastic strain exhibits a distinct steady-state evolution trend. Once the final loading cycle proceeds to failure, the cumulative plastic strain increases sharply.
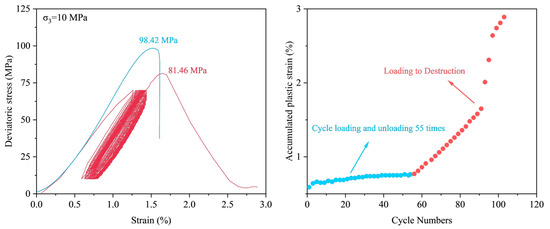
Figure 6.
Stress–strain curve and cumulative plastic strain.
Porosity, as a key indicator of the internal structural state of rock, directly reflects the accumulation and progression of damage within sandstone during cyclic loading and unloading. Analysis of nine CT scans revealed the evolution patterns of porosity and strain in the specimen throughout the cyclic loading process, as shown in Figure 7. The results indicate that under alternating loading, the damage evolution of sandstone exhibits three distinct stages. During the initial cycling stage (approximately the first five cycles), porosity slightly decreases, primarily due to the compression and closure of pre-existing microfractures. As the number of cycles increases (from 5 to 45), porosity remains nearly constant, suggesting that the damage enters a steady-state development phase. When the number of cycles exceeds 45, porosity increases rapidly, marking the onset of an accelerated damage accumulation stage. By the time of final failure, the porosity had increased by 7.72 percentage points compared with the initial state. By integrating the strain evolution data, it was observed that axial strain gradually increased during cycles 5 to 35, showing a steady accumulation of plastic deformation. Between cycles 35 and 45, the strain curve entered a plateau stage, accompanied by a pronounced reduction in the deformation rate. After cycle 45, strain increased sharply, reaching 2.9% at final failure, indicating that the specimen had entered the precursor stage of macroscopic fracture.
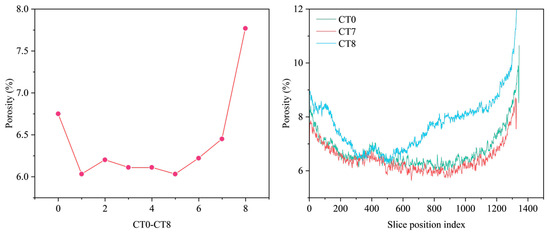
Figure 7.
Evolutionary patterns of pore volume based on CT scanning.
To further elucidate the spatial distribution characteristics of damage, quantitative porosity analysis was conducted on CT grayscale images obtained at the initial state (CT0), after the 55th cycle (CT7), and after ultimate failure (CT8) (Figure 7). The results indicate that after 55 cycles, the overall porosity of the specimen slightly decreased compared with the initial state, suggesting that cyclic loading exerted a limited influence on the sandstone pore structure during the early stage. However, following ultimate failure, the spatial distribution of porosity changed significantly. The primary increases were concentrated within the first 250 and last 700 slices of the specimen, clearly demonstrating that macroscopic fracturing predominantly occurred at both ends of the specimen.
Analysis of the CT image series acquired during cyclic loading and unloading (Figure 8) clearly illustrates the entire evolution process of internal damage within the sandstone specimen. The internal damage progressively nucleates, propagates, and eventually coalesces as the number of cycles increases. At the early stage of the experiment, the CT images displayed only sparsely distributed primary micropores, while the overall structure of the specimen remained largely intact. As the number of cycles increased, localized microcrack nucleation became apparent, and the cracks progressively oriented along the direction of maximum principal stress. By cycles 45–55, these microcracks further propagated and coalesced, forming regionally interconnected zones. Ultimately, during the failure stage, these interconnected zones merged into a dominant macroscopic shear fracture, exhibiting a typical oblique shear pattern accompanied by secondary branch cracks.
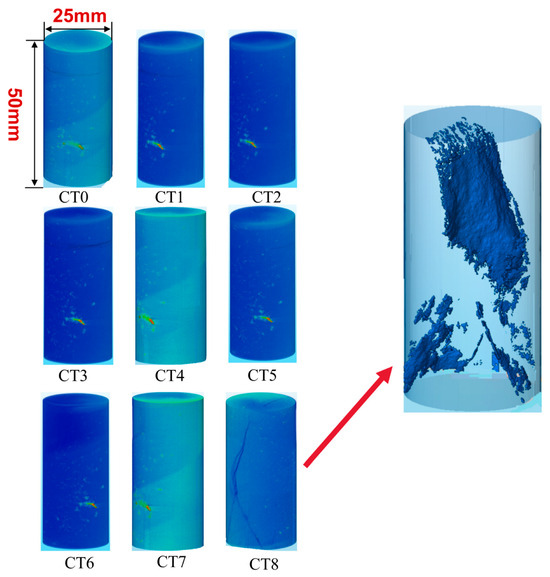
Figure 8.
Three-dimensional reconstruction results of the sample based on CT scanning.
The CT image sequence, together with the previously obtained porosity and strain evolution curves, collectively illustrates the three-stage damage evolution behavior of sandstone subjected to cyclic loading: an initial compaction and microcrack initiation stage, a stable expansion stage, and an accelerated penetration and macroscopic fracture stage. This direct observation of damage evolution from the microscopic to macroscopic scales provides critical visual evidence for elucidating the long-term mechanical response of sandstone reservoirs under alternating stress fields.
4. Discussion
This study established a comprehensive methodology linking macroscopic mechanical response, microscopic damage evolution, and permeability regulation by innovatively integrating real-time CT dynamic scanning, triaxial cyclic loading, and fractal dimension analysis. The results demonstrate that the integrity and fluid transport capacity of sandstone reservoirs are jointly governed by confining pressure, cumulative fatigue damage, and fault structural attributes, exhibiting pronounced nonlinear and staged evolutionary characteristics.
4.1. Confining Pressure Effect and Brittle–Plastic Transition Mechanism
Results from triaxial compression tests indicate that sandstone exhibits a progressive brittle–plastic transition as confining pressure increases, reflecting the confining pressure–induced suppression of brittle failure mechanisms. Previous studies indicate that this transformation primarily originates from changes in crack propagation mechanisms. Under low confining pressure, cracks predominantly propagate through tensile-shear mechanisms, readily forming a single dominant shear plane. Conversely, under high confining pressure, crack propagation is constrained by triaxial compressive stress and occurs primarily through pore closure and intergranular sliding, thereby enhancing plastic energy dissipation [29,30]. The findings of this study further demonstrate that the simultaneous increase in peak strength and elastic modulus with increasing confining pressure reflects the combined influence of the compaction effect and the friction effect. This indicates that, under high-stress conditions in deeply buried gas reservoirs, the reservoir’s load-bearing capacity is enhanced, while the risk of sudden brittle failure is markedly suppressed.
4.2. Relationship Between Fault Roughness and Permeability Response
Fractal dimension analysis indicates that the overall roughness of fault surfaces remains relatively low. Under low confining pressure, significant differences in permeability are observed among faults with different roughness levels, whereas under high confining pressure, these differences gradually converge. This phenomenon indicates that, under low stress conditions, the geometric characteristics of the fracture plane constitute the primary factor controlling seepage capacity. However, when confining pressure exceeds a certain threshold, the fracture closure effect dominates the evolution of permeability, reducing the influence of geometric roughness. Contrary to the conclusions of previous studies [31,32] suggesting that “higher roughness leads to higher permeability,” this study emphasizes that this effect is strongly stress-dependent: in shallow reservoirs or under low-confining-pressure conditions, fracture roughness indeed enhances fluid connectivity. However, in deeply buried, high-stress environments, the overriding influence of confining pressure suppresses this effect. This finding provides a new perspective for evaluating the long-term sealing integrity of underground gas storage reservoirs.
4.3. Fatigue Damage Evolution Mechanism Under Alternating Loads
Compared with static loading, the strength of sandstone decreased by approximately 17.23% under cyclic loading and unloading, exhibiting a three-stage damage evolution pattern. This result can be interpreted from the perspective of energy evolution: during the initial stage, the external energy is mainly consumed in the closure of primary microcracks. As the process enters the stable propagation phase, the stress input and energy dissipation approach a quasi-equilibrium state, resulting in a relatively low rate of damage evolution. However, as the fracture approaches the failure stage, cracks rapidly propagate and coalesce, inducing a localized burst of energy release that is manifested as a sharp decline in the stress–strain curve. This “steady-state, critical, and unstable” progression corresponds well with the theoretical framework of fatigue damage [33,34,35]. Compared with the findings from previous injection–production cycle experiments [36,37], the CT scan results obtained in this study visually demonstrate the progressive evolution of crack propagation—from a diffuse distribution to the formation of dominant coalesced fractures—at the microscopic scale. These observations offer critical supplementary insights into the interpretation of the fatigue degradation mechanisms governing the long-term operation of gas reservoirs.
5. Limitations and Outlook
This study nevertheless has several limitations. First, the alternating load path adopted in this experiment involved simplified constant-amplitude loading, whereas the pressure fluctuations encountered during actual reservoir operations exhibit far more complex amplitude and frequency variations. Future research should employ variable-amplitude loading schemes that more accurately simulate in situ reservoir pressure fluctuations. Second, although CT scanning facilitated the localization of internal damage, its quantitative accuracy in measuring microcrack aperture remains limited. Future studies could integrate Digital Image Correlation (DIC) or other complementary techniques to establish a more precise correlation between surface strain fields and internal crack evolution.
6. Conclusions
This study employed a suite of advanced experimental techniques to systematically investigate the mechanical damage evolution and permeability response characteristics of tight sandstone in gas storage reservoirs under triaxial compression and cyclic loading conditions. The main conclusions are summarized as follows:
1. The peak strength and elastic modulus of sandstone both increase with confining pressure, accompanied by a transition in failure mode from brittle oblique shear at low confining pressures to plastic deformation at higher confining pressures. This demonstrates that high confining pressure (>25 MPa) can suppress brittle failure of tight sandstone and enhance reservoir stability.
2. Under low confining pressure, fault surfaces with higher roughness exhibit greater permeability, whereas under high confining pressure, the dominant crack closure effect causes permeability differences among faults to converge. This demonstrates that faults maintain excellent sealing capacity under reservoir operating stress conditions.
3. Alternating loading resulted in a 17.23% reduction in sandstone strength, with the damage evolution process exhibiting three distinct stages: microfracture compaction, stable expansion, and rapid breakthrough. The evolution of pore volume showed a strong correlation with strain variation, elucidating the fatigue-induced weakening mechanism of reservoirs during injection–production cycles. Cyclic injection–production operations should control stress amplitude to avoid exceeding 60 MPa to reduce fatigue damage.
4. The research findings provide valuable scientific guidance for the design and operation of tight sandstone gas storage reservoirs, highlighting the critical influence of stress conditions, fatigue damage, and fault characteristics on the long-term mechanical stability and sealing integrity of reservoirs.
Author Contributions
Writing—original draft, Software, and Methodology, M.X.; Writing—review and editing, Funding acquisition and Project administration Y.G.; Project administration, Resources, Validation, H.M. (Haijun Mao); Data acquisition and Analysis, Y.L.; Data acquisition and Analysis, X.S.; Supervision and Checking, H.M. (Hongling Ma); Investigation, Y.H.; Writing—original draft, Software, and Methodology, J.F. All authors have read and agreed to the published version of the manuscript.
Funding
National Key R&D Program of China (No. 2024YFB4007100), National Natural Science Foundation of China (No. 52304070) and National Key Technology Research and Development Program (No. 2025ZD1406800).
Data Availability Statement
The original contributions presented in this study are included in the article. Further inquiries can be directed to the corresponding author.
Conflicts of Interest
The authors declare no conflicts of interest.
References
- Al-Shafi, M.; Massarweh, O.; Abushaikha, A.S.; Bicer, Y. A Review on Underground Gas Storage Systems: Natural Gas, Hydrogen and Carbon Sequestration. Energy Rep. 2023, 9, 6251–6266. [Google Scholar] [CrossRef]
- Liu, J.; Pei, J.; Wei, J.; Yang, J.; Xu, H. Development Status and Prospect of Salt Cavern Energy Storage Technology. Earth Energy Sci. 2025, 1, 159–179. [Google Scholar] [CrossRef]
- Zhang, J.; Tan, Y.; Zhang, T.; Yu, K.; Wang, X.; Zhao, Q. Natural Gas Market and Underground Gas Storage Development in China. J. Energy Storage 2020, 29, 101338. [Google Scholar] [CrossRef]
- Zhuge, X.; Hong, J.; Wang, C.; Wang, J.; Xia, H. Dynamic Evaluation of Sealing and Site Optimization for Underground Gas Storage in Depleted Gas Reserve: A Case Study. Appl. Sci. 2023, 14, 298. [Google Scholar] [CrossRef]
- Xu, X.; Zeng, L.; Dong, S.; Li, H.; Liu, J.; Ji, C. The Characteristics and Controlling Factors of High-Quality Reservoirs of Ultra-Deep Tight Sandstone: A Case Study of the Dabei Gas Field, Tarim Basin, China. Pet. Sci. 2025, 22, 3473–3496. [Google Scholar] [CrossRef]
- Deng, G.; Zhou, J.; Tian, S.; Xian, X.; Zhou, L.; Zhang, C.; Li, S.; Tan, Y. Pore Structure Changes and Its Stress-Sensitive Behavior in Sandstone under Cyclic Stress: Implication for Underground Gas Storage. Gas Sci. Eng. 2023, 119, 205130. [Google Scholar] [CrossRef]
- Yang, C.; Wang, T.; Chen, H. Theoretical and Technological Challenges of Deep Underground Energy Storage in China. Engineering 2023, 25, 168–181. [Google Scholar] [CrossRef]
- Xie, H.; Lu, J.; Li, C.; Li, M.; Gao, M. Experimental Study on the Mechanical and Failure Behaviors of Deep Rock Subjected to True Triaxial Stress: A Review. Int. J. Min. Sci. Technol. 2022, 32, 915–950. [Google Scholar] [CrossRef]
- Zong, Y.; Han, L.; Wei, J.; Wen, S. Mechanical and Damage Evolution Properties of Sandstone under Triaxial Compression. Int. J. Min. Sci. Technol. 2016, 26, 601–607. [Google Scholar] [CrossRef]
- Sun, L.; Lou, P.; Pan, C.; Ji, P. Mechanical Properties and DEM-Based Simulation of Double-Fractured Sandstone under Cyclic Loading and Unloading. Sustainability 2024, 16, 9000. [Google Scholar] [CrossRef]
- Liu, Y.; Zhao, F.; Wu, Q.; Fan, B.; Tang, Z. Experimental Research on Energy Evolution of Sandstone with Different Moisture Content under Uniaxial Compression. Sustainability 2024, 16, 4636. [Google Scholar] [CrossRef]
- Ran, Q.; Chen, P.; Liang, Y.; Ye, C.; Zhang, B.; Wu, Z.; Ma, T.; Chen, Z. Hardening-Damage Evolutionary Mechanism of Sandstone under Multi-Level Cyclic Loading. Eng. Fract. Mech. 2024, 307, 110291. [Google Scholar] [CrossRef]
- Zhang, B.; Liang, Y.; Zhao, Z.; Zou, Q.; Zheng, H.; Ning, Y.; Kong, F.; Ran, Q. Effect of Stress Amplitude on Mechanical and Acoustic Emission of Sandstone under Constant–Cyclic Loading. Bull. Eng. Geol. Environ. 2023, 82, 284. [Google Scholar] [CrossRef]
- Yang, S.; Li, K.; Yin, P. Experimental Study on Fatigue Properties and Fracture Characteristics of Sandstone under Different Cycle Times and Frequencies Conditions. Int. J. Fatigue 2026, 203, 109293. [Google Scholar] [CrossRef]
- Yang, S.-Q.; Huang, Y.-H.; Tang, J.-Z. Mechanical, Acoustic, and Fracture Behaviors of Yellow Sandstone Specimens under Triaxial Monotonic and Cyclic Loading. Int. J. Rock Mech. Min. Sci. 2020, 130, 104268. [Google Scholar] [CrossRef]
- Walsh, J.B. Effect of Pore Pressure and Confining Pressure on Fracture Permeability. Int. J. Rock Mech. Min. Sci. Geomech. Abstr. 1981, 18, 429–435. [Google Scholar] [CrossRef]
- Lin, G.; Chapman, S.; Garagash, D.; Fortin, J.; Schubnel, A. Pressure Dependence of Permeability in Cracked Rocks: Experimental Evidence of Non-Linear Pore-Pressure Gradients from Local Measurements. Geophys. Res. Lett. 2024, 51, e2024GL109308. [Google Scholar] [CrossRef]
- Candela, T.; Renard, F.; Bouchon, M.; Brouste, A.; Marsan, D.; Schmittbuhl, J.; Voisin, C. Characterization of Fault Roughness at Various Scales: Implications of Three-Dimensional High Resolution Topography Measurements. Pure Appl. Geophys. 2009, 166, 1817–1851. [Google Scholar] [CrossRef]
- Nigon, B.; Englert, A.; Pascal, C.; Saintot, A. Multiscale Characterization of Joint Surface Roughness. J. Geophys. Res. Solid Earth 2017, 122, 9714–9728. [Google Scholar] [CrossRef]
- Shirani Faradonbeh, R.; Taheri, A.; Karakus, M. Fatigue Failure Characteristics of Sandstone under Different Confining Pressures. Rock Mech. Rock Eng. 2022, 55, 1227–1252. [Google Scholar] [CrossRef]
- Kong, B.; Wang, E.; Li, Z.; Wang, X.; Chen, L.; Kong, X. Nonlinear Characteristics of Acoustic Emissions during the Deformation and Fracture of Sandstone Subjected to Thermal Treatment. Int. J. Rock Mech. Min. Sci. 2016, 90, 43–52. [Google Scholar] [CrossRef]
- Yu, B.; Peng, M.; Tai, Y.; Guo, S. Assessment and Control of the Mine Tremor Disaster Induced by the Energy Accumulation and Dispersion of Thick-Hard Roofs. Int. J. Min. Sci. Technol. 2024, 34, 925–941. [Google Scholar] [CrossRef]
- Ni, H.; Liu, J.; Huang, B.; Pu, H.; Meng, Q.; Wang, Y.; Sha, Z. Quantitative Analysis of Pore Structure and Permeability Characteristics of Sandstone Using SEM and CT Images. J. Nat. Gas Sci. Eng. 2021, 88, 103861. [Google Scholar] [CrossRef]
- Liang, J.; Lebedev, M.; Gurevich, B.; Arns, C.H.; Vialle, S.; Glubokovskikh, S. High-Precision Tracking of Sandstone Deformation from Micro-CT Images. J. Geophys. Res. Solid Earth 2021, 126, e2021JB022283. [Google Scholar] [CrossRef]
- Yang, S. Fracturing Mechanism of Compressed Hollow-Cylinder Sandstone Evaluated by X-Ray Micro-CT Scanning. Rock Mech. Rock Eng. 2018, 51, 2033–2053. [Google Scholar] [CrossRef]
- Feng, X.; Chen, S.; Zhou, H. Real-Time Computerized Tomography (CT) Experiments on Sandstone Damage Evolution during Triaxial Compression with Chemical Corrosion. Int. J. Rock Mech. Min. Sci. 2004, 41, 181–192. [Google Scholar] [CrossRef]
- Fan, L.; Qiu, B.; Gao, J.W.; Du, X.L. A Real-Time Visual Investigation on Microscopic Progressive Fatigue Deterioration of Granite under Cyclic Loading. Rock Mech. Rock Eng. 2023, 56, 5133–5147. [Google Scholar] [CrossRef]
- Xia, D.; Liu, H.; Liu, J.; Guo, Y.; Liu, M.; Qiu, X.; Li, H.; Tan, H.; Lu, J. Study on the Evolution of Mechanical Properties and Acoustic Emission of Medium-Permeability Sandstone under Multi-Level Cyclic Loading Stress Paths. Processes 2024, 12, 1773. [Google Scholar] [CrossRef]
- Chang, X.; Zhang, X.; Dang, F.; Zhang, B.; Chang, F. Failure Behavior of Sandstone Specimens Containing a Single Flaw under True Triaxial Compression. Rock Mech. Rock Eng. 2022, 55, 2111–2127. [Google Scholar] [CrossRef]
- Huang, Y.; Wu, S.; Yang, C. Experimental Study on the Failure Behaviors of Sandstone Specimens with Two Fissures under Triaxial Loading and Unloading Conditions. Eng. Fract. Mech. 2024, 298, 109933. [Google Scholar] [CrossRef]
- Sawayama, K.; Ishibashi, T.; Jiang, F.; Tsuji, T.; Nishizawa, O.; Fujimitsu, Y. Scale-Independent Relationship between Permeability and Resistivity in Mated Fractures with Natural Rough Surfaces. Geothermics 2021, 94, 102065. [Google Scholar] [CrossRef]
- Sawayama, K.; Ishibashi, T.; Jiang, F.; Tsuji, T. Relationship between Permeability and Resistivity of Sheared Rock Fractures: The Role of Tortuosity and Flow Path Percolation. Geophys. Res. Lett. 2023, 50, e2023GL104418. [Google Scholar] [CrossRef]
- Yang, S.; Yang, J.; Xu, P. Analysis on Pre-Peak Deformation and Energy Dissipation Characteristics of Sandstone under Triaxial Cyclic Loading. Geomech. Geophys. Geo-Energy Geo-Resour. 2020, 6, 24. [Google Scholar] [CrossRef]
- Li, T.; Pei, X.; Guo, J.; Meng, M.; Huang, R. An Energy-Based Fatigue Damage Model for Sandstone Subjected to Cyclic Loading. Rock Mech. Rock Eng. 2020, 53, 5069–5079. [Google Scholar] [CrossRef]
- Fourmeau, M.; Liu, W.; Li, Z.; Nelias, D.; Fan, J.; Tian, H.; Liu, W. Research Status of Creep–Fatigue Characteristics of Salt Rocks and Stability of Compressed Air Storage in Salt Caverns. Earth Energy Sci. 2025, 1, 98–116. [Google Scholar] [CrossRef]
- Zhang, H.; Wang, L.; Li, J.; Deng, H.; Xu, X. Study on the Mechanical Properties of Unloading Damaged Sandstone under Cyclic Loading and Unloading. Sci. Rep. 2023, 13, 7370. [Google Scholar] [CrossRef]
- Wang, H.; Fall, M.; Miao, S. Characteristics of Fracture Changes and Fatigue Failure Signals for Siltstone under Cyclic Loading. Int. J. Rock Mech. Min. Sci. 2024, 174, 105645. [Google Scholar] [CrossRef]
Disclaimer/Publisher’s Note: The statements, opinions and data contained in all publications are solely those of the individual author(s) and contributor(s) and not of MDPI and/or the editor(s). MDPI and/or the editor(s) disclaim responsibility for any injury to people or property resulting from any ideas, methods, instructions or products referred to in the content. |
© 2025 by the authors. Licensee MDPI, Basel, Switzerland. This article is an open access article distributed under the terms and conditions of the Creative Commons Attribution (CC BY) license (https://creativecommons.org/licenses/by/4.0/).