Abstract
This study investigates the dynamic mechanical characteristics of strength-gradient composite rock masses under one-dimensional explosive plane waves by integrating digital image correlation (DIC) and Lagrangian inverse analysis. Using a one-dimensional explosive plane wave generator, high-spatiotemporal resolution displacement and strain data were acquired from specimen surfaces via an ultra-high-speed camera and DIC. The study compared the decay patterns of blast stress waves and deformation features of rock under two loading paths (forward and backward gradients) for three explosive charges, and employed Lagrangian inverse analysis to determine the strength-gradient distribution within the composite rock mass. The Lagrange inverse analysis method was employed to derive the constitutive relationship of the strength-gradient composite rock mass. The results indicate that in forward gradient rock masses, stress waves undergo stress jumps at joint surfaces, leading to increased wave amplitudes. In backward gradient rock masses, stress wave attenuation is more pronounced. In forward gradient coarse sandstone, stress attenuation rates are significantly higher than in the other two sandstone types. In backward gradient gray sandstone, attenuation rates are markedly greater than in the other two sandstones. However, under identical charge conditions, coarse sandstone exhibits a higher attenuation coefficient than gray sandstone. This indicates that stress waves decay more rapidly in the immediate vicinity of the explosion and that weaker media exhibit faster decay rates. The findings reveal the propagation patterns of explosive stress waves in layered gradient materials, providing a theoretical basis for engineering blasting in layered rock formations.
1. Introduction
Under conditions such as earthquakes, explosions, and high-speed impacts, high-strain-rate stress waves cause deformation and failure in materials and structures [,,]. In geotechnical engineering, naturally occurring layered joint structures alter the propagation path of explosive stress waves, influencing blasting outcomes [,]. When explosive stress waves propagate to free boundaries or joint surfaces, differences in joint characteristics and medium wave impedance cause variations in stress wave transmission and reflection, ultimately leading to distinct failure fracture patterns. Due to the unique formation mechanisms of sedimentary rocks, they exhibit layered distributions in morphology and often display gradient characteristics in strength. Therefore, layered rock masses with gradient strength variations are defined as gradient composite rock masses. Investigating the propagation characteristics of explosive stress waves in gradient composite rock bodies can further reveal their failure mechanisms and energy evolution patterns, holding significant implications for precision blasting in underground mines.
Numerous investigations have been devoted to elucidating the propagation behavior of explosive stress waves in layered rock masses. Ding et al. [] combined physical modeling and numerical simulations to examine the directional fracturing mechanism of shaped charge blasting in stratified rock. It was demonstrated that gas pressure release during detonation predominantly governs blasting efficiency, while damage in single-layer rock attenuates progressively along the propagation path. Based on practical engineering geology, Liu et al. [] established a planar analytical model for bench blasting in layered rock, incorporating micro-fracture structures. Through CDEM simulations, stress distribution under varying exposure thicknesses and bedding conditions was systematically analyzed. The results indicated that in vertically inclined bench rock, fragmentation intensity increases horizontally, and overall breakage efficiency can be optimized via blast hole spacing adjustment. Xie et al. [] performed numerical analyses using the RHT model in LS-DYNA to evaluate damage evolution in both intact and layered jointed rock masses under blasting loads. The study highlighted the influence of initiation location and fracture distribution on dynamic damage patterns, revealing that the observed structural configuration aggravates damage on the upstream rock surface while partially shielding stress wave propagation across layered joints, thereby enhancing damage distribution asymmetry. Wei et al. [] experimentally studied the propagation characteristics of peak particle velocity (PPV) and dominant frequency (DF) in layered rock under high-pressure gas impact. The results showed that both PPV and DF attenuate with increasing distance from the blast source. Under identical impact conditions, layered rock exhibited lower PPV and DF values compared to homogeneous rock at equivalent measurement points. Yu et al. [] explored the asymmetric influence of layered rock masses on surrounding rock and supporting structures during blasting excavation. The findings underscored pronounced attenuation of blast stress waves across joint planes, with asymmetric strain responses in rock bolts attributable to wave reflection and energy dissipation at interfaces. Zhu et al. [] acquired in situ blasting vibration data via two multi-hole presplitting blasting schemes and proposed a novel predictive model for vibration velocity in layered rock, based on boundary conditions and equivalent loading. The method demonstrated high accuracy in forecasting key blasting vibration parameters. Zhang et al. [] derived an analytical solution for vibration velocity under P-wave excitation in layered rock, revealing that vibration velocity in overlying strata does not decay monotonically with distance but exhibits an oscillatory attenuation pattern. With increasing incident wave frequency, the normalized surface vibration velocity displays a periodic decline, and the initial fluctuation point shifts closer to the surface. Lu et al. [] theoretically analyzed the propagation and damage depth distribution of blasting stress waves in layered rock masses. Dynamic modeling confirmed that a tensile-compressive-shear coupling model combined with an equivalent boundary approach accurately reproduces the three-dimensional distribution of blasting-induced damage zones. Field validation indicated that maximum and minimum damage depths are concentrated in the tunnel roof and floor, respectively. Hu et al. [] quantitatively evaluated the effectiveness of grouting in damage mitigation within layered jointed basalt, identifying reflected tensile stress propagating to pre-existing joints as the principal mechanism of damage initiation. Numerical simulations further illustrated that both the depth and severity of blasting-induced damage in layered jointed basalt exceed those in intact basalt, while grouting substantially reduces the damage extent.
In summary, existing research has predominantly focused on layered rock masses with homogeneous properties or artificially modified interfaces. However, studies on rock masses exhibiting intrinsic strength variations remain limited, and the dynamic response of gradient composite rock masses has yet to be systematically investigated.
Studying the propagation patterns of explosive stress waves requires numerous sensors, such as strain gauges [,], velocity sensors [], and pressure sensors []. However, none of these methods can monitor the full-field stress and strain conditions within the medium. With the advancement of high-speed cameras and the widespread application of digital image correlation (DIC), research on stress waves has reached new heights. Li et al. [] conducted indoor cylindrical charge blasting tests using sandstone as the medium. By employing digital image correlation (DIC) technology, he successfully captured the full-field strain evolution around the borehole during the blasting process, obtaining strain–time curves for the surrounding rock mass. The descending phase of the strain–time curve reflects the rapid energy input into the rock mass near the borehole caused by the blast load, while the ascending phase demonstrates the radial release of elastic energy. He et al. [] investigated the dynamic response of rock masses subjected to static and dynamic stress coupling under live load confining pressure and blasting effects. Leveraging the texture advantages of natural granite, high-speed DIC combined with strain measurement techniques observed crack propagation and tested dynamic strains under varying biaxial confining pressures. Findings revealed that shear deformation and tensile stresses induced by blasting formed cracks in the compression zone around boreholes, while circumferential tensile stresses were the primary cause of cracks in the fracture zone. Yu et al. [] proposed a novel method for evaluating the constitutive behavior of ordinary concrete under high strain rates by integrating Lagrangian inverse analysis with optical techniques. During concrete spalling tests, optical technology captured high-frequency spatiotemporal displacement data, successfully yielding concrete stress–strain curves.
The above literature reveals that existing research primarily focuses on layered rock masses composed of a single medium, with limited studies on rock masses exhibiting strength-gradients. However, in most cases, the strength of layered rock masses follows a gradual variation pattern. Under such conditions, their response to external loads (explosion stress waves) applied in different directions also varies. The propagation path of explosive stress waves induces varying degrees of deformation and failure within layered rock masses, necessitating in-depth investigation into their dynamic response.
This study employs artificially composite rock specimens in place of natural rock for experimentation. Three rock types—coarse sandstone (C), red sandstone (R), and gray sandstone (G)—were sequentially assembled into a monolithic specimen with progressively graded strength. An explosive load was applied to the specimen’s end face. This study employs high-speed cameras to investigate the propagation characteristics of explosive stress waves from weak to strong (C-R-G) or from strong to weak (G-R-C). The stress–strain evolution of explosive stress waves in gradient composite rock masses was studied via Lagrangian inverse analysis, analyzing variations in attenuation coefficients and the disturbance effects of interfaces on stress waves. These findings provide significant guidance for blasting operations in gradient composite rock masses.
2. Experimental System and Methods
2.1. Experimental System
Conventional blasting experiments employ spherical and cylindrical charges, yet the complex waveforms of blast stress waves within rock masses pose significant challenges for effective monitoring and calculation. Therefore, utilizing a plane wave generator to create one-dimensional blast stress waves within specimens can substantially enhance experimental precision and data accuracy, facilitating research into the propagation patterns of blast stress waves in gradient rock masses. The explosive type is lead azide, laid flat at the top end of the specimen. The probe is positioned at the center of the explosive, and detonation is initiated by releasing a high-voltage current at the probe tip using a detonator. The experimental setup is shown in Figure 1. The plane wave generator is positioned at one end of the specimen and triggered by an initiator. An ultra-high-speed imaging system captures the displacement and strain fields on the specimen surface during the explosion. A synchronous controller regulates the timing of both the explosive detonation and camera exposure.
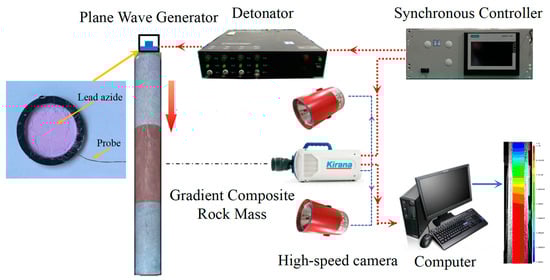
Figure 1.
One-dimensional plane wave loading device.
The gradient composite rock mass used is shown in Figure 2. The mechanical properties of the materials are shown in Table 1. The uniaxial compressive strength of the three rock types increases gradually in a specific ratio; such a rock mass is termed a gradient composite rock mass. Individual rock specimens measured 50 mm in diameter and 131 mm in height, while the gradient composite rock specimen measured 50 mm in diameter and 400 mm in height. Arrange 30 measurement points along the central axis of the specimen, with 10 measurement points spaced at equal intervals (12 mm) for each type of sandstone. Stress waves propagating from lower to higher strength represented the forward transmission path, while the backward gradient path was defined as the opposite direction. During testing, high strain rate loading was achieved using 1.5 g, 2.75 g, and 4 g of explosives at the end points.
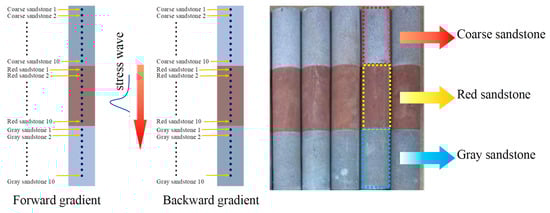
Figure 2.
Gradient rock mass samples.

Table 1.
Mechanical Properties of Materials.
2.2. Experimental Method
To explore a more rational and complete constitutive relationship for rock under explosive loading, the Lagrangian inverse analysis method was adopted. This approach integrates the equations of motion and geometry to infer the material’s stress–strain relationship from displacement and velocity fields within the medium. It eliminates the need for constitutive assumptions and yields constitutive relationships dependent on strain rate, making it a common tool for measuring dynamic material properties at high strain rates.
Both planar wave loading with explosives and Hopkinson impact loading can be regarded as uniaxial compression experiments. In this form, the one-dimensional version of the conservation equations can be employed. In the Lagrangian coordinate system, these equations can be expressed in the following differential form:
x represents the Eulerian position (x changes as the particle moves), while X denotes the Lagrangian position (X retains its initial value and moves with the particle). These two parameters can be converted using the following equation:
t represents time, ρ and ρ0 denote the current and initial densities, respectively, v represents the particle velocity, σ is the stress in the propagation direction, and E represents the internal energy density.
The equations of motion, or conservation equations, are universally applicable to all material mechanics equations satisfying the continuum hypothesis. However, these equations cannot fully describe the material constitutive behavior during wave propagation and require supplementation by an additional equation—the continuity equation. Together with the equations of motion representing momentum conservation, the continuity equation forms the fundamental equations of the Lagrangian inverse analysis method.
The continuity equation expresses the relationship between particle velocity and strain, while the equation of motion expresses the relationship between particle velocity and stress. To obtain the corresponding stress–strain relationship, integration of the fundamental equations is required. Given the particle velocity along with appropriate boundary conditions and initial conditions, the relevant stress–strain data can be determined. DIC measurement techniques readily capture the velocity field on the specimen surface. When velocity field data is available, a time integral of the continuity equation from t0 to t0 + ∆t can be performed.
Integrate the equation of motion with respect to X.
represents the strain history at position X at time t0, and represents the stress history at position X0. When the measured parameter is the velocity field, the initial conditions of the specimen’s strain field and the stress history at the boundaries must be obtained. Through DIC measurement techniques, a sufficient number of velocity (displacement) time-history curves can be acquired, enabling integration with spatial coordinate X to achieve sufficiently high accuracy. This allows the stress–strain history to be directly calculated using the continuity equation and the equation of motion.
Under strong dynamic loading, the weight of gradient rock is neglected, resulting in initial stress and strain fields of zero in the experiment. These zero initial and boundary conditions simplify the integration of the one-dimensional wave loading Lagrangian inverse analysis problem. When the boundary stress history σ (X0, t) is known, the velocity must first be differentiated to obtain the first derivative, followed by sequential spatial integration. Specifically, if the Digital Imaging Correlation (DIC) method is used to obtain the displacement field first (Figure 3a), the second derivative of displacement must be calculated.
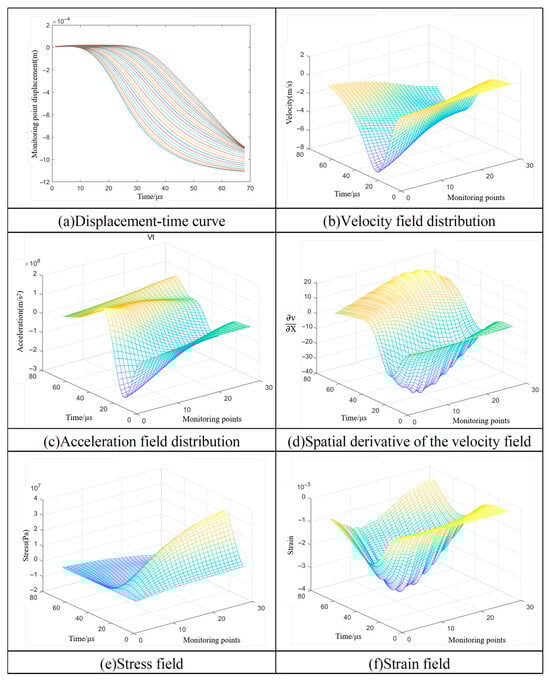
Figure 3.
Lagrange inverse analysis computation process.
This paper employs Gaussian smoothing to correct the displacement field. The corrected displacement field data is input into a MATLAB (r2023a) program. By taking the first derivative of the smoothed displacement field, the velocity field is obtained (Figure 3b). Taking the partial derivative of the velocity field with respect to time yields the acceleration field distribution (Figure 3c). Multiplying this partial derivative result by the density and integrating along the displacement direction produces the stress field (Figure 3e). Taking the partial derivative of the velocity field with respect to spatial coordinates (Figure 3d) and integrating this partial derivative result with respect to time yields the strain field (Figure 3f).
3. Results
3.1. Gradient Rock Mass Deformation Fields
First, using a 4 g explosive charge as an example, we analyze the deformation field of a gradient composite rock mass under explosive loading. The deformation patterns of specimens under other charge quantities are fundamentally similar and will not be repeated here. Figure 4 shows the axial displacement contour map in the positive gradient rock mass. Axial displacements across the same cross-section are largely consistent, verifying that the explosive charge generates a one-dimensional explosive plane wave within the specimen. Blue indicates regions with larger displacement, while red denotes regions with smaller displacement. It is evident that the displacement field in the positively graded material changes sequentially from top to bottom. Blue regions are primarily concentrated in the upper section, and the displacement caused by the explosion diminishes as one approaches the free end. This occurs because when the explosive stress wave propagates forward, it first encounters the lower-strength coarse sandstone. This material exhibits poor deformation resistance. Simultaneously, the intense initial explosive force causes significant deformation at the upper end of the coarse sandstone. This deformation absorbs a portion of the explosive energy, thereby attenuating the transmitted energy. By the time the explosion stress wave reaches the lower gray sandstone, the stress peak has further diminished. Moreover, the higher strength of the gray sandstone provides greater resistance to deformation. The combined effect of these two factors results in a smaller displacement change at the free end.
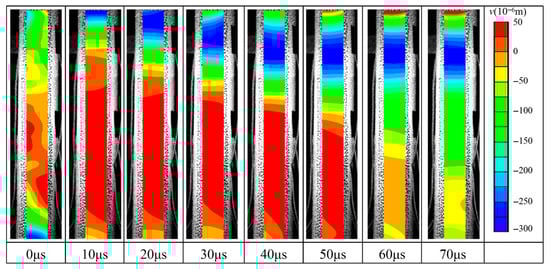
Figure 4.
Axial displacement nephogram of the forward gradient rock mass (4 g).
Figure 5 shows the displacement curves for selected points in the forward gradient rock mass at a charge quantity of 4 g. It can be observed that displacement changes sequentially according to the order of coarse sandstone, red sandstone, and gray sandstone. Furthermore, displacement variations differ among points in various rock types, with adjacent points in coarse sandstone exhibiting greater displacement differences than in the other two rock types. This occurs because coarse sandstone directly contacts the explosive, experiencing stronger blast loads. Its lower strength also results in a heightened response to these loads. Subsequently, deformation in coarse sandstone undergoes an initial rebound, causing displacement changes at monitoring points within this rock type to slow down.
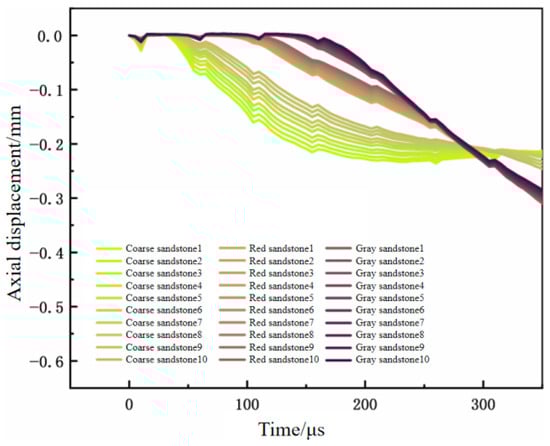
Figure 5.
Displacement time-history curve of the forward gradient rock mass.
Figure 6 shows the axial displacement contour map of the backward gradient rock mass with a charge weight of 4 g. Observation of the displacement map reveals that, similar to the forward gradient rock mass, the displacement field in the backward gradient rock mass also changes sequentially from top to bottom. However, the magnitude and extent of displacement variation differ. The explosive stress wave first encounters the higher-strength sandstone, which exhibits greater resistance to deformation. This results in increased overall vertical displacement of the sandstone, with the blue displacement zone in the upper specimen section being larger than that in the forward gradient rock body. As the explosive energy attenuates, the deformation generated at the rear end of the specimen is minimal.
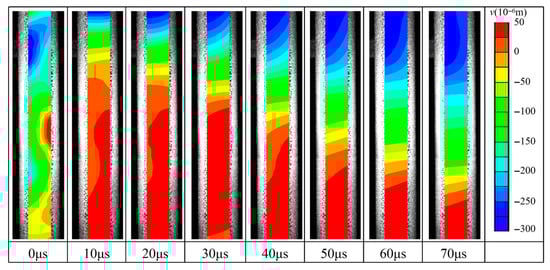
Figure 6.
Axial displacement nephogram of the backward gradient rock mass (4 g).
Figure 7 shows the displacement curves for selected points in the backward gradient rock mass at a charge weight of 4 g. These curves share common features with those from the forward gradient rock mass, specifically that displacement at the measured points occurs sequentially from top to bottom. Additionally, displacement variations at the points in coarse sandstone are more pronounced than in the other two rock types.
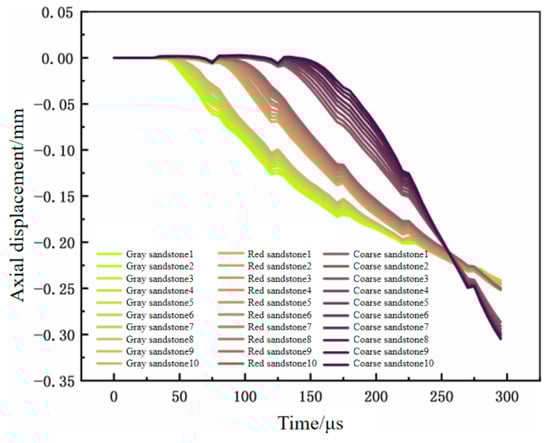
Figure 7.
Displacement time-history curve of the backward gradient rock mass (4 g).
3.2. Gradient Rock Mass Strain Field
Figure 8 shows the vertical strain contour map of the forward gradient material with a charge of 4 g. In the strain contour map, blue-purple indicates compressive stress, while red-orange represents tensile stress. Observation reveals that blue regions predominantly concentrate within coarse sandstone, mirroring the distribution of larger displacements in the displacement field. However, at t = 50 μs, localized tensile stress appears at the loading end of the specimen. This occurs because the red sandstone exhibits limited deformation resistance, leading to rebound and tensile stress generation following the explosive shock wave.
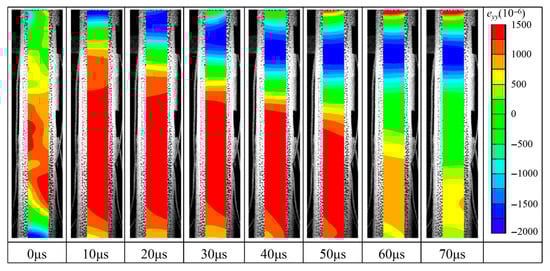
Figure 8.
Axial strain nephogram of the forward gradient material (4 g).
Figure 9 shows the vertical strain contour map of the backward gradient rock mass with a charge quantity of 4 g. The strain contour map effectively illustrates the propagation process of the explosive stress wave from top to bottom. During the initial stage of the explosion, localized compressive stress first forms at the end. Subsequently, under the sustained action of the explosive stress wave and blast gases, the compressive stress zone gradually propagates downward. At t = 40 μs, significant tensile strain appears at the loading end of the specimen. The tensile strain appears earlier than in the forward gradient rock mass. This is because, in the backward gradient rock mass, the sandstone first receives the impact. With a higher elastic modulus, sandstone deforms less under the same load, leading to an earlier rebound.
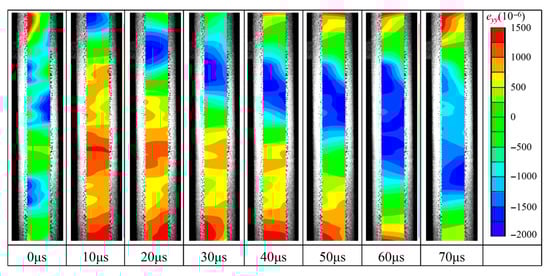
Figure 9.
Axial strain nephogram of the backward gradient material (4 g).
In forward gradient rock masses, the maximum axial strains with increasing charge quantities are 0.00061, 0.00098, and 0.00141, respectively. In reverse gradient rock masses, the maximum axial strains with increasing charge quantities are 0.00036, 0.00065, and 0.00102, respectively. Vertical strain exhibits an upward trend with increasing charge quantity. In the strain–time curve, the slope of the elastic segment is defined as the strain rate. Due to the attenuation of the explosive stress wave within the medium, strain rates at different measurement points within the same lithology vary under identical charge conditions. Coarse sandstone exhibits lower strength, resulting in faster peak strain decay under identical charge quantities. In contrast, gray sandstone possesses higher strength, leading to slower peak strain decay under the same charge conditions. Both peak strain and strain rate exhibit a decreasing trend along the propagation direction of the stress wave (Figure 10).
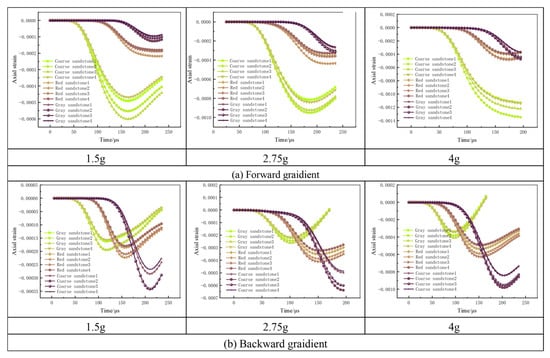
Figure 10.
Strain–time curves in the gradient rock mass.
3.3. Gradient Rock Mass Stress Decay Law
The stress–time history at the measurement point was calculated using Equation (9), as shown in Figure 11. It is evident that the larger the charge quantity, the greater the peak stress. Furthermore, the closer to the explosive end, the higher the peak stress. In coarse sandstone, the stress peak decays more rapidly, while the stress decay rates in red sandstone and gray sandstone are essentially consistent. This occurs because the explosive force attenuates with distance from the charge end, and stress wave decay is reduced at low loading rates. In backward gradient rock masses, stress decay differs from that in forward gradients: gray sandstone and red sandstone exhibit similar decay rates, while coarse sandstone shows lesser attenuation. The primary reason lies in the fact that, in the backward gradient, the explosive stress wave first encounters gray sandstone, which exhibits minimal damage and destruction, resulting in a small attenuation of the explosive stress wave. In the forward gradient, the explosive stress wave first encounters coarse sandstone, which suffers significant damage and destruction, leading to a large attenuation of the explosive stress wave.
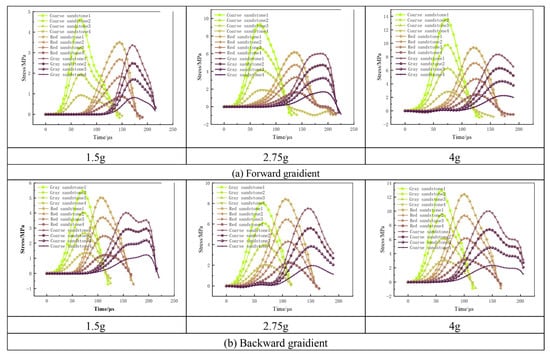
Figure 11.
Stress–time history curves in the gradient rock mass.
Figure 12 illustrates the stress decay pattern in gradient composite rock masses during blasting. Overall, stress levels increase with greater explosive charge quantities. The stress decay curves for forward gradient rock masses and backward gradient rock masses exhibit distinct differences. In forward gradient rock masses, the explosive stress wave first impacts coarse sandstone. At the interface between the two materials, stress exhibits a jump phenomenon due to wave impedance effects. In backward gradient rock masses, the explosive stress wave first impacts gray sandstone. No stress jump occurs at the material interface, resulting in a more gradual stress decay trend.
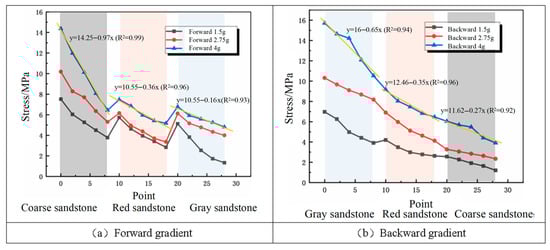
Figure 12.
Stress attenuation in the gradient composite rock mass.
Analysis of stress wave attenuation patterns in rock masses reveals that while stress exhibits an overall exponential decay trend, within individual rock specimens, the attenuation trend can be approximated as linear. The slope of this line reflects the magnitude of stress decay velocity. A comparison of stress decay velocities across different sections is presented in Table 2.
Table 2.
Stress attenuation coefficient of each component of gradient rock mass.
First, we compare the attenuation coefficients of each component in the gradient materials: In the forward gradient, the stress attenuation rate of coarse sandstone is significantly faster than that of the other two sandstone types. In the reverse gradient, the attenuation rate of gray sandstone is markedly faster than that of the other two sandstone types. However, under identical loading conditions, the attenuation coefficient of coarse sandstone is higher than that of gray sandstone. This indicates that stress wave attenuation occurs more rapidly in the near-field region of the explosion, with lower medium strength corresponding to faster attenuation rates. A unified comparison of the gradient materials is as follows: As the charge quantity increases, the stress wave attenuation rates in the forward gradient material are 0.33, 0.36, and 0.50, respectively, while those in the reverse gradient material are 0.23, 0.29, and 0.45, respectively. The stress attenuation coefficients for both gradient materials exhibit an increasing trend. However, the attenuation coefficients in the forward gradient material reached 1.43 times, 1.24 times, and 1.11 times those in the reverse gradient material, respectively. This indicates faster stress wave attenuation in the forward gradient material, with the difference between the two gradually decreasing as the strain rate increases.
3.4. Gradient Material Constitutive Relations
The stress–strain relationship at each measurement point in the forward gradient is shown in Figure 13. The stress–strain curves exhibit similar patterns across different rock types, first increasing to a maximum value before beginning to decline. Within the same rock type, the peak stress–strain values decrease progressively as the measurement point moves farther from the explosion point. Horizontally comparing the data, the stress peaks in coarse sandstone, red sandstone, and gray sandstone show a decreasing trend. Vertically comparing the data, the stress peaks exhibit an increasing trend as the explosive charge increases.
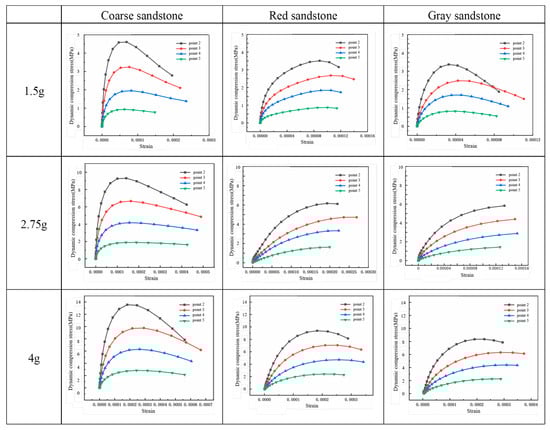
Figure 13.
Constitutive relationship (forward gradient).
The stress–strain relationship at each measurement point in the reverse gradient is shown in Figure 14. Under different loading rates, the stress–strain curves exhibit similar patterns. As the charge quantity increases, the peak values of the dynamic stress–strain curves gradually rise. As the measurement points move further away from the explosion point, the stress peaks also gradually decrease.
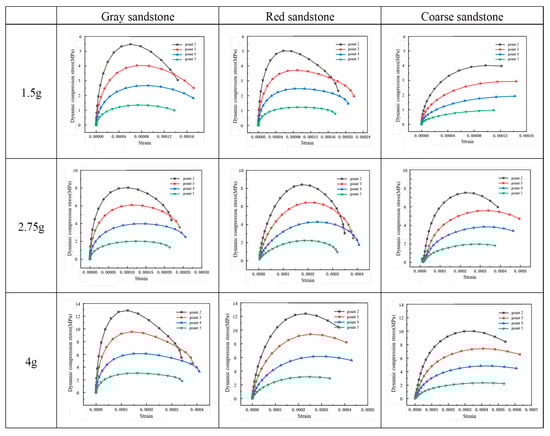
Figure 14.
Constitutive Relationship (Inverse Gradient).
Due to varying stress levels at different measurement points, the constitutive relationship of the same material differs, and the dynamic elastic modulus also changes at different measurement points. Therefore, traditional methods employing a fixed elastic modulus for stress solution introduce certain errors.
4. Conclusions
Through the Lagrange inverse analysis method, utilizing DIC displacement fields and zero boundary conditions, the strain–time curve and stress-time curve of the specimen under explosive loading were obtained. This yielded the constitutive relationships at different locations within the specimen. The following main conclusions were drawn:
(1) As the charge quantity changes, the strain rate of the gradient composite rock mass also responds accordingly. In forward gradient rock masses, the maximum axial strains with increasing charge quantities are 0.00061, 0.00098, and 0.00141, respectively. In reverse gradient rock masses, the maximum axial strains with increasing charge quantities are 0.00036, 0.00065, and 0.00102, respectively. Coarse sandstone exhibits lower strength, resulting in faster peak strain decay under identical charge quantities; gray sandstone possesses higher strength, leading to slower peak strain decay under identical charge quantities.
(2) Stress decay patterns exhibit distinct differences between forward gradient and backward gradient rock masses. In forward gradient rock, stress waves undergo stress jumps at joint planes, resulting in increased wave amplitudes. Conversely, stress waves in backward gradient rock experience significantly greater attenuation.
(3) Stress waves attenuate more rapidly in forward gradient materials, and the difference between the two gradually diminishes as the strain rate increases. Under explosive charges of 1.5 g, 2.75 g, and 4 g, the attenuation coefficients of the positive gradient material reached 1.43 times, 1.24 times, and 1.11 times those of the reverse gradient material, respectively. Under positive gradient conditions, the stress decay rate in coarse sandstone was significantly higher than in the other two sandstone types. Under negative gradient conditions, the decay rate in gray sandstone was significantly higher than in the other two sandstone types.
(4) The stress–strain curve under one-dimensional explosive stress wave loading can be obtained through the Lagrange inverse analysis method. Unlike traditional methods for determining material dynamic constitutive relationships, this approach accounts for variations in strain rate, resulting in distinct constitutive behaviors across different regions. Although limitations in experimental conditions introduce some errors, this method still effectively reflects the general characteristics of the material.
Author Contributions
Methodology, Y.Z. and X.Z.; Validation, B.Y.; Formal analysis, Y.Z.; Investigation, B.W. and Y.C.; Data curation, B.Z. and Y.C.; Writing—original draft, Y.Z. All authors have read and agreed to the published version of the manuscript.
Funding
The authors gratefully acknowledge the support of the National Natural Science Foundation of China (Grant Nos. 51934001, 52004290, 52208384), the China Postdoctoral Science Foundation (2025T038ZGMK, 2025T001ZGMK).
Data Availability Statement
The original contributions presented in this study are included in the article. Further inquiries can be directed to the corresponding author.
Conflicts of Interest
Authors Xiufeng Zhang and Yang Chen were employed by the Shandong Energy Group Co., Ltd. The remaining authors declare that the research was conducted in the absence of any commercial or financial relationships that could be construed as a potential conflict of interest.
References
- Vandevert, I.C.; Shearer, P.M.; Fan, W. Ridgecrest Aftershock Stress Drops from P-and S-Wave Spectral Decomposition. Bull. Seism. Soc. Am. 2024, 115, 792–804. [Google Scholar] [CrossRef]
- Kammer, D.S.; Mclaskey, G.C.; Abercrombie, R.E.; Ampuero, J.-P.; Cattania, C.; Cocco, M.; Dal Zilio, L.; Dresen, G.; Gabriel, A.-A.; Ke, C.-Y.; et al. Earthquake energy dissipation in a fracture mechanics framework. Nat. Commun. 2024, 15, 4736. [Google Scholar] [CrossRef] [PubMed]
- Waqar, M.F.; Qi, S.; Zheng, B.; Guo, S. Dynamic Testing Methods and Failure Properties of Rocks: A Comprehensive Review. Rock Mech. Rock Eng. 2025. [Google Scholar] [CrossRef]
- Serdaliyev, Y.; Iskakov, Y. Research into mass stress and failure zone parameters during blasting of fractured high benches using blasthole charges. Min. Miner. Depos. 2024, 18, 98–108. [Google Scholar] [CrossRef]
- Slimane, H.; Berdoudi, S.; Hadji, R. Blast-induced vibration assessment in the Rouina open-pit mine: Impacts and measurements for the Ouled Mellouk Dam. Min. Miner. Depos. 2024, 18, 1–9. [Google Scholar] [CrossRef]
- Ding, C.; Su, H.; Yang, H.; Xiao, C. Fracture and Damage of Slit Charge Blasting in the Layered Rock Mass. Appl. Sci. 2024, 14, 5840. [Google Scholar] [CrossRef]
- Liu, D.; Wei, D.; Chen, M.; Zhang, H.; Lu, W. Prediction of the Median Fragmentation of Bench Blasting in Layered Rock Mass Based on Discrete Fracture Network. Rock Mech. Rock Eng. 2024, 57, 1653–1668. [Google Scholar] [CrossRef]
- Xie, L.; Zhang, J.; Yang, D.; Qi, Y.; Wu, L.; Chen, H. Research on Damage Evolution Mechanism of Layered Rock Mass under Blasting Load. Buildings 2024, 14, 3227. [Google Scholar] [CrossRef]
- Wei, H.; Li, D.; Zhu, J.; Yang, X.; Chu, H. The Blasting Vibration Characteristics of Layered Rock Mass under High-Pressure Gas Impact. Energies 2023, 16, 6454. [Google Scholar] [CrossRef]
- Yu, J.; Zhang, Z.; Wu, G.; Li, X.; Tian, H. Investigation on Asymmetric Dynamic Response Characteristics of Anchored Surrounding Rock under Blasting Excavation of Inclined Layered Rock Tunnel. Can. Geotech. J. 2025, 62, 16. [Google Scholar] [CrossRef]
- Zhu, J.; Wei, H.; Yang, X.; Chu, H. Prediction of Blasting Vibration Velocity of Layered Rock Mass under Multihole Cut Blasting. Shock Vib. 2021, 2021, 5511190. [Google Scholar] [CrossRef]
- Zhang, Z.; Yao, Y.; Jiang, N.; Xie, Q.; Wang, J. Theoretical Study of the Vibration Characteristic in Geological Layer under Blasting Excavation of Metro Tunnel. J. Vib. Control 2025, 31, 3426–3437. [Google Scholar] [CrossRef]
- Lu, Y.; He, B.-G.; Li, H.-P.; Li, Q.; Ren, C. Theoretical and Numerical Investigation of Damage Zones in Deep Tunnels within a Layered Rock Mass under Full-Face Blasting. Int. J. Rock Mech. Min. Sci. 2025, 188, 106053. [Google Scholar] [CrossRef]
- Hu, Y.; Li, R.; Wu, X.; Zhao, G.; Zhang, Q. Blasting Damage Depth in Layered Jointed Basalt before and after Grouting. J. Geotech. Geoenviron. Eng. 2019, 145, 04018113. [Google Scholar] [CrossRef]
- Biessikirski, A.; Jakobczyk, J. Application of Strain Gauge and Geophone Based Integrated Monitoring System in the Measurements of the Blast Induced Low-Frequency Vibrations. Sci. Rep. 2025, 15, 9544. [Google Scholar] [CrossRef]
- San Miguel, C.R.; Petropoulos, N.; Yi, C.; Johansson, D. Experimental Investigation of Blast-Induced Crack Propagation Based on Digital Image Correlation Analysis. Shock Vib. 2024, 2024, 4149322. [Google Scholar] [CrossRef]
- Pan, J.; Zhang, D.; He, J.; Zhang, L.; Zhou, Z.; Wang, S.; Peng, C.; Han, Y. Experimental Investigation into the Dynamic Response Characteristics of High-Speed Railway Bridge-Track Structure Subjected to Blast-Induced Vibrations. Structures 2025, 81, 110197. [Google Scholar] [CrossRef]
- Yang, F.; Zhu, H.; Kong, D.; Zhao, C. Accurate Measurement of Blast Shock Wave Pressure by Enhanced Sensor System Based on Neural Network. Sensors 2025, 25, 6187. [Google Scholar] [CrossRef] [PubMed]
- Li, C.; Wang, M.; Xie, S.; Qi, A.; Yu, M. Experimental Investigation of Blasting Stress Wave Attenuation in Sandstone with Columnar Charging Using High-Speed DIC Technique. Sci. Rep. 2025, 15, 22515. [Google Scholar] [CrossRef]
- He, C.; Yang, J.; Yu, Q. Laboratory Study on the Dynamic Response of Rock under Blast Loading with Active Confining Pressure. Int. J. Rock Mech. Min. Sci. 2018, 102, 101–108. [Google Scholar] [CrossRef]
- Yu, X.; Fu, Y.; Dong, X.; Zhou, F.; Ning, J. An Improved Lagrangian-Inverse Method for Evaluating the Dynamic Constitutive Parameters of Concrete. Materials 2020, 13, 1871. [Google Scholar] [CrossRef] [PubMed]
Disclaimer/Publisher’s Note: The statements, opinions and data contained in all publications are solely those of the individual author(s) and contributor(s) and not of MDPI and/or the editor(s). MDPI and/or the editor(s) disclaim responsibility for any injury to people or property resulting from any ideas, methods, instructions or products referred to in the content. |
© 2025 by the authors. Licensee MDPI, Basel, Switzerland. This article is an open access article distributed under the terms and conditions of the Creative Commons Attribution (CC BY) license (https://creativecommons.org/licenses/by/4.0/).