Abstract
Shale gas reservoirs are currently a focus in exploration and development in China. However, they exhibit pronounced vertical heterogeneity, are influenced by numerous geological and engineering parameters, and present significant challenges for “sweet spot” identification. Traditional sweet spot identification methods mainly rely on geologists’ experience and judgment regarding individual influencing parameters, which inevitably introduces subjectivity and uncertainty. The rapid development of artificial intelligence technology offers an opportunity to address this issue. This study adopts a geology–engineering integration approach and, based on data integration and a multi-algorithm prediction ensemble model with deep learning, proposes a predictive model built on actual data from the Nanchuan Block of the Sichuan Basin. The model integrates the Tetrahedral Topology Optimization (TBO) algorithm, Extreme Gradient Boosting (XGBoost), and Geological Attribute Feature Mapping (GAFM), aiming to improve the accuracy of shale gas reservoir sweet spot identification more effectively. The results show that sweet spots are jointly influenced by geological, rock-mechanical, and hydraulic fracturing parameters. The primary reservoir property factors controlling post-fracture productivity include TOC, permeability, porosity, and gas saturation, while the main rock-mechanical controlling factors are Poisson’s ratio, Young’s modulus, brittleness index, and Bursting Pressure. Based on the analysis of these productivity-controlling factors, the proposed integrated AI learning model achieved a sweet spot identification accuracy of 88.5%, enabling precise identification of single-well sweet spot distribution.
1. Introduction
With the ongoing development and utilization of oil and gas resources, the strategic importance of shale gas in China has been further enhanced. To date, shale gas reservoirs with considerable resource potential have been discovered in the Sichuan, Ordos, and Songliao Basins [1]. In particular, mature shale gas development has been achieved in the Nanchuan, Fuling, Weiyuan, and Changning areas of the Sichuan Basin, demonstrating substantial development potential. However, as shale gas exploitation progresses, the distribution of favorable shale reservoirs (“sweet spot”), in addition to the intrinsic properties of shale, has become a critical factor constraining further exploration and development [2]. This highlights the urgent need to improve the accuracy of ”sweet spot” identification to better guide subsequent exploration and production.
Previous studies on shale gas “sweet spot” identification have primarily focused on geological and geophysical parameters such as porosity and permeability, as well as engineering parameters such as brittleness index, establishing different criteria to delineate potential ”sweet spot” regions [3]. Nevertheless, since single-parameter analysis cannot fully determine sweet spot locations and nonlinear correlations often exist between multiple parameters and actual sweet spot, traditional approaches fail to account for the combined influence of multiple factors on sweet spot distribution.
With the advancement of artificial intelligence, machine learning has been increasingly applied in oil and gas exploration and development [4,5,6,7,8,9,10,11]. Machine learning algorithms demonstrate strong performance in large-scale datasets and enable the analysis of complex nonlinear correlations among multi-dimensional parameters, thereby overcoming the limitations of traditional methods. For instance, algorithms such as Random Forest [12] and Support Vector Machine [6] have been employed to analyze favorable reservoir distributions in practical fields, while deep learning approaches such as Convolutional Neural Networks (CNN) have been successfully applied to image recognition and further utilized for sweet spot characterization, improving the accuracy of sweet spot identification [13,14,15,16,17].
Although machine learning algorithms have shown significant advantages in shale gas development, the strong heterogeneity of shale gas reservoirs and uncertainties in data quality limit the training and predictive accuracy of single models. To enhance prediction reliability, machine learning models based on multi-source data fusion have emerged as a research hotspot.
Against this background, this study proposes an integrated model based on Tetrahedral Topology Optimization (TBO), Extreme Gradient Boosting (XGBoost), and Geological Attribute Feature Mapping (GAFM), aiming to achieve accurate sweet spot identification in the Nanchuan Block of the Sichuan Basin. By jointly analyzing geological, geophysical, and engineering sweet spot parameters through a multi-algorithm ensemble learning framework, the model provides a robust scientific basis for guiding further shale gas exploration and development.
2. Geological Setting
The Nanchuan area is located at the southeastern margin of the Sichuan Basin, within the southern part of the eastern Sichuan fold belt, belonging to the basin-margin structural deformation zone [18]. The fold structures in the region are predominantly NE-trending, characterized by broad anticlines and narrow synclines, accompanied by the development of thrust faults, with locally observed fault-related folds (Figure 1). The study area has undergone two main deformation stages: early extension and late-stage compression. The extensional phase provided favorable accommodation space for sedimentation, whereas subsequent compressional tectonics resulted in widespread folding and thrust faulting. Fractures are mainly composed of tensile and shear fractures, with partial calcite filling. Moderately developed fractures improve reservoir porosity and permeability, while excessive fracturing may compromise reservoir preservation conditions. Sweet spots are generally distributed in structurally stable and well-sealed areas with moderate fracture development.
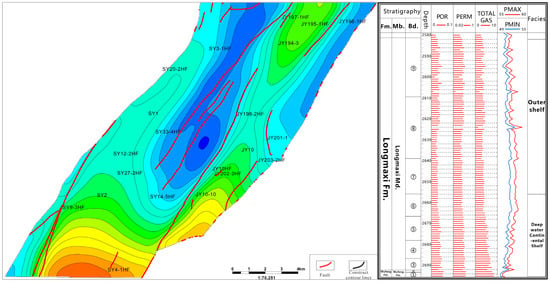
Figure 1.
Structural Bottom Boundary and Stratigraphic Column of the Target Layer of the Wufeng Formation in the Nanchuan Area. Red represents structural highs, and blue represents structural lows.
The target strata of the study area are the Upper Ordovician Wufeng Formation–Lower Silurian Longmaxi Formation, overlain by the Hanjiadian Formation of the Silurian. The thickness of the Longmaxi Formation ranges from 20 to 80 m (data source: well logs), with the lower part dominated by organic-rich black shale, which accounts for more than 50% of the total thickness and represents high-quality source rock [19]. Upsection, the succession gradually transitions into silty mudstone and argillaceous siltstone, with a corresponding decline in hydrocarbon generation potential. The Wufeng–Longmaxi shales are mainly dark gray to black mudstone shales, locally interbedded with silty shale. The mineralogy is dominated by quartz, feldspar, and illite, with a generally high quartz content (data source: XRD analyses). The abundance of brittle minerals is favorable for hydraulic fracturing. The total organic carbon (TOC) content is generally 2–6%, locally exceeding 8% (data source: core analysis). Overall, the depositional environment corresponds to a semi-deep to deep-water shelf under an anoxic, low-energy setting, conducive to organic matter enrichment and preservation [20,21,22,23,24,25]. The vertical depositional succession exhibits a shallowing-upward cycle from organic-rich shale to silty mudstone, indicating a gradual reduction in water depth and hydrocarbon generation potential
Shale gas occurrence in the study area is characterized by the coexistence of adsorbed and free gas, indicating significant resource potential [26]. In 2017, the deployment of the SY1HF well in a favorable anticline target achieved a daily gas production rate of 1.44 × 10⁵ m3 with a pressure coefficient of 1.3, marking a major breakthrough in shale gas exploration in the Dongsheng area. Several appraisal wells drilled within the block have also yielded industrial gas flows.
With the advancement of shale gas development in the Nanchuan Block, strong reservoir heterogeneity has increasingly constrained production performance [27,28]. The distribution of sweet spots is jointly controlled by organic matter abundance, brittle mineral content, fracture development, and preservation conditions [29,30,31,32]. Therefore, under such complex geological conditions, accurate delineation of sweet spot zones is essential to improving resource evaluation accuracy and development efficiency, underscoring the urgent need for sweet spot identification and quantitative prediction studies.
3. Research Data and Methods
3.1. Data Source and Processing
In this study, the sweet spots of the Wufeng–Longmaxi Formation were classified into four categories based on production capacity: Type I, with an initial daily gas production greater than 80,000 m3/d; Type II, with 30,000–80,000 m3/d; Type III, with 20,000–30,000 m3/d; and Type IV, with less than 20,000 m3/d. To construct and validate the model, the study collected data from 17 core wells in the Nanchuan area. The data sources include nine features, covering aspects such as organic matter quality, reservoir quality, and completion quality. The data were divided into training and testing sets using stratified random sampling, with a ratio of 7:3. All raw data were cleaned and standardized before modeling. The specific experimental design and data processing workflow are shown in Table 1.

Table 1.
Summary of data sources and feature categories used for model construction.
3.2. ”Sweet Spot” Identification Model Based on TBO-XGBoost-GAFM
To identify the geological and engineering parameters with the most significant impact on production, feature importance scoring was first employed to select key parameters. Based on these features, this study integrates the Tetrahedral Topology Optimization (TBO) algorithm, the Extreme Gradient Boosting (XGBoost) model, and Geological Attribute Feature Mapping (GAFM) for accurate sweet spot prediction (Figure 2). During model training, the dataset was split into training and testing subsets at a 7:3 ratio, and hyperparameters were tuned through cross-validation. Model performance was evaluated using accuracy, recall, and F1-score to comprehensively validate the effectiveness of the proposed method.
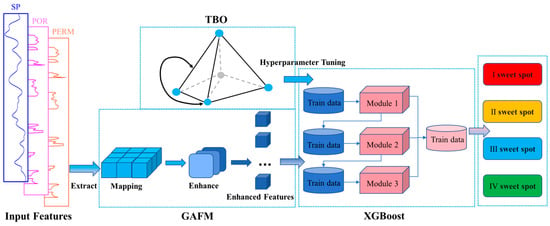
Figure 2.
Workflow of feature extraction, feature enhancement (GAFM), TBO optimization, and XGBoost-based sweet spot classification.
The TBO–XGBoost–GAFM framework was selected due to the complementary strengths of its components. TBO provides efficient global–local search to optimize XGBoost hyperparameters, XGBoost offers robust nonlinear modeling suitable for noisy and heterogeneous geological datasets, and GAFM incorporates geological prior knowledge to enhance feature representation. Preliminary comparisons with commonly used optimization methods—including Particle Swarm Optimization (PSO), Genetic Algorithms (GA), Grid Search, and Bayesian Optimization—indicated that this integrated framework achieves more stable convergence and better generalization on noisy geological–engineering data, making it well suited for capturing the multi-scale, nonlinear characteristics of shale gas reservoirs.
3.2.1. Tetrahedron Topology Optimization (TBO)
The tetrahedron, owing to its stability and space-filling properties, represents the most fundamental rigid structure in three-dimensional space. Inspired by these characteristics, the Tetrahedron Topology Optimization (TBO) algorithm abstracts complex optimization problems into the construction and evolution of tetrahedral units in a high-dimensional search space. The algorithm employs an iterative mechanism of “unit construction–information exchange–progressive optimization” to balance global exploration and local exploitation, thereby enhancing the overall search performance. In TBO, each topological unit is composed of four vertices, with each vertex representing a candidate set of hyperparameters. As iterations proceed, these units are continuously reorganized and updated within the high-dimensional space, progressively approaching the optimal solution region.
The optimization process of TBO integrates two core strategies: global aggregation and local aggregation. Global aggregation aims to maintain population diversity and conduct breadth-first searches, preventing premature convergence to local optima. This strategy selects the best-performing individuals from different units and generates new candidates through crossover and mutation. The new candidates are then compared with existing unit members, and superior individuals replace weaker ones, thereby updating the unit. Such cross-unit information exchange ensures continuous exploration of uncharted regions in the search space (Figure 3a). In contrast, local aggregation complements global aggregation by focusing on intensive exploitation of promising regions to improve convergence accuracy. This strategy identifies the best individual within a unit as the local search center and generates neighboring candidates by applying small perturbations. If a new solution outperforms the current best, it replaces the original individual as the new reference point. The process iterates within the unit until no further improvement is possible, thus ensuring fine-grained optimization in key regions and avoiding suboptimal solutions (Figure 3b).
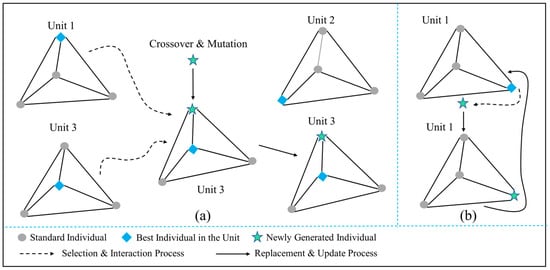
Figure 3.
Iterative update process of local aggregation information. (a) Global Aggregation. (b) Local Aggregation.
In this study, the TBO algorithm is specifically applied to optimize the critical hyperparameters of the XGBoost model, including learning rate, tree depth, and subsample ratio. The algorithm first employs global aggregation to conduct a broad search, rapidly locating potential optimal parameter regions. Subsequently, local aggregation refines parameter values within these regions. This dual strategy significantly improves search efficiency, yielding high-quality parameter combinations, thereby enhancing the generalization ability and stability of the model and providing a reliable foundation for sweet spot identification.
3.2.2. XGBoost Model
In this study, the XGBoost (Extreme Gradient Boosting) model was employed to predict sweet spots. This algorithm is built upon gradient boosting decision trees (GBDT) and iteratively trains a series of decision trees to fit the residuals of the model, combining them into a strong learner to achieve accurate predictions. Compared with traditional gradient boosting algorithms, XGBoost leverages second-order derivative information to accelerate convergence, while also handling sparse data, thereby enhancing model stability and generalization. XGBoost represents the prediction process using an additive model:
Here, denotes the prediction of the -th tree for sample i, and represents the base learner (decision tree). The objective function of the t-th tree is defined as:
Here, denotes the objective function to be minimized at iteration ; is the true value of sample ; and are the previous prediction and the current tree’s output, respectively; is the total number of samples; denotes the differentiable loss function that measures the difference between the predicted and true values; is the regularization term that penalizes model complexity and prevents overfitting; and constant refers to terms independent of that do not affect optimization. In regression tasks, the loss function is commonly expressed as the mean squared error (MSE):
Here, denotes the overall loss value; and represent the true and predicted values of sample , respectively; and is the number of samples in the dataset.
XGBoost optimizes the objective function via gradient descent and employs a greedy strategy based on information gain or the Gini index to identify optimal split points. Building on gradient boosting trees, the algorithm performs a second-order Taylor expansion of the loss function, improving both optimization accuracy and computational efficiency. Model complexity is incorporated into the regularization term to prevent overfitting; missing values are handled automatically by selecting the split direction that maximizes gain; and the use of a block-based storage structure enables parallel computation, significantly accelerating training.
Within the framework of this study, to ensure optimal performance of the XGBoost model, its key hyperparameters were adaptively optimized using the TBO algorithm described in the previous section. The training set was used to fit the model, while the test set was employed to validate performance, ensuring generalization to unseen data. Feature importance scores were further utilized to identify the parameters with the greatest impact on productivity, guiding both the training process and interpretation of model outputs. Through this approach, the XGBoost model can efficiently capture the complex nonlinear relationships between geological and engineering features and productivity, maintaining stable and accurate performance in single-well sweet spot prediction. Moreover, this modeling framework provides a solid foundation for multivariate optimization integrating TBO and GAFM, making the sweet spot identification process more efficient and interpretable.
3.2.3. Model Geological Attribute Feature Mapping and Enhancement (GAFM)
To deeply explore the complex nonlinear relationships between raw geological and engineering parameters and shale gas productivity, this study introduces the Geological Attribute Feature Mapping and Enhancement (GAFM) method. Based on principles of geophysics and rock mechanics, this approach systematically combines and transforms independent raw inputs into an enhanced feature set that is more indicative for sweet spot identification. By making hidden nonlinear relationships explicit and improving the informational quality of model input features, GAFM fundamentally enhances both the predictive accuracy of the XGBoost model and the geological interpretability of the results (Figure 4).
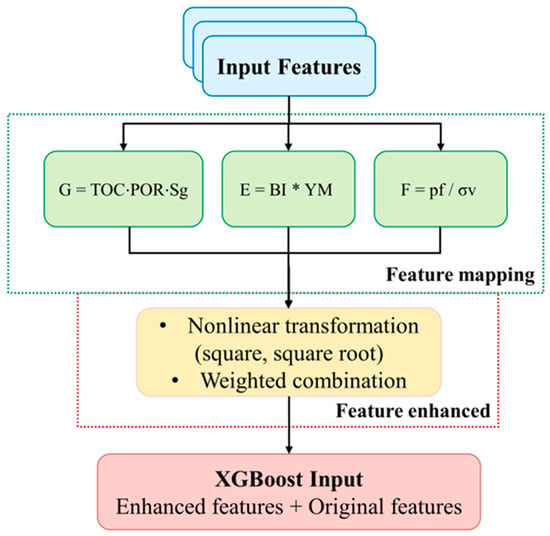
Figure 4.
Framework for constructing XGBoost input features based on GAFM.
During the feature preprocessing stage, raw parameters such as porosity, gas saturation, total gas content, and TOC were normalized to eliminate dimensional differences and reduce the influence of extreme values, ensuring that different features remain comparable in subsequent mappings. Guided by geological and engineering knowledge, individual features were further transformed into composite features to reveal potential coupling relationships. In this study, three core composite indices were constructed. The Reservoir Gas Content Index (G) integrates total organic carbon, porosity, and gas saturation through the formula , providing a comprehensive evaluation of the shale reservoir’s hydrocarbon generation potential, storage space, and gas content. The Rock Fracturability Index (E) is calculated as , combining the brittleness index and Young’s modulus to reflect the rock’s stiffness and brittleness, which is a key factor in assessing whether the reservoir can form a complex and effective fracture network under hydraulic fracturing. The Geostress Condition Index (F) is defined as , relating the fracture pressure to the vertical stress to indicate the difficulty of initiating fractures in the reservoir, making it a critical parameter for evaluating engineering sweet spots.
After completing the feature mapping, the study further applied nonlinear transformations and weighted combinations to enhance the expressive power of the model. The Reservoir Gas Content Index (G) was transformed through squaring or square-root operations to generate derived features (G’), which increase differentiation in the low-value range. The Rock Fracturability Index (E) was further adjusted through weighting to obtain E′. The weights were derived from correlation analysis between each parameter and the measured productivity, followed by min–max normalization to ensure consistency across features. The Geostress Condition Index (F) was subjected to square-root or logarithmic transformations to generate F’, mitigating the influence of extreme values and enhancing interval differentiation. These derived features, together with the original features, were used as inputs to the model, significantly improving XGBoost’s ability to capture nonlinear relationships.
In summary, GAFM converts raw geological and engineering features into input variables that are physically meaningful and computationally more discriminative through normalization, mapping, and enhancement. This approach not only improves the accuracy and stability of single-well sweet spot prediction but also strengthens the interpretability of feature importance analysis, providing a reliable theoretical basis for reservoir evaluation and development decision-making.
4. Geological–Engineering Sweet Spot Identification Case Study
4.1. Analysis of Key Controlling Factors for Sweet Spots
This study takes the Nanchuan block at the southeastern margin of the Sichuan Basin as an example to analyze the controlling factors of productivity in the Wufeng–Longmaxi shale gas reservoirs. First, the raw data were strictly preprocessed, including handling of missing values and feature normalization, to ensure data quality and eliminate dimensional differences. Only nine geological and engineering features were used in this study because they were consistently available across all 17 core wells and have been demonstrated to have the strongest control on post-fracturing productivity. Other potential features, such as pore pressure, historical fracture data, or completion-specific operational parameters, were either unavailable, incomplete, or inconsistent, making them unsuitable for model training. Derived features from GAFM were then generated to fully exploit interactions among the original features.
The importance of these nine features was evaluated based on Kendall correlation analysis (Figure 5). The results indicate that TOC, total gas content, porosity, and gas saturation are the primary controlling factors of post-fracturing productivity, while rock mechanical parameters such as Poisson’s ratio, Young’s modulus, brittleness index, vertical stress, and fracture pressure also significantly influence productivity, reflecting the reservoir’s response characteristics to fracture propagation.
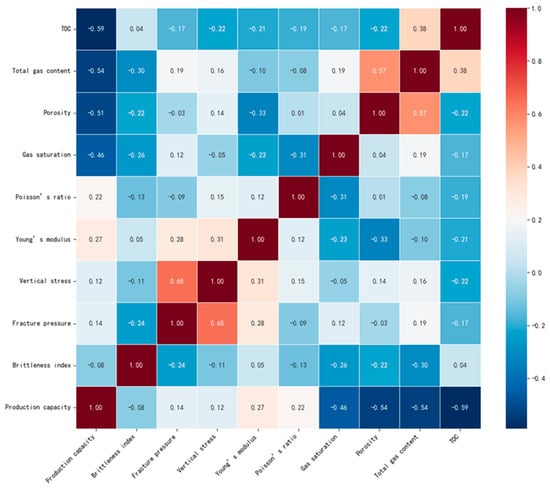
Figure 5.
Importance Analysis of Primary Controlling Factors of Productivity.
To further identify the subset of features that most significantly influence productivity, this study employed the Tetrahedral Topology Optimization (TBO) algorithm. In this approach, the original key features are mapped into a high-dimensional parameter space. By constructing tetrahedral topological units and performing both global and local searches, the algorithm can evaluate the contribution of different feature combinations to sweet spot productivity and optimize XGBoost hyperparameters—including learning rate, tree depth, and subsample ratio—to enhance model performance and generalization. The results indicate that a feature subset consisting of TOC, total gas content, porosity, gas saturation, Poisson’s ratio, and Young’s modulus serves as the core parameters for sweet spot identification.
After selecting the core features, they were input into the XGBoost model for training. XGBoost iteratively trains decision trees and combines them into a strong learner, capturing the complex nonlinear relationships between geological and engineering parameters and productivity. To further improve the model’s expressive capability, this study incorporated Geological Attribute Feature Mapping (GAFM), which applies nonlinear transformations and weighted combinations to the original features. This process generates derived features such as the Reservoir Gas Content Index, Rock Fracturability Index, and Geostress Condition Index, allowing the model to more fully explore potential couplings among features and thereby improve the accuracy of sweet spot identification.
4.2. Hyperparameter Setting of the TBO-XGBoost-GAFM Model
To fully leverage the predictive capability of the TBO-XGBoost-GAFM model, careful tuning of its hyperparameters is essential. The choice of hyperparameters directly affects the model’s learning efficiency, fitting accuracy, and generalization ability. This study focuses on optimizing three key XGBoost hyperparameters: the learning rate (“learning_rate”), which controls the step size of each iteration and balances convergence speed and stability; the maximum tree depth (“max_depth”), which limits the growth of individual trees to prevent overfitting while maintaining the ability to capture complex nonlinear relationships; and the subsample ratio (“subsample”), which trains each tree on a subset of samples to improve robustness against outliers and noise. To efficiently determine the optimal parameter combination, the Tetrahedral Boundary Optimization (TBO) algorithm was applied to intelligently search the hyperparameter space. During hyperparameter optimization, 5-fold cross-validation was used to robustly evaluate each candidate set. The training data were split into 5 folds, with 4 folds for training and 1 for validation, repeated 5 times. The optimized configuration achieved an average F1-score of 0.873 ± 0.02, indicating stable performance. To improve efficiency, a high-dimensional search with local fine-tuning was performed by integrating TBO and grid search, ensuring both global exploration and precise identification of optimal regions. Sensitivity analysis, conducted by slightly perturbing hyperparameters (learning_rate ±0.01, max_depth ±1, subsample ±0.1), showed minimal performance variation, confirming robustness.
Through this systematic hyperparameter optimization process, the model fully exploited the feature representations enhanced by TBO and GAFM, achieving high-accuracy and robust sweet spot prediction. The optimal parameter configuration was determined as follows: “learning_rate” = 0.05, “max_depth” = 7, and “subsample” = 0.8. Under this configuration, the model’s performance on the test set was significantly superior to that of the unoptimized model. In the initial model, the training loss continuously decreased, while the validation loss initially declined but then plateaued or fluctuated, revealing a noticeable gap between the two (Figure 6a). This indicates overfitting in the initial model, which, although performing well on the training data, exhibited limited generalization. In contrast, the optimized model showed substantial improvement (Figure 6b). The training and validation loss curves decreased synchronously and converged at a lower level, with minimal gap between them.
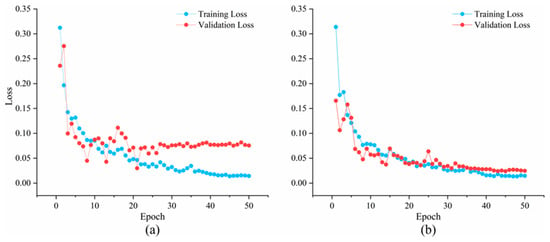
Figure 6.
Model loss curves under different hyperparameter configurations: (a) Initial model. (b) Optimized model.
These results demonstrate that the optimized hyperparameter configuration effectively mitigated overfitting and significantly enhanced the model’s generalization and stability. By finely tuning the hyperparameters, the overall performance of the model was greatly improved. The optimized model not only more effectively captures the complex nonlinear relationships between geological, engineering features, and productivity but also produces predictions that are more stable and reliable.
4.3. Model Performance Evaluation Metrics
To comprehensively evaluate the performance of the TBO-XGBoost-GAFM multivariable regression and prediction model, multiple metrics were employed to assess its predictive accuracy and reliability, including accuracy, recall, precision, and F1 score.
4.3.1. Accuracy
Accuracy measures the ratio of correctly predicted samples to the total number of samples, providing an intuitive reflection of the model’s overall performance, especially for classification tasks. It is expressed as:
where A is accuracy, and TP denotes the number of correctly predicted positive samples, TN the number of correctly predicted negative samples, FP the number of samples incorrectly predicted as positive, and FN the number of samples incorrectly predicted as negative.
4.3.2. Recall
Recall evaluates the model’s ability to identify positive samples, i.e., the proportion of actual positive samples that are correctly predicted as positive. It is calculated as:
where R denotes the recall.
4.3.3. Precision
Precision measures the proportion of correctly predicted positive samples among all samples predicted as positive, focusing on prediction accuracy and emphasizing the reduction in false positives. Its formula is:
where P represents the precision.
4.3.4. F1 Score
The F1 score represents the harmonic mean of precision and recall, providing a balance between the two metrics. Its value ranges from 0 to 1, with values closer to 1 indicating better model performance. A higher F1 value indicates more balanced predictive capability between precision and recall. It is defined as:
4.4. Sweet Spot Identification Results
To systematically evaluate the effectiveness of the model, the TBO-XGBoost-GAFM model was compared with a standard XGBoost baseline in the task of single-well sweet spot identification (Figure 7). The TBO-XGBoost-GAFM model successfully predicted 486 out of 549 test samples, achieving an overall accuracy of 88.5%. In contrast, the XGBoost model correctly predicted only 459 samples on the same dataset, with an accuracy of 83.7%. The comparison demonstrates that combining TBO for hyperparameter optimization and incorporating GAFM for feature enhancement improves prediction accuracy by 4.8 percentage points, validating the effectiveness of the optimization strategy and enabling the model to achieve higher precision and stronger generalization in sweet spot identification.
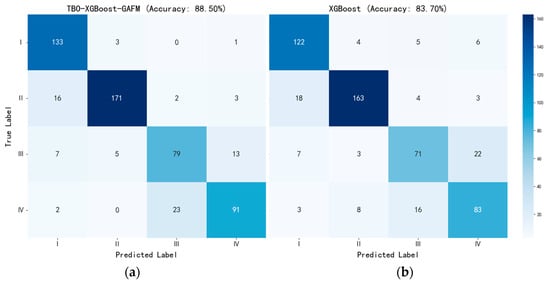
Figure 7.
(a) TBO-XGBoost-GAFM model confusion matrix. (b) XGBoost model confusion matrix. Along the main diagonal, darker blue indicates more correctly classified samples for each category, while lighter blue indicates fewer. Note that total sample counts differ across categories.
Taking the low-production Well A and high-production Well B as examples, sweet spot identification was performed using the proposed TBO-XGBoost-GAFM model. Well A has manually identified sweet spot results. For the horizontal section of low-production Well A, the actual sweet spot interval was 2120 m, while the model predicted 2140 m, resulting in an error of less than 3% (Figure 8). In Well A, the actual sweet spot classification shows that Class III and IV sweet spots account for 55.98%, with the remaining reservoir accounting for 45.02%, and a first-year daily production of 26,000 m3.

Figure 8.
Comparison between actual drilling and predicted sweet spots in horizontal well A.
For high-production Well B, Class I and II sweet spots account for 81.88%, and Class III and IV sweet spots account for 18.11%, with a first-year daily production of 64,000 m3. The algorithm’s predicted sweet spots correspond closely with actual production, demonstrating the model’s accuracy and reliability in capturing productivity-related sweet spot distributions (Figure 9).

Figure 9.
Predicted sweet spot Map of Low-Productivity Well B.
4.5. Comparative Experimental Results
To comprehensively validate the effectiveness of the TBO-XGBoost-GAFM ensemble model, a series of comparative experiments were conducted. First, the ensemble model was compared against four benchmark models: CNN, BP neural network, SVM, and standard XGBoost. Second, to investigate the individual contributions of the GAFM feature enhancement module and the TBO hyperparameter optimization algorithm, ablation experiments were performed (Table 2). All models were evaluated on the same test set, using prediction accuracy, recall, precision, and F1 score as the primary performance metrics.

Table 2.
Performance Comparison of Different Models for sweet spot Recognition.
The proposed TBO-XGBoost-GAFM model demonstrated the best performance in sweet spot identification. The model achieved an accuracy of 88.5% and an F1 score of 87.3%, correctly identifying 486 samples in total. Compared with the standard XGBoost model (83.7%) and neural network models (CNN 82.7%, BP 83.1%), the proposed model exhibited a significant performance advantage, which was even more pronounced relative to the traditional SVM model (69.4%). Paired Student’s t-tests were performed on the prediction errors between the TBO-XGBoost-GAFM model and other models, confirming that all improvements were statistically significant (p < 0.05). This indicates that ensemble learning methods are superior in capturing the complex nonlinear relationships between geological features and productivity.
5. Discussion
In this study, the TBO-XGBoost-GAFM model demonstrated excellent predictive performance, which can be attributed to its advanced structure combining ensemble learning and optimization algorithms. In particular, the TBO algorithm effectively balances global and local search, identifying optimal solutions across the entire parameter space. Moreover, the stability and generalization capability of XGBoost enhance both the accuracy and robustness of predictions. In addition, the use of GAFM strengthens the mapping between geological and engineering parameters, improving the model’s ability to discriminate among different input information during prediction. This approach partially emulates the decision-making process of experienced geoscientists, enhancing the model’s adaptability to complex geological and engineering conditions.
Although the TBO-XGBoost-GAFM model performed well in the current study, its performance may be constrained by data quality and quantity. Future work could further improve generalization by incorporating higher-dimensional data and more sophisticated geological models. Furthermore, considering the specific conditions and requirements of different oil and gas fields, the adjustability and adaptability of the model represent important directions for future enhancement. Future research may also involve applying the model to other basins and integrating seismic or geochemical attributes to further enhance its generalizability.
However, some limitations of the TBO-XGBoost-GAFM model should be acknowledged. The model performance tends to decrease in regions with sparse or low-quality data, where predictive uncertainty is higher. In geologically heterogeneous layers, prediction errors are larger due to complex nonlinear interactions that are not fully captured by the current features. The model is also somewhat sensitive to extreme values or outliers, which can affect training stability. In addition, the TBO hyperparameter optimization procedure is computationally intensive, which may limit its efficiency for very large datasets. Future improvements could involve incorporating additional geological constraints, feature engineering, or alternative machine learning algorithms to further enhance robustness and adaptability.
6. Conclusions
This study demonstrates that reservoir parameters such as TOC, total gas content, porosity, and gas saturation are the key geological factors influencing sweet spot identification and play a dominant role in post-fracturing productivity.
A TBO-XGBoost-GAFM ensemble model was proposed, which effectively integrates the advantages of each algorithm and significantly improves the accuracy of reservoir sweet spot identification, achieving an overall accuracy of 88.5%. The comparison of predictions between low- and high-production wells further validates the reliability of sweet spot identification from a production perspective, providing a novel approach for future sweet spot prediction.
Using the TBO-XGBoost-GAFM model, a comprehensive single-well geological–engineering sweet spot identification considering multiple factors was realized. The model was applied in the Nanchuan block to achieve precise single-well sweet spot predictions, demonstrating its potential for practical applications in oil and gas exploration and development. Future studies may extend the TBO-XGBoost-GAFM framework to multi-basin datasets and integrate 3D seismic attributes for broader validation.
Author Contributions
Conceptualization, D.F. and W.M.; Writing—original draft, D.F., W.M. and X.L.; Writing—review and editing, D.F. and L.B.; Methodology, X.L., L.B. and Y.L.; Formal analysis, D.F. and F.Z.; Investigation, W.M. and H.L. All authors have read and agreed to the published version of the manuscript.
Funding
This research was funded by Key Technologies for Exploration and Development of Shallow Shale Gas in Southeast Chongqing, grant number P24115 and Research on Key Technologies for Stable Production of Atmospheric Pressure Shale Gas in Nanchuan, grant number P25127.
Data Availability Statement
For confidentiality reasons, some of the data in the article cannot be publicly displayed. If you have data-related questions, you are welcome to contact me by email.
Conflicts of Interest
Author Dazhi Fang and Weijun Ma were employed by the Sinopec Chongqing Shale Gas Co., Ltd. The remaining authors declare that the research was conducted in the absence of any commercial or financial relationships that could be construed as a potential conflict of interest.
References
- Bao, S.; Ge, M.; Zhao, P.; Guo, T.; Gao, B.; Li, S.; Zhang, J.; Lin, T.; Yuan, K.; Li, F. Status-quo, potential, and recommendations on shale gas exploration and exploitation in China. Oil Gas Geol. 2025, 46, 348–364. [Google Scholar] [CrossRef]
- He, X.; Chen, G.; Wu, J.; Liu, Y.; Wu, S.; Zhang, J.; Zhang, X. Deep shale gas exploration and development in the southern Sichuan Basin: New progress and challenges. Nat. Gas Ind. B 2023, 10, 32–43. [Google Scholar] [CrossRef]
- Sondergeld, C.; Newsham, K.; Comisky, J.T.; Rice, M.C.; Rai, C.S. Petrophysical Considerations in Evaluating and Producing Shale Gas Resources. In Proceedings of the SPE Unconventional Gas Conference, Pittsburgh, PA, USA, 23–25 February 2010. [Google Scholar]
- Kuang, L.; Liu, H.; Ren, Y.; Luo, K.; Shi, M.; Su, J.; Li, X. Application and development trend of artificial intelligence in petroleum exploration and development. Pet. Explor. Dev. 2021, 48, 1–11. [Google Scholar] [CrossRef]
- Bhattacharyya, S.; Vyas, A. Application of machine learning in predicting oil rate decline for Bakken shale oil wells. Sci. Rep. 2022, 12, 16154. [Google Scholar] [CrossRef]
- Lu, C.; Jiang, H.; Yang, J.; Wang, Z.; Zhang, M.; Li, J. Shale oil production prediction and fracturing optimization based on machine learning. J. Pet. Sci. Eng. 2022, 217, 110900. [Google Scholar] [CrossRef]
- Wang, M.; Hui, G.; Pang, Y.; Wang, S.; Chen, S. Optimization of machine learning approaches for shale gas production forecast. Geoenergy Sci. Eng. 2023, 226, 211719. [Google Scholar] [CrossRef]
- Wang, T.; Wang, Q.; Shi, J.; Zhang, W.; Ren, W.; Wang, H.; Tian, S. Productivity Prediction of Fractured Horizontal Well in Shale Gas Reservoirs with Machine Learning Algorithms. Appl. Sci. 2021, 11, 12064. [Google Scholar] [CrossRef]
- Wang, H.; Guo, Z.; Kong, X.; Zhang, X.; Wang, P.; Shan, Y. Application of Machine Learning for Shale Oil and Gas “Sweet Spots” Prediction. Energies 2024, 17, 2191. [Google Scholar] [CrossRef]
- Ma, Y.; Ye, M. Application of Machine Learning in Hydraulic Fracturing: Opportunities, Challenges, and Case Studies. ACS Omega 2025, 10, 10769–10785. [Google Scholar] [CrossRef]
- Chu, H.; Dong, P.; Lee, W.J. A deep-learning approach for reservoir evaluation for shale reservoirs. Adv. Geo-Energy Res. 2023, 7, 49–65. [Google Scholar] [CrossRef]
- Zhu, L.; Zhou, X.; Zhang, C. Rapid identification of high-quality marine shale gas reservoirs based on the oversampling method and random forest algorithm. Artif. Intell. Geosci. 2021, 2, 76–81. [Google Scholar] [CrossRef]
- Syah, R.; Naeem, M.H.T.; Daneshfar, R.; Dehdar, H.; Soulgani, B.S. On the prediction of methane adsorption in shale using grey wolf optimizer support vector machine approach. Petroleum 2022, 8, 264–269. [Google Scholar] [CrossRef]
- Cheng, B.; Xu, T.; Luo, S.; Chen, T.; Li, Y.; Tang, J. Method and practice of deep favorable shale reservoirs prediction based on machine learning. Pet. Explor. Dev. 2022, 49, 1056–1068. [Google Scholar] [CrossRef]
- Huang, R.; Li, Y.; Gao, Z.; Fan, C.; You, J.; Li, R.; Deng, C.; Li, G. Machine learning-based sweet spot prediction for lacuscrine shale oil in the Weixinan Sag, Beibu Gulf Basin, China. Mar. Pet. Geol. 2025, 179, 107436. [Google Scholar] [CrossRef]
- Wu, Y.; Jiang, F.; Hu, T.; Xu, Y.; Guo, J.; Xu, T.; Xing, H.; Chen, D.; Pang, H.; Chen, J.; et al. Shale oil content evaluation and sweet spot prediction based on convolutional neural network. Mar. Pet. Geol. 2024, 167, 106997. [Google Scholar] [CrossRef]
- Li, Z.; Deng, S.; Hong, Y.; Wei, Z.; Cai, L. A novel hybrid CNN–SVM method for lithology identification in shale reservoirs based on logging measurements. J. Appl. Geophys. 2024, 223, 105346. [Google Scholar] [CrossRef]
- Liu, S.; Yang, Y.; Deng, B.; Zhong, Y.; Wen, L.; Sun, W.; Li, Z.; Jansa, L.; Li, J.; Song, J.; et al. Tectonic evolution of the Sichuan Basin, Southwest China. Earth-Sci. Rev. 2021, 213, 103470. [Google Scholar] [CrossRef]
- Ge, X.-Y.; Mou, C.-L.; Men, X.; Hou, Q.; Zheng, B.-S.; Liang, W. Lithofacies palaeogeography, depositional model and shale gas potential evaluation in the O3-S1 Wufeng-Longmaxi Formation in the Sichuan Basin, China. China Geol. 2025, 8, 338–359. [Google Scholar]
- Li, W.; Lei, Z.; Chen, W.; Meng, S.; Chen, L.; Pu, B.; Sun, C.; Zheng, J. Characteristics of sedimentary facies and lithofacies distribution of deep shale of Wufeng Formation–Longmaxi Formation in western Chongqing area, Sichuan Basin, China. Spec. Oil Gas Reserv. 2024, 31, 37–44. [Google Scholar]
- Tang, X.; Jiang, Z.; Jiang, S.; Cheng, L.; Zhong, N.; Tang, L.; Chang, J.; Zhou, W. Characteristics, capability, and origin of shale gas desorption of the Longmaxi Formation in the southeastern Sichuan Basin, China. Sci. Rep. 2019, 9, 1035. [Google Scholar] [CrossRef]
- Lu, C.; Chen, L.; Jing, C.; Tan, X.; Nie, Z.; Chen, X.; Heng, D. Gas-bearing characteristics of the Longmaxi Formation shale in the Changning area, Sichuan Basin. Front. Earth Sci. 2022, 10, 755690. [Google Scholar] [CrossRef]
- He, W.; Li, T.; Mou, B.; Lei, Y.; Song, J.; Liu, Z. Lithofacies types and physical characteristics of organic-rich Longmaxi shales: Implications for pore systems and reservoir quality. ACS Omega 2023, 8, 18165–18179. [Google Scholar] [CrossRef]
- Xie, G.; Hao, W. Identifying organic matter types and characterizing OM-hosted pores in Wufeng–Longmaxi Formation shales. ACS Omega 2022, 7, 38811–38824. [Google Scholar] [CrossRef]
- Wu, W.; Cheng, P.; Liu, S.; Luo, C.; Gai, H.; Gao, H.; Zhou, Q.; Li, T.; Zhong, K.; Tian, H. Gas-in-place variation and main controlling factors of Wufeng–Longmaxi shales. J. Earth Sci. 2023, 34, 1002–1011. [Google Scholar] [CrossRef]
- Li, W.; Zhang, H.; Luo, T.; Wu, W.; Jiang, L.; Zhong, Z.; Jiang, Y.; Fu, Y.; Cai, G. Influence of micro pore structure of shale reservoir on shale gas occurrence in western Chongqing. Nat. Gas Geosci. 2022, 33, 873–885. [Google Scholar] [CrossRef]
- He, X.; Zhang, P.; Ren, J.; Wang, W.; Lu, B. Exploration and development practice of normal pressure shale gas in Dongsheng structural belt, Nanchuan area, southeast Chongqing. Pet. Geol. Exp. 2023, 45, 1057–1066. [Google Scholar] [CrossRef]
- Fang, D. Enrichment mechanism and evaluation indicators of normal pressure shale gas in the complex structural area of southeastern Chongqing. Pet. Geol. Exp. 2025, 47, 720–730. [Google Scholar] [CrossRef]
- Yi, J.; Bao, H.; Zheng, A.; Zhang, B.; Shu, Z.; Li, J.; Wang, C. Main factors controlling marine shale gas enrichment and high-yield wells in South China: A case study of the Fuling shale gas field. Mar. Pet. Geol. 2019, 103, 114–125. [Google Scholar] [CrossRef]
- Wang, K.; Wang, Y.; Wang, F.; Xie, L. Formation conditions and the main controlling factors for the enrichment of shale gas of Shanxi Formation in the southeast of Ordos Basin, China. J. Nat. Gas Geosci. 2023, 8, 49–62. [Google Scholar] [CrossRef]
- Chen, Y.-Y.; Tao, S.-Z.; Wu, W.; Liu, X.-B.; Song, C.-P.; Liu, Z.-D.; Liu, Q.-Y.; Wei, L.; Gao, J.-R.; Chen, Y. The occurrence, origin, and enrichment of helium in the Wufeng-Longmaxi shale gas in the Sichuan Basin, China. Pet. Sci. 2025, 22, 3119–3132. [Google Scholar] [CrossRef]
- He, G.; Sun, B.; Gao, Y.; Zhang, P.; Zhang, Z.; Cai, X.; Xia, W. Main factors controlling unconventional gas enrichment and high production in the first member of Permian Maokou Formation, southeastern Sichuan Basin, SW China. Pet. Explor. Dev. 2025, 52, 408–421. [Google Scholar] [CrossRef]
Disclaimer/Publisher’s Note: The statements, opinions and data contained in all publications are solely those of the individual author(s) and contributor(s) and not of MDPI and/or the editor(s). MDPI and/or the editor(s) disclaim responsibility for any injury to people or property resulting from any ideas, methods, instructions or products referred to in the content. |
© 2025 by the authors. Licensee MDPI, Basel, Switzerland. This article is an open access article distributed under the terms and conditions of the Creative Commons Attribution (CC BY) license (https://creativecommons.org/licenses/by/4.0/).