Article

Optimization of Cement-Slag-Based Stabilizer Proportions and Macro-Micro Properties Research of Solidified Soil


1
Department of Geotechnical Engineering, College of Civil Engineering, Tongji University, Shanghai 200092, China
2
School of Business Administration, Shanghai Lixin University of Accounting and Finance, Shanghai 201620, China
3
Greenland Group Infrastructure Co., Ltd., Shanghai 200010, China
*
Authors to whom correspondence should be addressed.
Processes 2025, 13(12), 3855; https://doi.org/10.3390/pr13123855
Submission received: 31 October 2025 / Revised: 25 November 2025 / Accepted: 27 November 2025 / Published: 28 November 2025

Abstract

In response to the high energy consumption and large carbon emissions of traditional cement materials, this paper takes slag micro-powder as the main raw material, supplemented by cement and gypsum, and uses the D-optimal mixture design method to optimize the mix ratio. It systematically studies the solidification performance of slag-based cementitious materials on Guangzhou silt. Through unconfined compressive strength and fluidity tests, the optimal main material ratio is determined to be m(slag):m(cement):m(gypsum) = 57:30:13, and 4% sodium silicate is selected as the activator. Microstructure analysis shows that this system can effectively promote the formation of C-S-H gel and ettringite, significantly improving the compactness and cementation performance of the soil. The study also shows that this material outperforms traditional cement in terms of strength, environmental friendliness, and economy, and has good engineering application prospects.

1. Introduction

With the swift advancement in tunneling and foundation engineering, there is a growing need for cementitious materials that exhibit rapid setting, quick hardening, and high early-strength performance. Currently, cement remains the most commonly used reinforcing agent; however, it suffers from drawbacks such as slow strength development, high production costs, and an energy-intensive manufacturing process associated with significant carbon emissions [1,2,3,4]. These limitations make it less suitable for applications requiring early structural performance, while also contributing to serious environmental challenges. Meanwhile, silt, characterized by high water content, high compressibility, and low shear strength, is widely distributed in coastal areas such as the Pearl River Delta of China. Its poor engineering properties pose significant challenges to foundation construction and underground engineering [5]. Traditional silt solidification mainly relies on Portland cement, which achieves soil stabilization through hydration reactions producing C-S-H gel and Ca(OH)2(CH) [6]. However, as mentioned earlier, cement production has high energy consumption and carbon emissions, and its solidification effect on high-water-content silt is limited—often resulting in low early strength and poor durability [7].
Meanwhile, the total amount of industrial solid waste stockpiled in China has exceeded 60 billion tons, with a huge annual growth rate. The resource utilization of these wastes is extremely urgent. Driven by the “dual carbon” strategic goals, alternative solidification technologies have been developed, including lime solidification, fly ash solidification, and industrial solid waste-based solidification [8,9,10,11]. Lime solidification improves soil properties by reacting with clay minerals to form pozzolanic products, but it suffers from slow strength development and high shrinkage cracking risk [12]. Fly ash, as a pozzolanic material, can partially replace cement, but its low early activity requires long curing periods [13]. Industrial solid waste-based solidification, such as using slag, red mud, or tailings, has become a research hotspot due to its environmental and economic advantages. For example, Jawad et al. [14] used waste materials such as fly ash, glass powder, and microsilica to replace part of the cement, and the early and late strength of the admixture they prepared were both superior to that of the pure cement system. Wang et al. [15] confirmed that red mud can be used to solidify heavy metal-contaminated soil and effectively enhance the soil strength. Li et al. used red mud-fly ash composite to solidify Hangzhou silt, improving the 28-day UCS by 30% compared to cement, but the high alkalinity of red mud may cause secondary environmental pollution [16]. Therefore, developing a low-carbon, high-efficiency, and environmentally friendly solidifier for high-water-content silt is urgent.
Among numerous industrial solid byproducts, blast furnace slag has garnered considerable interest owing to its high levels of reactive constituents like CaO and SiO2 [17]. Nevertheless, the inherent hydration process of slag is relatively sluggish, necessitating the use of alkaline activators to unlock its latent cementitious properties. Research indicates that alkali-activated slag can achieve soil stabilization performance on par with traditional Portland cement [18]. Furthermore, when combined with cement, slag exhibits a synergistic interaction: the alkaline conditions generated during cement hydration promote the pozzolanic reaction of slag, while slag in turn reduces the amount of Ca(OH)2 formed during cement hydration, thereby enhancing long-term strength development [19,20,21]. Cementitious materials based on slag, activated with chemicals such as NaOH, Na2SiO3, and Na2SO4, have exhibited remarkable compressive strength and durability [22]. Yoo et al. pointed out that alkali-activated slag can produce a large amount of C-(A)-S-H gel, which has better mechanical properties and durability than cement-based materials [23]. Papayianni et al. [24] reported that concrete incorporating slag-cement blended binders displays favorable early strength gain. From a life cycle standpoint, the production of slag generates significantly lower energy demands and carbon emissions (approximately 0.07 t CO2 per ton) compared to cement manufacturing [25], highlighting its substantial environmental benefits.
To summarize, utilizing slag as a composite cementitious material enhanced with alkaline activators not only effectively minimizes solid waste and lowers cement consumption but also enhances the mechanical performance and microstructural characteristics of stabilized soil. However, existing research still has several research gaps to be addressed:
(1)
Most experimental designs rely on a single factor and lack systematic optimization based on statistical experimental design methods.
(2)
The correlation between the long-term microstructural evolution and macroscopic mechanical properties of slag-based material-solidified silt is insufficiently analyzed.
(3)
Quantitative evaluations of the comprehensive benefits (environmental and economic) of slag-based solidifiers are limited.
In view of the above deficiencies, this study primarily employs slag as a key raw material and applies the D-optimal mixture design approach to optimize its blending ratio with cement and gypsum. The optimal formulation is established by evaluating critical performance indices, specifically unconfined compressive strength (UCS) and flowability. Subsequently, X-ray diffraction (XRD) and scanning electron microscopy (SEM) are employed to investigate the microstructure and hydration mechanisms. Furthermore, a systematic assessment of the environmental advantages and cost-effectiveness of the developed binder is conducted, aiming to establish a theoretical foundation for advancing and applying eco-friendly geotechnical engineering materials.

2. Experimental Materials and Methods

2.1. Experimental Materials

The soil samples used in the experiment were from the silt in Nansha, Guangzhou. The basic parameters of the silt are shown in Table 1.
By comprehensively considering factors such as curing effect, material properties, and production cost, the experiment selected ground granulated blast furnace slag (GGBS) (Baixin New Materials Technology Co., Ltd., Henan, China), gypsum (GY) (Baixin New Materials Technology Co., Ltd., Henan, China), and cement (Baixin New Materials Technology Co., Ltd., Henan, China) as the main curing agents. Industrial-grade NaOH (Tongyang E-commerce Co., Ltd., Anhui, China), Na2SO4 (Tongyang E-commerce Co., Ltd., Anhui, China), and sodium silicate with a modulus of 2.0 (SS) (Nonglele E-commerce Co., Ltd., Guangzhou, China) were chosen as alkaline activators. The chemical compositions of the main materials were determined by X-ray fluorescence spectrometer (XRF), and the main components are shown in Table 2.
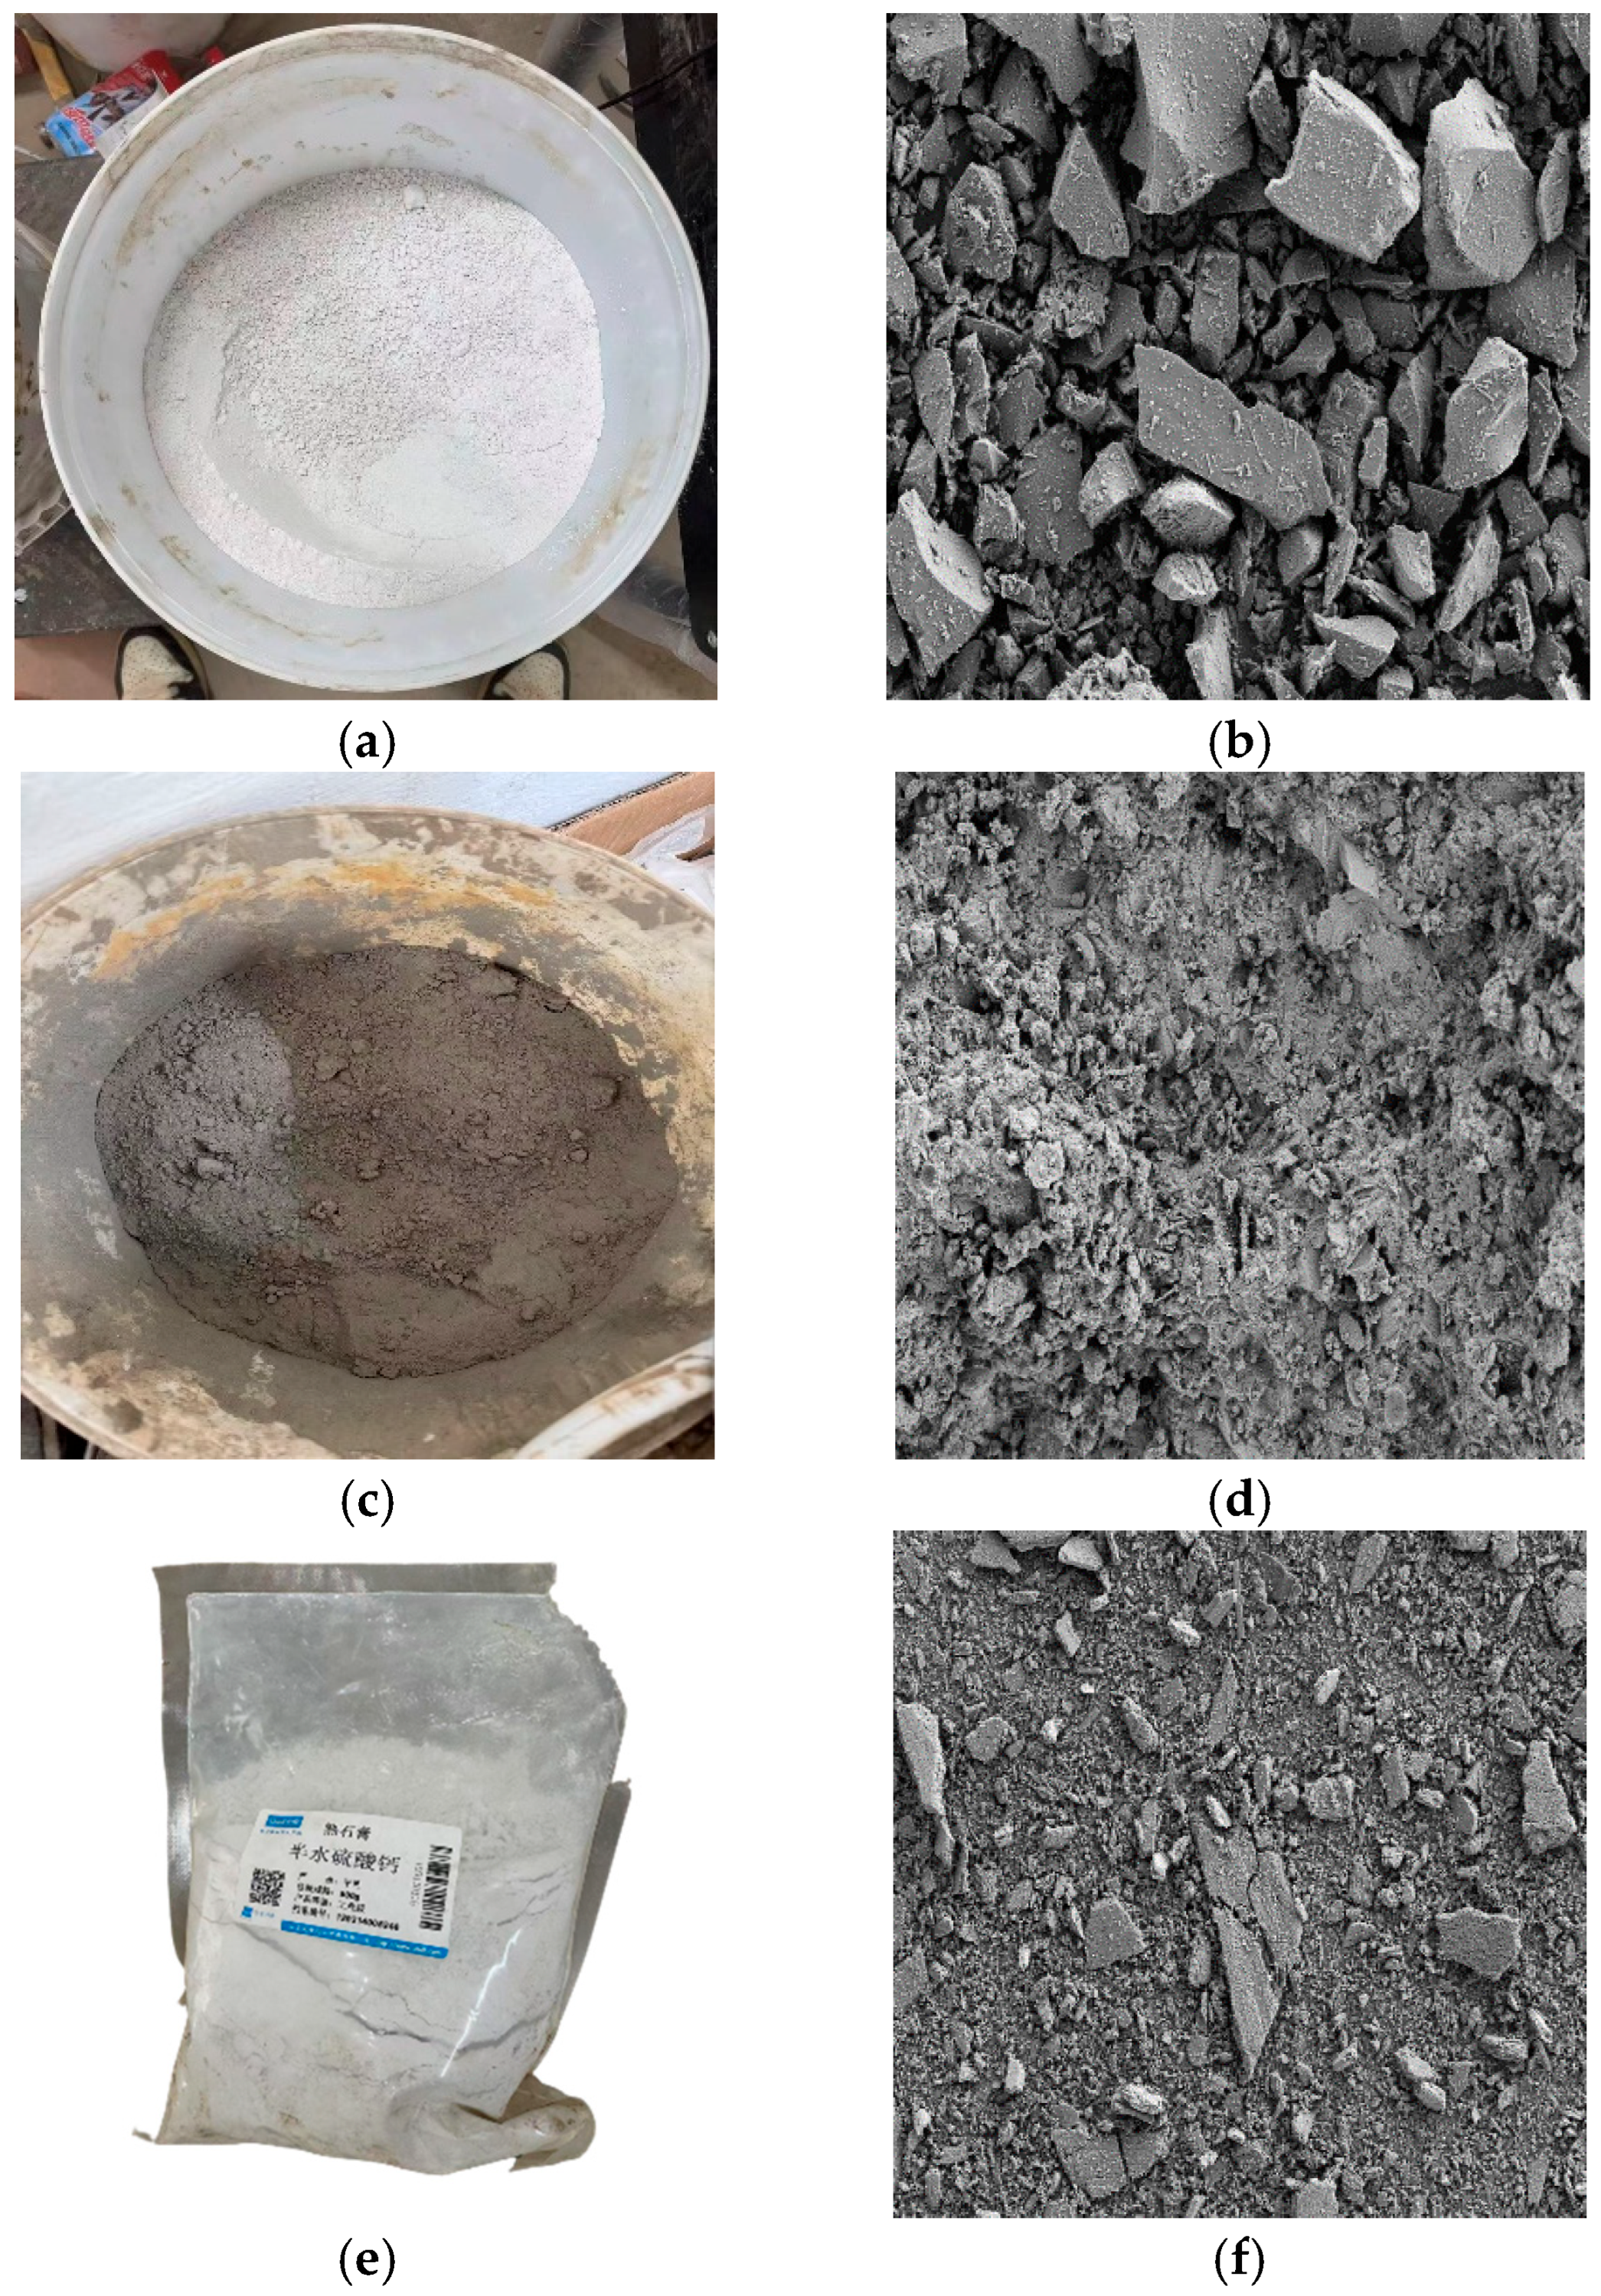
S95 grade slag powder was selected as the blast furnace slag with a specific surface area of 465 m2/kg and a 7-day activity index of 82%. The cement used was P.O42.5 ordinary Portland cement, and industrial grade hemihydrate gypsum was chosen as the gypsum. The primary raw materials and their microstructures are presented in Figure 1. Figure 1b reveals that the slag possesses a vitreous structure, which is readily activated to release reactive components in an alkaline environment. Figure 1d demonstrates that cement particles are angular with a broad particle size distribution—coarse particles serve as the skeletal support, while fine particles hydrate rapidly and provide an alkaline milieu. In Figure 1f, gypsum exhibits a needle-like aggregated morphology, which can dissolve quickly and facilitate the formation of the early-strength skeleton.

2.2. Mix Proportion Design

The mixture experiment was put forward by Scheffe et al. [26]. Its fundamental assumption is that the impact of the proportion of each component on the experimental results is solely related to the relative content and has no bearing on the quantity of the material. Consequently, in mixture design, each component is required to have a value range from 0 to 1, and the sum of all components must equal 1. That is, the quantity of each component is expressed as a percentage. To effectively uncover the relationship between the mix proportion and performance indicators, a combined approach of experimental design and statistical analysis can be employed. Among numerous design methods, D-optimal mixture design can select the experimental subset with the maximum amount of information from all possible mix proportions, thereby maximizing the precision of model parameter estimation. In other words, D-optimal design optimizes the experimental plan by maximizing the determinant of the information matrix, enabling the acquisition of a reliable regression model with a reduced number of experiments.
Based on the above considerations and with the aim of reducing the experimental workload and material costs, this study utilizes D-optimal mixture design to optimize the main material proportion of the curing agent and to investigate the unconfined compressive strength and curing mechanism of industrial waste residue-improved silt. This paper chooses the cubic Scheffe polynomial as the regression model, and its expression is presented as Equation (1):
Y = i = 1 q β i χ i + i < j β i j χ i χ j + i < j δ i j χ i χ j χ i χ j + i < j < k β i j k χ i χ j χ k
In the formula, Y represents the target response, β and δ are model coefficients, xi, xj, and xk are input variables, q is the number of independent variables, and i, j, and k are natural numbers.
The main materials of the cementitious materials in this article are slag, Portland cement, and gypsum, with a total proportion of 100%. According to previous research, when the proportion of cement is less than 15%, the early strength is seriously insufficient, while a high proportion of gypsum will cause the stone body to become brittle. Considering all these factors, the relative proportions of the three main materials were determined [27,28]. The upper and lower limits of the main materials are shown in Table 3. The upper and lower limits of the main materials are shown in Table 3. Based on this, ten sets of orthogonal experiments for slurry mix proportions were designed using the D-optimal mixture design method. The specific mix proportion designs are shown in Table 4. The cementitious material with GGBS, cement, and gypsum as the main materials is named GCG.

2.3. Selection and Design of Activators

Incorporating a suitable quantity of alkali activator into the cementitious system can significantly promote the hydration kinetics of the slurry and substantially improve the mechanical properties of the solidified soil. Referring to the relevant literature [18,22,24] to investigate how different alkali activators influence stabilization effectiveness, this study carries out experiments using individual additions of NaOH, Na2SO4, or sodium silicate, as well as a combined addition of NaOH and Na2SO4. The dosage of all activators is based on the total mass of the cementitious materials and is expressed as a mass percentage. The specific proportions of these activators are detailed in Table 5. Through comparative analysis of the strength characteristics of solidified soil under various activator types and dosages, this research aims to evaluate the performance of each activator and ultimately identify the optimal combination in terms of overall effectiveness.

2.4. Sample Preparation Method

Due to the loose texture and uneven moisture content of the silt, it is not suitable for direct use in solidification, which may lead to significant dispersion. Therefore, the soil samples need to be pre-treated. The specific method is to air-dry the silt from Nansha, Guangzhou, to obtain dry soil, and then crush and sieve it through a 2 mm screen to obtain the dry soil samples for the experiment. For the solidification slurry, its working performance is mainly reflected in mechanical properties and flowability. Therefore, in this study, the influence of various factors on the working performance of the solidified soil slurry in the mineral–silt composite slurry system formed by the combination of cementitious materials and silt was investigated using UCS and flowability tests.
The fluidity of the solidified soil slurry is evaluated following the procedures outlined in “Test Methods for Homogeneity of Concrete Admixtures” GB/T 8077-2023 [29]. A glass plate measuring 400 mm × 400 mm × 5 mm is positioned horizontally and cleaned with a moist cloth. The thoroughly mixed slurry is promptly poured into a truncated cone mold, filled completely, and smoothed off using a straightedge. The mold is then carefully lifted vertically from the glass surface while simultaneously initiating the timer. After 30 s, the maximum spread diameters of the slurry in two perpendicular directions are measured using a ruler; these values are taken as indicators of the slurry’s fluidity.
The unconfined compressive strength test was carried out in accordance with the provisions of the “Standard for Geotechnical Test Methods” (GB/T50123-2019) [30]. The test was conducted using a WCW microcomputer-controlled electronic universal testing machine. Strain gauges are affixed at the midpoint on two opposite sides of each specimen, which is then centered on the loading platen. Real-time strain data is captured via a data acquisition system connected to a computer. The test is conducted under displacement control mode with a loading rate set at 0.6 mm/min. Loading continues until the specimen fails and reaches the post-peak residual deformation stage. This procedure is replicated for all specimens to carry out complete uniaxial compression tests. Subsequently, the collected data is processed and combined to generate the full stress–strain curves representing the entire compression process.
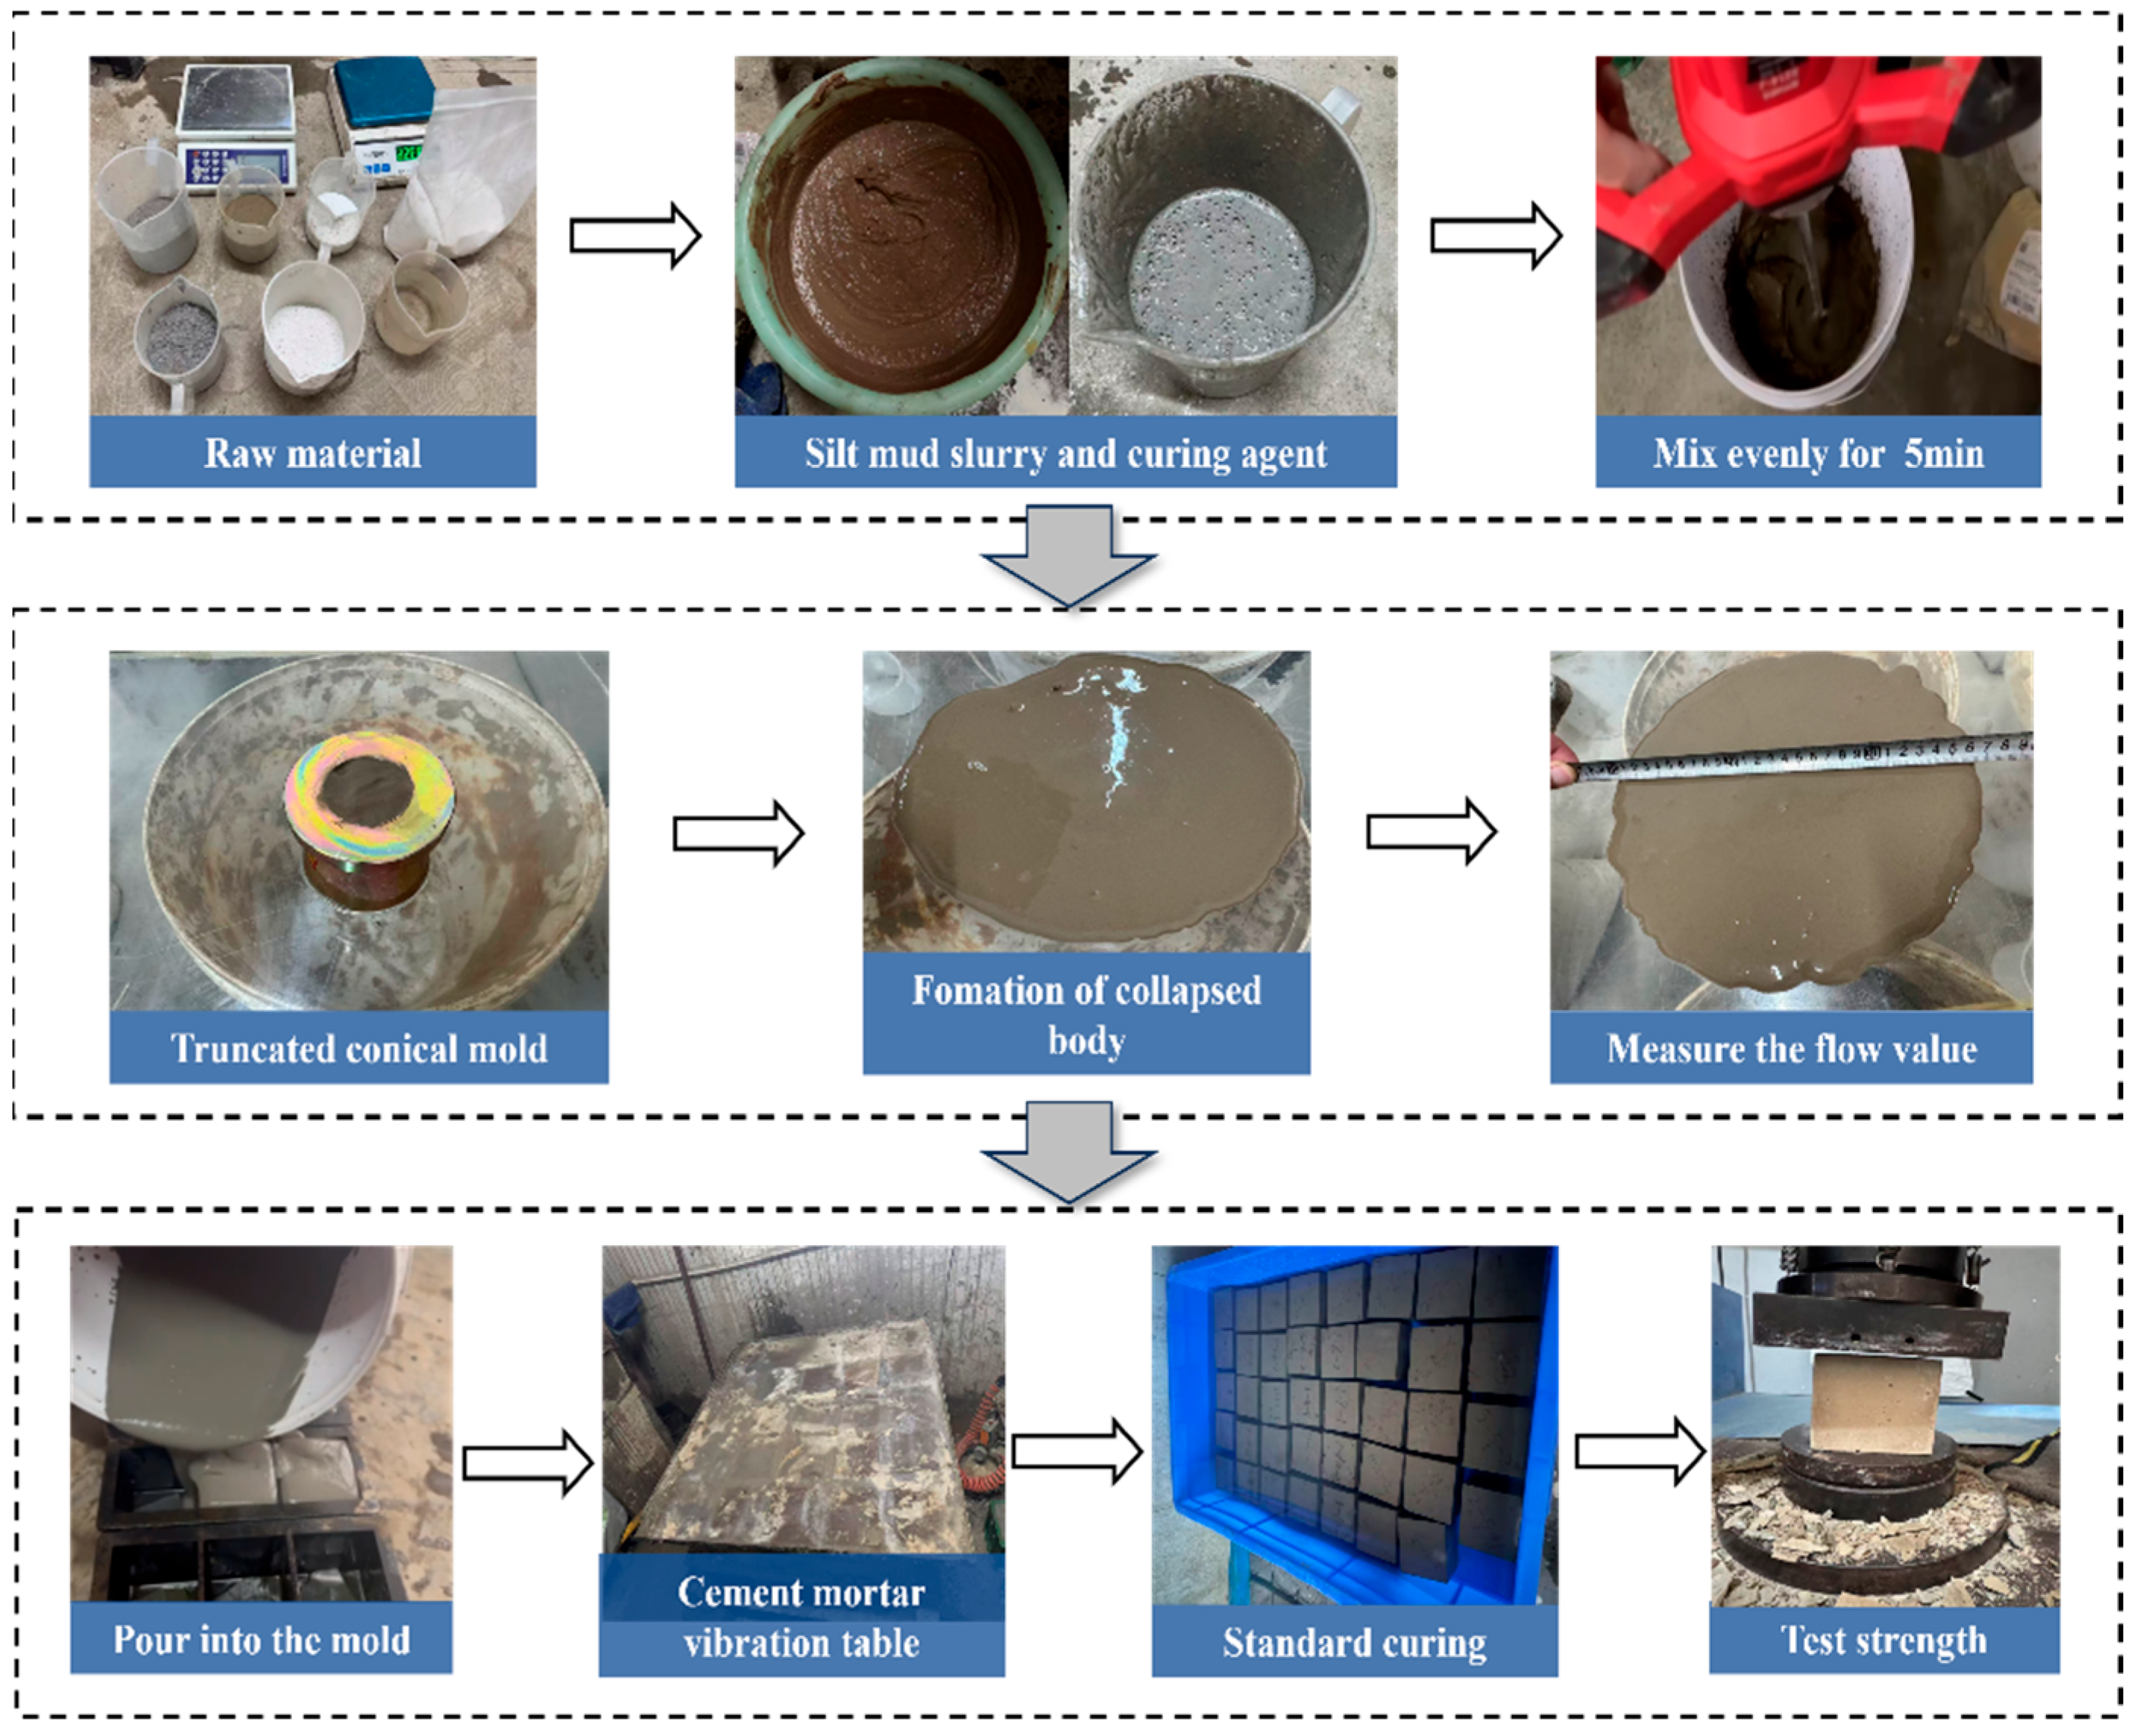
The experimental process of this study is shown in Figure 2. The specific experimental steps are as follows:
(1)
Weigh a certain amount of dry soil and mix it with water to prepare a fluid soil with a fixed moisture content of 55%. Then, according to the mix ratio, add the curing agent with a water-binder ratio of 0.8 at a dosage of 15% to the fluid soil. Stir thoroughly with a mixer until uniform and the curing soil slurry is obtained.
(2)
Pour the prepared curing soil slurry quickly into the conical mold, fill it up and level it. Then, slowly and vertically lift the mold to allow the slurry to flow freely on the glass plate. After standing for 30 s, measure the flow of the slurry with a tape measure. Repeat the test three times for each group and take the average value as the flow degree.
(3)
Apply Vaseline evenly in the three-cell mold with a side length of 70.7 mm. Place the mold on the cement mortar vibrating table and vibrate for 5 min to eliminate the internal pores and air bubbles in the slurry. After filling, seal the mold with plastic film. Prepare three parallel samples for each working condition.
(4)
After 24 h of sample preparation, demold the samples and place them in a standard curing room (temperature 20 °C, relative humidity greater than 99%) for curing. After curing to the target age, take out the samples and conduct the unconfined compressive strength test. Take the average value of the test results of three parallel samples for each working condition as the final strength value.
Figure 2. Test flowchart.
Processes 13 03855 g002

2.5. X-Ray Diffraction

X-ray diffraction (XRD) is a widely employed technique for the qualitative assessment of mineral phases. By comparing the mineralogical profiles of soil specimens containing varying proportions of additive with that of the untreated soil, changes in mineral composition resulting from curing agent treatment can be effectively visualized and evaluated. In this study, XRD analysis was performed using a PW3040/60 X-ray powder diffractometer manufactured by PANalytical (Almelo, The Netherlands). The experimental conditions included a tube voltage of 40 kV, a tube current of 40 mA, a maximum power output of 3 kW, a 2θ angular range from 10° to 80°, and a scanning rate of 7° per minute.

2.6. Scanning Electron Microscopy

Scanning electron microscopy (SEM) was employed to analyze the pore structure and microstructural features of the cured soil. A Zeiss Gemini 300 (Oberkochen, Germany) field emission scanning electron microscope was utilized to examine the microscopic morphology of the solidified specimens. The procedure involved drying the sample and cutting it into approximately 5 mm pieces using a scalpel. Conductive adhesive was applied onto a copper stub, and the sample was securely mounted onto this adhesive. The stub, with the attached sample, was then placed in a sputter coater for gold coating. Following metallization, the sample was transferred into the SEM chamber for vacuum stabilization. Micrographs of the hydration products were subsequently captured under high vacuum conditions to assess their morphological characteristics.

3. Optimization of Proportions and Analysis of Slag-Based Cementitious Materials

The experimental data in Table 6 demonstrate the fluidity properties of the slurries and the mechanical strengths of their solidified bodies under different mix ratios. To optimize the material properties, a systematic analysis of the mix proportions of the slag-based cementitious materials is hereby carried out in accordance with these results.

3.1. Optimization of Main Material Proportions and Interaction Analysis

3.1.1. Variance Analysis of UCS for Main Materials

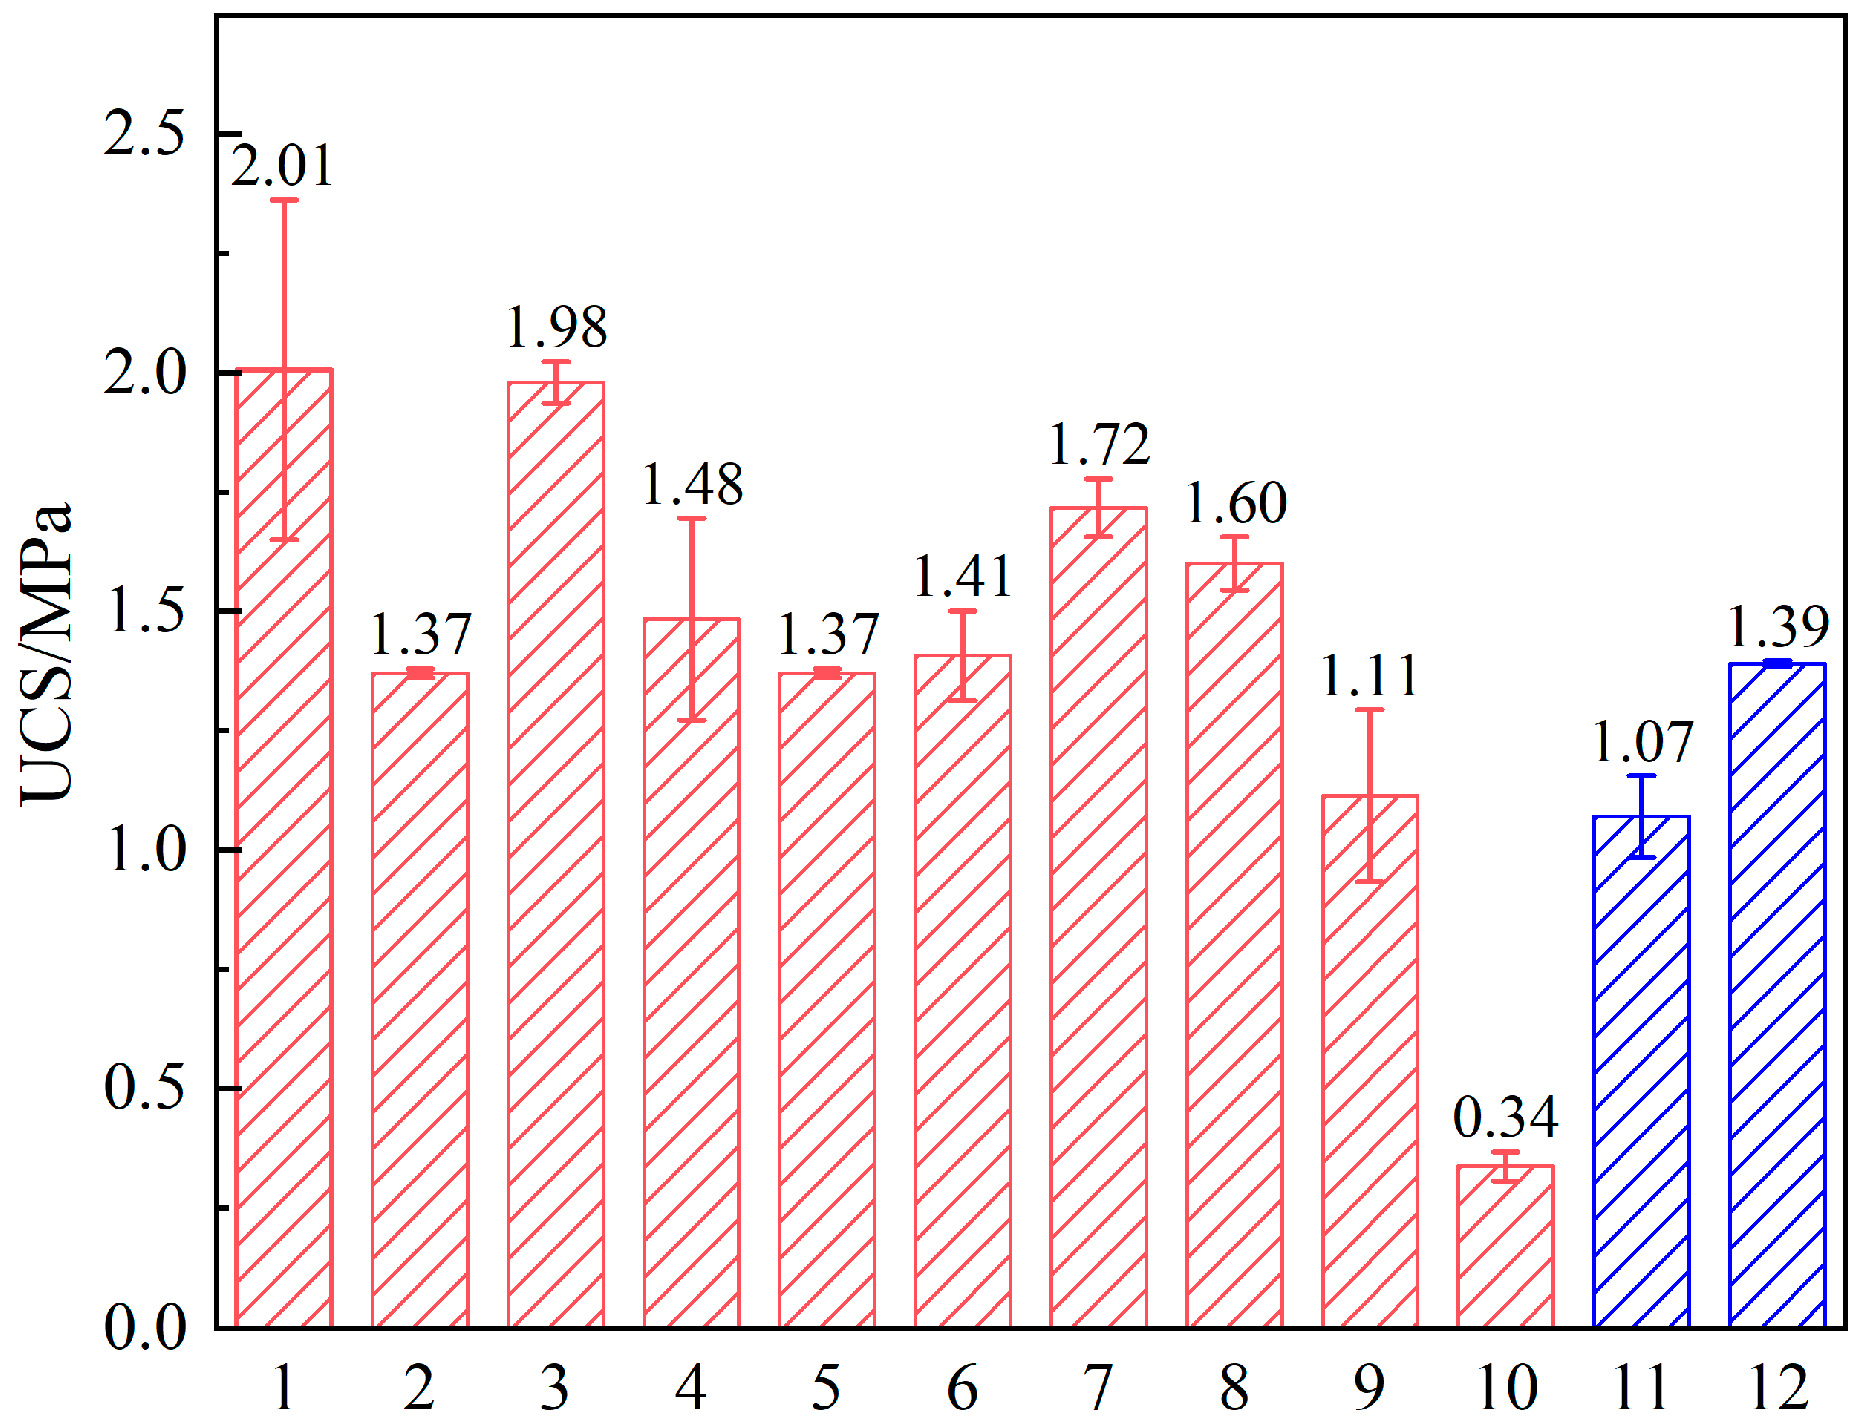
To visually assess the solidification effect of the silt, two pure cement groups with dosages of 15% and 20%, respectively, were set up as controls, and a total of twelve mix tests were carried out. For comparative assessment of the solidification performance, two additional control groups consisting of pure cement were prepared with dosages of 15% and 20%, resulting in a total of 12 mixture formulations. UCS tests were conducted on all samples after 28 days of curing to evaluate their strength, with results presented in Figure 3. The data revealed considerable variation in the strength of slag-based solidified soils across different mixtures, yielding UCS values between 0.34 MPa and 2.01 MPa. In comparison, the pure cement specimens achieved strengths of only 1.07 MPa (at 15% cement content) and 1.39 MPa (at 20% cement content). This indicates that, under the given experimental conditions, the treated soil can attain a strength level 1.2 to 2 times higher than that of conventional cement-solidified soil, highlighting its superior stabilization and reinforcement capability for silt. To assess the statistical validity of the derived regression model, an analysis of variance (ANOVA) was performed to examine the significance of the independent variables relative to the response. The ANOVA outcomes for the cubic model predicting the 28-day UCS of the slag-based solidified soil are summarized in Table 7.
In this study, Equation (1) was used as the general form of a cubic Scheffe polynomial to connect the mass fractions of GGBS, cement, and gypsum with the target response Y. Specifically, the three independent variables X1, X2, and X3 represent the standardized mass fractions of GGBS, cement, and gypsum, respectively. Y represents the 28-day UCS of the solidified soil or the flow diffusion volume of the slurry. Under a confidence level of α = 0.05, the significance of individual parameters and their interactions can be determined by the variance ratio F and the probability value p. The variance ratio F is used to measure the “intensity of influence”, with a larger F value indicating a stronger influence of the factor. The probability value p is used to measure the “reliability of influence”, and when p > 0.1, it indicates that the model term is not significant. Therefore, by gradually eliminating insignificant terms, the cubic Scheffe polynomial was fitted to obtain the regression equation for the 28-day UCS of GCG-solidified body:
G C G 28 d =   1.48 X 1 + 4.82 X 2 38.88 X 3 + 65.9 X 1 X 3 + 36.78 X 2 X 3
The model fitting coefficient R2 of GCG28d is 90.82, which is greater than 0.9, indicating that the model can well simulate the relationship between the response and the variables. Based on this regression equation, contour plots and three-dimensional response surfaces can be further drawn to visually analyze the coupled influence of each factor on the strength.

3.1.2. Analysis of the Interaction Between Main Materials and UCS

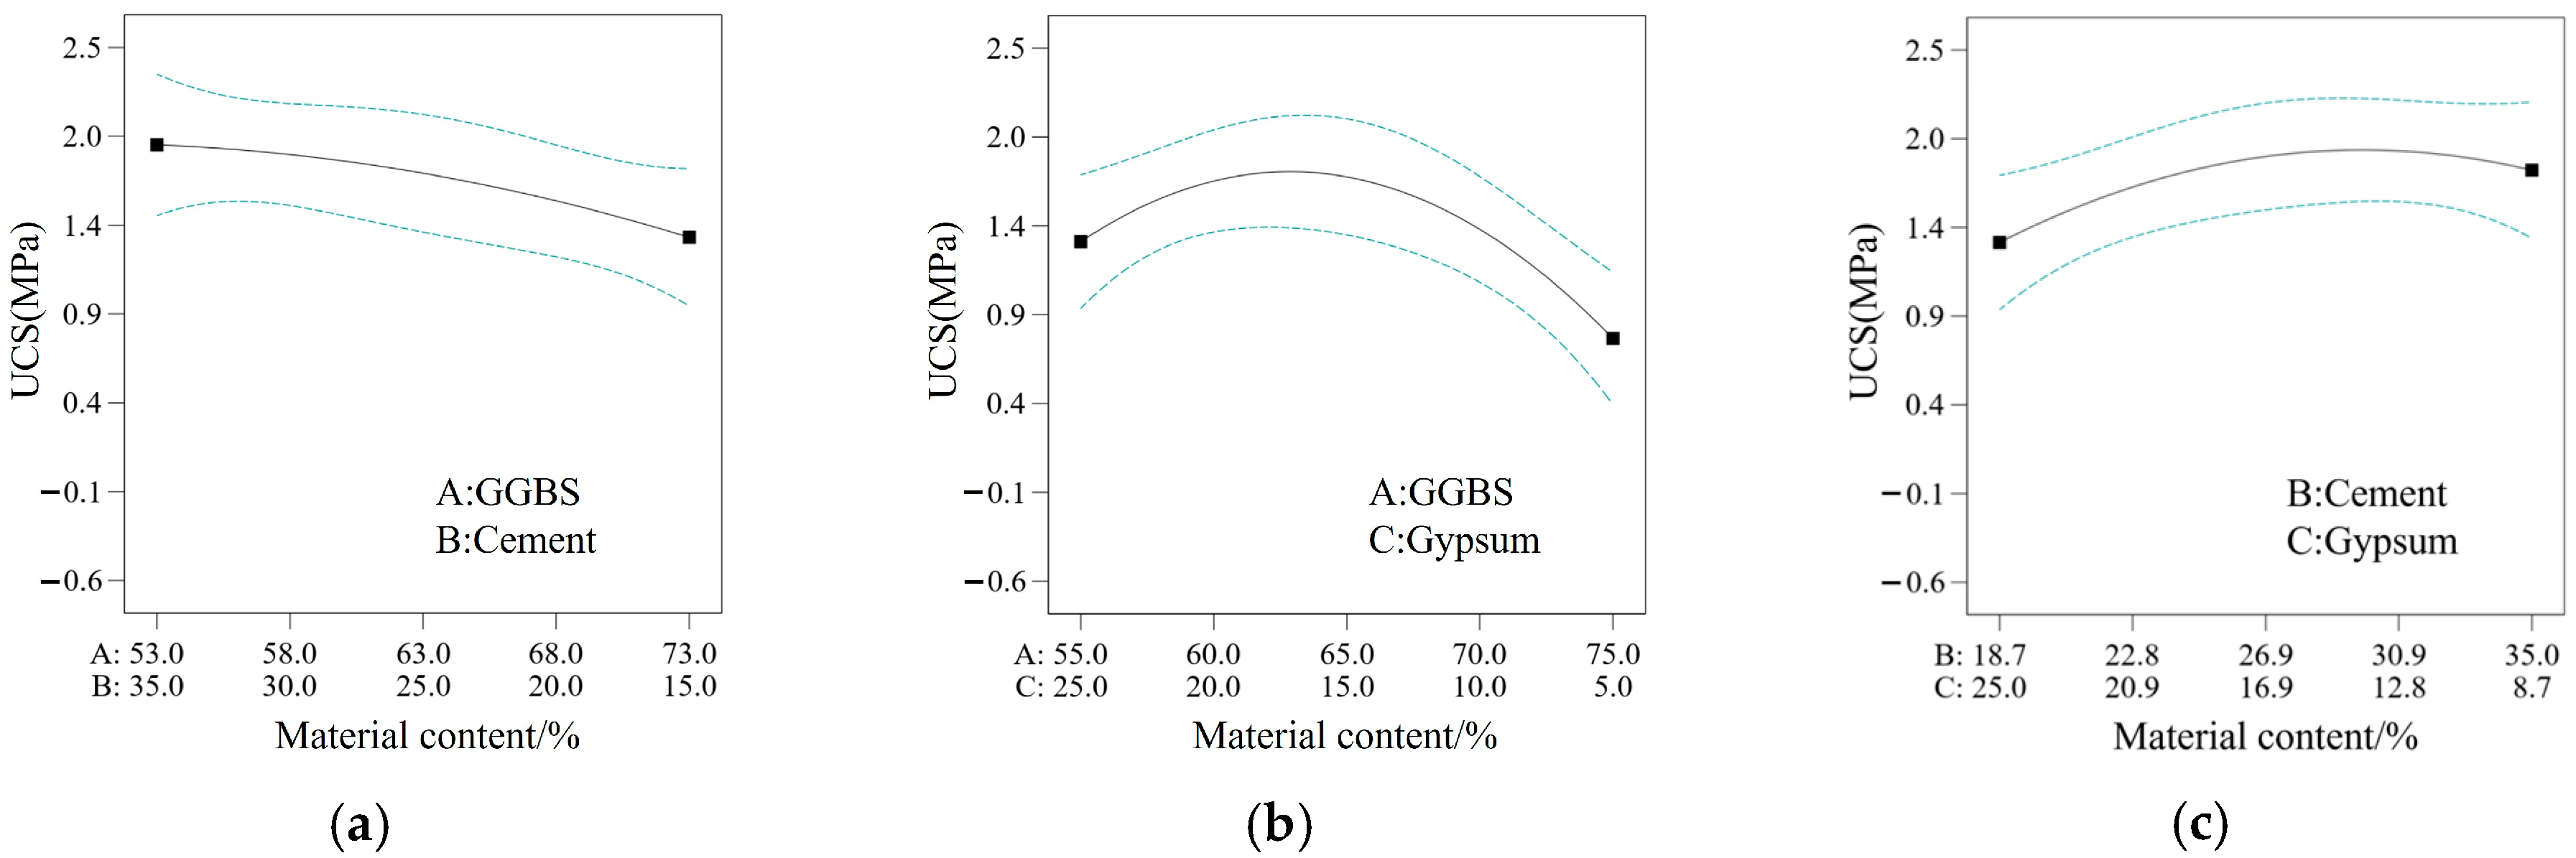
Figure 4 shows the influence law of the binary interaction of the main materials on the UCS based on the response surface analysis. Each curve in the figure represents the trend of UCS changing with the relative proportion of the other two components under the condition that the content of the third component is fixed. As depicted in Figure 4a, under the condition of a fixed gypsum proportion, with the increase in slag dosage, increasing slag content while reducing cement content leads to a decline in strength, suggesting limited synergistic effect between slag and cement within the tested parameters. In Figure 4b, the interaction between GGBS and GY is presented, revealing a nonlinear, arch-like pattern in their influence on UCS. The compressive strength initially rises with higher GY addition but subsequently diminishes, implying an optimal dosage range for GY. Likewise, Figure 4c demonstrates that UCS first increases and then decreases as cement content rises and gypsum content falls, indicating the presence of an ideal cement-to-gypsum proportion for maximizing strength.
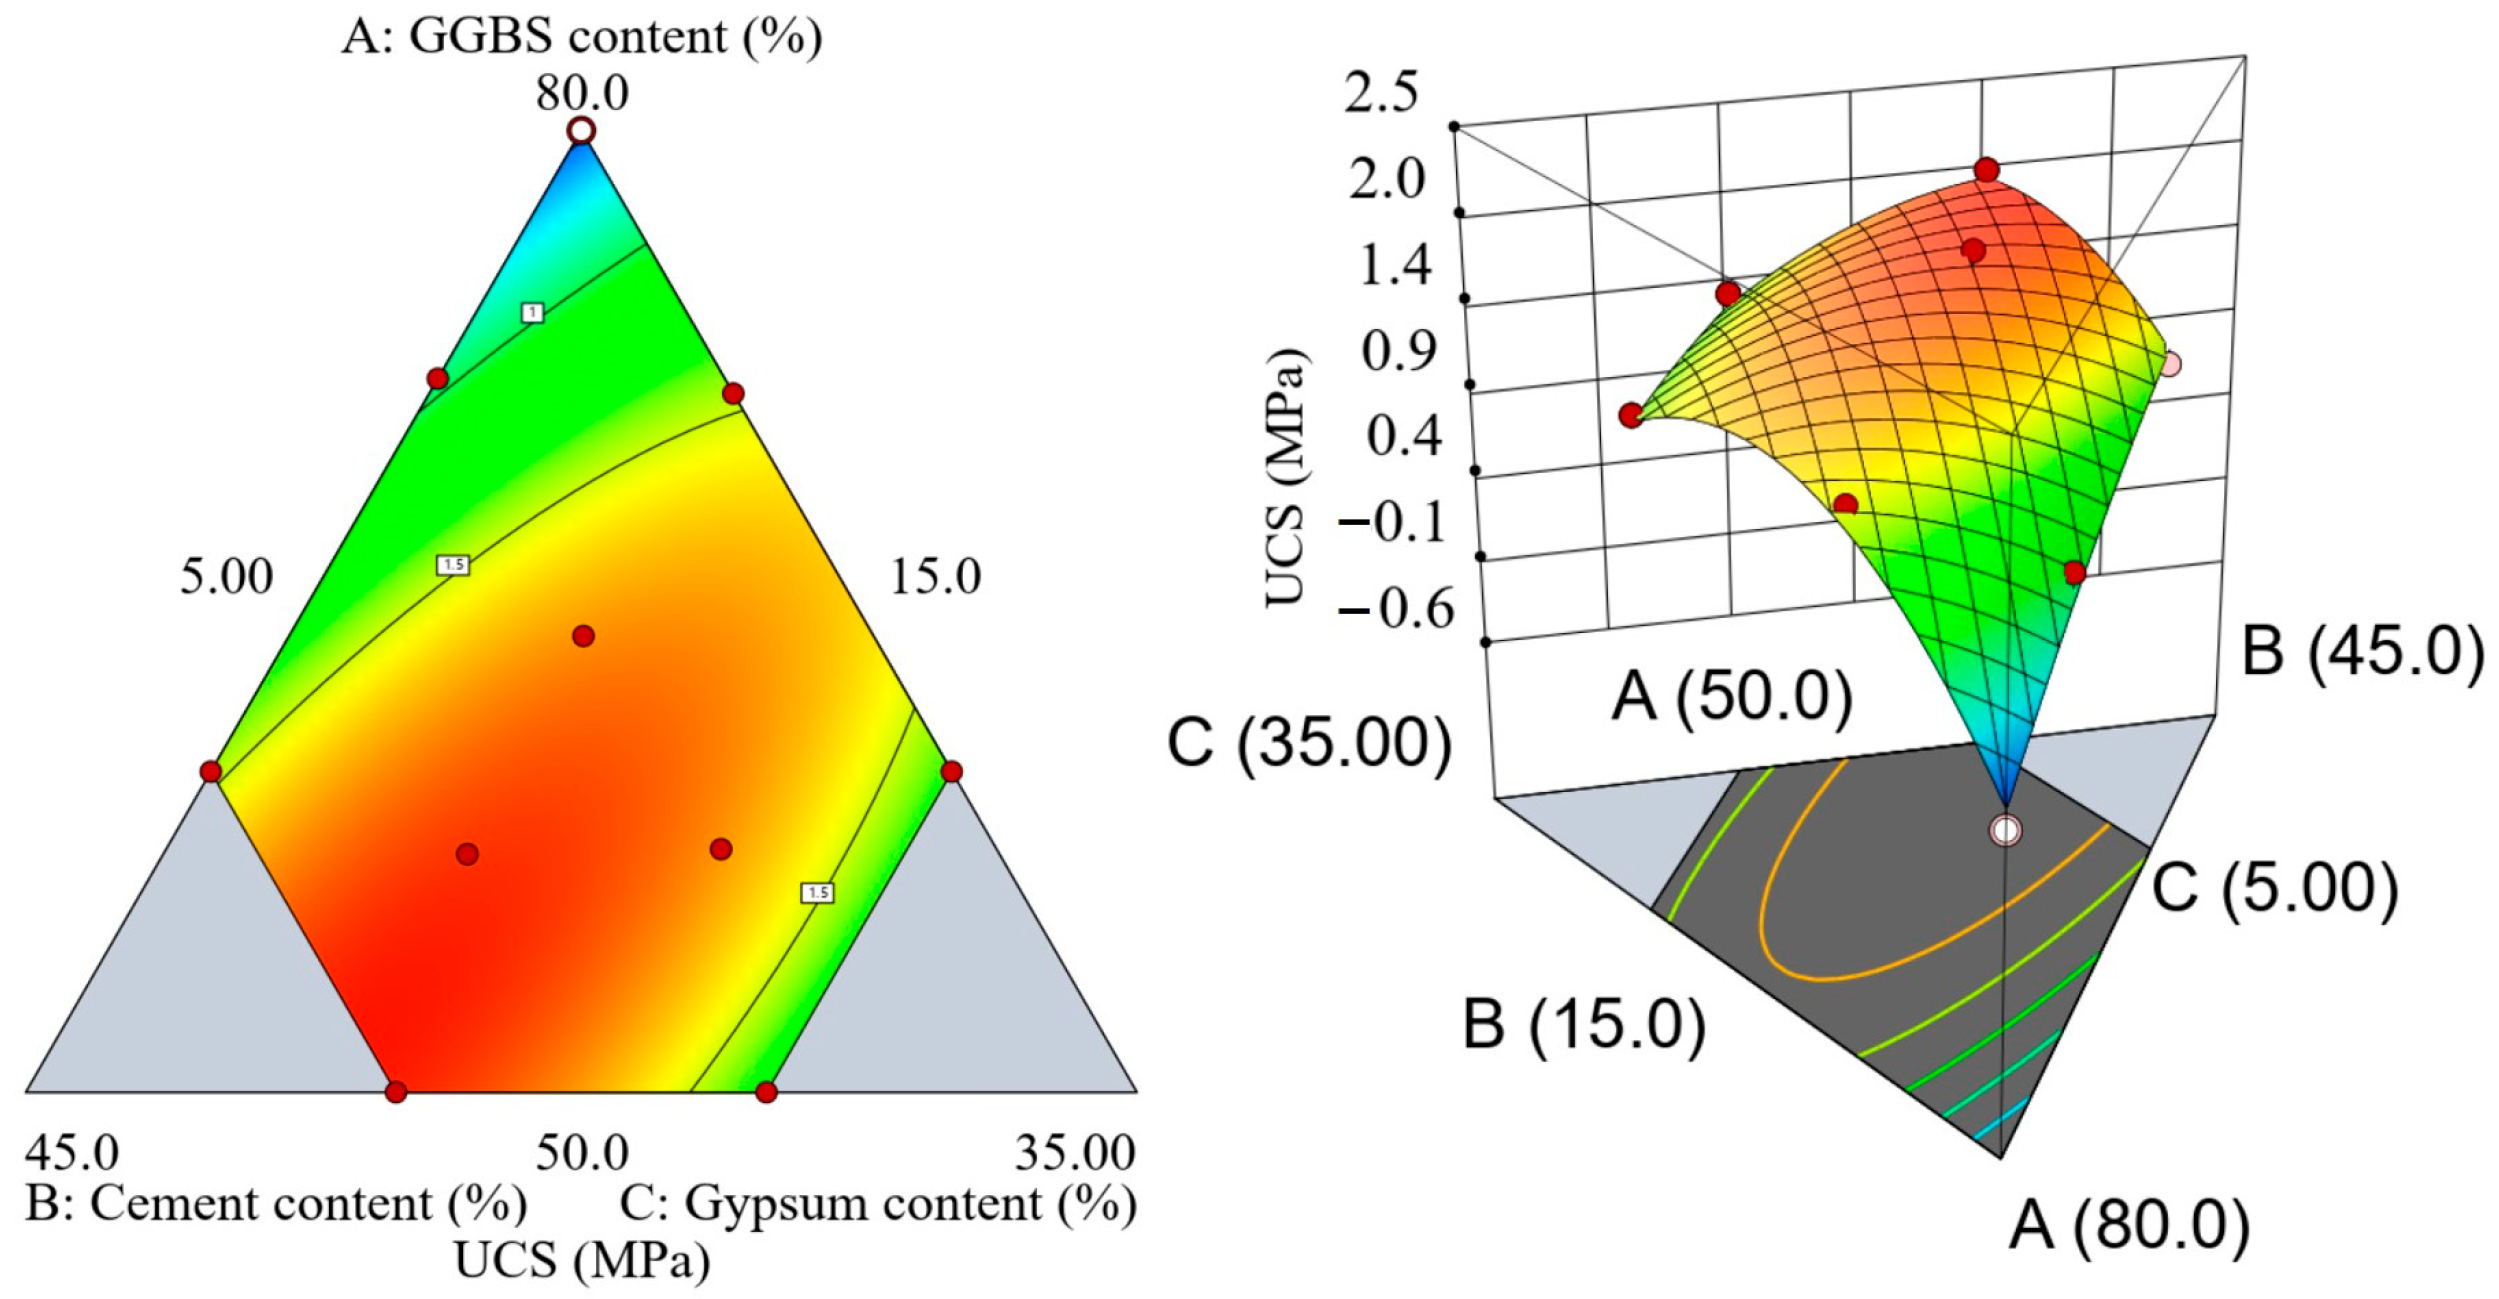
Further, Figure 5 shows the 2D and 3D diagrams of UCS of solidified soil under the interaction of three factors. The warm red–yellow areas in the figure represent high-strength regions, while the cold blue–green areas represent low-strength regions. From Figure 5, it can be seen that the low-strength regions occur in areas with high slag content (>80%) and low cement and gypsum contents. This is because the activity of slag alone is relatively low and it must be combined with gypsum to form strength. When the gypsum content is between 10% and 25%, the compressive strength of solidified soil achieves relatively high values, indicating that within this dosage range, the interaction between gypsum, cement, and slag has a good strengthening effect on the strength of solidified soil. By comparing the interaction diagrams of each component, it can be concluded that each component has an optimal dosage range: slag is 50% to 65%, cement is 15% to 35%, and gypsum is 15% to 25%.

3.2. Interaction Analysis of Main Materials on the Flowability of Solidified Soil Slurry

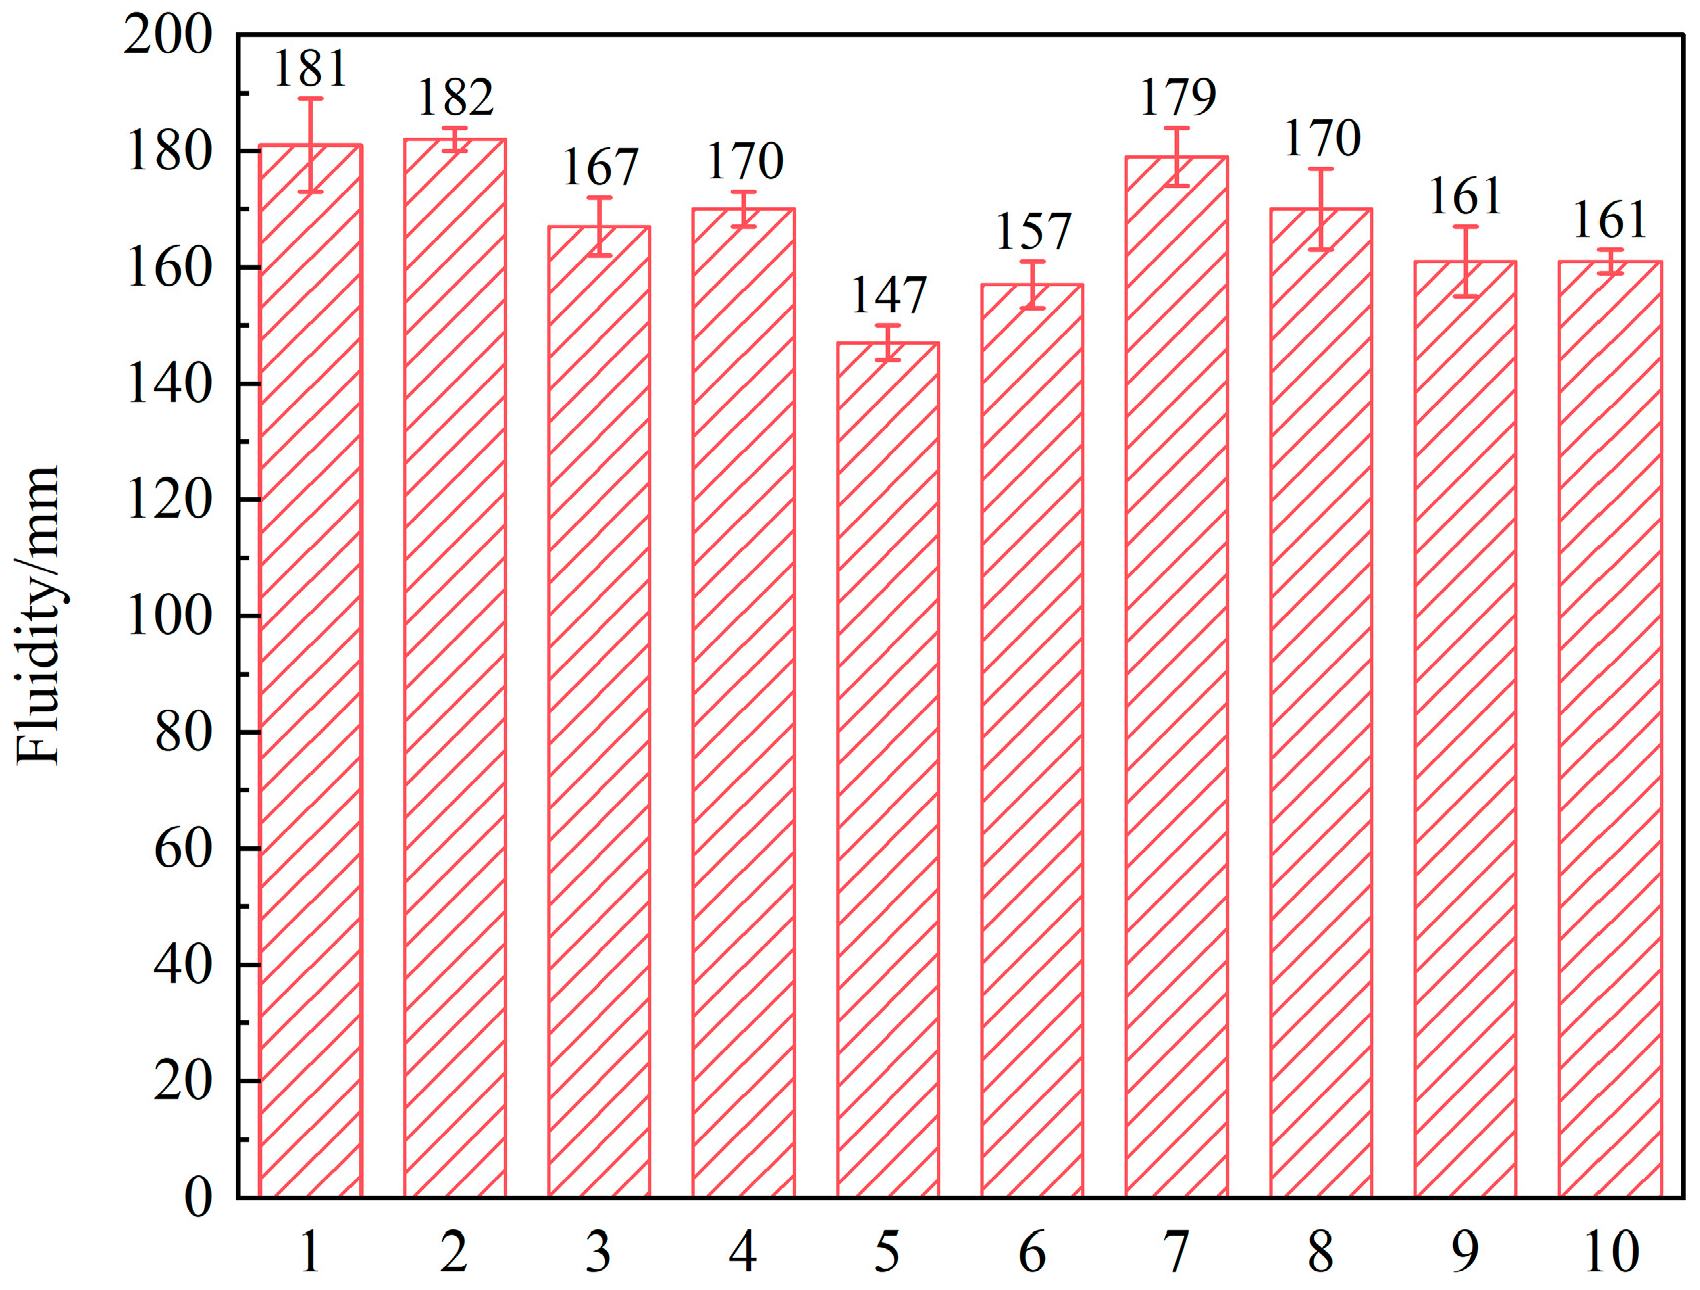
Figure 6 presents the flowability results of the solidified soil slurry from 10 orthogonal tests based on D-optimal mixture design. The flowability of all mix ratios ranges from 147 to 182 mm, all meeting the pumping requirements for fluidized solidified soil backfill.
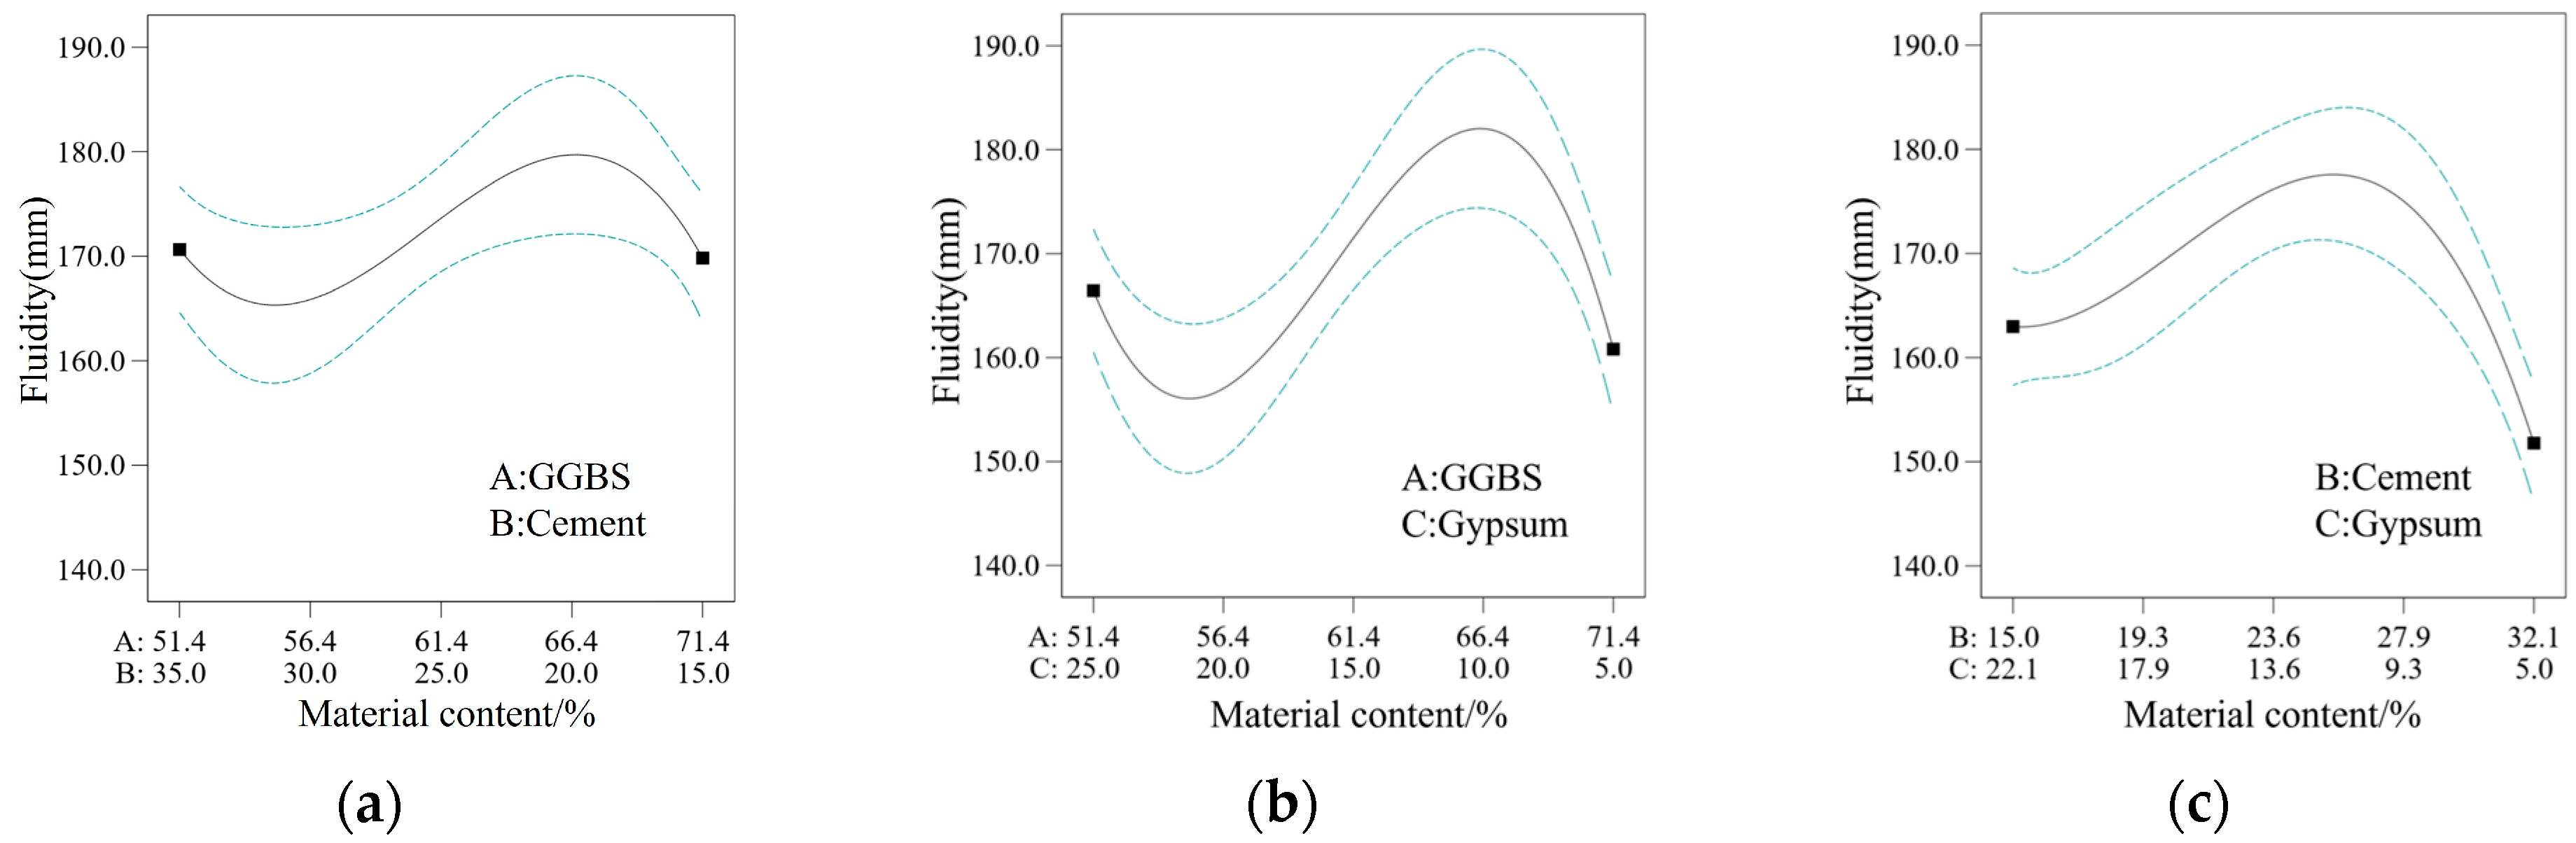
Further analysis of the interaction effects among the components reveals that the flowability of the slurry first decreases and then increases with the increase in the GGBS substitution ratio for cement (Figure 7a), indicating that when the gypsum dosage is fixed, partial substitution of cement with GGBS helps improve the fluidity. Figure 7b shows that the interaction between GGBS and gypsum is significant, with a nonlinear curve that first decreases, then increases, and then decreases again, suggesting that an appropriate amount of gypsum can inhibit the early flocculation of C3A, forming an appropriate amount of ettringite and slag glass microspheres to jointly enhance the fluidity. Too much or too little is unfavorable. Figure 7c further indicates that the flowability first increases and then decreases with the increase in cement dosage and the decrease in gypsum dosage, and the flowability is optimal when the gypsum dosage is between 9% and 13%.
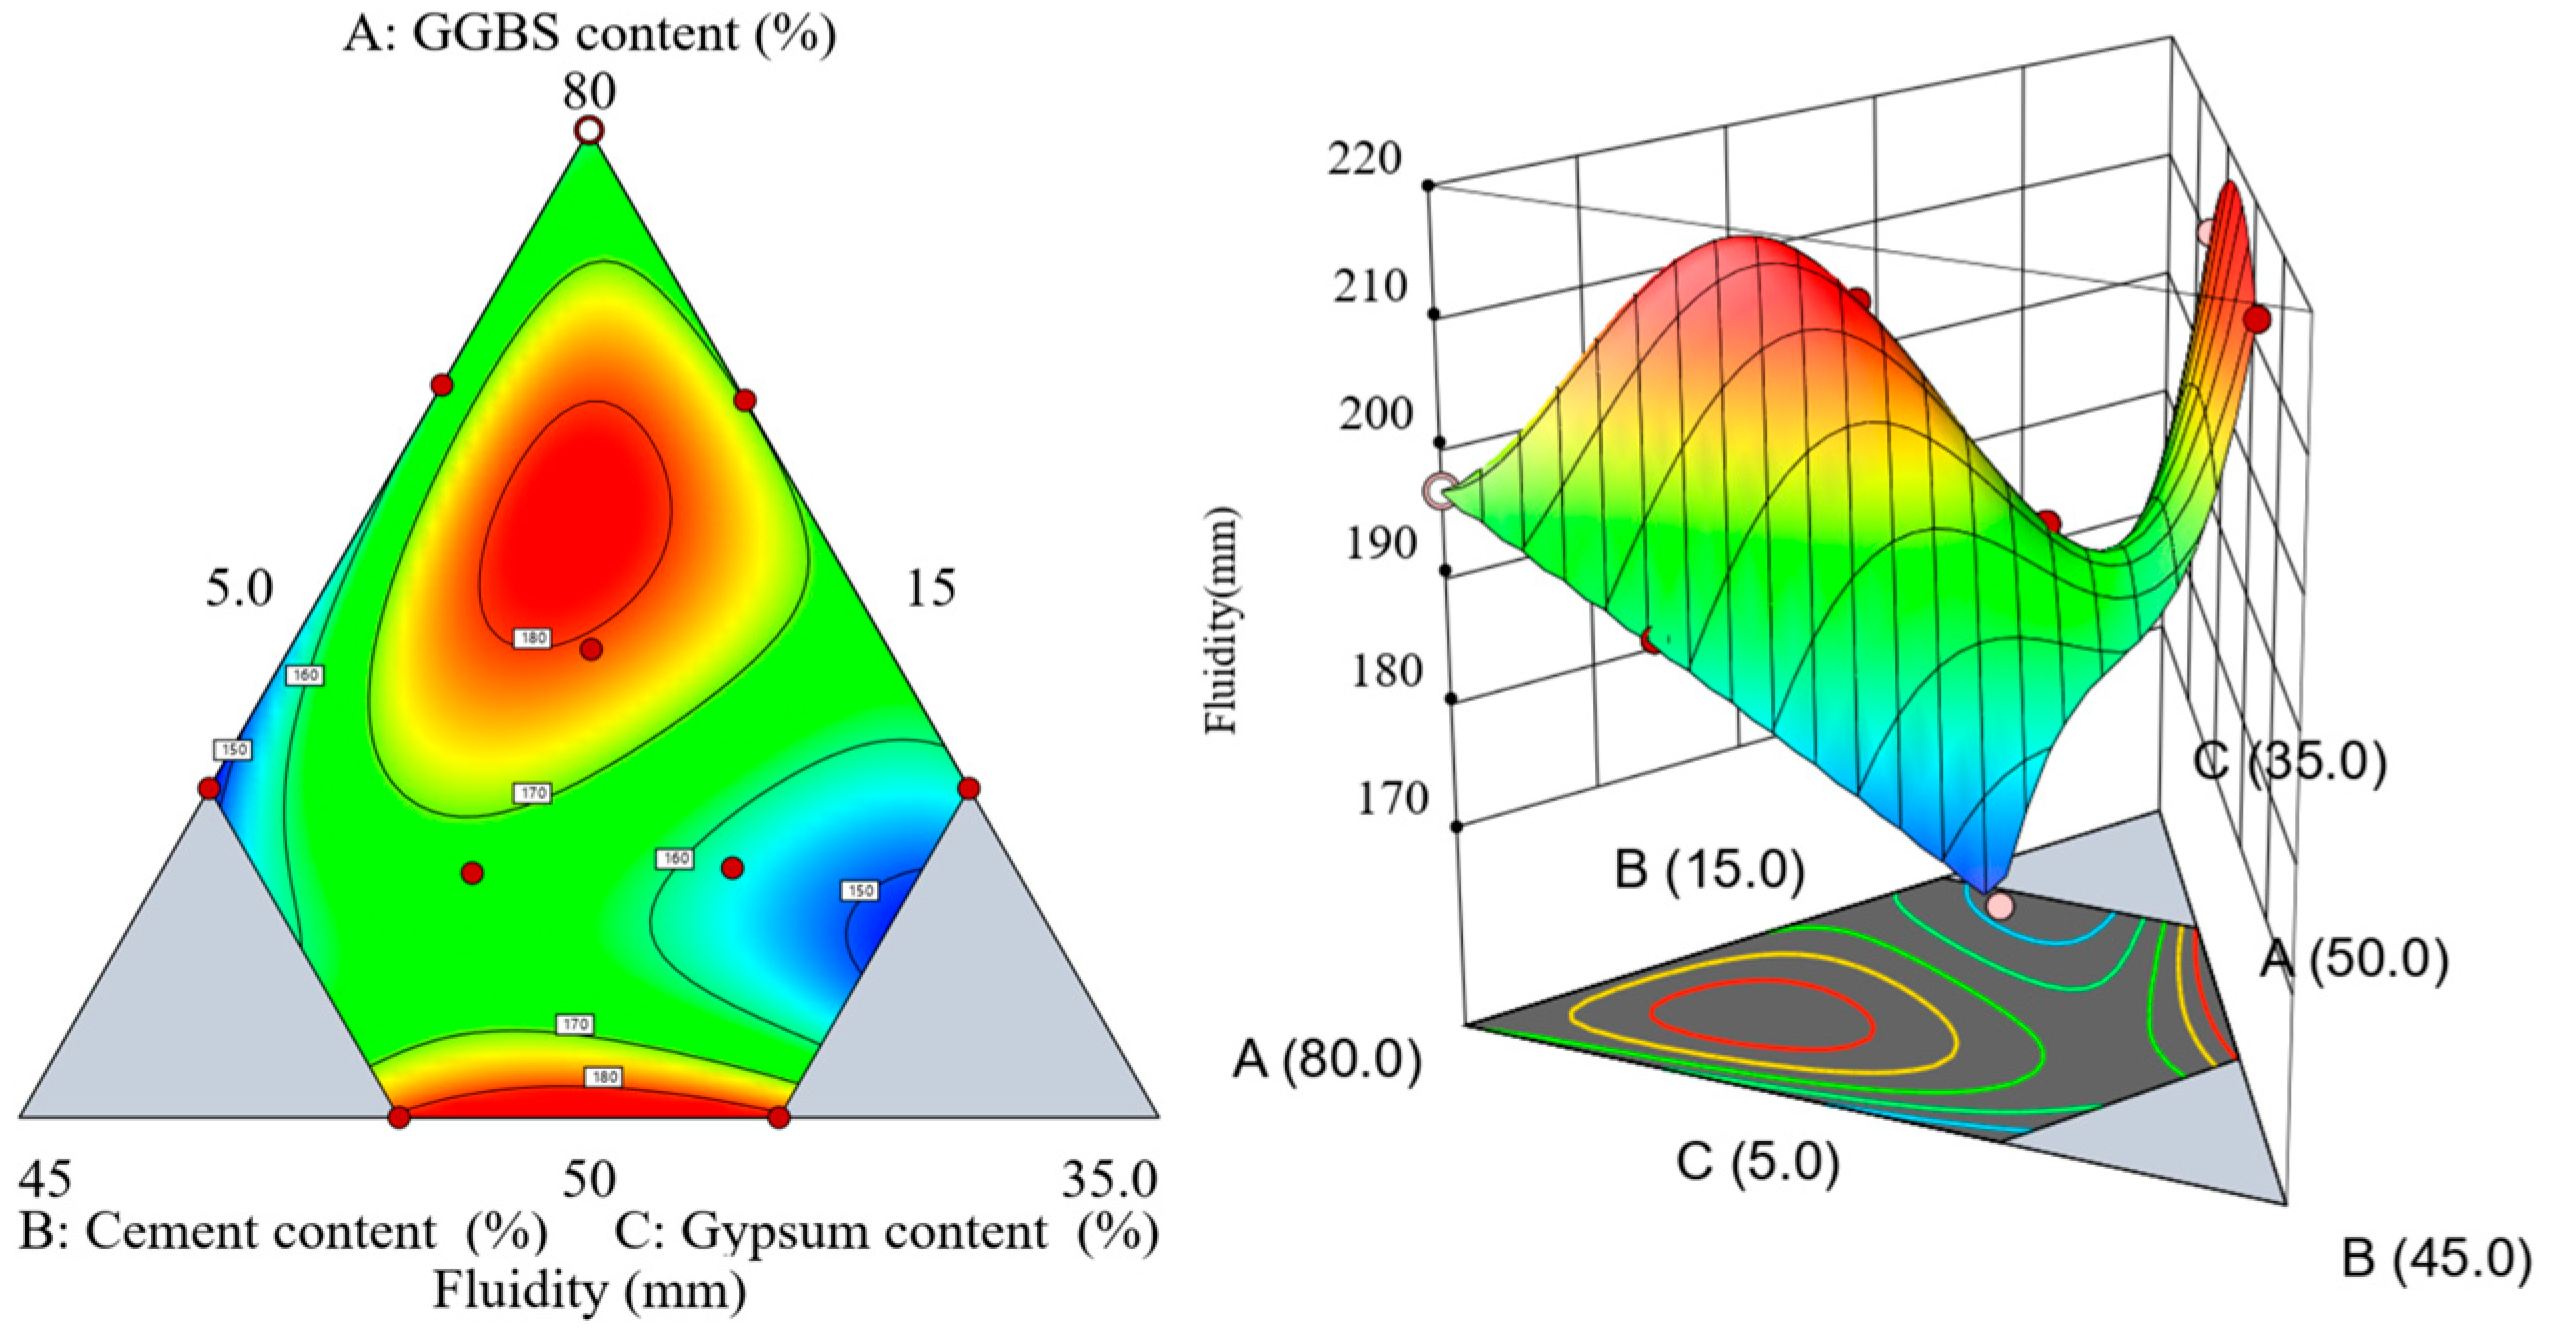
Figure 8 shows the two-dimensional and three-dimensional response surfaces of the flowability under the interaction of three factors. The results show that the flowability forms a single peak in the “high slag (60–70%), medium cement, medium gypsum” region, with closed high-value contour lines and a “saddle-peak” structure in the three-dimensional surface. Specifically, increasing GGBS to 60–70% can significantly improve the flowability; too high or too low cement content will limit the flowability due to water demand and early structure formation; in terms of gypsum, as a key regulating component, when the dosage is below 5% or above 20%, the flowability will significantly decrease. In summary, the optimal ratio range for the slurry flow performance is GGBS 55–68%, cement 15–32%, and gypsum 9–13%, corresponding to a peak flowability of approximately 165–185 mm.
Based on the results of the UCS test and fluidity test of the main materials, and considering the environmental protection aspect, the proportion of slag should be increased as much as possible, and the amount of cement should be reduced under the premise of ensuring strength and fluidity. After comprehensive consideration, the optimal mix ratio was finally determined as m (slag):m (cement):m (gypsum) = 57:30:13, and the cementitious material with this ratio was named BGCG.

3.3. Selection of Activator and Its Influence on the Curing Effect of the Curing Agent

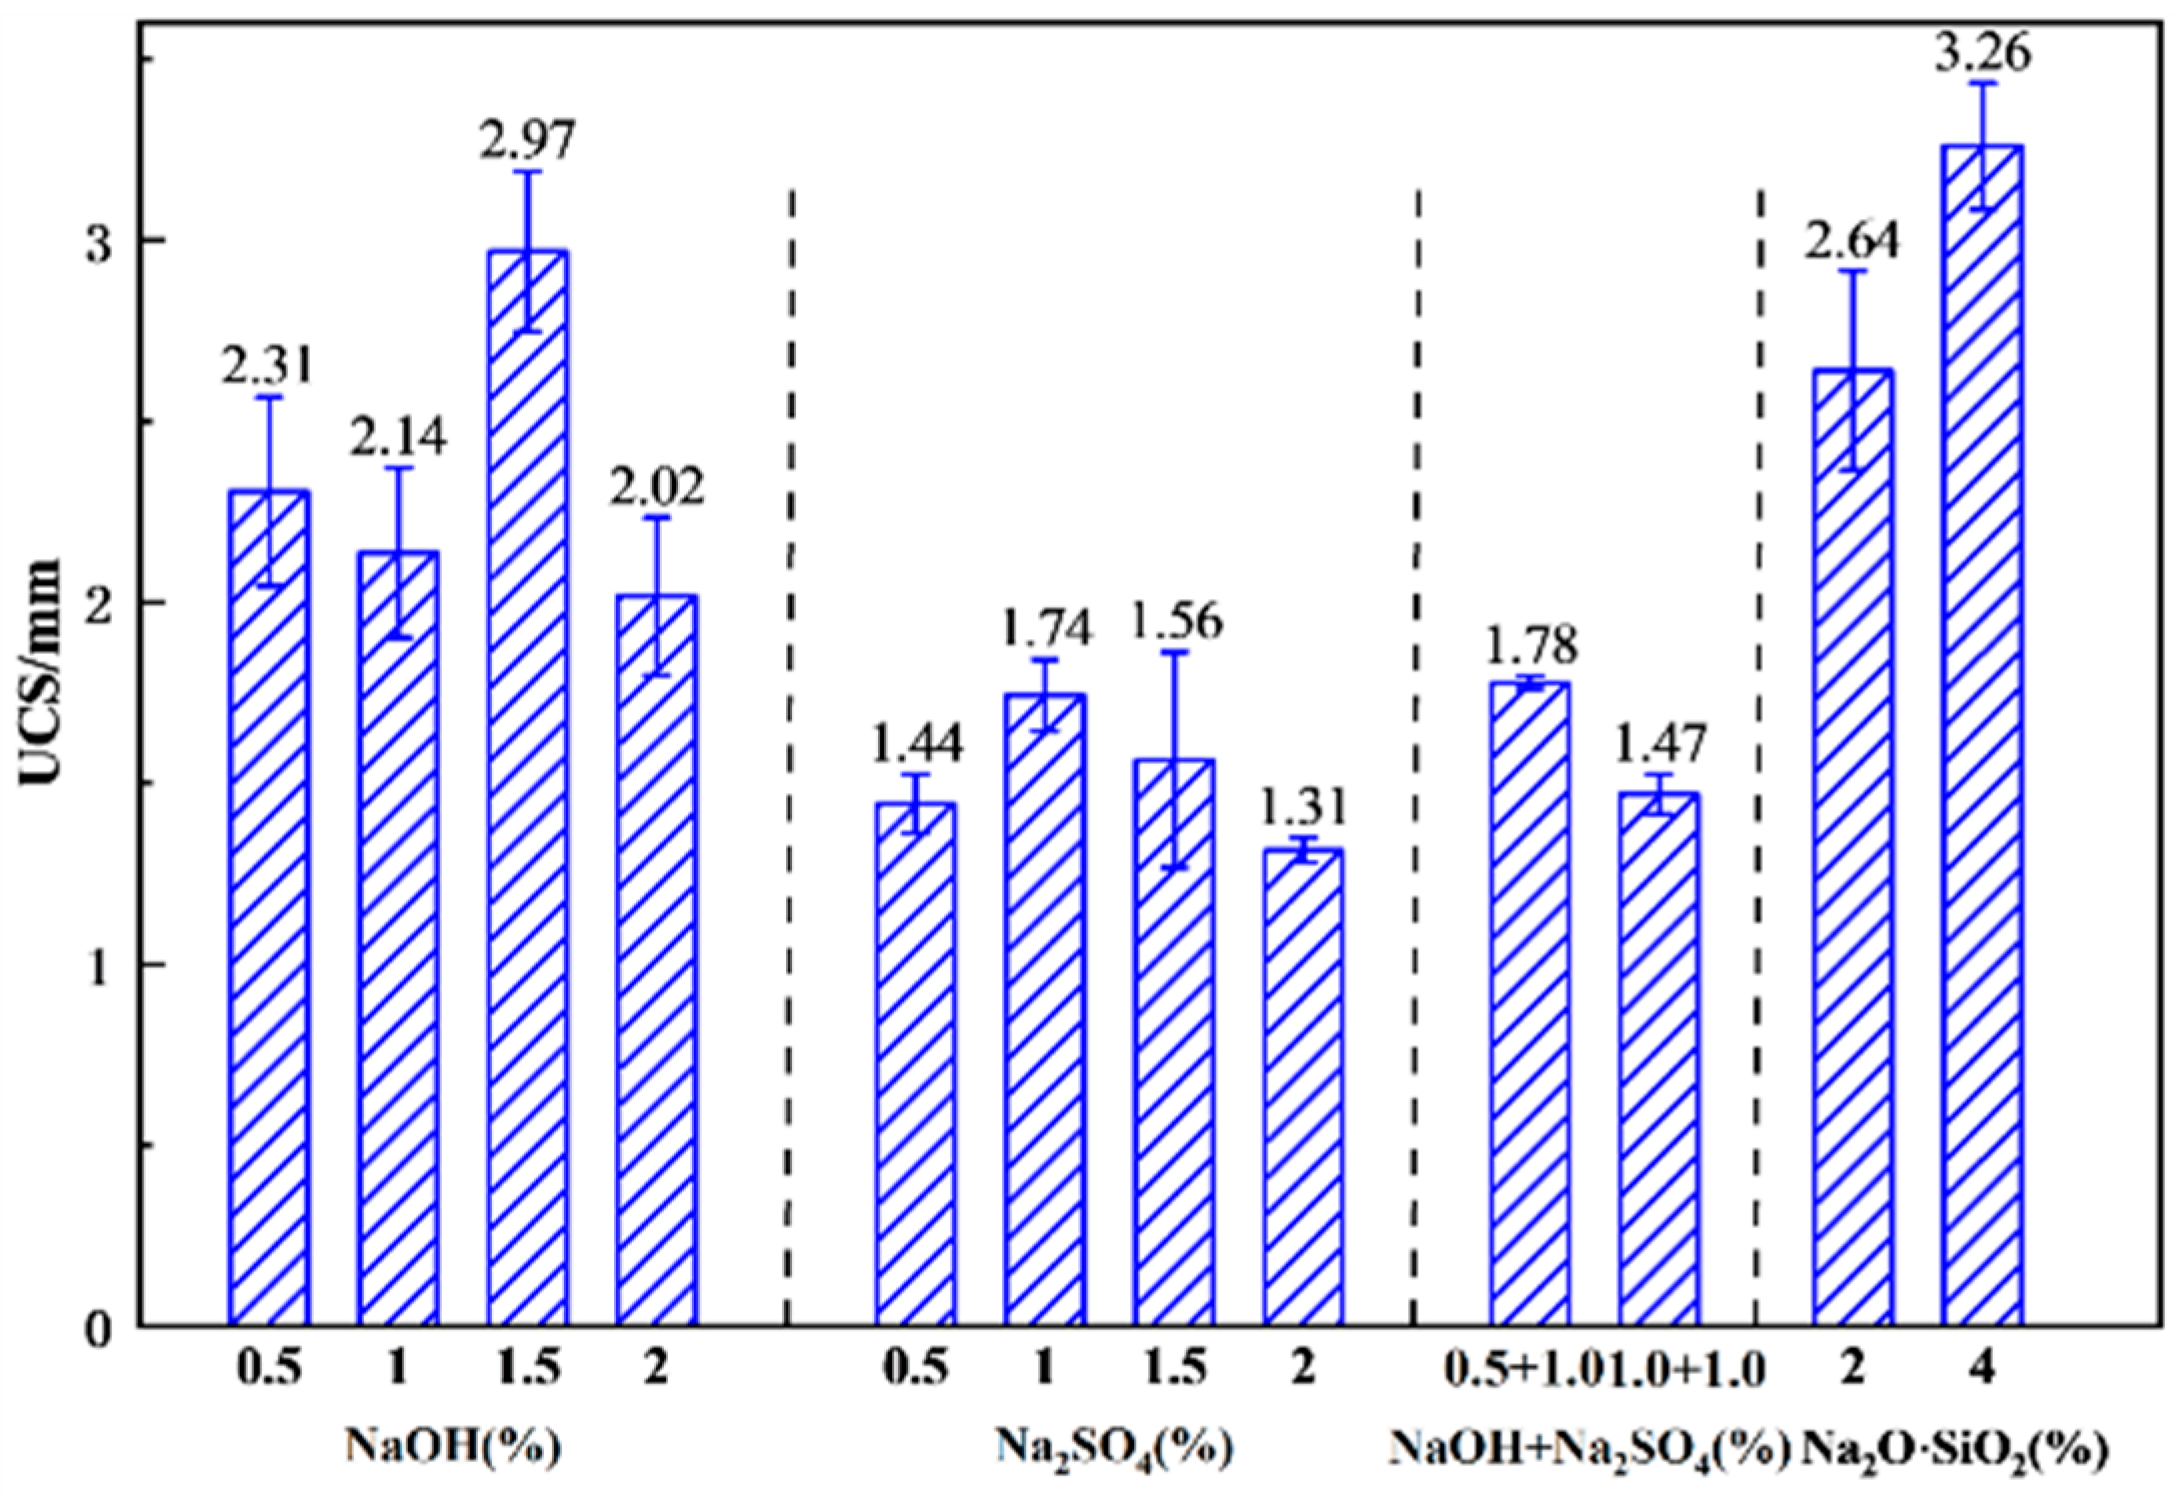
Figure 9 presents the 28-day UCS of solidified soil samples treated with various activators and at different dosage levels. The data reveal notable variations in UCS depending on the type of activator used. Among all tested specimens, the sample incorporating 4% SS achieved the highest strength, reaching 3.26 MPa after 28 days. This is followed by the sample with 1.5% NaOH alone (2.97 MPa), the combination of 1% NaOH and 0.5% Na2SO4 (1.78 MPa), and 1% Na2SO4 (1.74 MPa). These results indicate that SS, as a silicate-based activator, exhibits superior effectiveness in enhancing the strength development of the solidified soil. Moreover, increasing the activator dosage does not consistently improve mechanical performance. In this study, higher alkali content failed to yield additional strength benefits and, in some cases, led to a reduction in strength, suggesting the existence of an optimal activator dosage for maximizing performance.
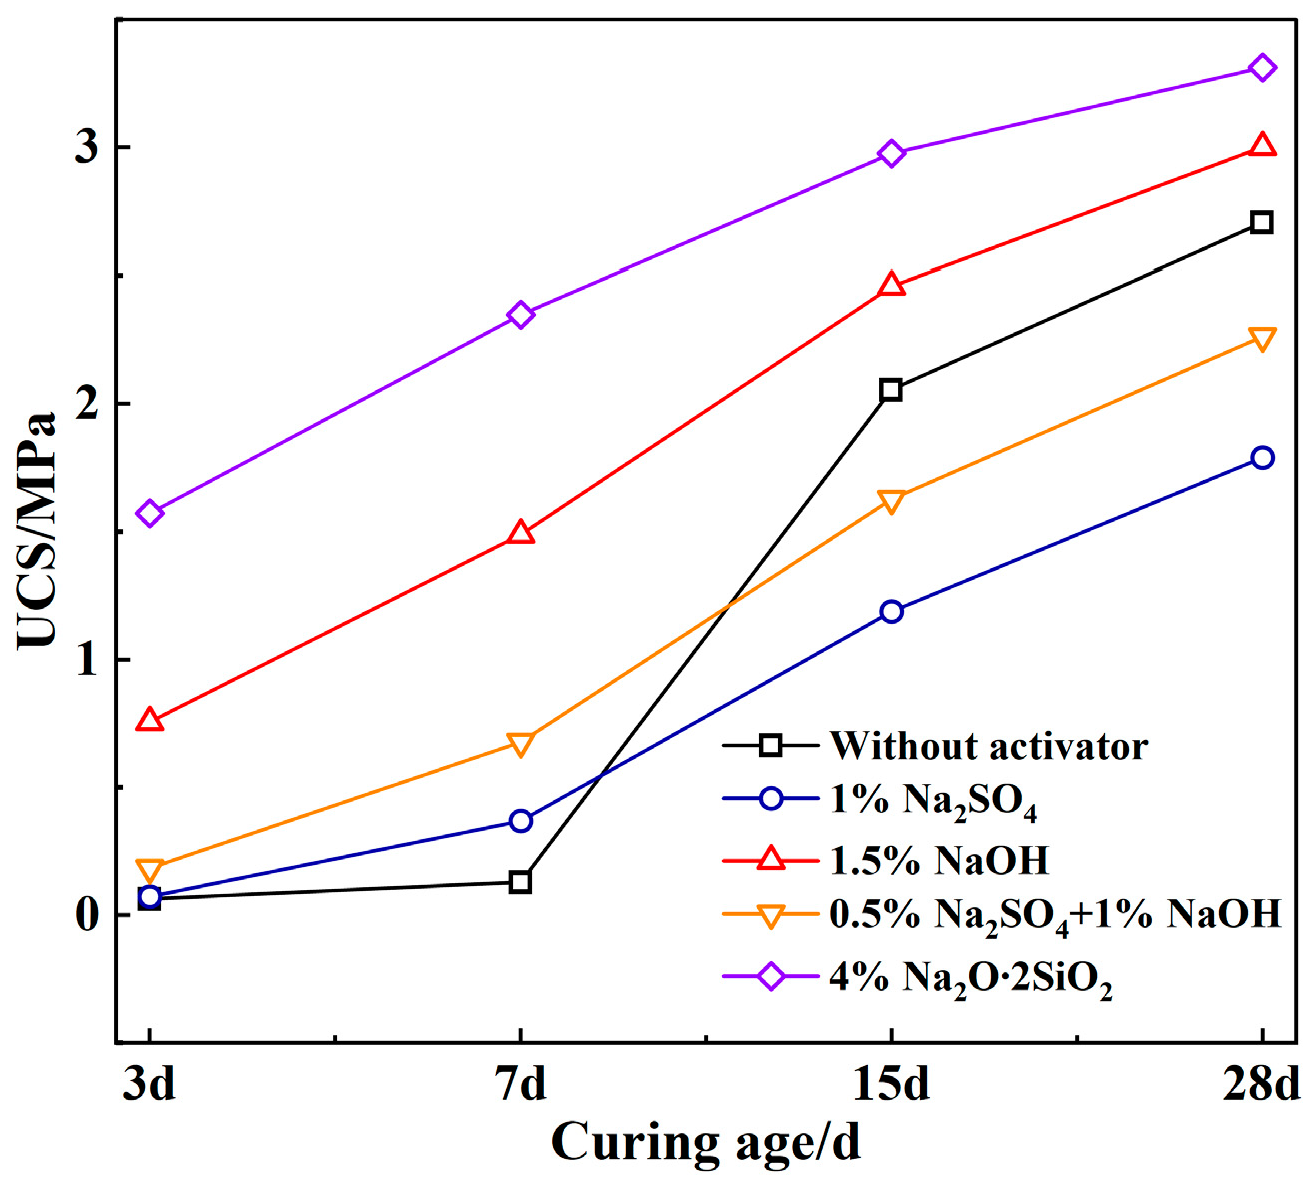
To explore the influence of different activators on the strength evolution of the stone body of the pure slurry, Figure 10 compares the strength development laws under the optimal dosage of the activator and without the activator. The results show that the group without the activator has a slow curing and forming process, and the strength has not yet formed at the 7-day age. However, the groups with the addition of the activator have a relatively high strength at 3 days, indicating that the alkali activator has a significant promoting effect on the early strength development. Among all the groups, the stone body of the slurry with 4% SS added has the highest strength throughout the entire age period. It is worth noting that the groups with the addition of 1% Na2SO4 and the compound addition of 1% NaOH + 0.5% Na2SO4 have a 28-day strength lower than that of the group without the activator. Among them, the single addition of Na2SO4 reduces the 28-day strength by about 23%. This phenomenon may be related to the high proportion of slag and the presence of gypsum in the system. The increase in SO42− concentration promotes the rapid precipitation of AFt or gypsum on the particle surface, forming a coating layer that hinders the hydration of C3S and the dissolution of slag. At the same time, slag relies on a high pH environment to dissociate the glass phase and generate C-(A)-S-H gel, but Na2SO4 fails to effectively increase the pH of the pore solution and may instead consume the limited Ca(OH)2 to form gypsum, thereby inhibiting the strength development in the middle and later stages.
Through the selection test of the alkali activator, 4% sodium silicate was finally selected, and the curing agent with this optimal mix ratio was named GCGS.

4. Research on Macroscopic Mechanical Properties and Microscopic Mechanism of Solidified Soil

4.1. Analysis of Stress–Strain (σ-ε) Curve of Solidified Soil

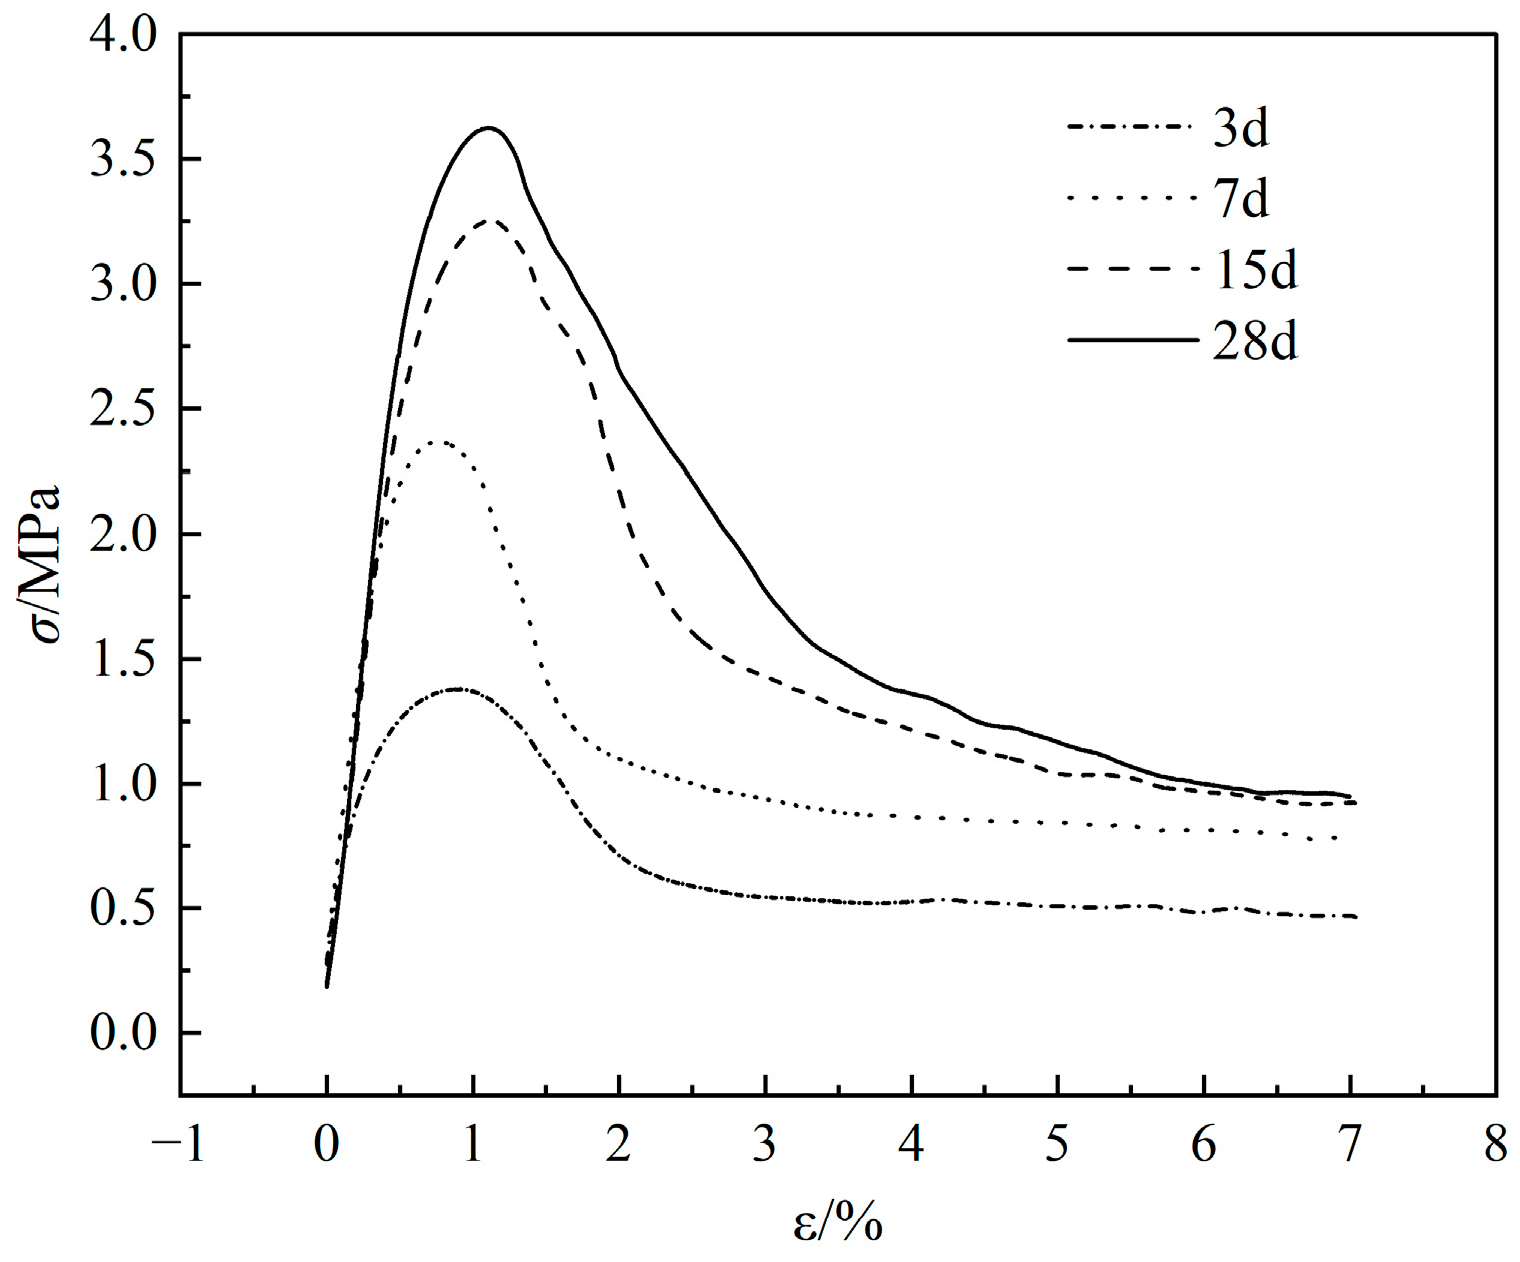
Figure 11 shows the σ-ε curves of GCGS-solidified soil stone bodies at curing ages of 3 d, 7 d, 15 d, and 28 d. It can be seen from Figure 11 that the loading curves of the specimens mainly consist of four stages: elastic stage, plastic stage, strain softening stage, and residual stage. When the specimens are in the elastic stage, the stress increases while the strain increases slowly; in the plastic stage, internal cracks in the stone body begin to expand and connect, and the curve shows a “concave” shape, reaching the peak strength; after the curve passes the peak strength, it enters the strain softening stage, where the stress begins to decrease while the strain continues to increase rapidly; finally, it enters the residual stage, at which point the curve remains roughly stable or slowly decreases at a lower stress level.
The analysis of the stress–strain curve indicates that the solidified soil stone body mainly exhibits brittle–elastic failure characteristics. There is almost no obvious pore compaction stage observed before the peak, indicating that the initial structure of the material is dense and the primary pores and micro-cracks are few. The stress–strain curves of specimens at different ages are highly coincident in the elastic stage, and the calculated elastic modulus is stable at approximately 5.89 GPa, suggesting that the increase in age has little effect on the stiffness of the stone body.
Although the peak strength of the stone body increases significantly with age, the residual strength after failure does not increase simultaneously, remaining stable at approximately 1 MPa at ages of 7 d, 15 d, and 28 d. This phenomenon indicates that when the stress exceeds the peak, the cementation structure formed between the cementitious material and the silt particles has undergone brittle fracture and failure, and the strength is then dominated by the friction and interlocking between the soil skeleton particles. Therefore, the residual strengths at different ages tend to be consistent. At the same time, the post-peak stress drop of the curve becomes steeper with age, further confirming the trend that the brittle characteristics increase with the development of strength.

4.2. Analysis of the Cementation Mechanism of the Synergistic Resource Utilization of Solid Waste

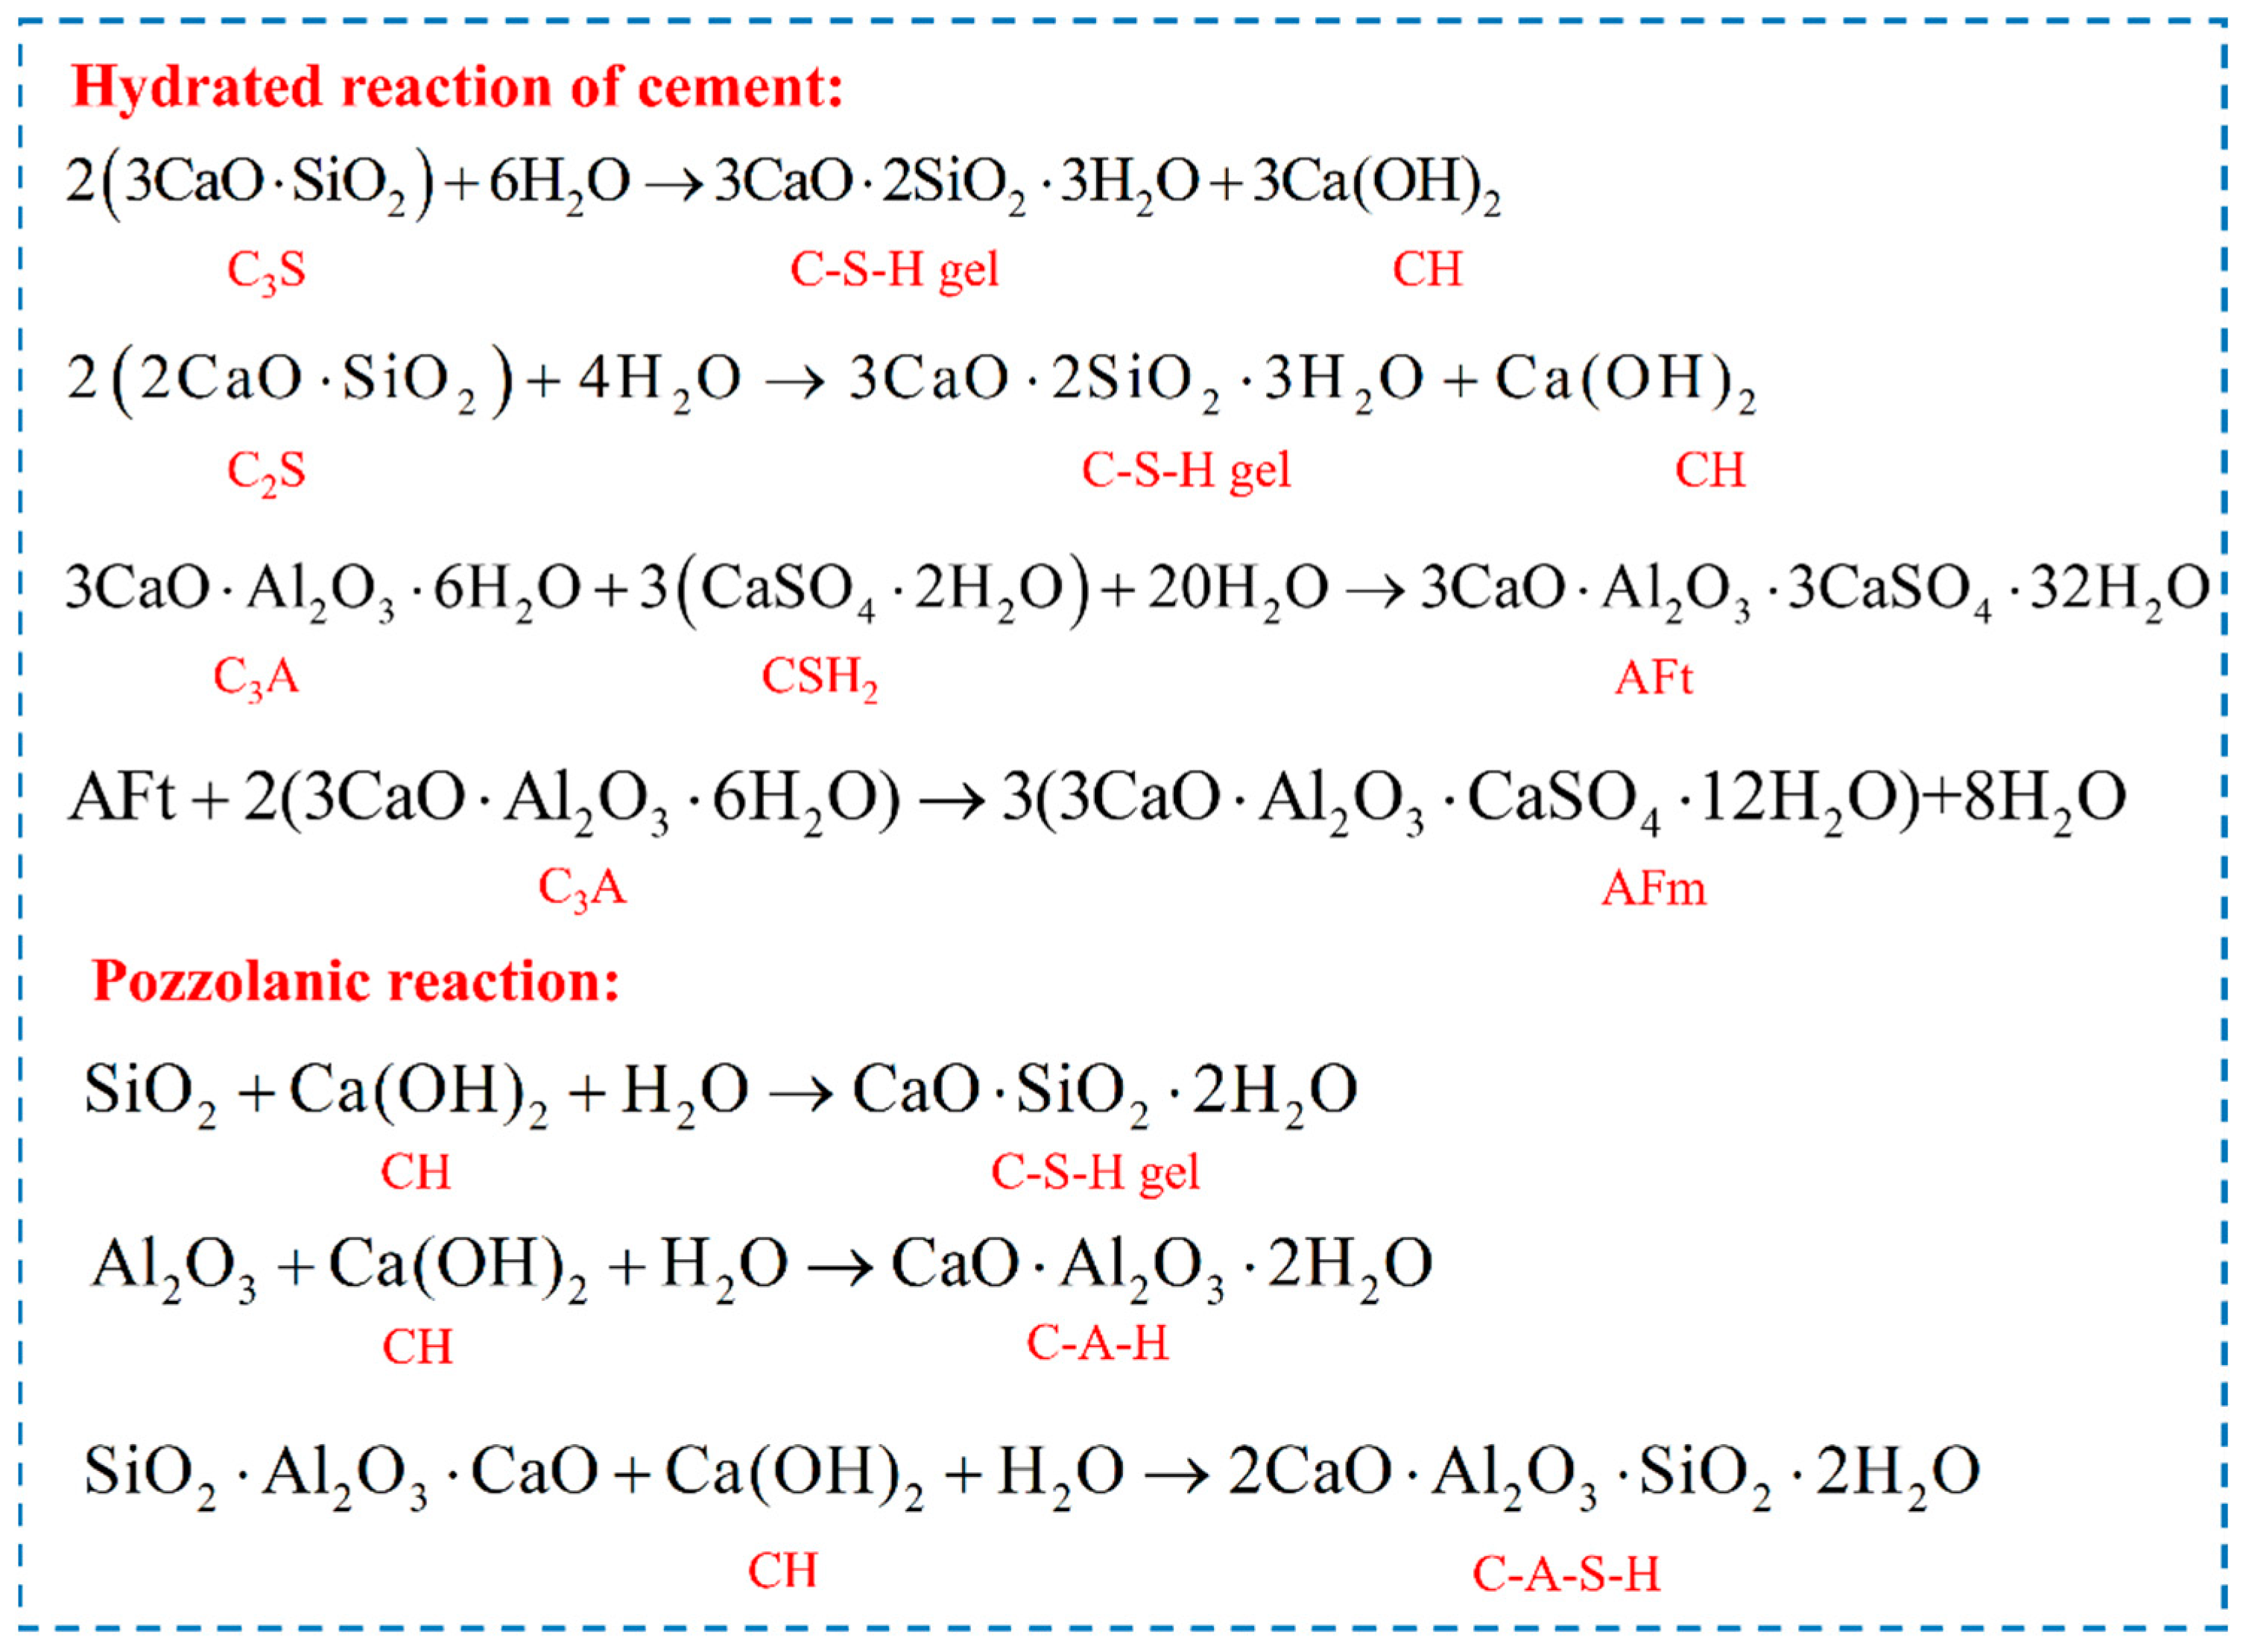
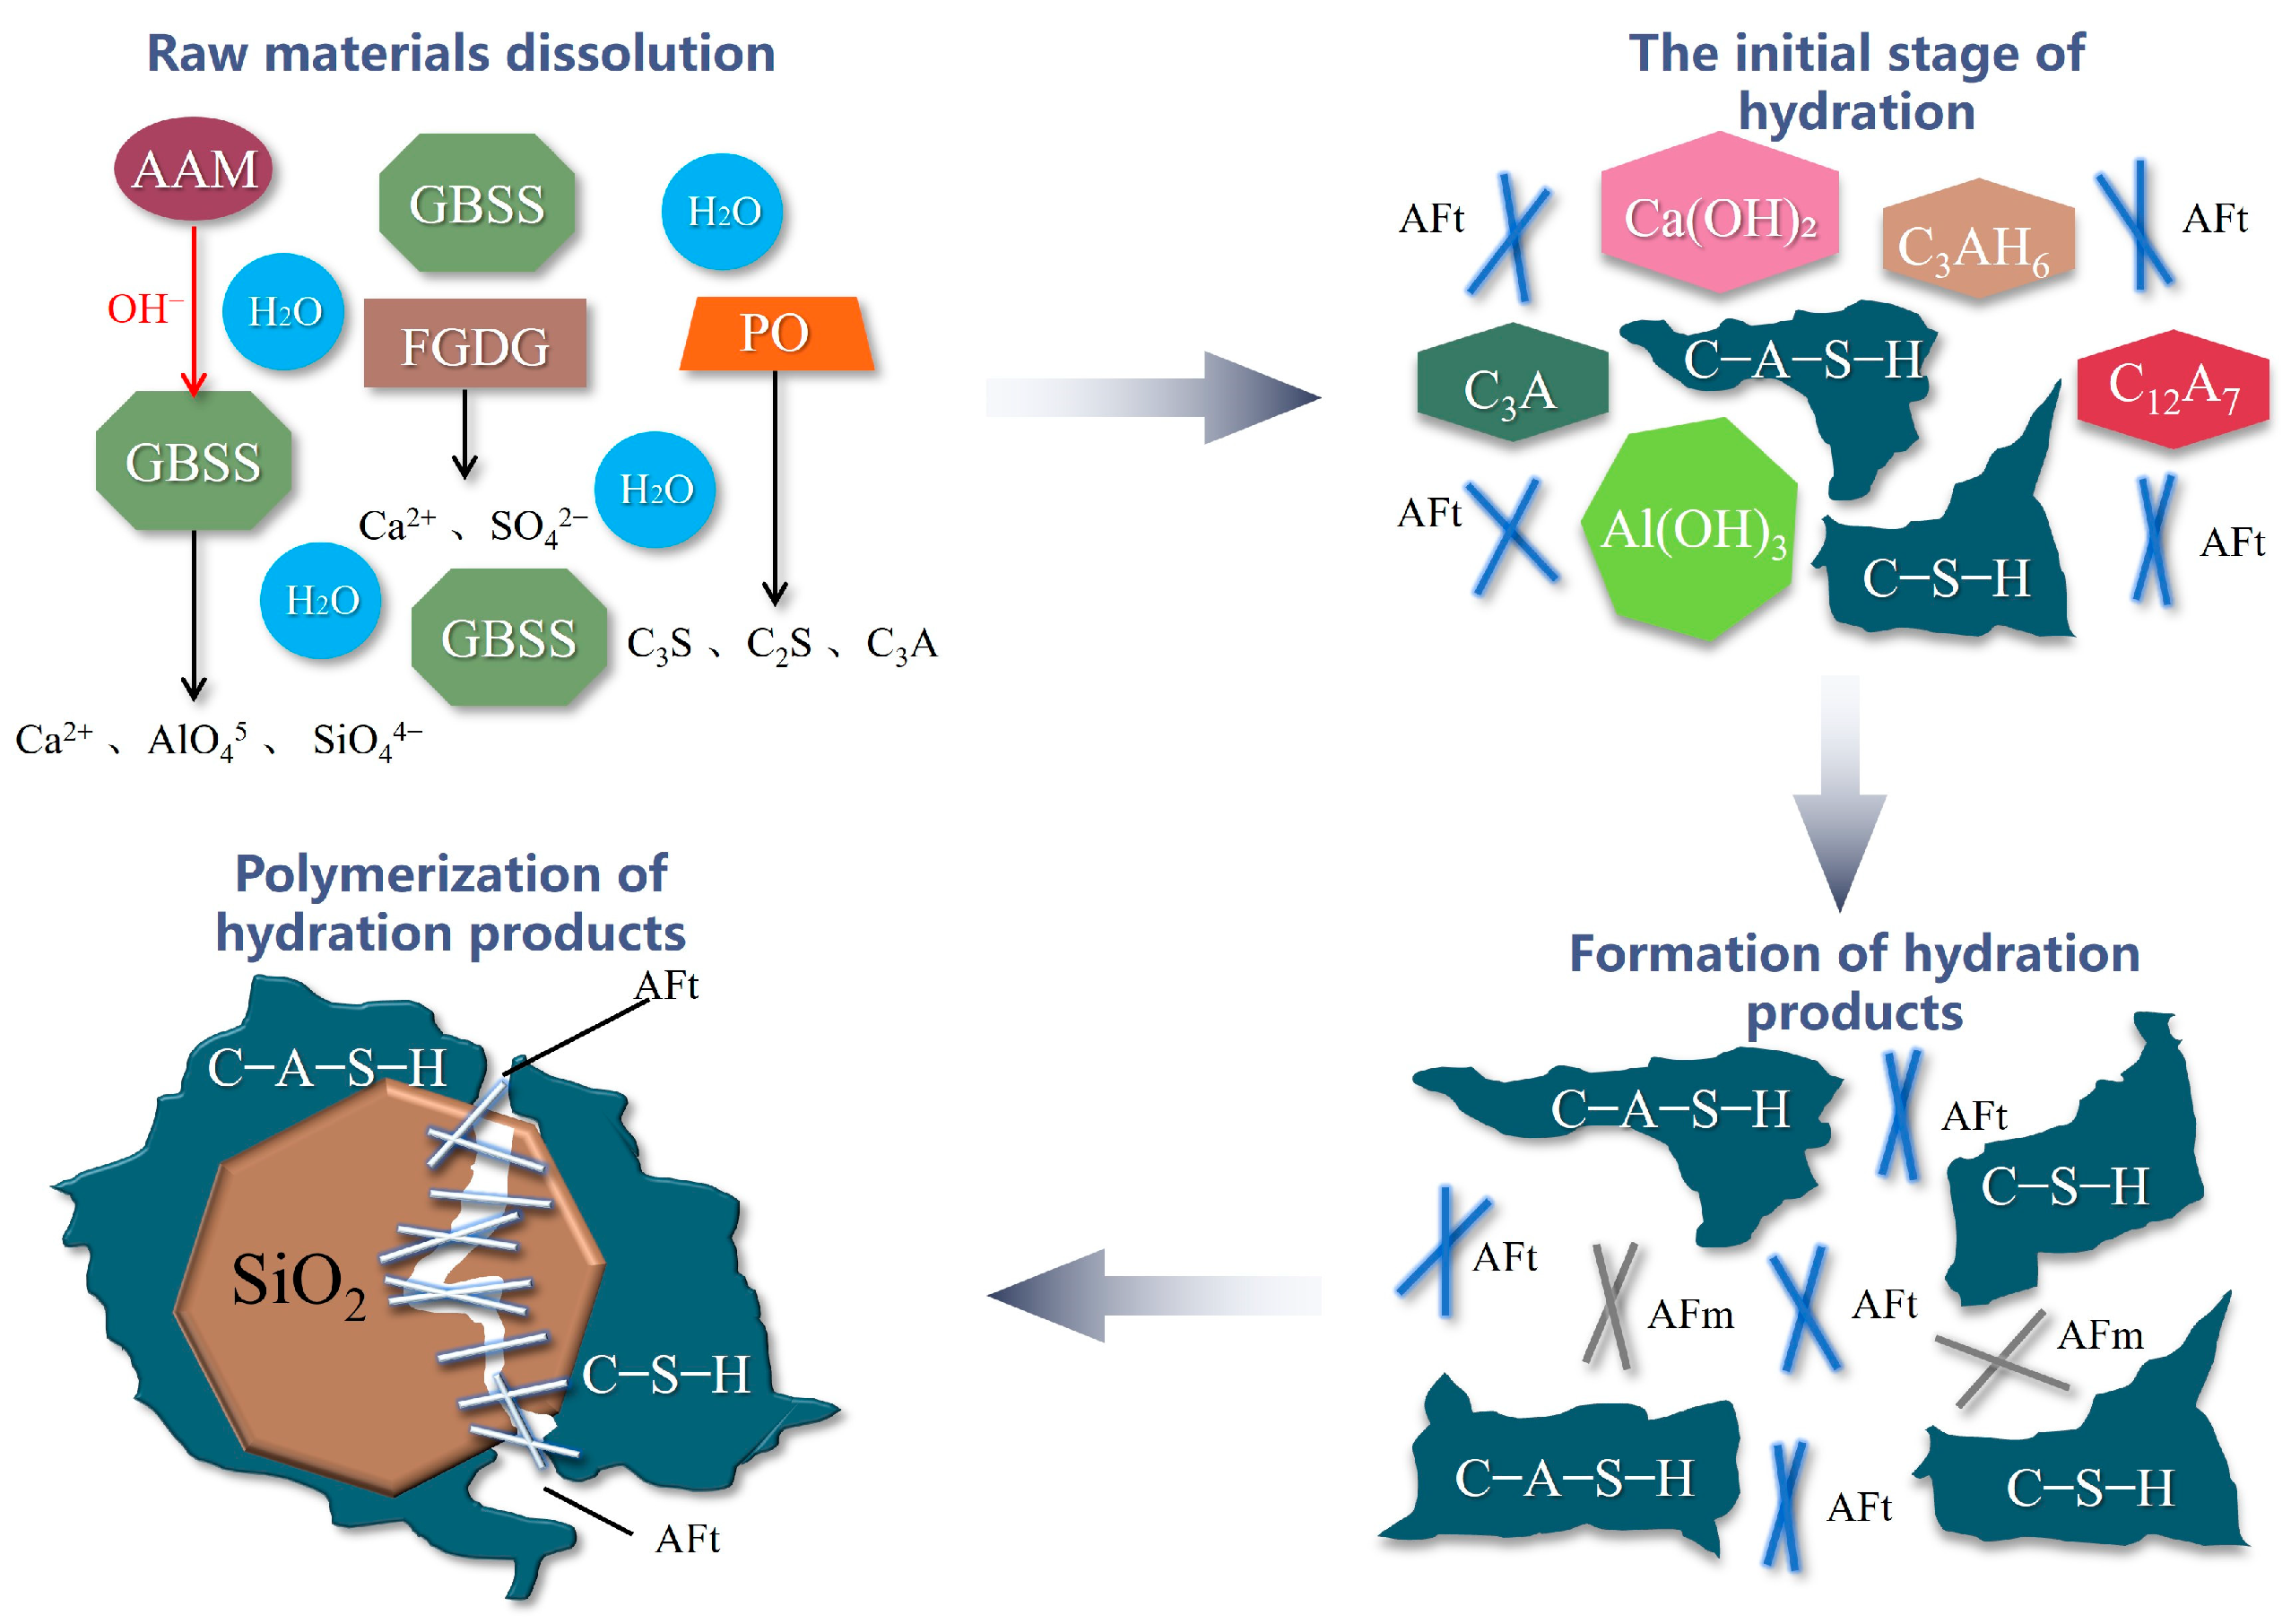
The inorganic mineral composite cementitious system of solid waste adopted in this study is made by mixing slag, cement, gypsum, and sodium silicate in a certain proportion with water. Through the multi-scale synergy of each component, this system forms a high-performance and low-cost stabilizer. The reaction process and strengthening mechanism are as follows: in the initial stage of the reaction, the dicalcium silicate (C2S) and tricalcium silicate (C3S) in the cement rapidly hydrate to form calcium silicate hydrate gel (C-S-H gel) and CH, providing initial strength and an alkaline environment for the system. At the same time, the sulfate ions produced by the dissolution of gypsum react with the tricalcium aluminate (C3A) in the slag and cement to form needle-like ettringite (AFt). These crystals rapidly interweave into a spatial framework within 3 to 12 h, significantly enhancing the early strength. This process not only consumes the aluminate phase, promoting the further dissociation of the slag, but also, due to the high-volume phase of ettringite, effectively fills the pores, thereby forming a more compact early structure. Under the stimulation of sodium silicate, the early reaction degree of the slag is significantly increased. Its active SiO2 and Al2O3 react with the CH produced by the hydration of cement through pozzolanic reaction, generating additional C-S-H gel. This process not only reduces the enrichment of CH crystals at the interface, optimizing the interface structure, but also continuously enhances the cementation ability of the system, promoting the steady growth of later strength. The consumption of CH also, in turn, accelerates the further hydration of the cement, forming a benign synergistic reaction cycle among “slag-cement-alkali activator”. It is worth emphasizing that ordinary cement usually does not have the ability to cement extremely fine particles, while the C-S-H gel and ettringite generated in this system can effectively cement the fine particles in the silt, forming a denser composite with smaller pores. Therefore, in the “sodium silicate-cement-slag-gypsum-silt” composite system, various hydration products interweave and act together, ultimately constructing an overall dense reinforced structure.
The main hydration reaction process and curing process are shown in Figure 12 and Figure 13.

4.3. Microscopic Mechanism Analysis

4.3.1. X-Ray Diffraction

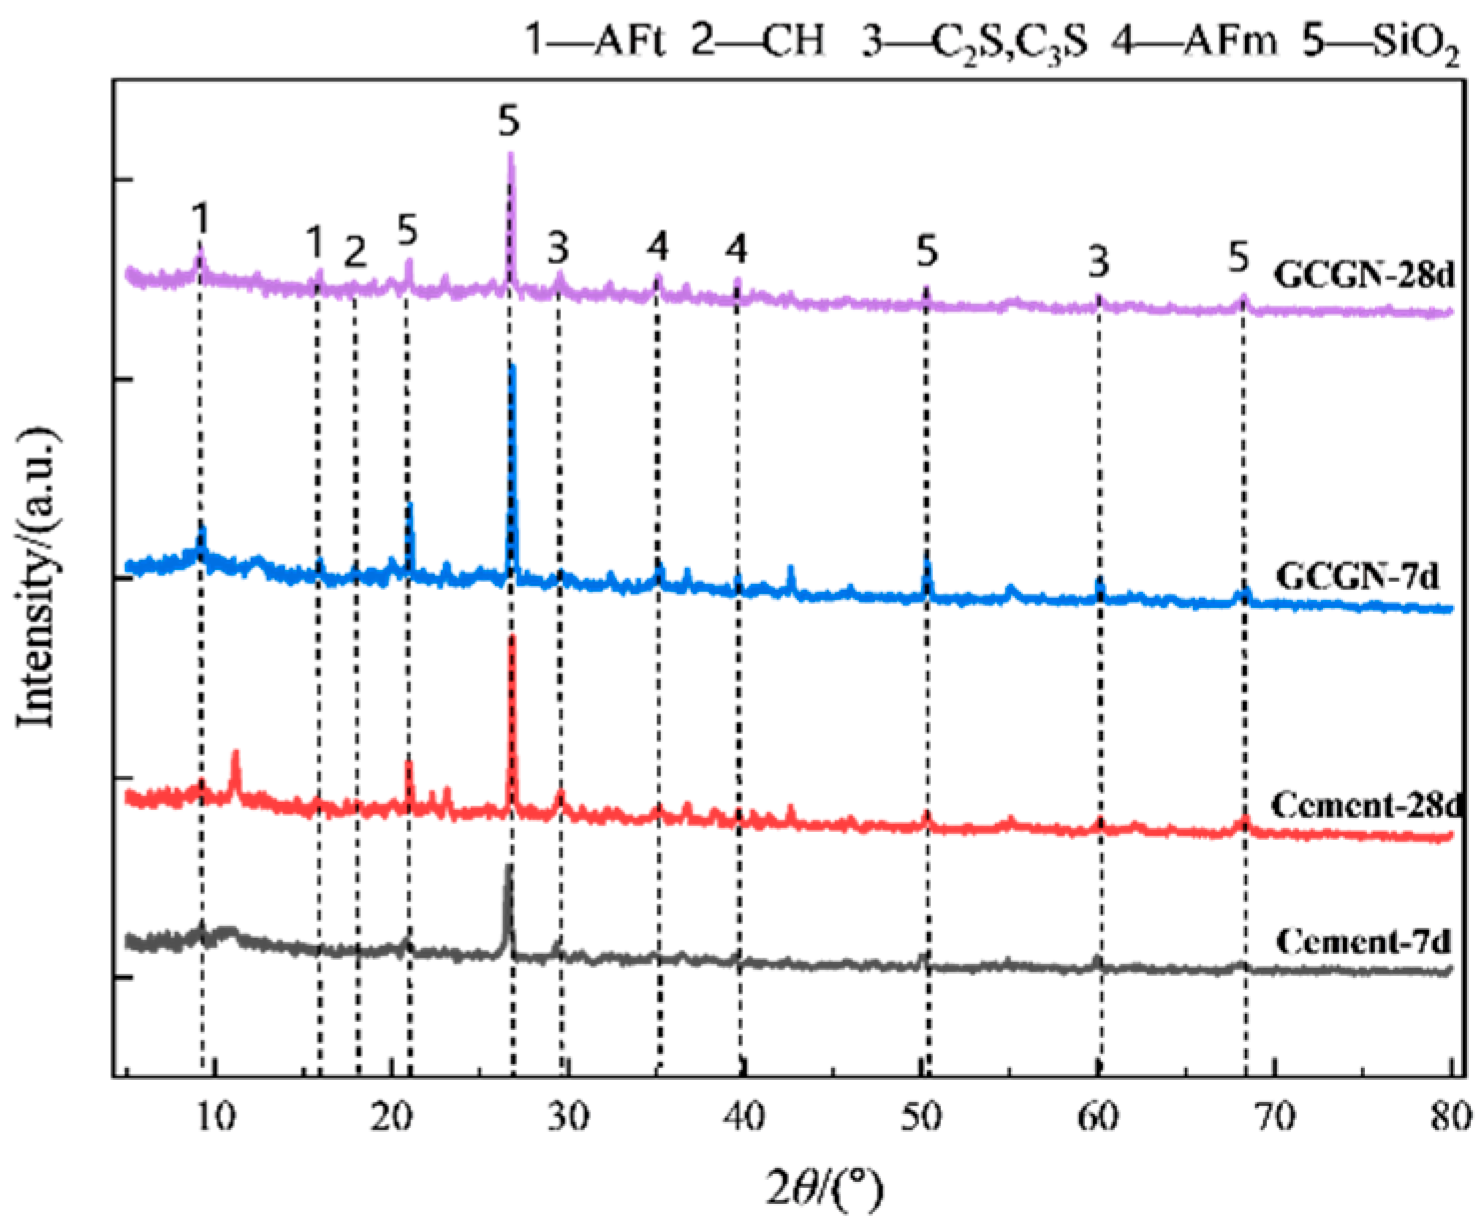
Figure 14 shows the XRD patterns of GCGS-solidified soil and cement-solidified soil after 7 days and 28 days of curing. The results indicate that the mineral compositions of the two are generally similar, with the main crystalline phases including C2S, C3S, and AFt, etc.
With the increase in curing age, a distinct AFt characteristic diffraction peak appears at approximately 9.1° in the GCGS-solidified soil, and its intensity significantly increases, while this peak is relatively weak in the cement-solidified soil. This suggests that the gypsum and other components in the GCGS system effectively promote the sulfate reaction, generating more ettringite crystals. Meanwhile, the C-S-H gel does not show a sharp crystalline peak in the spectrum but presents a broadened “diffuse peak” around 30°, which is a typical feature of its amorphous structure. Additionally, it can be observed that the intensity of the SiO2 diffraction peak in the GCGS-solidified soil decreases significantly with age, indicating that the quartz particles in the silt participate in the pozzolanic reaction, and their consumption effectively promotes the formation of additional C-S-H gel, thereby continuously enhancing the strength of the solidified soil. In contrast, the intensity of the quartz diffraction peak in the cement-solidified soil system does not show significant changes, further confirming the absence of a similar pozzolanic reaction process.

4.3.2. Scanning Electron Microscopy

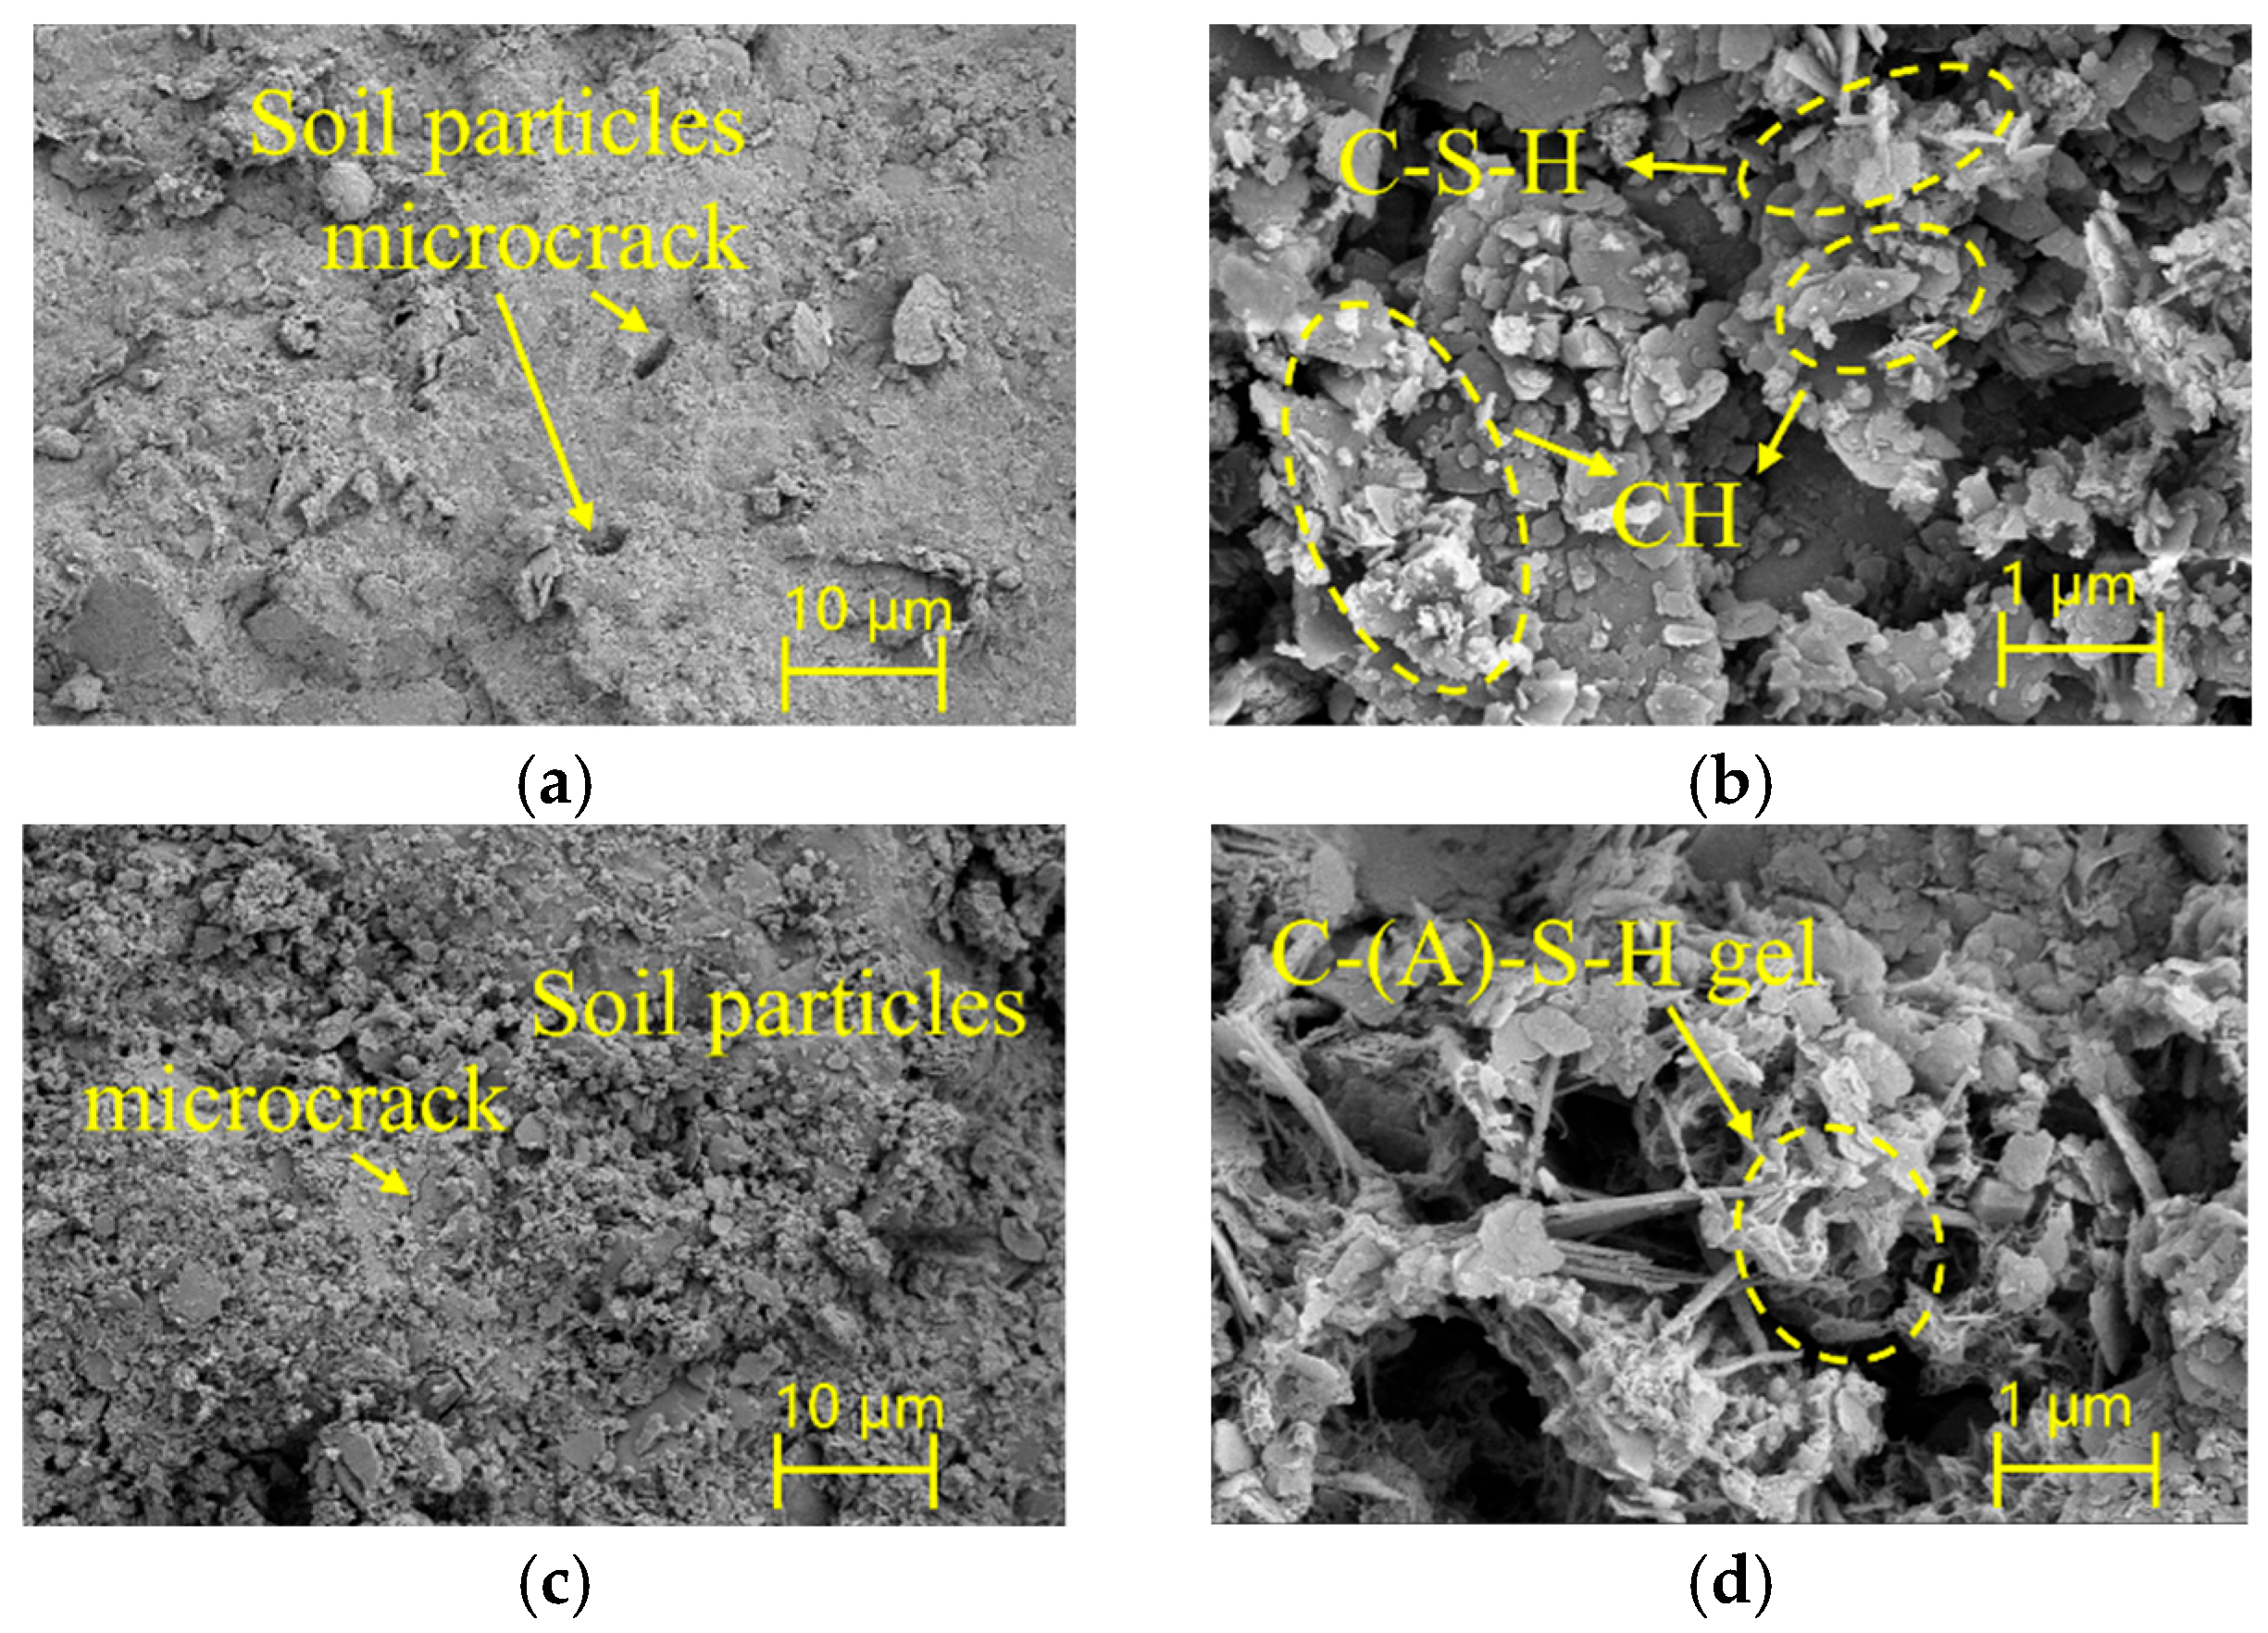
Figure 15 presents the SEM microstructures of cement-solidified soil and GCGS-solidified soil after 3 days of curing. Figure 15a,b show the morphology of cement-solidified soil at 1000× and 10,000× magnification, respectively. It can be seen that the surface is mainly composed of flaky structures, with soil particles clearly distinguishable and obvious pores present. Although a few needle-like products can be observed locally, they are short in size and sparsely distributed, indicating that the hydration degree is limited at this stage and the effective bonding between particles is insufficient, which is manifested macroscopically as low early strength.
In contrast, the microstructure of GCGS-solidified soil at the same age (Figure 15c,d) is significantly different. The surface is mainly characterized by a clumpy morphology. The slag undergoes a potential pozzolanic reaction under the action of alkali, which has a significant “calcium-consuming” effect on CH. The particles are extensively enveloped by a large amount of flocculent C-(A)-S-H gel, and well-developed long needle-like AFt crystals are interwoven among them. This structural feature indicates that the GCGS system undergoes a more rapid and complete hydration reaction at an early stage. The generated AFt crystals and C-(A)-S-H gel work together to effectively bridge and fill the pores between soil particles, playing a key role in densifying the structure and enhancing the connection, thereby demonstrating superior early mechanical properties macroscopically.
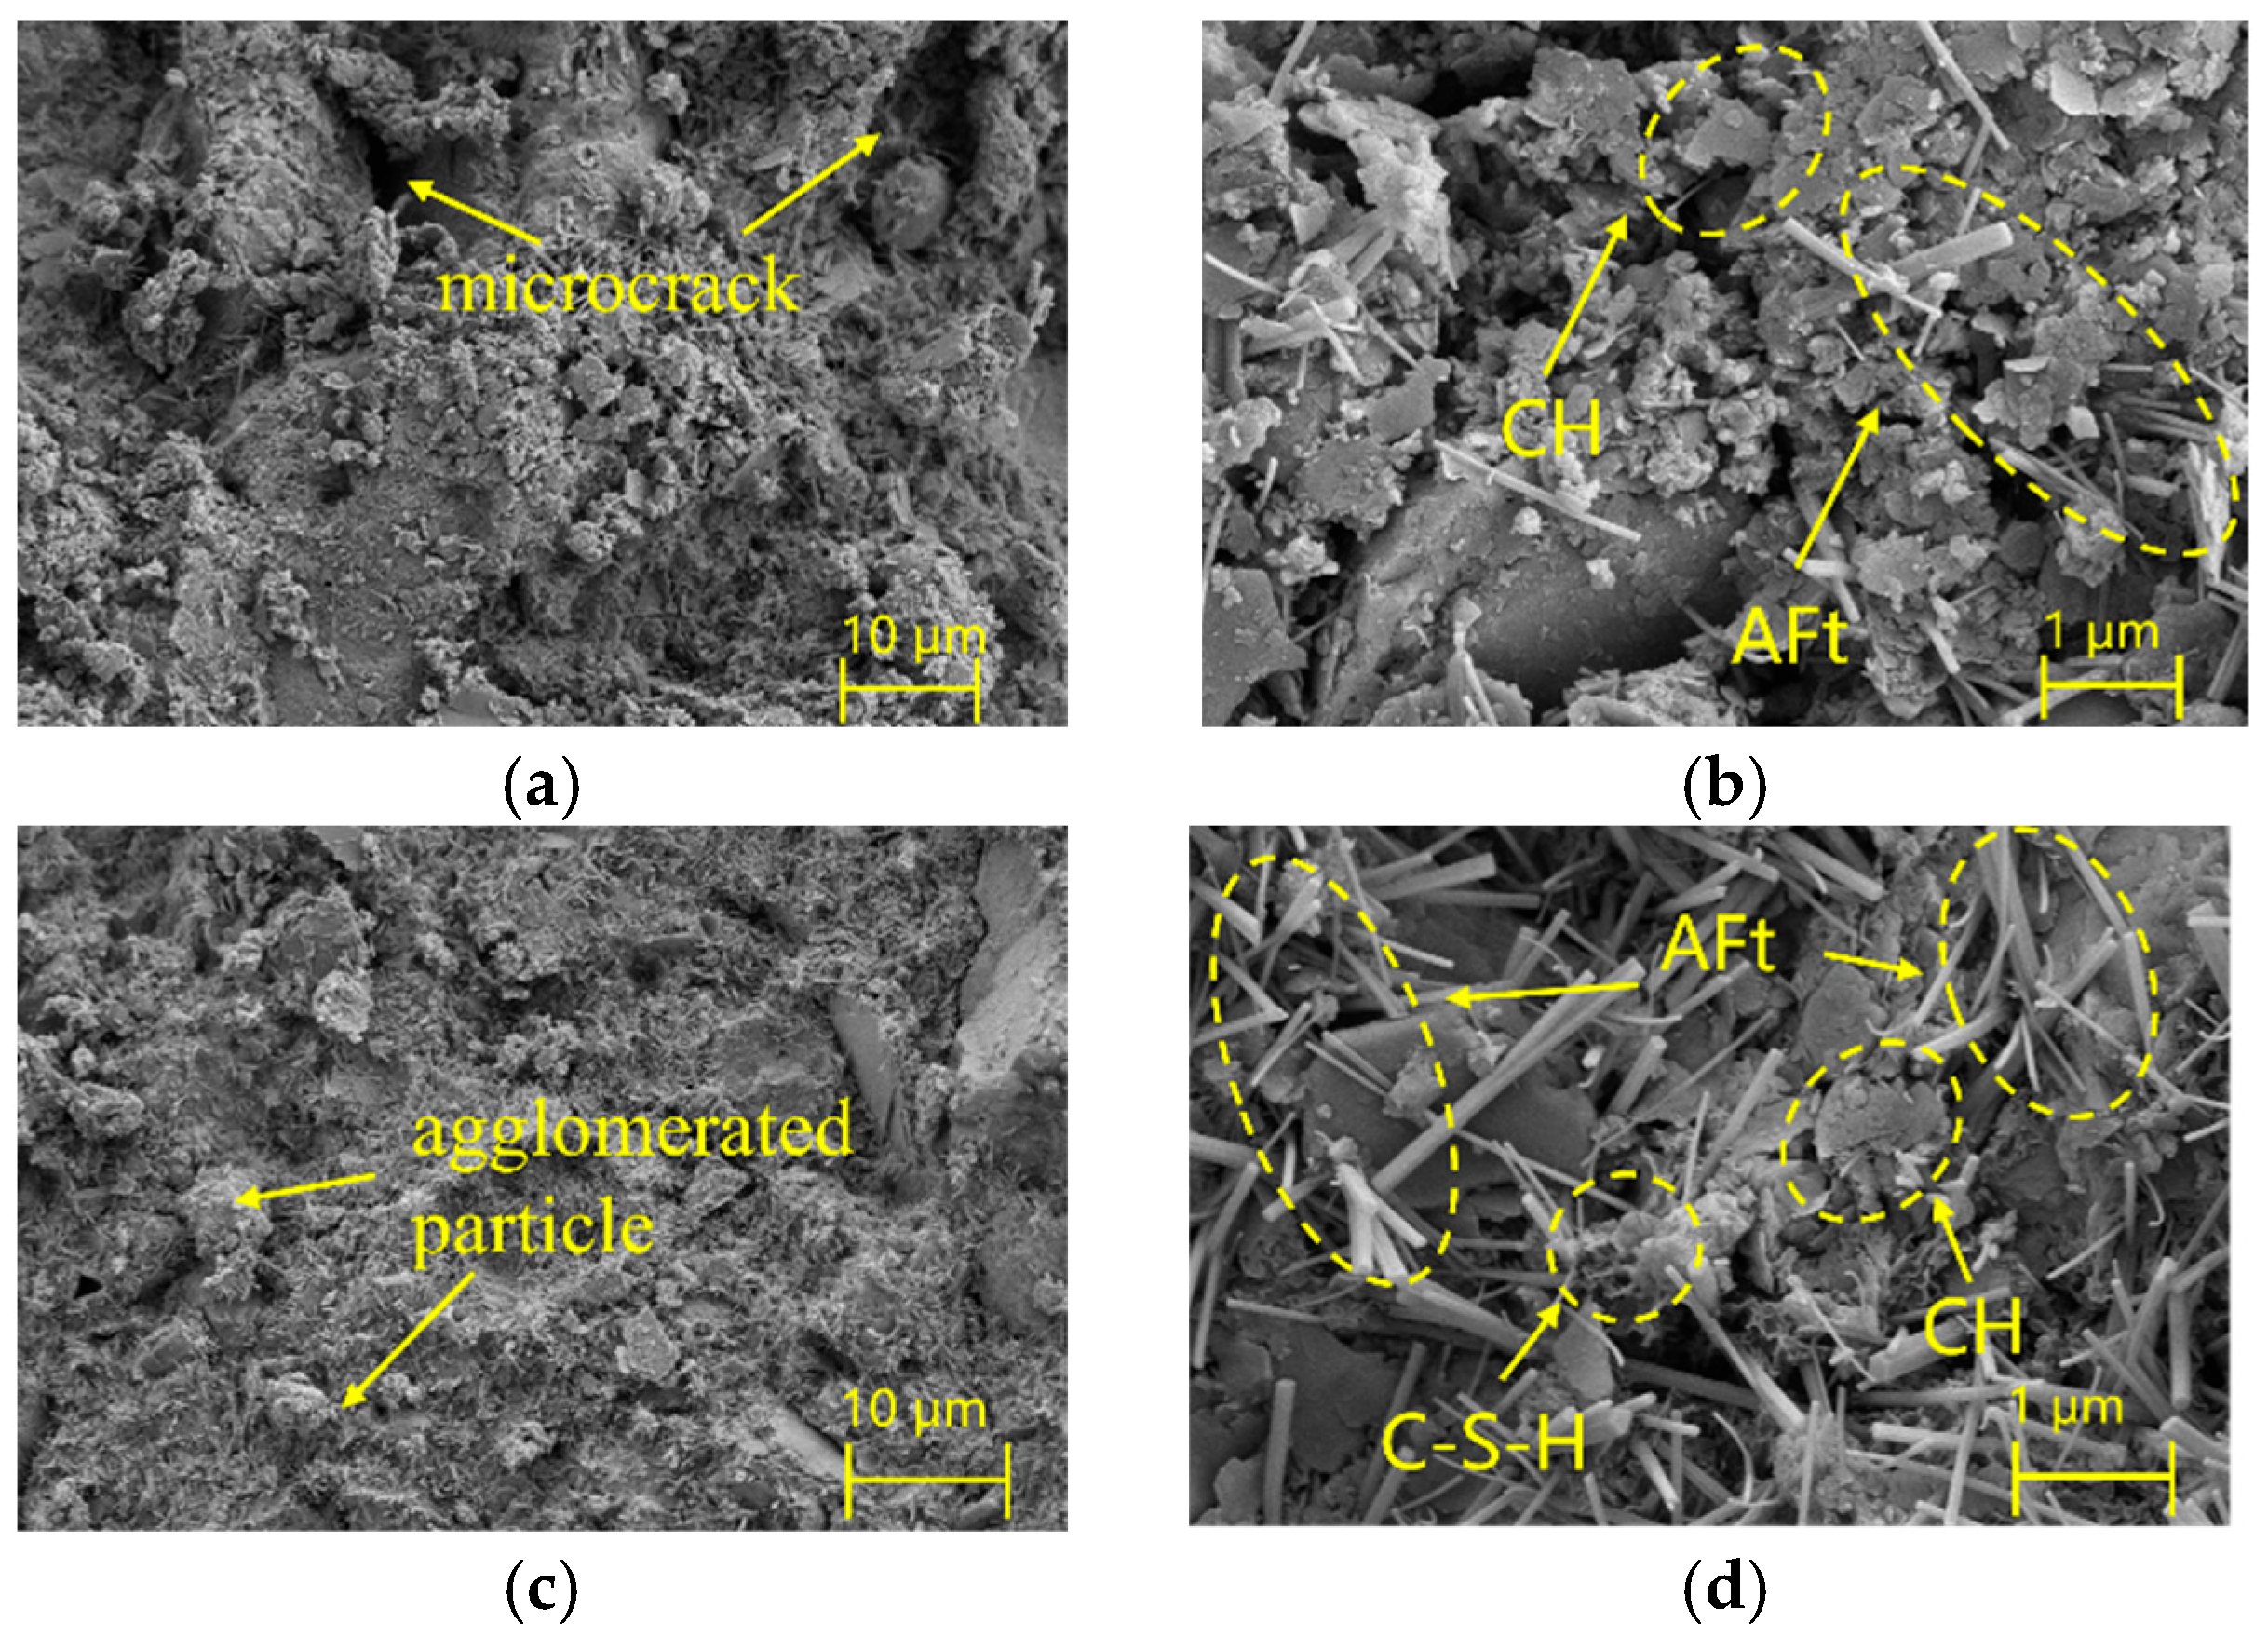
Figure 16 presents the SEM microstructures of cement-solidified soil and GCGS-solidified soil after 28 days of curing. Figure 16a,b show the morphology of cement-solidified soil at 1000× and 10,000× magnification, respectively. Compared with the 7-day age, the microstructure gradually changes from mainly blocky and clumpy to a coexistence of needle-like and clumpy structures, with a significant increase in the number and length of needle-like AFt crystals. The black areas in the figure are significantly reduced, indicating that as the hydration process progresses, the soil pores are continuously filled, and the structure tends to be denser; however, there are still some small cracks, suggesting that the degree of cementation still has room for improvement. Overall, the continuous cementation of soil particles by the cement hydration reaction plays a key role in the development of later strength.
Figure 16c,d show the SEM images of GCGS-solidified soil at 1000× and 10,000× magnification after 28 days of curing. Compared with the structure at 7 days, the microstructure further develops from mainly needle-like and blocky to mainly needle-like and network-like structures, with a significant reduction in the inter-particle voids. This indicates that gypsum has been fully reacted during long-term curing, forming a network-like gel system with higher strength. At the same time, the AFt crystals are more fully developed, with a large number of needle-like crystals extending from the particle surfaces and spanning the pores, entangled with the flocculent C-(A)-S-H gel. Plate-like crystals can be seen in some local areas. These hydration products together form a continuous “crystal-gel synergy” dense skeleton, effectively reducing the pore connectivity and significantly enhancing the macroscopic strength of the solidified soil.

5. Comprehensive Benefit Evaluation of Solidifiers

5.1. Environmental Benefit Evaluation

To compare the environmental impact of BGCG-, GCGS-, and cement-solidified soil under the same dosage, the impact of CO2 emissions from solidified soil on the environment is evaluated by Equation (3) [31].
C i = c f c
In the formula, Ci represents the carbon intensity, measured in kg·m−3·MPa−1; c is the CO2 emission of the solidified soil, measured in kg·m−3; and fc is the compressive strength of the solidified soil at the corresponding curing age, measured in MPa.
According to the research on carbon emissions from cement clinker production by Di et al. [32], CO2 emission sources are examined from three dimensions: (1) CO2 generated by coal combustion; (2) CO2 released from the decomposition of raw material CaCO3; and (3) CO2 derived from electricity consumption during cement clinker production. In this study, the carbon emission factor for unit cement clinker production is determined as 814.83 kg CO2/t through comprehensive consideration. Furthermore, drawing on the relevant literature investigating the life-cycle impacts of slag, gypsum, and sodium silicate manufacturing, their respective carbon emission factors are adopted as 80 kg CO2/t, 117.14 kg CO2/t, and 0.9 kg CO2/t [33,34,35]. The calculated carbon intensity results of the solidified soil are presented in Table 8. The analysis indicates that the 28-day carbon intensities Ci of BGCG- and GCGS-solidified soil are 23.13 kg·m−3·MPa−1 and 14.05 kg·m−3·MPa−1, respectively, while the corresponding value for cement-solidified soil is 114.22 kg·m−3·MPa−1. It can be seen that using BGCG and GCGS stabilizers to replace cement can reduce the carbon intensity by approximately 91.09 kg·m−3·MPa−1 and 100.17 kg·m−3·MPa−1, with a reduction rate of 79.8% and 87.7%, respectively. This shows that in addition to having a better effect on stabilizing silt soil, this material can also significantly reduce environmental impact and has a prominent environmental advantage.

5.2. Economic Evaluation

Based on the investigation of the current market prices of mainstream materials, this paper has calculated the comprehensive costs of BGCG and GCGS cementitious materials. The specific results are shown in Table 9. The calculation indicates that the comprehensive unit price of GCGS curing agent is approximately 3 yuan/ton lower than that of traditional cement curing agent and is basically equivalent to the cost of P.O42.5 grade cement. If no activator is added, the cost can be further reduced to 264 yuan/ton. However, GCGS cementitious material mainly uses industrial solid waste as raw materials. While having excellent curing performance, it also significantly improves the level of resource recycling.
To sum up, this slag-based cementitious material exhibits marked advantages over cement in curing performance, environmental protection, and economic efficiency, with excellent comprehensive properties and the potential to serve as a high-efficiency alternative to cement. It is worth noting that the conclusions of this study are based on preliminary estimates and have not yet been validated within a rigorous life cycle assessment (LCA) framework. Thus, it is recommended that future research conduct a full life cycle carbon emission accounting and evaluation of this material to confirm its environmental benefits.

6. Conclusions

This study, based on D-optimal mixture design, systematically carried out the optimization of the proportion of cementitious materials centered on slag–cement–gypsum, the selection of alkali activators, and the evaluation of macroscopic and microscopic properties, as well as comprehensive benefits. The main conclusions are as follows:
(1)
This study systematically optimized the formulation of a slag-dominated cementitious material via a D-optimal mixture design. Results indicate that when the mass ratio of slag, cement, and gypsum is 57:30:13, the UCS of the solidified soil reaches 2.14 MPa at a 28-day curing age. Additionally, alkali activator selection experiments revealed that the incorporation of 4% (mass fraction) sodium silicate with a modulus of 2.0 significantly enhances the hydration reaction of the cementitious system, thereby comprehensively improving the mechanical properties of the stabilized soil: its 28-day UCS increases substantially to 3.26 MPa.
(2)
SEM and XRD tests indicated that, compared with cement-solidified soil, the hydration reaction of GCGS-solidified soil was more complete, capable of reacting with SiO2 in the silt particles through pozzolanic reaction, generating more AFt and C-S-H gels, and having a more stable structure.
(3)
The comprehensive benefit evaluation showed that, compared with the pure cement system, the carbon intensity of BGCG and GCGS decreased by 49.5% and 87.4%, respectively, and their raw material costs were slightly lower than those of commercially available P.O42.5 cement. They are thus cementitious stabilizing agents with good performance, economic benefits, and environmental friendliness.

Author Contributions

Conceptualization, Q.Z.; methodology, B.F.; software, Y.C.; validation, S.C. and W.G.; formal analysis, S.C. and W.G.; investigation, S.Y.; resources, S.C.; data curation, Y.C.; writing—original draft preparation, S.C.; writing—review and editing, S.C.; visualization, B.F.; supervision, S.Y. and Q.Z.; project administration, Q.Z.; funding acquisition, Q.Z. All authors have read and agreed to the published version of the manuscript.

Funding

This research is supported by Shanghai Municipal 2023 Annual “Scientific and Technological Innovation Action Plan” Special Project for Scientific and Technological Support of Carbon Peak and Carbon Neutrality (Grant No. 23DZ1202200) and the National Natural Science Foundation of China (Grant No. 42277145).

Data Availability Statement

The data that support the findings of this study are available from the corresponding author upon reasonable request.

Conflicts of Interest

Authors Bo Feng were employed by Greenland Group Infrastructure Co., Ltd. The remaining authors declare that the research was conducted in the absence of any commercial or financial relationships that could be construed as a potential conflict of interest.

References

  1. Shen, W.G.; Liu, Y.; Yan, B.L.; Wang, J.; He, P.T.; Zhou, C.C.; Huo, X.J.; Zhang, W.Z.; Xu, G.L.; Ding, Q.J. Cement Industry of China: Driving Force, Environment Impact and Sustainable Development. Renew. Sustain. Energy Rev. 2017, 75, 618–628. [Google Scholar] [CrossRef]
  2. Wang, D.X.; He, F.J. Investigation on Performance and Mechanism of CO2 Carbonated Slag/Fly Ash Solidified Soils. Chin. J. Rock Mech. Eng. 2020, 39, 1493–1502. (In Chinese) [Google Scholar]
  3. Abdalqader, A.F.; Jin, F.; Al-Tabbaa, A. Development of Greener Alkali-Activated Cement: Utilisation of Sodium Carbonate for Activating Slag and Fly Ash Mixtures. J. Clean Prod. 2016, 113, 66–75. [Google Scholar] [CrossRef]
  4. Cabeza, L.F.; Barreneche, C.; Miró, L.; Morera, J.M.; Bartolí, E.; Fernández, A.I. Low Carbon and Low Embodied Energy Materials in Buildings: A Review. Renew. Sustain. Energy Rev. 2013, 23, 536–542. [Google Scholar] [CrossRef]
  5. Papayianni, I. The Longevity of Old Mortars. Appl. Phys. A 2006, 83, 685–688. [Google Scholar] [CrossRef]
  6. Palacios, M.; Gismera, S.; Alonso, M.M.; de Lacaillerie, J.B.D.; Lothenbach, B.; Favier, A.; Brumaud, C.; Puertas, F. Early Reactivity of Sodium Silicate-Activated Slag Pastes and Its Impact on Rheological Properties. Cem. Concr. Res. 2021, 140, 106302. [Google Scholar] [CrossRef]
  7. Wang, Z.J.; Li, H.J.; Duan, S.S.; Feng, Z.S.; Zhang, Y.L.; Zhang, J.J. Investigation and Utilization of Alkali-Activated Grouting Materials Incorporating Engineering Waste Soil and Fly Ash/Slag. Appl. Sci. 2024, 14, 4915. [Google Scholar] [CrossRef]
  8. O’Connor, J.; Nguyen, T.B.T.; Honeyands, T.; Monaghan, B.; O’Dea, D.; Rinklebe, J.; Vinu, A.; Hoang, S.A.; Singh, G.; Kirkham, M.B.; et al. Production, Characterisation, Utilisation, and Beneficial Soil Application of Steel Slag: A Review. J. Hazard. Mater. 2021, 419, 126478. [Google Scholar] [CrossRef]
  9. Wu, Y.L.; Yang, J.J.; Chang, R.Q. The Design of Ternary All-Solid-Waste Binder for Solidified Soil and the Mechanical Properties, Mechanism and Environmental Benefits of CGF Solidified Soil. J. Clean Prod. 2023, 429, 139439. [Google Scholar] [CrossRef]
  10. Wang, S.; Song, X.P.; Wei, M.L.; Liu, W.; Wang, X.J.; Ke, Y.X.; Tao, T.J. Strength Characteristics and Microstructure Evolution of Cemented Tailings Backfill with Rice Straw Ash as an Alternative Binder. Constr. Build. Mater. 2021, 297, 123780. [Google Scholar] [CrossRef]
  11. Hefni, M.; Ahmed, H.A.M.; Omar, E.S.; Ali, M.A. The Potential Re-Use of Saudi Mine Tailings in Mine Backfill: A Path towards Sustainable Mining in Saudi Arabia. Sustainability 2021, 13, 6204. [Google Scholar] [CrossRef]
  12. Chen, K.Y.; Wu, D.Z.; Zhang, Z.L.; Pan, C.G.; Shen, X.Y.; Xia, L.L.; Zang, J.W. Modeling and Optimization of Fly Ash-Slag-Based Geopolymer Using Response Surface Method and Its Application in Soft Soil Stabilization. Constr. Build. Mater. 2022, 315, 125723. [Google Scholar] [CrossRef]
  13. Bakharev, T. Geopolymer Materials Prepared Using Class F Fly Ash and Elevated Temperature Curing. Cem. Concr. Res. 2005, 35, 1224–1232. [Google Scholar] [CrossRef]
  14. Jawad, Z.F.; Ghayyib, R.J.; Salman, A.J. Microstructural and Compressive Strength Analysis for Cement Mortar with Industrial Waste Materials. Civ. Eng. J. 2020, 6, 1007–1016. [Google Scholar] [CrossRef]
  15. Wang, L.; Chen, L.; Guo, B.L.; Tsang, D.C.W.; Huang, L.B.; Ok, Y.S.; Mechtcherine, V. Red Mud-Enhanced Magnesium Phosphate Cement for Remediation of Pb and As Contaminated Soil. J. Hazard. Mater. 2020, 400, 123317. [Google Scholar] [CrossRef]
  16. Li, W.W.; Liu, W.P.; Wang, B.T.; Zhan, X.J.; Zuo, J.Y.; Shan, Y.B.; Han, S.Y.; Wang, T.Z. Synergistic Effects of Cement-Silica Fume Composite on Expansive Soil Stabilization: Mechanisms, Microstructure, and Durability. Results Eng. 2025, 28, 107811. [Google Scholar] [CrossRef]
  17. Ahmad, J.; Kontoleon, K.J.; Majdi, A.; Naqash, M.T.; Deifalla, A.F.; Ben Kahla, N.; Isleem, H.F.; Qaidi, S.M.A. A Comprehensive Review on the Ground Granulated Blast Furnace Slag (GGBS) in Concrete Production. Sustainability 2022, 14, 8783. [Google Scholar] [CrossRef]
  18. Yi, Y.L.; Qing, X.W.; Zhuang, Y. Utilization of GGBS in Stabilization of Soft Soils and Its Mechanism. Chin. J. Geotech. Eng. 2013, 35, 829–833. (In Chinese) [Google Scholar]
  19. Kitazume, M.; Terashi, M. The Deep Mixing Method; CRC Press: Boca Raton, FL, USA, 2013; pp. 263–367. [Google Scholar]
  20. Xu, G.; Shi, X.M. Characteristics and Applications of Fly Ash as a Sustainable Construction Material: A State-of-the-Art Review. Resour. Conserv. Recycl. 2018, 136, 95–109. [Google Scholar] [CrossRef]
  21. Quan, H.; Yu, H.J.; Yang, X.; Lv, D.P.; Zhu, X.; Li, Y.C. Long-Term Stabilization/Solidification of Arsenic-Contaminated Sludge by a Blast Furnace Slag-Based Cementitious Material: Functions of CaO and NaCl. ACS Omega 2022, 7, 32361–32639. [Google Scholar] [CrossRef]
  22. Bondar, D.; Nanukuttan, S. External Sulphate Attack on Alkali-Activated Slag and Slag/Fly Ash Concrete. Buildings 2022, 12, 94. [Google Scholar] [CrossRef]
  23. Yoo, D.Y.; Banthia, N.; You, I.L.; Lee, S.J. Recent Advances in Cementless Ultra-High-Performance Concrete Using Alkali-Activated Materials and Industrial Byproducts: A Review. Cem. Concr. Compos. 2024, 148, 105470. [Google Scholar] [CrossRef]
  24. Papayianni, I.; Anastasiou, E. Production of High-Strength Concrete Using High Volume of Industrial Byproducts. Constr. Build. Mater. 2010, 24, 1412–1417. [Google Scholar] [CrossRef]
  25. Higgins, D. Briefing: GGBS and Sustainability. Proc. Inst. Civ. Eng. Constr. Mater. 2007, 160, 99–101. [Google Scholar] [CrossRef]
  26. Scheffe, H. Experiments with Mixtures. J. R. Stat. Soc. 1958, 20, 344–360. [Google Scholar] [CrossRef]
  27. Tao, L.; Deng, F.; Xu, K.Q.; Deng, X.Z.; Xu, D.H.; Liao, Y.S.; Tang, S.W. Effect of calcium sulfoaluminate cement on the hydration process and water resistance of phosphogypsum slag cement. J. Mater. Res. Technol. 2024, 33, 5375–5383. [Google Scholar] [CrossRef]
  28. Wang, X.; Chen, G.; Yu, S. Influence of Gypsum Dosage on Microstructure and Brittleness of Slag-Based Cementitious Materials. Constr. Build. Mater. 2019, 225, 863–872. [Google Scholar]
  29. GB/T 8077-2023; Test Methods for Homogeneity of Concrete Admixtures. Standardization Administration of China (SAC): Beijing, China, 2023.
  30. GB/T50123-2019; Standard for Geotechnical Test Methods. Standardization Administration of China (SAC): Beijing, China, 2019.
  31. Zhuang, X.Y.; Chen, L.; Komarneni, S.; Zhou, C.H.; Tong, D.S.; Yang, H.M.; Yu, W.H.; Wang, H. Fly ash-based geopolymer: Clean production, properties and applications. J. Clean Prod. 2016, 125, 253–267. [Google Scholar] [CrossRef]
  32. Di, D.R.; Han, Z.Q. Simple Calculation Method of CO2 Emissions of Cement Clinker. Cem. Technol. 2015, 3, 21–23. (In Chinese) [Google Scholar]
  33. Damineli, B.L.; Kemeid, F.M.; Aguiar, P.S.; John, V.M. Measuring the Eco-Efficiency of Cement Use. Cem. Concr. Compos. 2010, 32, 555–562. [Google Scholar] [CrossRef]
  34. Witzleben, S. Minimizing the Global Warming Potential with Geopolymer-Based Insulation Material with Miscanthus Fiber. Polymers 2022, 14, 3191. [Google Scholar] [CrossRef] [PubMed]
  35. Pedreño-Rojas, M.A.; Fort, J.; Cerny, R.; Rubio-de-Hita, P. Life Cycle Assessment of Natural and Recycled Gypsum Production in the Spanish Context. J. Clean. Prod. 2020, 253, 120056. [Google Scholar] [CrossRef]
Figure 1. Raw materials and their microstructure. (a) GGBS; (b) GGBS’s microstructure; (c) Cement; (d) Cement’s microstructure; (e) Gypsum; (f) Gypsum’s microstructure.
Processes 13 03855 g001
Figure 3. UCS results of mixture ratio groups 1~12.
Processes 13 03855 g003
Figure 4. Interaction effect of two factors on UCS evolution of solidified soil. (a) UCS curves of GGBS and cement. (b) UCS curves of GGBS and gypsum. (c) UCS curves of cement and gypsum.
Processes 13 03855 g004
Figure 5. Interaction effect of three factors on UCS evolution of solidified soil.
Processes 13 03855 g005
Figure 6. Fluidity results of mixture ratio groups 1~10.
Processes 13 03855 g006
Figure 7. Interaction effect of two factors on fluidity evolution of solidified soil. (a) Fluidity curves of GGBS and cement. (b) Fluidity curves of GGBS and gypsum. (c) Fluidity curves of cement and gypsum.
Processes 13 03855 g007
Figure 8. Interaction effect of three factors on fluidity evolution of solidified soil.
Processes 13 03855 g008
Figure 9. Results of alkaline activators selection test.
Processes 13 03855 g009
Figure 10. Strength evolution of solidified soil with different alkaline activators.
Processes 13 03855 g010
Figure 11. σ-ε curves of different curing-aged GCGS-solidified soil.
Processes 13 03855 g011
Figure 12. Main hydration reaction.
Processes 13 03855 g012
Figure 13. Schematic diagram of GCGS gelation process.
Processes 13 03855 g013
Figure 14. XRD patterns of GCGS-solidified soil at 7 and 28 d curing age.
Processes 13 03855 g014
Figure 15. SEM images of cement- and GCGS-solidified soil at the 7 d curing age. (a) Cement-solidified soil; (b) Cement-solidified soil; (c) GCGS-solidified soil; (d) GCGS-solidified soil.
Processes 13 03855 g015
Figure 16. SEM images of cement- and GCGS-solidified soil at the 28 d curing age. (a) Cement-solidified soil; (b) Cement-solidified soil; (c) GCGS-solidified soil; (d) GCGS-solidified soil.
Processes 13 03855 g016
Table 1. Silt soil’s basic physical parameters.
Moisture
Content
(%)
Liquid LimitPlastic LimitCoefficient
of Nonuniformity
Cu
Organic Content
(%)
82.539.432.911.04.7
Table 2. Raw material’s main chemical composition.
Raw MaterialMass Fraction/%
SiO2Al2O3CaOMgOFe2O3SO3Others
GGBS33.0615.0439.299.96-1.90.75
Cement50.828.112.371.23.240.81.8
Table 3. Design parameters of D-optimal mixture design.
Blend CompositionTesting MaterialLower Limit/%Upper Limit/%
AGGBS5080
BCement1535
CGypsum525
Table 4. Mix ratio test design.
Test No.GGBS/%Cement/%Gypsum/%
150.035.015.0
250.025.025.0
357.429.413.2
457.622.420.0
560.035.05.0
660.015.025.0
764.222.812.9
871.815.013.2
972.322.75.0
1080.015.05.0
Table 5. Alkali activator selection and proportioning.
Test No.NaOHNa2SO4NaOH + Na2SO4SS
10.5%
21.0%
31.5%
42.0%
5 0.5%
6 1.0%
7 1.5%
8 2.0%
9 0.5% + 1.0%
10 1.0% + 1.0%
11 2.0%
12 4.0%
Table 6. Mix proportion test results.
Test No.Fluidity/mmFluidity Standard DeviationUCS/MPaUCS Standard Deviation
118182.010.36
218221.370.01
316751.980.04
417031.480.21
514731.370.01
615741.410.09
717951.720.06
817071.600.06
916161.110.18
1018120.340.03
Table 7. Analysis of variance table (X1 represents GGBS, X2 represents cement, and X3 represents gypsum).
SourceF-Valuep-Value
Model GCG13.840.0273
X1X24.500.1241
X1X329.760.0121
X2X311.370.0434
X1X2X34.040.1379
Table 8. Ci of cement, BGCG-, and GCGS-solidified soil.
CategoryCuring Age/dCement Content/%Carbon
Emissions
/(kg·m−3)
UCS/MPaCarbon Intensity
Ci/(kg·m−3·MPa−1)
Cement-solidified soil2815%122.221.07114.22
BGCG-solidified soil2815%45.791.9823.13
GCGS-solidified soil2815%45.803.2614.05
Table 9. Unit price of binder.
MaterialSourceUnit Price/(yuan·t−1)
GGBSMarket price in Yantai, Shandong200
CementThe average price across China327
GypsumA mineral product factory in Zibo, Shandong400
SSA material factory in Jinan, Shandong1500
BGCG-264
GCGS-324
Disclaimer/Publisher’s Note: The statements, opinions and data contained in all publications are solely those of the individual author(s) and contributor(s) and not of MDPI and/or the editor(s). MDPI and/or the editor(s) disclaim responsibility for any injury to people or property resulting from any ideas, methods, instructions or products referred to in the content.