Abstract
This study examines the response of a composite material protection plate with an asymmetrical sandwich structure under low-velocity impact. The protection plate with an asymmetrical sandwich structure is constructed with materials such as polypropylene/glass fiber composites (PP/GFs), a steel plate, and a regular hexagonal honeycomb Al plate (Al honeycomb). The effects of the steel plate and Al honeycomb’s strength and thickness on the deformation behavior of the protection plate, as well as the influence of contact strength on the energy absorption of the Al honeycomb, were studied by combining models and experiments. A finite element model was established using Abaqus/Expliced software (2018), and the mechanical property parameters of each layer were simulated to analyze the greatest impact resistance of the protection plate. The experimental results show that the higher strength of the Al honeycomb can effectively improve the impact resistance of the protection plate. The energy absorption of the steel plate and the Al honeycomb accounted for 34.30% and 20.90%, respectively, and the damage area was more concentrated, making the protection plate more durable.
1. Introduction
In recent years, with the growing severity of global warming, countries around the world have been vigorously developing wind power, photovoltaic (PV) energy, and new energy vehicles to reduce the use of fossil fuels [1,2]. However, the rapid development of this new energy sector has also imposed strict demands on the performance of materials, particularly in the fields of electric vehicles and renewable energy storage systems. There is a need for materials that not only embody lightweight characteristics but also endure the stresses induced by electrochemical reactions and environmental factors.
With the growing demand for lightweight and functional materials in modern industry, especially in the automotive, aerospace, and marine industries, composites are becoming increasingly important as one of the main contributors to weight reduction. Composites uniquely combine the best properties of different materials, allowing them to demonstrate exceptional performance that cannot be achieved by traditional metal alloys, ceramics, or polymer materials alone [3,4]. These materials are classified according to their matrix (metal, polymer, or ceramic) and reinforcement system (fiber reinforced, particle reinforced, or structural composites). Structural composites, especially those designed to withstand high tensile, compressive, and torsional strength, as well as those that meet stiffness requirements, are becoming the preferred choice for technical applications [5,6].
The key difference between sandwich composites and laminated composites is the way they are constructed. Laminated composites are typically composed of two or more layers of a single material with different physical and mechanical properties, while sandwich composites have a sandwich structure consisting of two layers of load-bearing outer layers and a layer of low-density core material in the middle [7,8]. This structure takes advantage of the load-bearing capacity of the outer layer, the sound and heat insulation of the core, and the properties that provide additional stiffness through a thickness increase to create a composite with a significant strength-to-weight ratio. As a result, sandwich composites play a vital role in applications that require structural integrity and high performance, such as aerospace, high-speed trains, and ships [9,10]. With the trend towards larger wind turbines [11], sandwich composites are being more widely used in blades to reduce flutter risk [12].
In recent years, research into sandwich composites has received extensive attention, and many scholars have deeply explored their mechanical properties, design, and applications. For example, recent developments in core material geometry, the creative design of sandwich structures, the mechanical properties of composite sandwich structures, and the behavior of sandwich structures under different loads have been reviewed [1,13] which involve not only basic theories but also the exploration of innovative designs and new applications. These literature surveys highlight the diverse and active research on the potential applications of sandwich composites across a wide range of fields [14].
Due to its light weight, high strength, and good energy absorption characteristics, the asymmetrical sandwich structure protection plate has become a popular research object in aerospace, high-speed train design, and other fields. This structure provides superior energy absorption, impact resistance, and stiffness properties through a combination of glass fiber composites, steel plates, and regular hexagonal honeycomb Al plates, each of which contributes unique advantages to the overall structure.
The purpose of this paper is to deeply explore the response behavior of a protection plate with an asymmetric sandwich structure under low-velocity impact. Through a combination of theoretical analysis and experimental tests, this study will evaluate the mechanical properties, deformation behavior, and energy absorption capacity of the protection plate in detail and provide a scientific basis for its design and optimization in practical applications. In particular, this paper will use the finite element method to carry out numerical simulations, verify the accuracy of the model through experiments, and evaluate the effects of steel plate strength and Al honeycomb strength on the performance of the protection plate in order to fill a gap in existing research and provide a new direction for future engineering applications and research.
2. Materials and Methods
2.1. Composite Fabrication
The protection plate is composed of 1 mm thick PP/GF (Suneng Group Co., Ltd., Suzhou, China); a 980 MPa strength, 0.8 mm thick steel plate (Baosteel Co., Ltd., Shanghai, China); an 18 MPa strength, 5.6 mm thick Al honeycomb (Cansinga Technology Co., Ltd., Harbin, China); and 0.6 mm thick PP/GF. The overall size of the protection plate is 300 × 300 × 8 mm3. First, the glass fiber prepreg, PP resin, TBF980 steel, and 5052-H18 honeycomb aluminum were prepared in order. Then, the paved material was placed into a 180 °C hot press machine for 10 min of hot pressing, followed by cooling at 25 °C for 10 min. Figure 1 shows the structure of the protection plate and honeycomb plate.
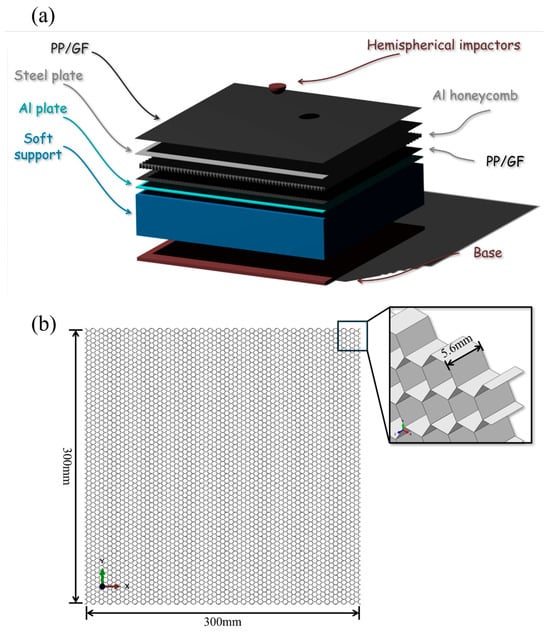
Figure 1.
Schematic diagram: (a) protection plate structure; (b) honeycomb plate structure.
2.2. Characterization
2.2.1. Impact Test of Composites
An impact test was performed in accordance with ASTM D7136 [15]. The sample dimensions for the impact test were a length of 300 mm, a width of 50 mm, and a thickness of 8 mm. A 15 kg hemispherical impactor with a radius of 12.5 mm hit the protective plate from a height of 2.721 m and at a speed of 7.303 m/s. There was an Al plate (Mingtai Al.Industrial Co., Ltd., Zhengzhou, China) and soft support under the protective plate, which were used to simulate a cold plate (6061-T6 Al plate) and battery cells of a car, of which the dimensions are 300 × 300 × 2.4 mm3 and 300 × 300 × 60 mm3, respectively. For each protection plate, five samples were tested at room temperature.
2.2.2. Impact Test of Single Material
In order to calibrate the performance parameters of each material, a single material impact test was performed. The test method was consistent with that of the protection plate. The impact energies tested were 50, 100, 200, and 300 J.
3. Numerical Simulation
3.1. Theory and Formula
In previous studies, a variety of constitutive mathematical models were developed to predict the mechanical properties of metal materials under different deformation conditions, among which the Johnson–Cook constitutive (JC) has been widely used due to its few parameters and suitable deformation behavior in large-deformation, high-strain rate, and high-temperature states. The JC model [16,17,18] is used to simulate the plastic deformation behavior of the steel plate and Al honeycomb implemented in Abaqus, as shown in Equations (1) and (2).
where σp is the equivalent stress; A is the yield strength of the material under the Tr reference strain rate, , and the reference temperature; B and n are the strain hardening parameters; εp and C are the plastic strain and strain rate sensitivity coefficients; is the experimental strain rate, = 0.001 s−1; Te and Tm are the experimental temperature and melting point of the material; and m is the temperature sensitivity coefficient. In addition, an adiabatic temperature rise occurs during the deformation process of the material; the effect of this on its mechanical properties is usually negligible under low-strain rate loading. If the experiment is performed at a reference temperature (typically room temperature) and ignores the effect of the adiabatic temperature rise in the material, Equation (1) can be simplified to the following:
Fracture failure often occurs during a large deformation, is closely related to its stress state (stress triaxiality, Lode angle, etc.), and usually shows a certain strain rate sensitivity and temperature dependence. The JC failure model also considers the effects of strain rate, temperature, and stress triaxiality on the fracture failure of the material, and determines the expression of the damage amount, D, based on the cumulative damage criterion:
where is the plastic deformation increment of a time step; is the fracture strain of the material; the value range of D is 0~1; and the material is D = 1 in the non-destructive state. The fracture strain, , is expressed as
where D1~D5 is the material parameter and σ* is the triaxial degree of stress. If the experiment is performed at a reference temperature (usually room temperature) and ignores the effect of adiabatic temperature rise in the material, Equation (4) can be simplified to
In Abaqus, the Lamina constitutive model and the Hashin criterion are often used for the simulation of fiber composites. The Lamina constitutive model is used to characterize the behavior of a single layer of material, while the Hashin criterion [19,20] is used to predict the failure of the material. This is a model for describing the behavior of anisotropic materials and is particularly suitable for describing fiber composites. In this model, the properties of the material, such as the modulus of elasticity, Poisson’s ratio, and shear modulus, can have different values in different directions. This reflects the anisotropic nature of the composite. The formula is
The Hashin’s criterion predicts the failure behavior of composite materials. It divides the failure of composite materials into four main types: fiber tensile failure, fiber compression failure, matrix tensile failure, and matrix compression failure. Based on these four different types of destruction, the Hashin’s criterion gives four independent destruction criteria. In Abaqus, this criterion can be used to predict the failure behavior of composites.
It is necessary to input XT, XC, YT, YC, ST, S, and other parameters, the physical meaning of which are the tensile and compressive strength in the direction of fiber length, the tensile and compressive strength in the direction of vertical fiber length, and the shear strength in both directions.
Tensile fiber mode:
Compressive fiber mode:
Tensile matrix mode:
Compressive matrix mode:
where α determines the contribution factor of shear stress to the fiber tensile start criterion (0 ≤ α ≤ 1), the default value is 0. It should be noted that α = 1 represents the “One-Way Composite Damage Criterion” proposed by Hashin in 1980.
3.2. Finite Element Analysis
Finite element calculations were used to study the impact behavior of an asymmetrical sandwich protection plate with a fiber composite laminate, a metal sheet, and a metal honeycomb core. The detailed finite element model is shown in Figure 2. The finite element model of the protection plate is constructed in the Abaqus 2018 standard, and each layer of the protection plate is constructed using the shell element S4R, because the shell elements have high computational efficiency in handling thin-walled structures and at the same time can accurately represent the anisotropic properties of the material. The soft supports were built using the solid element C3D8R. The hammer head is modeled as a rigid model with a concentrated point mass and a predefined velocity, while appropriate mesh refinement was performed at the point of impact. The enhanced stiffness relaxation method is used to prevent hourglassing of the reduced integration elements. The dimensions of the finite element model protective plate are the same as those described in the experimental setup [21]. The nodes in the peripheral area of the uppermost PP/GF and the bottom surface of the soft support are fixed, while the impactor is assigned an initial velocity (for instance, 7.303 m/s for 400 J impact energy) in the vertical direction. General contact is used globally, with a penalty friction formula to account for friction, and a friction coefficient of 0.15 at contact points. Adhesive contact is used between the protective plate layers, while the protection plate uses cohesive contact between the layers. The numerical process of finite element calculation is shown in Figure 3 and the specific dimensions and model parameters of each layer are detailed in Table 1. In Table 1, “E” represents Young’s modulus, and “v” represents Poisson’s ratio.
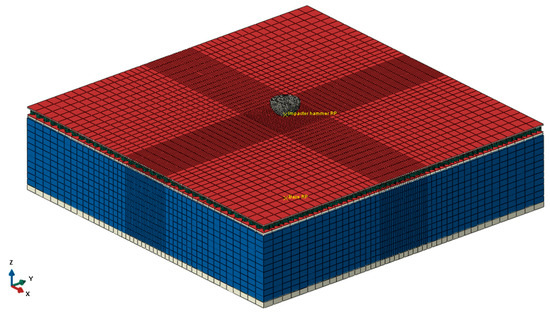
Figure 2.
Details of the finite element model.
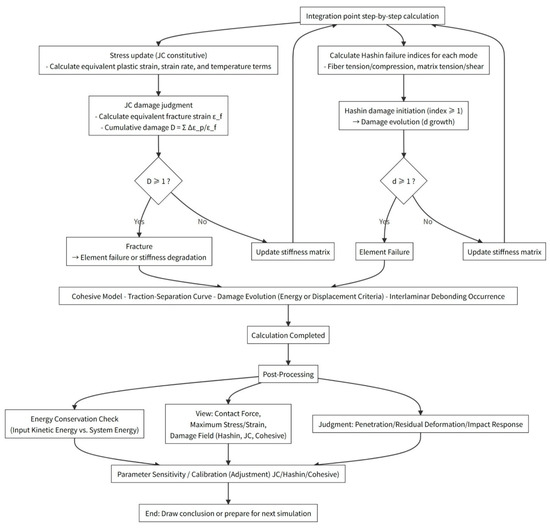
Figure 3.
Finite element calculation numerical process flow chart.

Table 1.
Material constitutive and contact settings.
The test conditions are shown in Table 2 showing a complex structural system. In this system, the benchmark conditions are that the equivalent model was used to model the PP/GF with a thickness of 1 mm; a steel plate with a strength of 980 MPa and a steel plate with a thickness of 0.8 mm; an Al honeycomb with a strength of 18 MPa and a thickness of 5.6 mm; a soft support with PP/GF with a thickness of 0.6 mm; and energy absorption of 150 J at a depression of 4 mm. The overall size of the protection plate is 300 × 300 × 8 mm3. The constitutive parameters of each material are detailed in Table 3 and Table 4. Note that in order to shorten the calculation time, the finite element model uses cohesive contact to simulate the adhesive plate, which leads to an inconsistency between the finite element model and the sample thickness. In order to ensure a consistent thickness, the thickness of the Al honeycomb model was increased by 0.6 mm. The strength and thickness of the steel plate and the Al honeycomb were used as experimental variables for the finite element numerical analysis. In the finite element calculation, when the strength of the steel plate is used as a variable, the other conditions remain unchanged, and only the strength value is changed. The strength of the steel plate is 345, 780, 1180, and 1500 MPa; the thickness of the steel plate is 1, 1.2, 1.4, and 1.6 mm; the strength of the Al honeycomb is 6, 12, 24, and 30MPa; and the thickness of the Al honeycomb is 6, 7, 8, and 9 mm.
Table 2.
Finite element simulation test group.
Table 3.
JC parameters for TBF980, 5052-H18, and 6061-T6 used in the present work.
Table 4.
Hashin’s parameters for PP/GF used in the present work.
The finite element approach adopted in this study couples lamina-level constitutive modeling with Hashin damage for the PP/GF layers, and Johnson–Cook plasticity and failure criteria for the metal layers; layer interfaces are modeled via cohesive/contact formulations. This combination was chosen because (1) the problem involves large-deformation contact and progressive damage (delamination, matrix cracking, ductile metal plasticity), for which explicit dynamics solvers (Abaqus/Explicit) efficiently handle severe contact nonlinearity and element deletion without the convergence issues typical of implicit solvers; (2) Johnson–Cook captures the strain rate sensitivity and cumulative damage effects of metallic faces in impact loading; and (3) Hashin’s criteria are widely used for ply-level composite failure prediction.
4. Results and Discussion
4.1. Calibration of Single Material Performance Parameters
By performing a single material impact test, the consistency between the impact performance of each material and the simulation results is verified in an empirical way. During this process, each material is tested in detail, and the test results are detailed in Table 5. The results show that the relative deviation between the displacement of the Al plate and the simulation results is in the range of 0.82% to 8.29%. Deviation in this range is acceptable, indicating that the finite element model is effective at predicting the actual impact performance.
Table 5.
Single- material simulations and experiments.
Relative deviation (%) was calculated as
4.2. Impact Properties and Calibration of Protection Plate
The damage mechanism of the sandwich composite panels under impact conditions is a complex process, involving a variety of phenomena such as matrix cracking, surface buckling, delamination, fiber shear, and fiber fracture. These different modes of injury often interact with and influence each other, resulting in a complex injury process. Figure 4 shows the observed impact performance under benchmark conditions for shock testing on the protection plate, demonstrating direct evidence of this complexity. In particular, the displacement of the aluminum plate reached 4.06 mm under the impact energy condition of 400 J, while the displacement of the aluminum plate obtained by simulation was 3.71 mm, which indicates that the relative deviation between the simulation results and the test data was only 4.50%. This high degree of consistency verifies the validity and accuracy of the finite element model, indicating that the finite element model has a high reference value in predicting the response behavior of materials under actual impact conditions.
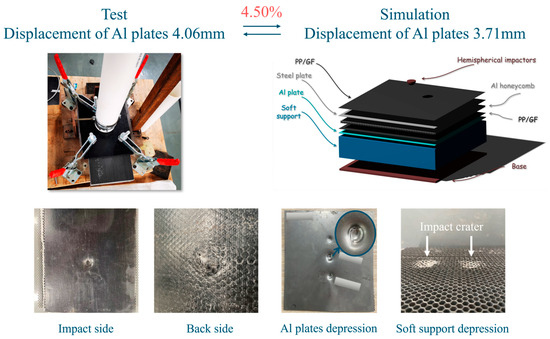
Figure 4.
Comparison chart of test and simulation.
Further simulation analysis also explored the contribution of each component of the protection plate to the total energy absorption, including the proportions of the 1 mm PP/GF, the 0.8 mm TBF980 steel plate, the 5.0 mm 18MPa aluminum honeycomb, and the 0.6 mm PP/GF. Figure 5 shows that 56.8% of the total energy absorption comes from the protection plate itself, with the steel plate and the Al honeycomb accounting for the highest proportions, 34.30% and 20.90%, respectively. In addition, 43.2% of the energy absorption comes from the soft support. This finding highlights the importance of understanding the impact behavior of the steel plate and the Al honeycomb when improving the impact performance of the protection plate and points out that by tuning the performance of these two components, the impact performance of the entire protection plate can be optimized.
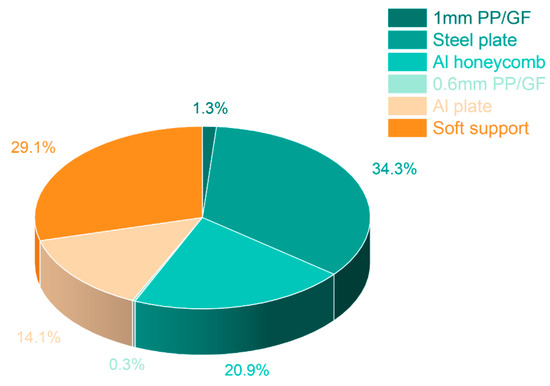
Figure 5.
The proportion of impact energy absorbed by each layer of the protective plate, the Al plate, and the soft support.
In summary, by combining simulation and experimental methods, this study thoroughly analyzes the damage mechanism and energy absorption behavior of the protection plate under high-impact energy conditions, especially the fracture energy changes under extreme impact conditions. The simulation results are in good agreement with the experimental data, emphasizing the reliability of the simulation model in predicting the impact response of sandwich composites in practical applications. These results have important theoretical and practical implications for guiding the design and evaluation of high-performance protective materials, especially under extreme use conditions.
4.3. Effect of Aluminum Honeycomb on the Protection Plate
Through an in-depth study of the effects of different strengths and thicknesses of the Al honeycomb on the performance of the protection plate, a series of important findings have been made. The strength and thickness of the Al honeycomb have a significant impact on the performance of the protection plate; by precisely controlling these two parameters, the impact resistance of the protection plate system can be significantly improved.
First, as shown in Figure 6, the strength of the core Al honeycomb has a decisive impact on the overall performance of the protection plate. With the increase in core strength, the displacement of both the protection plate and the Al plate gradually decreased, and the Al plate was reduced to 2.92 mm when the Al honeycomb’s strength reached 30 MPa. This indicates that the mutual reinforcement effect between the Al honeycomb and the steel plate becomes more significant, which can not only improve the impact resistance of the protection plate, but also effectively reduce the damage area of the soft support. Figure 7 compares the depression surface diameters of 18 MPa and 6 MPa Al honeycomb under the impact of a hemispherical impactor. The results showed that the diameter of the depression surface of the Al honeycomb at 18 MPa was reduced by 33.58% compared with a Al honeycomb at 6 MPa. This means that the high-strength core layer can work more effectively with the steel plate, enhancing the impact resistance of the entire protection plate system.
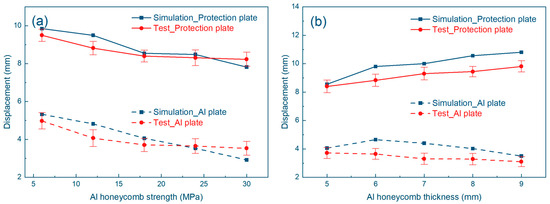
Figure 6.
The impact performance of Al honeycomb on the protection plate is tested and simulated: (a) the strength of the Al honeycomb is used as a variable; (b) the thickness of the Al honeycomb is used as a variable.
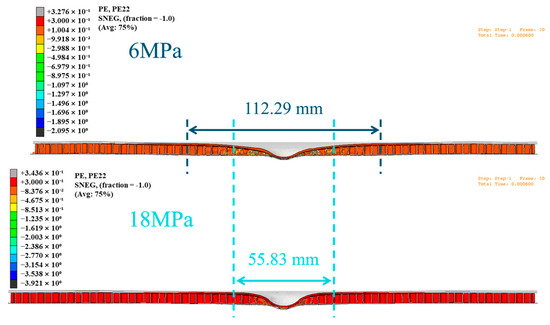
Figure 7.
Simulated comparison of Al honeycomb strengths of 6 MPa and 18 MPa.
Second, the strength of the Al honeycomb also directly affects the deformation form and energy absorption efficiency of the protection plate. The high strength of the Al honeycomb can make the deformation area of the protection plate more concentrated, which can cause the steel plate to produce greater plastic deformation, thus absorbing more energy. In contrast, a low intensity of the Al honeycomb results in the dispersion of the deformation area of the protection plate: the plastic deformation of the steel plate is reduced, and the energy absorption efficiency is also reduced accordingly.
In addition, the increase in the thickness of the Al honeycomb plays a key role in improving the energy absorption performance of the protection plate. The increase in the thickness of the core layer not only significantly improves the energy absorption ratio between the steel plate and the honeycomb, but also significantly reduces the deformation of the cold plate and reduces the damage under impact. This shows that the overall stability and impact resistance of the protection plate system can be effectively improved by adjusting the core thickness.
Finally, the increase in the thickness of the Al honeycomb also provides a larger deformation stroke for the steel plate, thus participating in the energy absorption process. This indicates that the thickness of the Al honeycomb has a direct impact on the deformation behavior and energy absorption capacity of the protection plate, and by optimizing the thickness of the Al honeycomb, the deformation behavior of the protection plate can be effectively controlled, and its performance under different impact conditions can be further improved.
4.4. Effect of the Steel Plate on the Protective Plate
Figure 8 shows the analysis of the effects of the different strengths and thicknesses of steel plates on the protection plate, showing that the increase in the strength of the steel plate is critical to enhancing the performance of the protection plate. A higher steel plate strength can not only reduce the deformation of the Al plate and improve the impact resistance of the protection plate, but also enhance its ability to absorb impact energy. At the same time, the higher strength steel plate also helps to reduce the maximum displacement of the hammer head in the face of greater impact forces, and improves the stability and service life of the protection plate.
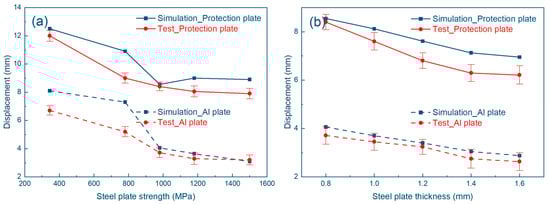
Figure 8.
The impact performance of steel plate on the protection plate is tested and simulated: (a) the strength of the steel plate is used as a variable; (b) the thickness of the steel plate is used as a variable.
The increase in the thickness of the steel plate also has a positive effect on the performance of the protective plate. By increasing the thickness of the protective plate, its ability to absorb impact forces can be significantly improved, allowing the protective plate to maintain its integrity and reduce deformation even under strong impact forces.
Figure 8 demonstrates that variations in the steel face significantly alter both the global response and the energy partitioning within the sandwich protection plate. Mechanically, the steel face serves two distinct roles: (1) it sets the initial contact stiffness and therefore, controls the extent of global bending under the impactor; (2) it provides a metal plastic sink for impact energy once the yield is reached. Increasing the steel face thickness or yield strength leads to a higher peak contact force and a reduced maximum face displacement. However, the manner in which energy is redistributed depends on whether the system response remains bending-dominated or becomes indentation/plasticity-dominated.
When the steel face is relatively thin/soft, the response is characterized by the broad bending of the sandwich (with a large contact patch and distributed deformation), and energy absorption is shared between honeycomb crushing, composite ply damage, and moderate face plasticity. As the steel face stiffness/strength increases, deformation becomes more localized beneath the indenter, increasing face plastic work and concentrating core crushing. This localization raises the steel’s contribution to total absorbed energy while potentially reducing the area over which damage is distributed.
These observations imply a design trade-off: maximizing the steel face contribution (through increased thickness or strength) is effective to reduce deflection but may concentrate damage and increase local penetrative risk; conversely, softer faces promote distributed damage and may improve the survivability of the back structure at the expense of larger deflections. For practical design, therefore, an optimal combination of face thickness, face strength, and core properties should be sought. To aid this, we propose determining (a) peak force and maximum displacement as functions of face thickness and yield strength; (b) the percentage share of absorbed energy by the steel face, honeycomb core, and composite plies across the same parameter space. These quantitative trend maps provide clear guidance for trade-off decisions between stiffness, energy absorption, and damage localization.
In summary, the strength, thickness, and elongation of the steel plate are the key factors affecting the performance of the protection plate. By optimizing these parameters, the impact resistance, stability, and durability of the protection plate can be significantly improved, better meeting the protection needs of different impact conditions.
5. Conclusions
By exploring the effects of an Al honeycomb and steel plates of different strengths and thicknesses on the performance of protection plates, a series of key findings have been made, which are of great value for guiding the design and optimization of high-performance protection systems. The following is a comprehensive summary of the findings.
5.1. Effects of Al Honeycomb
The compressive strength and out-of-plane stiffness of the Al honeycomb core strongly influence the impact response by changing load transfer and energy partitioning between components. Increasing core strength generally reduces central deflection and shifts a larger fraction of the impact work to the plates, whereas a weaker core dissipates a larger share of energy through core crushing and cell buckling. However, the total absorbed energy does not necessarily increase monotonically with core strength: if the plates plastic dissipation capacity is limited or local perforation occurs, total absorbed energy may plateau or even decrease at very high core stiffness. Conversely, an excessively weak core can permit large global deflections that reduce plate plastic work and lower overall energy-absorption efficiency.
Therefore, for a given plate material and thickness there is typically an optimal range of core strength and thickness that maximizes total absorbed energy by balancing plate plasticity and core crushing.
5.2. Effects of Steel Plate
Steel plate strength and thickness also exert coupled effects with the core. Increasing the steel plate strength or thickness generally raises the plates ability to carry and dissipate impact energy through plastic work, reducing the transmitted displacement to underlying supports and increasing resistance to perforation. Yet, there are trade-offs: a very stiff/strong plate may transfer more load to the core and, depending on core properties, either increase or decrease total absorbed energy. In practice, increasing steel thickness typically increases total energy absorption up to the point at which the failure mode shifts, after which further thickening yields diminishing returns. Consequently, steel plate strength and thickness should be optimized together with core properties for a targeted impact energy range.
In summary, the strengths and thicknesses of the Al honeycomb and the steel plate are key factors that affect the performance of the protection plate. By precisely controlling these parameters, the impact resistance of the protection plate can be significantly improved, its stability and durability enhanced, and the protection plate can be optimized to meet the protection needs of different impact conditions. This provides important guidelines for the design of highly effective protection systems.
Author Contributions
In the process of writing this paper, all the authors made important contributions. Conceptualization, C.L. and Y.J.; methodology, F.Z.; software, Y.J.; validation, W.Y., M.Z. and W.L.; formal analysis, J.Z.; investigation, W.Y.; data curation, J.Z.; writing—original draft preparation, F.Z.; writing—review and editing, C.L.; visualization, W.L.; supervision, M.Z.; project administration, C.L. All authors have read and agreed to the published version of the manuscript.
Funding
This research was supported by [Shenzhen Science and Technology Program] (project no. [KJZD20230923114259049]), for which we express our heartfelt thanks.
Data Availability Statement
The original contributions presented in this study are included in the article. Further inquiries can be directed to the corresponding author.
Conflicts of Interest
C.L., Y.J., J.Z., F.Z., W.Y. were employed by the company Shenzhen CANSINGA Technology. The remaining authors declare that the research was conducted in the absence of any commercial or financial relationships that could be construed as a potential conflict of interest.
References
- Bose, B.K. Global warming: Energy, environmental pollution, and the impact of power electronics. IEEE Ind. Electron. Mag. 2010, 4, 6–17. [Google Scholar] [CrossRef]
- Luo, T.; Xuan, A.; Wang, Y.; Li, G.; Fang, J.; Liu, Z. Energy efficiency evaluation and optimization of active distribution networks with building integrated photovoltaic systems. Renew. Energy 2023, 219, 119447. [Google Scholar] [CrossRef]
- Singh, P.; Sheikh, J.; Behera, B.K. Metal-faced Sandwich composite panels: A review. Thin-Walled Struct. 2024, 195, 111376. [Google Scholar] [CrossRef]
- Vlot, A. Impact loading on fiber metal laminates. Int. J. Impact Eng. 1996, 18, 291–307. [Google Scholar] [CrossRef]
- Morinière, F.D.; Alderliesten, R.C. Benedictus, Low-velocity impact energy partition in GLARE. Mech. Mater. 2013, 66, 59–68. [Google Scholar] [CrossRef]
- Sugiman, S.; Crocombe, A.D.; Katnam, K.B. Investigating the static response of hybrid fibre-metal laminate doublers loaded in tension. Compos. B 2011, 42, 1867–1884. [Google Scholar] [CrossRef]
- Gibson, L.J.; Ashby, M.F. Cellular Solids: Structure and Properties, 2nd ed.; Cambridge University Press: Cambridge, UK, 1997. [Google Scholar]
- Bitzer, T. (Ed.) Sandwich design. In Honeycomb Technology: Materials, Design, Manufacturing, Applications and Testing; Springer: Dordrecht, The Netherlands, 1997; pp. 43–69. [Google Scholar]
- Davies, J.M. Lightweight Sandwich Construction; John Wiley & Sons: Hoboken, NJ, USA, 2008. [Google Scholar]
- Zhou, Z.; Liu, Y.; Liao, W.; Yang, G.; Jiang, H.; Sang, J.; Tian, W.; Chai, L. Investigation on the Effect of Energy Release Rate of Aluminized Explosive on the Damage of Underwater Targets. Propellants Explos. Pyrotech. 2024, 49, e202300312. [Google Scholar] [CrossRef]
- Liao, W.; Wang, Q.; Xu, F.; Zhang, M.; Yang, J.; Fan, Y. Investigation on the Aeroelastic Characteristics of Ultra-long Flexible Blades for an Offshore Wind Turbine in Extreme Environments. J. Mar. Sci. Eng. 2025, 13, 2076. [Google Scholar] [CrossRef]
- Liao, W.; Zhang, M.; Yang, J.; Fan, Y.; Du, T.; Deng, Y. A Bidirectional Tuned Mass Damper for Flutter Sup-pression in Ultra-Large Offshore Wind Turbine Flexible Blades. J. Mar. Sci. Eng. 2025, 13, 1776. [Google Scholar] [CrossRef]
- Patekar, V.; Kale, K. State of the art review on mechanical properties of sandwich composite structures. Polym. Compos. 2022, 43, 5820–5830. [Google Scholar] [CrossRef]
- Oterkus, E.; Diyaroglu, C.; De Meo, D.; Allegri, G. 4—Fracture modes, damage tolerance and failure mitigation in marine composites. In Marine Applications of Advanced Fibre-Reinforced Composites; Graham-Jones, J., Summerscales, J., Eds.; Woodhead Publishing: Cambridge, UK, 2016; pp. 79–102. [Google Scholar]
- ASTM D7136/D7136M-15; Standard Test Method for Measuring the Damage Resistance of a Fiber-Reinforced Polymer Matrix Composite to a Drop-Weight Impact Event. Technical Report; American Society for Testing and Materials (ASTM): West Conshohocken, PA, USA, 2015.
- Li, Z.; Zhang, J.; Jackstadt, A.; Kaerger, L. Low-velocity impact behavior of hybrid CFRP-elastomer-metal laminates in comparison with conventional fiber-metal laminates. Compos. Struct. 2022, 287, 115340. [Google Scholar] [CrossRef]
- Keller, S.; Chupakhin, S.; Staron, P.; Maawad, E.; Kashaev, N.; Klusemann, B. Experimental and numerical investigation of residual stresses in laser shock peened AA2198. J. Mater. Process. Technol. 2018, 255, 294–307. [Google Scholar] [CrossRef]
- Johnson, G.R. A constitutive model and data for materials subjected to large strains, high strain rates, and high temperatures. In Proceedings of the 7th International Symposium on Ballistics, The Hague, The Netherlands, 19–21 April 1983; pp. 541–547. [Google Scholar]
- Hashin’s, Z. Failure criteria for unidirectional fiber composites. J. Appl. Mech. 1980, 47, 329–334. [Google Scholar] [CrossRef]
- Hashin, Z.; Rotem, A. A fatigue failure criterion for fiber reinforced materials. J. Compos. Mater. 1973, 7, 448–464. [Google Scholar] [CrossRef]
- Wei, S.; Zhang, X.; Li, Y.; Wang, T.; Huang, Q.; Liu, C.; Guan, H. Study of the dynamic response and damage evolution of carbon fiber/ultra-thin stainless-steel strip fiber metal laminates under low-velocity impact. Compos. Struct. 2023, 330, 117772. [Google Scholar] [CrossRef]
Disclaimer/Publisher’s Note: The statements, opinions and data contained in all publications are solely those of the individual author(s) and contributor(s) and not of MDPI and/or the editor(s). MDPI and/or the editor(s) disclaim responsibility for any injury to people or property resulting from any ideas, methods, instructions or products referred to in the content. |
© 2025 by the authors. Licensee MDPI, Basel, Switzerland. This article is an open access article distributed under the terms and conditions of the Creative Commons Attribution (CC BY) license (https://creativecommons.org/licenses/by/4.0/).