Abstract
The gas oil hydrocracking process is a cornerstone of modern refining, enabling the conversion of heavy fractions into high-value fuels such as diesel, kerosene, LPG, and naphtha. However, despite its economic significance, its considerable water requirements for cooling, washing, and steam generation lead to high utility costs, which may undermine profitability, representing the problem of the study. This study addresses the issue through a techno-economic assessment and resilience analysis of an industrial-scale, mass and energy-integrated gas oil hydrocracking process, utilizing the novel FP2O methodology. The process was modeled in Aspen HYSYS® V14.0 with a capacity of 1.94 Mt/year, assuming a feedstock cost of USD 350/t and a primary product (diesel) price of USD 1539/t. The total capital investment (TCI) was estimated at USD 175.68 million, while utility expenses reached USD 1312.18 million/year, representing nearly half of the total product cost (TPC) of USD 2692.20 million/year. A set of twelve techno-economic and three financial indicators was determined, yielding a gross profit (GP) of USD 97.69 million, profitability after tax (PAT) of USD 64.96 million, and a net present value (NPV) of USD 229.62 million. The payback period (PBP) was 1.41 years, with a depreciable payback period (DPBP) of 2.99 years. The return on investment (ROI) was 36.97%, and the internal rate of return (IRR) reached 44.81%, evidencing strong profitability relative to comparable petrochemical operations. Resilience analysis highlighted sensitivities to fluctuations in product prices, feedstock costs, and normalized variable operating costs (NVOC), identifying a critical NVOC of USD 1435/t against the current operation at USD 1384.74/t, which suggests a narrow buffer before profitability deteriorates. Overall, the findings confirm that mass and energy integration enhances resource efficiency but does not fully mitigate exposure to feedstock and utility price volatility. This work constitutes the first application of FP2O to a mass and energy-integrated gas oil hydrocracking facility, establishing a benchmark for holistic techno-economic and resilience assessments in complex petrochemical systems.
1. Introduction
Modern refining increasingly demands efficient production of middle distillates, which has consolidated gas oil hydrocracking as one of the most important processes within the petrochemical industry [1]. This process uses a catalyst and hydrogen to break down and saturate heavy molecules in gas oil, producing valuable fractions such as light and heavy naphtha, LPG, kerosene, and diesel [2]. The process operates at high temperatures and pressures with a bifunctional catalyst that facilitates both the decomposition of long chains and the hydrogenation of aromatic compounds to improve the quality of the final product [3]. Its growing adoption reflects the economic need to convert high-molecular-weight compounds into commercially attractive products [4].
However, a significant associated challenge involves the disproportionate use of water in these types of technologies. It is estimated that diesel production in cracking configurations can consume between 0.20 and 0.40 L of water per liter of diesel, depending on the complexity of the configuration [5]. This consumption generates significant costs in utilities, especially in cooling and water treatment systems, significantly affecting the process efficiency [6]. Case studies of processes with high water demands, such as PVC suspension production [7] and crude oil refineries [8] demonstrate how inadequate or excessive management of water resources can substantially increase operating costs and even compromise the economic viability of the plant. For example, increasing cooling requirements increases recurring operating costs and expenditures on hydraulic infrastructure [9]. In these cases, the implementation of methodologies associated with technical and economic evaluations has allowed for the identification of optimization opportunities that reduce both water consumption and associated costs without sacrificing productive efficiency [10].
In this context, the economic aspect becomes a decisive factor when designing a new process or retrofitting an existing one, as technical, environmental, energy, and safety decisions are all deeply intertwined with economic considerations [11]. The ability to anticipate and quantify economic performance not only influences process configuration and technology selection but also determines long-term sustainability, operational flexibility, and market competitiveness in an increasingly demanding industrial environment [12]. Consequently, it is essential to evaluate processes through methodologies that explicitly and structurally combine technical and economic perspectives, enabling both accurate performance assessment and robust strategic planning. To address this need, the present study applies a technical-economic evaluation and a technical-economic resilience analysis using the FP2O (Feedstock–Product–Process–Operating) methodology, originally developed by Herrera-Rodríguez et al. (2024) [7] for the evaluation of the suspension PVC production process. This novel methodology, which has demonstrated its applicability to conventional gas oil hydrocracking at an industrial scale thanks to the work conducted by García-Maza et al. (2025) [13], provides a comprehensive set of tools for examining the interaction between process parameters and economic outcomes, ensuring a more resilient and competitive process design. Its application is differentiated from studies of other processes (PVC [7]) by the addition of the break-even point (BEP) analysis.
This article presents a technical and economic evaluation and the technical and economic resilience of an industrial-scale gas oil hydrocracking process integrated in mass and energy. Twelve technical-economic indicators and three financial indicators were evaluated to determine the current commercial status of the process and identify potential optimizations. The technical-economic indicators include break-even point (BEP), on-stream efficiency at BEP, net present value (NPV), gross profit (GP), depreciation-inclusive gross profit (DGP), profit after tax (PAT), accumulated cash flow (CCF), economic potential (EP), payback period (PBP), depreciable payback period (DPBP), internal rate of return (IRR), return on investment (ROI), and annual cost benefit (ACR). The financial indicators are EBT, EBIT, and EBITDA. Furthermore, a techno-economic resilience assessment is carried out through the FP2O approach, which involves producing comparative plots that relate techno-economic and financial indicators to key process variables, including processing rate, production output, product pricing, and feedstock costs.
This approach allows for visualizing the process’s sensitivity to operational and economic fluctuations, as in the study of the industrial production of agar from red algae, where the critical technoeconomic variables were raw material costs, product sales price, and normalized variable operating costs [14]. By integrating technical and economic assessments with resilience analysis, this methodology enables the comprehensive identification and quantification of the relationships between operational, productive, and financial variables, facilitating the early detection of vulnerabilities and opportunities for improvement in complex industrial processes. The novelty of this study is that, for the first time, this methodology is applied to a mass- and energy-integrated gas oil hydrocracking plant. It was previously applied to a non-optimized hydrocracking process [13], closing a knowledge gap in the integration of techno-economic analysis and techno-economic resilience with complex mass- and energy-integrated petrochemical processes.
2. Materials and Methods
2.1. Process Description
The topology of the mass and energy-integrated gas oil hydrocracking process is based on the research developed by García-Maza and González-Delgado (2024) [15], which focuses on a conventional case for a gas oil hydrocracking process that was also simulated with Aspen HYSYS® V14.0. This study provided information related to the fluid packages implemented in each stage, as well as the chemical reactions, hydrogen consumption, and catalyst effects in the hydrocrackers; it also establishes the limitations and assumptions made during modeling in Aspen HYSYS® V14.0, as well as their potential impact on the results. Figure 1 illustrates the stage-by-stage block diagram of the mass-integrated gas oil hydrocracking process, consisting of a hydrotreating and hydrocracking reaction stage, a preliminary separation stage, a makeup and recycling gas stage, a PSA stage, stripping, debutanization, fractionation, and naphtha separation stages, and the makeup and recycling water stage.
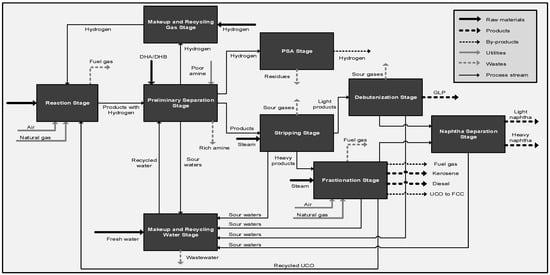
Figure 1.
Block diagram of a mass-integrated gas oil hydrocracking process.
The methodology used to analyze the mass-integrated gas oil hydrocracking process is based on a comprehensive material balance. As shown in Figure 1, the diagram presents the main inputs and outputs associated with the entire system. The main raw material for the process consists of a gas oil load, supplied at a flow rate of 487,545 lb/h at 234 °F and 50 psig [16]. Other significant inputs include air and natural gas, which are primarily used as utility streams in the heaters associated with the reaction and fractionation stages. Following internal mass integration, freshwater is introduced as a raw material during the makeup and recycling water stage. Hydrogen gas is supplied as a raw material from the DHA/DHB section during the preliminary separation stage, while lean amine is fed as a utility stream to the recycled and waste gas absorption columns at the same stage. In addition, hydrogen gas is also introduced as a raw material in the makeup and recycling gas stage. Finally, steam is used as a raw material during the stripping and fractionation stages of the process [17].
In contrast, process outputs are primarily associated with several key waste, product, and by-product streams. These include fuel gases generated by heaters operating during the reaction and fractionation stages; contaminant-rich amine solutions originating from the recycled and waste gas absorption columns in the preliminary separation stage; residual compounds along with the hydrogen by-product stream produced in the PSA (Pressure Swing Adsorption) unit; sour gases released from the stripping and debutanization stages; and the wastewater stream generated during the makeup and recycling water stage [18]. Product streams include the liquefied petroleum gas (LPG) product stream derived from the debutanization process; diesel and kerosene product streams; and fuel gas streams, as well as unconverted oil (UCO) sent to the FCC (Fluid Catalytic Cracking) unit produced during fractionation. and the separated light and heavy naphtha streams obtained in the naphtha separation stage [19]. Furthermore, after mass integration, the process reduces its freshwater consumption from 10.07 kg/s to 7.50 kg/s. Finally, in terms of energy consumption, the overall process requires a final energy input of 3129.95 GJ/h, reflecting the system’s total thermal and operational demands.
In this regard, all process streams were characterized, and the mass flow rates and main components of each stream were determined, as well as the temperature and pressure parameters. Table 1 and Table 2 show the operating conditions and material balance of the most important streams in the reaction stage of the mass and energy-integrated gas oil hydrocracking process.

Table 1.
Operating conditions and material balance of the most important streams in the reaction stage of the mass and energy-integrated gas oil hydrocracking process.

Table 2.
Operating conditions and material balance of the most important streams in the reaction stage of the mass and energy-integrated gas oil hydrocracking process (continued).
Additionally, Table 3 and Table 4 present a detailed overview of the utility streams involved in the mass and energy-integrated gas oil hydrocracking process. These include the makeup hydrogen required to sustain optimal reaction conditions in the hydrocrackers, the fresh makeup water supplied to the washing stages, the medium-pressure steam (mps) utilized in the stripper for separating lighter components, and the low-pressure steam (lps) applied in the fractionator to achieve the desired product split. The utility streams also comprise poor amine solutions for the sour gas absorption towers, as well as air and natural gas feeds that provide the necessary heat supply for process heaters, ensuring stable operation and energy efficiency throughout the plant.

Table 3.
Operating conditions and material balance of utility streams in mass and energy-integrated gas oil hydrocracking process.

Table 4.
Operating conditions and material balance of utility streams in mass and energy-integrated gas oil hydrocracking process (continued).
On the other hand, Table 5 and Table 6 show the streams that indicate the main waste formed in the mass and energy-integrated gas oil hydrocracking process, highlighting the wastewater from the make-up and recycling water stage, the acid gases from the LLV separators, the rich amine from the acid gas absorption towers, the fuel gas from the heaters, and the PSA waste.

Table 5.
Operating conditions and material balance of the waste streams of the mass and energy-integrated gas oil hydrocracking process.

Table 6.
Operating conditions and material balance of the waste streams of the mass and energy-integrated gas oil hydrocracking process (continued).
Now, Table 7 presents the operating conditions and flows of the main product streams (LPG, kerosene, diesel, light naphtha, and heavy naphtha), and Table 8 presents the operating conditions and flows of the by-product streams (hydrogen, UCO to FCC, and fuel gas) in the mass and energy-integrated gas oil hydrocracking process.

Table 7.
Operating conditions and material balance of the product streams of mass and energy-integrated gas oil hydrocracking process.

Table 8.
Operating conditions and material balance of by-product streams in the mass and energy-integrated gas oil hydrocracking process.
2.2. Considerations of Technical-Economic Evaluation for Mass and Energy-Integrated Gas Oil Hydrocracking Process
Table 9 presents a comprehensive overview of the techno-economic parameters considered throughout the analysis. The estimation of the total capital investment (TCI) involved a detailed breakdown of multiple cost components, including not only equipment purchase and installation but also land acquisition and site development, electrical and instrumentation systems, construction of buildings and auxiliary service facilities, as well as expenses related to engineering design, project supervision, and legal procedures. Additionally, contractor fees, allowances for contingencies, working capital requirements, and initial start-up expenditures were incorporated into the assessment [9].

Table 9.
Technical-economic considerations for the integrated gas oil hydrocracking process.
The considerations made for the technical and economic analysis, such as the contingency percentage and worker salaries, are based on the actual heuristics of the process at a plant located in Colombia, serving as a guide to obtaining optimistic results in the gas oil hydrocracking process. The overall calculations were performed in alignment with the methodological framework described by El-Halwagi (2025) [9] and further guided by the cost estimation techniques established by Peters et al. (1991) [20].
2.3. Technical-Economic Evaluation for Mass and Energy-Integrated Gas Oil Hydrocrcaking Process
A techno-economic assessment was conducted to identify the key variables that influence the mass and energy-integrated gas oil hydrocracking process. Key operating parameters—such as pressure, temperature, and the mass composition of the process streams—were established, and the necessary equipment was selected to model the process using Aspen HYSYS® V14.0 simulation software. To design a mass and energy-integrated gas oil hydrocracking facility, it was essential to compile data on equipment costs, anticipated profits, labor expenses, taxes, and land acquisition, as well as to use formulas that facilitate the economic evaluation of the process. The total capital investment (TCI) was estimated with Equation (1), where FCI (Fixed Capital Investment) includes costs associated with equipment, construction, site preparation, control systems, and infrastructure. WCI denotes Working Capital Investment, while SUC represents Start-Up Costs—such as legal services, marketing, and employee training—typically calculated as 10% of the FCI [21].
Costs that are directly linked to processing capacity—such as buildings, piping, and purchased equipment (FOB)—are estimated with Equation (2). In some instances, equipment costs may be sourced from previous studies; in these cases, it is necessary to adjust the cost over time to account for inflation and other economic changes. This adjustment is made using cost indexes, which reflect how equipment prices evolve. The Marshall and Swift (M&S) Equipment Cost Index is commonly applied for this purpose, with the adjustment calculated through Equation (3). Furthermore, operational plant costs are categorized into direct production costs (DPC), fixed charges (FCH), plant overhead (POH), and general expenses (GE), as shown in Equation (4). Annualized fixed costs (AFC) are computed using Equation (5). Operating costs (OC) are calculated on a per-unit product basis. The total annual operating costs (TAC) are determined with Equation (6), which combines both the annualized fixed costs (AFC) and the annualized operating costs (AOC). For a clearer comparison, the annualized operating cost per unit of raw material (AOC) is provided using Equation (7) [9].
where and are the FOB price for B capacity and the FOB price for A capacity, respectively. and are the FOB price at time 2 and the FOB price at time 1, respectively. and are the Equipment Cost Index at time 2 and the Equipment Cost Index at time 1, respectively. , , and are the initial value of the FCI, the salvage value of the FCI, and the recovery period (years), respectively. is the mass flow of the raw material (t/year) [20].
Now, the normalized variable operating costs (NVOC) refers to the operating expenses per unit of feedstock and is computed by incorporating AOC, FCH, and the feedstock flow rate, as shown in Equation (8). Furthermore, the operating break-even point (BEP) was estimated using Equation (9), taking into account gas oil processing capacity, along with variations in gas oil prices and feedstock costs when production operates below the plant’s full capacity. Equations (10) and (11) were used to calculate these variables. Essential economic metrics such as depreciation-inclusive gross profit (DGP) were determined using Equation (12), while net plant profit after taxes, interest, and debt payments (PAT) was calculated with Equation (13). Additionally, the correlation between process profitability and capital investment (CCF) was analyzed using Equation (14), where the process is deemed economically viable if this ratio is below 1 [20].
where VOC is the variable operating costs, and are the selling price of the product (USD/year) and the mass flow of the product (t/year), respectively. is the on-stream efficiency at the BEP. and are the mass flow of the raw material at the BEP and the maximum mass flow of the raw material, respectively. is the tax rate [20].
This evaluation also includes additional essential economic indicators. The Payback Period (PBP), which considers the time value of money, is determined using Equation (15). To incorporate the effect of money’s changing value over time, the Depreciable Payback Period (DPBP) must instead be calculated using a cumulative function across two time periods, as defined in Equation (16). Project profitability is evaluated with Equation (17), while the total accumulated profit over the plant’s operating life is assessed through the Net Present Value (NPV), as shown in Equation (18).
Furthermore, economic potentials are obtained through Equations (19)–(21). The first economic potential () reflects the profit generated by subtracting raw material purchase costs from sales income. The second economic potential () is calculated by deducting utility costs (U) from the first economic potential. The third economic potential () results from subtracting annualized operating costs (AOC) from the revenue generated.
In addition, financial indicators are employed to evaluate the process’s operational performance, especially in terms of pre-tax, pre-interest, and pre-depreciation profitability. Earnings Before Interest and Taxes (EBIT), calculated using Equation (22), reflects the process’s operating profit. Earnings Before Taxes (EBT), determined by Equation (23), indicates the profit before tax deductions. Lastly, Earnings Before Interest, Taxes, Depreciation, and Amortization (EBITDA), calculated through Equation (24), provides a measure of the company’s operating cash flow [9].
where is years. , and are the net profit for year n, the inflation rate, and time in years, respectively. and are the cost of the raw material (USD/year) and the mass flow of the raw material (t/year), respectively [20].
2.4. Technical-Economic Resilience via FP2O Methodology for Mass and Energy-Integrated Gas Oil Hydrocracking Process
A techno-economic resilience strategy was developed and applied through the FP2O (Feedstock-Product-Process-Operation) methodology [7] to assess the influence of specific variables on the performance of the industrial mass and energy-integrated gas oil hydrocracking process, by creating fourteen graphs that relate the technical-economic parameters of the gas oil hydrocracking process with some technical-economic and financial indicators, as shown in Figure 2, where the parameters and indicators used in the FP2O methodology are identified.
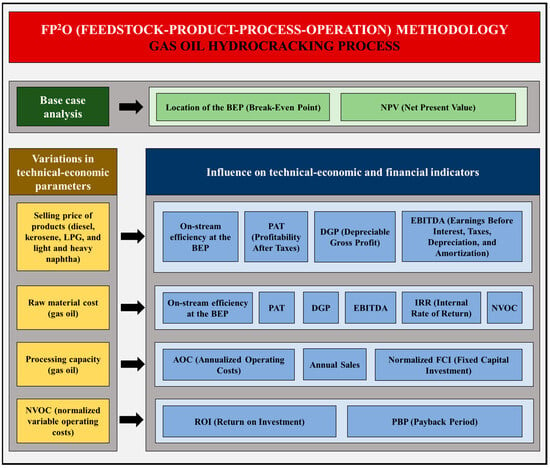
Figure 2.
Application of the FP2O methodology in the gas oil hydrocracking process.
The FP2O (Feedstock–Product–Process–Operation) methodology offers significant advantages over traditional sensitivity or scenario analyses, such as Monte Carlo and NPV (Net Present Value) sensitivity analyses, due to its comprehensive and systemic approach. While the NPV sensitivity method evaluates the impact of individual variations on a single economic variable—modifying prices, costs, or production capacity in isolation—[22] and Monte Carlo analysis generates multiple random simulations to estimate probabilistic distributions of NPV or profitability [23], the FP2O methodology simultaneously incorporates the interaction between raw materials, products, processes, and operating conditions, allowing for the capture of cross-effects and real-world system dependencies. This results in a more faithful representation of economic and technical behavior in the face of multiple fluctuations, avoiding linear simplifications and offering a more robust view of process resilience and flexibility. Furthermore, FP2O allows for the direct identification of critical operating levels and economic compensation points, aspects that traditional approaches only reveal after numerous iterations or under idealized statistical assumptions.
3. Results and Discussion
The metrics used in the techno-economic assessment enabled the determination of results related to the techno-economic resilience of the mass- and energy-integrated gas oil hydrocracking process. These results were compared with other processes in the petrochemical industry.
3.1. Analysis of the Technical-Economic Evaluation of the Mass and Energy-Integrated Gas Oil Hydrocracking Process
To determine the cost of a mass and energy-integrated gas oil hydrocracking unit, and from there establish the technical-economic and financial parameters and indicators of the process, the FOB price of the equipment added after energy and mass integration was added to the value of the conventional gas oil hydrocracking unit [13], based on the analysis of costs associated with improving fuel quality in Colombia [24]. In this way, it was possible to obtain an estimated cost of a gas oil hydrocracking unit integrated by mass and energy in Colombia for 2022, operating with a processing capacity of 1,937,247.91 t/year, of USD 15,359,463.54. Table 10 presents the share of each parameter in the total product cost (TPC) for the mass and energy-integrated gas oil hydrocracking process.

Table 10.
Total product cost for the mass and energy-integrated gas oil hydrocracking process.
Based on the results presented in Table 10, it is evident that the mass and energy-integrated gas oil hydrocracking process demands a considerably higher TPC (USD 2692.20 MM) compared to the conventional gas oil hydrocracking process (USD 2265.97 MM) [13], due to the additional equipment costs. Additionally, the value obtained in the present study is higher than the TPC for a conventional residue fluid catalytic cracking (RFCC) process, where a value of USD 277.97 MM was obtained, which presents a less robust structure, representing approximately one eighth of the total product cost [25].
Additionally, in Table 10, it can be observed that the largest contribution to TPC is from utilities (U), representing approximately 50%, which is due to the high demand for energy resources required by the mass and energy-integrated gas oil hydrocracking process, mainly due to the addition of equipment, such as pumps and exchangers, after mass integration with direct recycling.
Table 11 presents the results of the technical and economic evaluation, including the required initial investment, costs related to the installation of equipment, instrumentation, piping, electrical grid, and services, as well as costs associated with land development and required civil works. Additionally, it includes costs related to legal expenses, contingencies, and contractor fees. Moreover, Table 11 shows the fixed capital investment (FCI), working capital (WCI), start-up costs (SUC), total capital investment (TCI), FCI salvage value, and annualized fixed costs (AFC).

Table 11.
Capital costs for the mass and energy-integrated gas oil hydrocracking process.
Based on the results presented in Table 11, it is evident that the mass and energy-integrated gas oil hydrocracking process requires a higher TCI (USD 175.68 MM) compared to the conventional gas oil hydrocracking process (USD 174.07 MM) [13]. Additionally, for producing hydrocarbon fuel from plastic waste, a lower TCI (USD 118 MM) was obtained than that obtained in the present study, because in the first case, only 7 stages are required [26], but in the present investigation, 9 stages are available for the production of high-value fuels from gas oil. However, the direct production of gasoline and diesel fuels from biomass Via an integrated hydropyrolysis and hydroconversion process exhibits a higher TCI (USD 263.54 MM) than the mass and energy-integrated gas oil hydrocracking process, due to the technologies applied in the first process, specifically to the coupled hydrogen plant, which represents the largest percentage (43.2%) of the capital cost distribution by process areas [27].
Finally, Table 12 and Table 13 present the results of the technical, economic, and financial indicators calculated for the mass and energy-integrated gas oil hydrocracking process. The PBP in this study was 1.41 years, while the DPBP is 2.99 years. However, in other processes, such as aviation fuel production by integrated catalytic deoxygenation and hydrothermal gasification, the PBP was estimated at approximately 3 years [28]. That is, this process takes more than twice as long to recover the investment as the mass and energy-integrated gas oil hydrocracking process.

Table 12.
Technical-economic indicators for the mass and energy-integrated gas oil hydrocracking process.

Table 13.
Financial indicators for the mass and energy-integrated gas oil hydrocracking process.
The GP and DGP values were higher than USD 90 million, which is positive given their considerably high values. On the other hand, the economic potentials 1 (EP1), 2 (EP2), and 3 (EP3) are also significantly high, exceeding USD 1.9 billion, USD 600 million, and USD 90 million, respectively. Given that the CCF is 0.56 years−1, that is, less than 1 year−1, the integrated gas oil hydrocracking process can be considered an economically attractive project. Furthermore, a satisfactory internal rate of return (IRR) of 44.81% can be observed, which is higher than the results obtained for a facility using the hydrotreating/FCC pathway for bio-oil upgrading with hydrogen production Via natural gas reforming, where the IRR is 13.3% [29]; that is, the mass and energy-integrated gas oil hydrocracking process has a high profitability potential relative to its initial cost compared to the hydrotreating/FCC route for bio-oil upgrading.
In addition, the annual cost ratio (ACR) is 32.20 and the return on investment (ROI) is 36.97%. This latter result is higher than the return on investment (ROI) of hydrogen production from natural gas (21.63%) and methanol (19.38%) [30], indicating that, in proportion to the capital invested, the mass and energy-integrated gas oil hydrocracking process is generating higher profits. Additionally, the mass and energy-integrated gas oil hydrocracking plant generates revenue (NPV) of US$229.62 million, which is lower than that of a conventional suspension PVC production process (US$395.53 million). Finally, regarding financial indicators, EBT, EBIT, and EBITDA exceeded US$90 million, which is positive, as these are relatively high values.
3.2. Analysis of Technical-Economic Resilience Through the FP2O Methodology of the Mass and Energy-Integrated Gas Oil Hydrocracking Process
Figure 3 illustrates the technical and economic resilience of the gas oil hydrocracking process after mass and energy integration, considering factors such as plant throughput, yearly fixed costs, annual sales, annual operating costs (AOCs), and variable expenses. The break-even point (BEP) analysis seeks to determine the operating conditions at which total production costs equal process revenues. This figure provides a graphical depiction of the relationship between the process’s expenses and revenues as a function of its processing capacity. Operating well above the BEP indicates that the integrated configuration not only ensures profitability but also provides a margin of economic resilience against fluctuations in plant capacity. From a design perspective, this means that the mass and energy integration strategies adopted effectively reduce operating risks and increase the robustness of the system, allowing the process to sustain profitable performance even under suboptimal operating conditions.
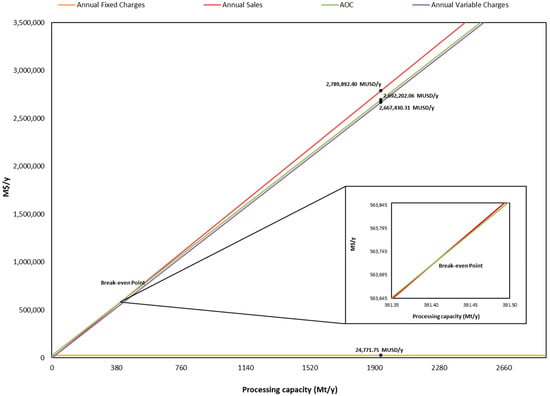
Figure 3.
Resilience of the mass and energy-integrated gas oil hydrocracking process concerning the process processing capacity, annual fixed charges, annual sales, AOC, and annual variable charges.
In Figure 3, annual fixed charges are shown as a horizontal line since they are essentially unaffected by processing capacity. For the mass and energy-integrated gas oil hydrocracking process analyzed, these charges total $24,771.75 million/year. In contrast, variable charges, which amount to $2,667,430.31 million/year for the integrated process, are graphed over the processing range. The fixed and variable costs are integrated by adding the variable charges on top of the fixed cost baseline. This results in the line representing the total annualized operating costs (AOC), which is $2,692,202.06 million/year for the mass and energy-integrated gas oil hydrocracking process. Annual revenues, which amount to $2,789,892.40 million/year for the integrated process, are represented by a line that starts at the origin and increases to the maximum revenue as processing capacity reaches its highest level. The point where the AOC line intersects the annual sales line is known as the break-even point (BEP). When production is below the BEP, the annual operating costs surpass the total sales, meaning the process runs at a loss. Conversely, once the BEP is exceeded, the operation becomes profitable; this is the case for the integrated gas oil hydrocracking plant analyzed.
Figure 4 illustrates the techno-economic resilience of the integrated gas oil hydrocracking process in relation to the plant’s NPV and operational lifetime, which is 20 years, as specified in Table 9, reaching an NPV of USD 229.62 million. This means that after paying all process expenses, project revenues will yield a net value of $229.62 million in present-day dollars. It is important to highlight that the process achieves a positive net present value a little after the fifth year, which is advantageous as it lowers the risk of a project interruption hindering the recovery of the plant’s investment.
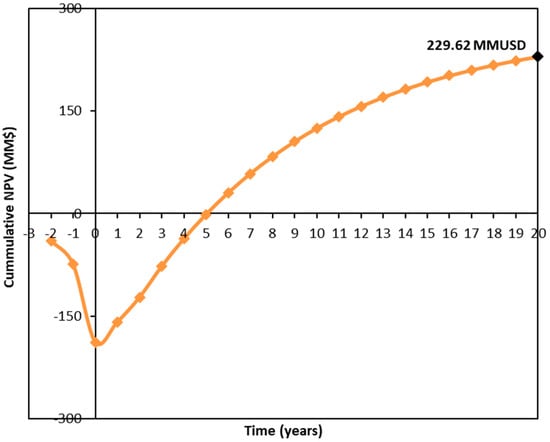
Figure 4.
Resilience of the mass and energy-integrated gas oil hydrocracking process with the net present value.
This outcome implies that the process configuration and operating conditions are economically robust over time. The fact that the integrated hydrocracking plant achieves a positive NPV after approximately five years suggests that the design ensures a relatively short payback period, providing flexibility for process adjustments and lowering financial risk during early operation.
Figure 5, Figure 6, Figure 7 and Figure 8 illustrate the technical and economic resilience of the mass and energy-integrated gas oil hydrocracking process, in relation to fluctuations in the selling prices of its five main products (light and heavy naphtha, kerosene, diesel, and LPG). Figure 5 shows how the combined sales prices of these products correlate with EBITDA and PAT. Figure 6 presents a comparison between the aggregate sales prices, DGP, and PAT. Figure 7 depicts the relationship between the total product sales prices and the on-stream efficiency at BEP. Lastly, Figure 8 contrasts the individual product prices with the corresponding on-stream efficiency at BEP.
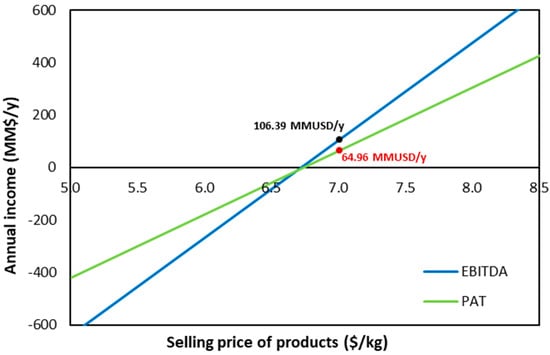
Figure 5.
Resilience of the mass and energy-integrated gas oil hydrocracking process, about the sum of the product sales price, EBITDA, and PAT.
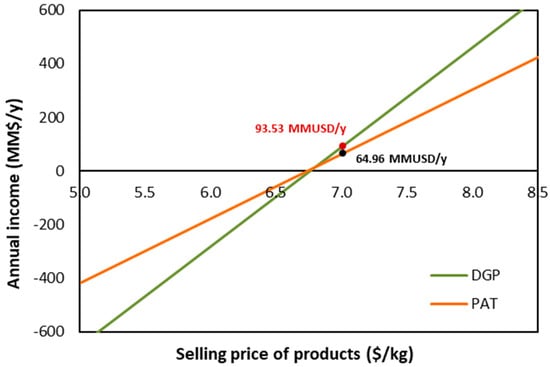
Figure 6.
Resilience of the mass and energy-integrated gas oil hydrocracking process concerning the sum of the product sales price, the DGP, and the PAT.
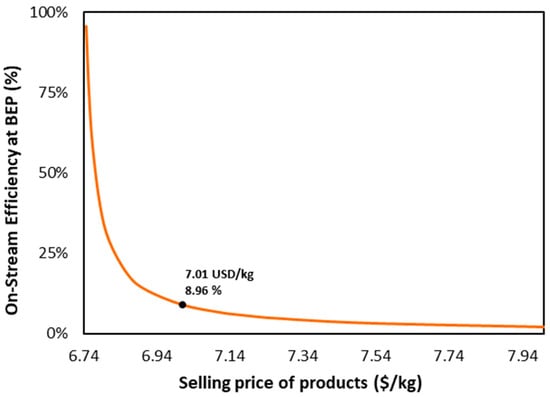
Figure 7.
Resilience of the mass and energy-integrated gas oil hydrocracking process concerning the sum of the product sales price and on-stream efficiency at BEP.
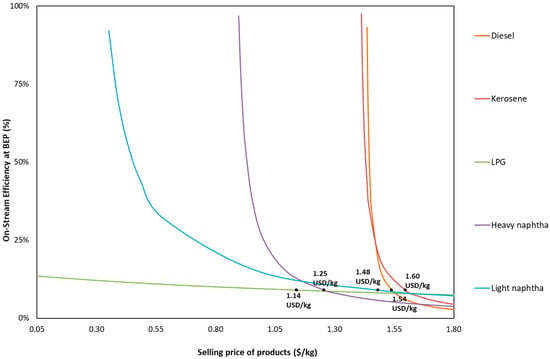
Figure 8.
Resilience of the mass and energy-integrated gas oil hydrocracking process about the sales price of the individual products and on-stream efficiency at BEP.
Figure 5 shows that the EBITDA of the mass and energy-integrated gas oil hydrocracking process is more sensitive to variations in the sum of selling prices of products with respect to the PAT, due to the steeper slope. Therefore, the higher sensitivity of EBITDA to variations in the combined sales price implies that the process profitability is strongly dependent on market conditions, highlighting the importance of operational flexibility and adaptive process design. From a design perspective, this means incorporating strategies that reduce fixed operating costs and enhance energy and mass integration to buffer economic fluctuations.
The critical point in terms of the sum of selling prices of products is the intersection of EBITDA and PAT, producing deficits before USD 6.75/kg. This critical value is based on a hypothetical scenario of the gas oil hydrocracking process studied. This indicates that the process is in a profitable zone, because positive values are being obtained for EBITDA (USD 106.39 million/year) and PAT (USD 64.96 million/year) with a combined selling price of products of USD 7.01/kg. Furthermore, by contrasting the sales price at the critical point with the actual process sales price, it is possible to assess how sensitive the process is to an overall reduction in product selling prices. The greater the distance between the current process condition and the intersection point, the higher its resilience. In this situation, since both values are relatively close, the process shows a high sensitivity to any decline in the combined sales prices of the products.
Figure 6 shows that the DGP of the mass and energy-integrated gas oil hydrocracking process is more sensitive to variations in the sum of selling prices of products with respect to the PAT, due to the steeper slope. Therefore, beyond the slope comparison, these results suggest that process design and operational strategies should prioritize mechanisms that stabilize profitability against product price fluctuations. In practical terms, this could involve implementing flexible operating conditions that allow the hydrocracking unit to adapt to market variations without compromising efficiency.
In this case, the critical point in terms of the sum of selling prices of products is the intersection of DGP and PAT, producing deficits before USD 6.75/kg. This critical value is based on a hypothetical scenario of the gas oil hydrocracking process studied. This indicates that the process is in a profitable zone, because positive values are being obtained for the DGP (USD 93.53 million/year) and the PAT (USD 64.96 million/year) with a combined sales price of USD 7.01/kg. Additionally, comparing the sales price at the critical point with the sales price of the process, the sensitivity of the process to a decrease in the sales price of the products as a whole can be identified. The farther the current operating point is from the intersection, the greater the process resilience. In this scenario, both values are fairly close, indicating that the process is highly sensitive to any reduction in the sum of selling prices of products.
Three regions are shown in Figure 7. The initial range, from USD 6.74/kg to USD 6.84/kg, shows that within this interval, the process’s on-stream efficiency at BEP is highly responsive to minor fluctuations in the combined selling price of the products. Consequently, the process exhibits low resilience in this region; even a slight reduction in product prices leads to a marked rise in on-stream efficiency at BEP, as evidenced by the asymptotic trend observed toward the y-axis in the graph.
The second range, from USD 6.84/kg to USD 7.34/kg, is a transition region and currently hosts the mass- and energy-integrated gas oil hydrocracking process, with an on-stream efficiency at BEP of 8.96% at a sum of selling prices of products of USD 7.01/kg. An acceptable level of profitability can be achieved here because, as this is not a highly sensitive area like the first, it allows for greater operational flexibility in response to changes in sales price. Finally, in the third range, for combined sales prices above USD 7.34/kg, sharp increases in product sales price do not have a significant effect on on-stream efficiency at BEP and are no longer a dependent variable of this criterion. Hence, significant fluctuations in product selling prices within this range will not produce a noticeable effect on the on-stream efficiency at BEP.
This behavior has direct implications for process design and operation. In the first region, where the system exhibits high sensitivity, the process must be operated under strict control of both production and market conditions, since even slight decreases in selling price can make the operation economically unfeasible. This suggests the need for strategies such as dynamic pricing or adaptive control systems to maintain profitability. In contrast, operation within the second region—where the current process is located—offers a balance between economic performance and operational stability. Here, design and control decisions can prioritize reliability and preventive maintenance, as small price fluctuations do not drastically affect profitability. Finally, the third region indicates a plateau of economic robustness. In this zone, design and operational decisions can focus on long-term efficiency improvements or debottlenecking strategies rather than short-term economic responses, as variations in market prices no longer significantly influence the on-stream efficiency at BEP.
Figure 8 shows five curves related to the five main products of the mass and energy-integrated gas oil hydrocracking process. The orange curve represents diesel, the red curve represents kerosene, the green curve represents LPG, the violet curve indicates heavy naphtha, and the blue curve represents light naphtha. Each curve displays the same three regions illustrated in Figure 7; however, the distinction lies in that Figure 8 considers the prices of individual products separately, rather than their combined total as in Figure 7. Based on the graph, it can be determined that the products showing the greatest sensitivity in on-stream efficiency at BEP with respect to variations in sales price of the individual products are, in descending order of sensitivity, diesel (1.54 USD/kg), kerosene (1.60 USD/kg) and heavy naphtha (1.25 USD/kg), because in these three curves with asymptotic behavior with the y axis, the process is located in the first region, which affects the profitability of the process and indicates a lower operability in the face of changes in the sales price of these three products.
On the other hand, the most resilient products are, in descending order of resilience, LPG (USD 1.14/kg) and light naphtha (USD 1.48/kg). This occurs because, in these two curves, the absence of a markedly asymptotic trend toward the y-axis places the process within the second region, where profitability remains acceptable. Ultimately, since this region is less sensitive than the first one, the process can operate with greater flexibility when facing fluctuations in the selling prices of these two products. It is worth noting that the selling prices of the products increased due to the additional expenses related to the equipment added after the mass and energy integration; in this way, expenses and profits are balanced in the mass and energy-integrated gas oil hydrocracking process.
For the highly sensitive streams (diesel, kerosene, heavy naphtha), the design implication is that the plant must include greater operational flexibility and tighter control: larger capacity margins and more precise feed and hydrogen management to avoid excursions that disproportionately erode profitability. For the more resilient products (LPG, light naphtha), the opposite holds: the process can tolerate wider operating windows and be used as a buffer to smooth profitability under price volatility.
Figure 9, Figure 10, Figure 11 and Figure 12 represent the techno-economic resilience of the mass and energy-integrated gas oil hydrocracking process with the feedstock cost (gas oil, demineralized water, hydrogen, and MDEA). Figure 9 relates feedstock cost, EBITDA, and PAT. Figure 10 establishes a relationship between feedstock cost, DGP, and PAT. Figure 11 compares feedstock cost to on-stream efficiency at BEP. Figure 12 establishes a comparison between feedstock cost, IRR, and NVOC.
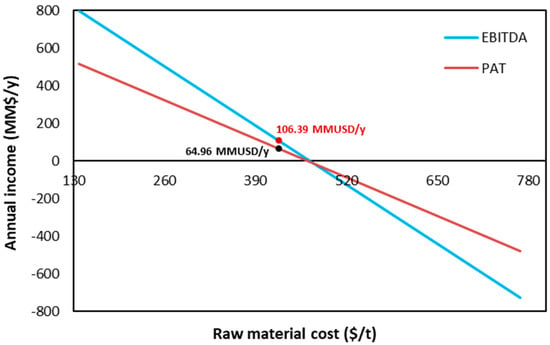
Figure 9.
Resilience of the mass and energy-integrated gas oil hydrocracking process, with the cost of the main raw material, EBITDA, and PAT.
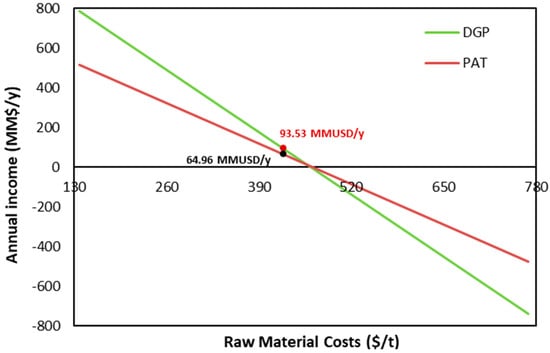
Figure 10.
Resilience of the mass and energy-integrated gas oil hydrocracking process with the cost of the main raw material, DGP, and PAT.
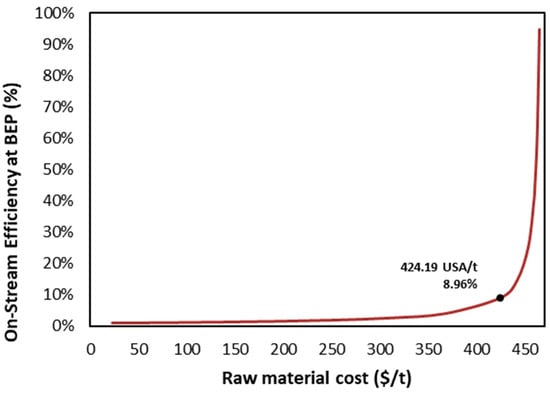
Figure 11.
Resilience of the mass and energy-integrated gas oil hydrocracking process to the cost of the main raw material and on-stream efficiency at BEP.
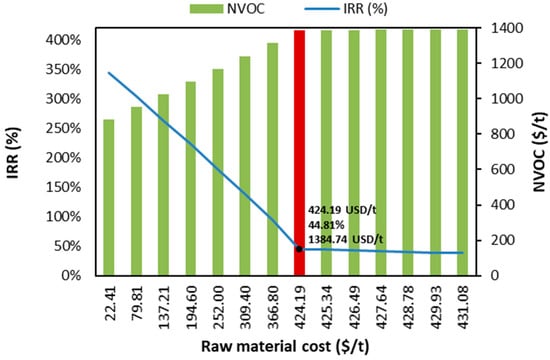
Figure 12.
Resilience of the mass and energy-integrated gas oil hydrocracking process about the cost of the main feedstock, the IRR, and the NVOCs.
Figure 9 shows that the EBITDA of the mass and energy-integrated gas oil hydrocracking process is more sensitive to variations in feedstock costs with respect to the PAT, due to the steeper slope. In this case, the critical point in terms of feedstock cost is the intersection of EBITDA and PAT, producing deficits after USD 455/t. This critical value is based on a hypothetical scenario of the gas oil hydrocracking process studied. This indicates that the process is in a profitable zone, because positive values are being obtained for EBITDA (USD 106.39 million/year) and PAT (USD 64.96 million/year) with a feedstock cost of USD 424.19/t.
Furthermore, by contrasting the feedstock cost at the critical point with that of the base process, it is possible to determine how sensitive the system is to variations in feedstock expenses. The greater the distance between the current operating condition and the intersection, the more resilient the process becomes. In this scenario, both values are fairly close, indicating a high vulnerability of the process to increases in raw material costs. Therefore, beyond the comparison of slopes, this finding implies that process design and operation should focus on strategies to mitigate the economic risk associated with fluctuations in feedstock prices. Additionally, integrating alternative or blended feedstocks with lower price volatility. Thus, the observed sensitivity of EBITDA to feedstock costs highlights the need for a design that prioritizes operational flexibility and cost control measures to maintain profitability under variable market conditions.
Figure 10 shows that the DGP of the mass and energy-integrated gas oil hydrocracking process is more sensitive to variations in feedstock costs with respect to the PAT, due to the steeper slope. In this case, the critical point in terms of feedstock cost is the intersection of DGP and PAT, producing deficits after USD 460/t. This critical value is based on a hypothetical scenario of the gas oil hydrocracking process studied. This indicates that the process is in a profitable zone, because positive values are obtained for the DGP (USD 93.53 million/year) and PAT (USD 64.96 million/year) with a feedstock cost of USD 424.19/kg. Additionally, by comparing the feedstock cost at the critical point with that of the actual process, it is possible to assess how sensitive the system is to rising feedstock prices. The greater the distance between the current process condition and the intersection, the higher the resilience of the system. In this situation, both values are fairly similar, indicating that the process is highly susceptible to increases in raw material costs.
This finding implies that, from a process design and operation perspective, maintaining a stable and cost-efficient feedstock supply is critical to preserving profitability. The high sensitivity of the DGP to feedstock cost variations suggests that even moderate increases in raw material prices can significantly affect the economic performance of the plant. Therefore, design strategies such as feedstock flexibility, optimization of hydrogen consumption, and enhanced heat and mass integration should be prioritized to mitigate the impact of feedstock cost fluctuations. Operationally, continuous monitoring of feedstock quality and dynamic adjustment of process conditions could help sustain favorable margins despite market volatility.
Figure 11 shows three ranges. In the first range (USD 0/t—USD 300/t), sharp decreases in feedstock costs have no significant effect on on-stream efficiency at BEP and are no longer a dependent variable of this criterion. Hence, if feedstock costs experience significant rises or drops within this range, no noticeable effect on the on-stream efficiency at BEP will be observed. The second range (USD 300/t–USD 430/t) is a transition region and currently hosts the mass- and energy-integrated gas oil hydrocracking process, with an on-stream efficiency at BEP of 8.96% at a feedstock cost of USD 424.19/t. An acceptable level of profitability can be achieved here because, as it is not a very sensitive area like the first, it allows for greater operability in the face of changes in feedstock costs. Finally, the third range, corresponding to raw material costs above USD 430/t, shows that, in this region, the on-stream efficiency at BEP becomes highly sensitive to even minor variations in feedstock cost. Consequently, the process exhibits low resilience in this zone; in other words, a slight rise in raw material cost results in a significant increase in the on-stream efficiency at the BEP. This behavior is clearly reflected in the graph, which displays an asymptotic trend toward the y-axis.
This behavior has important implications for process design and operation. In the first region, where changes in feedstock cost have little to no impact on on-stream efficiency at BEP, the process can be considered economically stable; therefore, operating strategies can prioritize maximizing throughput or optimizing energy use without requiring frequent economic adjustments. In the transition region, the process should be closely monitored, as moderate variations in feedstock cost can begin to affect profitability; this suggests the need for flexible operating policies, such as reaction control. In the third region, where small increases in feedstock cost cause disproportionate losses in efficiency, the process design should incorporate preventive measures, such as feed diversification, dynamic pricing contracts, or intensified heat integration, to enhance resilience. Thus, understanding these regions supports proactive decision-making in process operation and design.
Figure 12 illustrates the relationship between the IRR, NVOC, and feedstock costs. The mass and energy-integrated gas oil hydrocracking process has a feedstock cost of USD 424.19/t (see the red bar), an NVOC of USD 1384.74/t, and an IRR of 44.81%. The economic resilience assessment shows that the IRR decreases as feedstock costs rise, whereas NVOC tends to increase with these costs. Consequently, there is an inverse correlation between NVOC and IRR. In simpler terms, when NVOCs represent a large share of the total cash flow, the IRR is likely to decline because higher operating expenses reduce net earnings and, therefore, project profitability. Conversely, when NVOCs are relatively low compared to cash flows, the IRR can improve due to the increase in net income.
This relationship implies that process design and operational strategies should aim to minimize NVOCs through enhanced heat and mass integration and optimized feedstock selection. A lower NVOC not only reduces the variable operating burden but also increases the IRR by maximizing the net cash flow. From a design standpoint, this suggests prioritizing technologies that enhance process intensification. Operationally, maintaining stable feedstock quality and implementing control systems to reduce process variability could help sustain economic resilience under fluctuating market conditions.
Figure 13 and Figure 14 represent the technical-economic resilience of the mass and energy-integrated gas oil hydrocracking process with the plant’s processing capacity. Figure 13 illustrates the correlation among processing capacity, yearly sales, and annual operating costs (AOCs). Figure 14 compares the process capacity and the normalized fixed capital investments (FCIs).
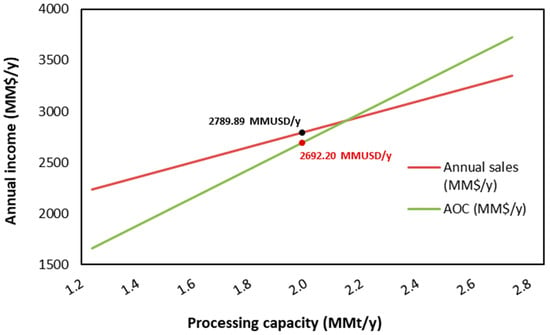
Figure 13.
Resilience of the mass and energy-integrated gas oil hydrocracking process with the process processing capacity, annual sales, and AOC.
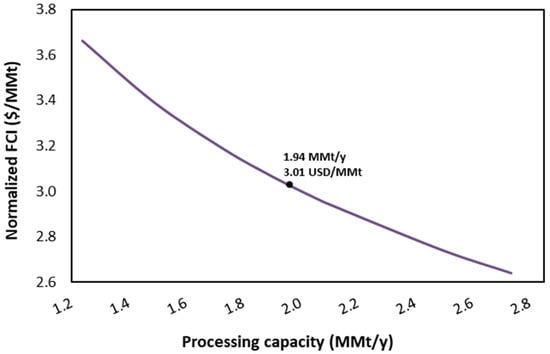
Figure 14.
Resilience of the mass and energy-integrated gas oil hydrocracking process to the processing capacity and the normalized FCI.
Figure 13 illustrates that the AOC of the mass- and energy-integrated gas oil hydrocracking process exhibits greater sensitivity to variations in plant processing capacity than annual sales, as indicated by the steeper slope of the former compared to the latter. In this case, the critical point in terms of processing capacity is the intersection of annual sales and AOC, producing deficits after 2.2 MMt/y. This critical value is based on a hypothetical scenario of the gas oil hydrocracking process studied.
Consequently, when the processing capacity is below this threshold, the annual revenue remains higher than the AOC, representing a favorable condition. In contrast, once the break-even capacity is surpassed, the AOC becomes greater than the annual sales. This indicates that the process is in a profitable zone, because annual sales (USD 2789.89 MM/y) are higher than the AOC (USD 2692.20 MM/y) with a processing capacity of 1.94 MMt/y. Additionally, by comparing the equilibrium processing capacity with the process’s processing capacity, the process’s sensitivity to an increase in its processing capacity can be identified. The further the plant’s processing capacity deviates from the intersection point, the greater its resilience. In this scenario, both values are fairly close, indicating that the process is highly sensitive to any rise in processing capacity.
Therefore, beyond comparing the slopes of annual sales and AOC, this behavior has direct implications for process design and operation. A steeper AOC slope indicates that operating expenses increase more rapidly with plant capacity, suggesting that process optimization should focus on improving energy efficiency and resource utilization at higher throughputs. In practical terms, this means that any scale-up of the hydrocracking unit must be accompanied by design adjustments to prevent a disproportionate rise in operating costs. Operationally, maintaining the process close to the identified break-even capacity ensures economic stability, while exceeding it without structural improvements could lead to diminished profitability and reduced process resilience.
Figure 14 shows an inverse relationship between normalized fixed costs and processing capacity in a mass and energy-integrated gas oil hydrocracking plant. The integrated system was considered to operate at a capacity of 1.94 MMt/y, with a normalized FCI of $3.01 per million tons (MMt). Fixed costs do not vary with production volume, meaning that as capacity expands, these costs are distributed over a greater number of units. Consequently, the fixed cost per unit decreases with higher output, contributing to a reduction in overall unit costs.
The inverse relationship between normalized fixed costs and processing capacity implies that scaling up the hydrocracking plant can significantly improve economic efficiency. From a process design standpoint, this suggests that larger, integrated plants benefit from economies of scale, where the capital and fixed operational expenses are distributed over a greater production volume. In this sense, process integration and capacity optimization must be balanced with reliability and flexibility to ensure that the plant consistently operates near its design capacity. This insight supports decisions related to plant sizing.
Figure 15 and Figure 16 show the technical-economic resilience of the mass and energy-integrated gas oil hydrocracking process concerning NVOC. Figure 15 relates NVOC and ROI, and Figure 16 compares NVOC with PBP.
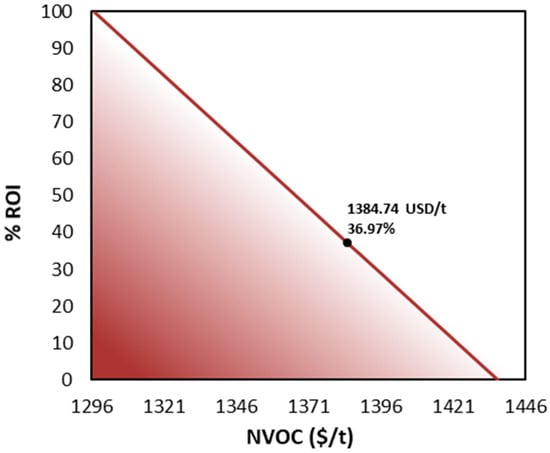
Figure 15.
Resilience of the mass and energy-integrated gas oil hydrocracking process concerning the NVOC and ROI of the process.
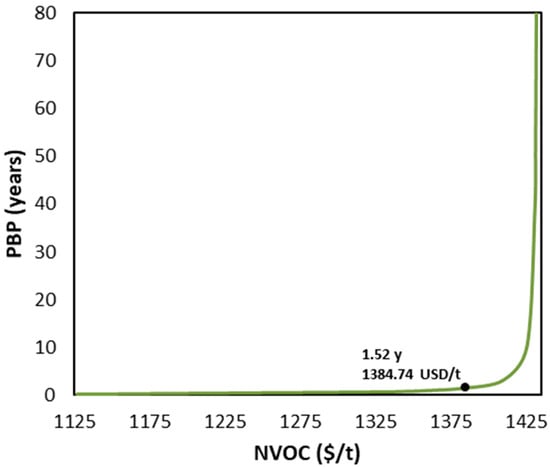
Figure 16.
Resilience of the mass and energy-integrated gas oil hydrocracking process about the NVOC and PBP of the process.
Figure 15 shows the influence of Normalized Variable Operating Costs (NVOC), such as utilities, maintenance and repair, labor, supervision, among others, on the process’s Return on Investment (ROI) percentage. The graph shows a strong linear dependence of the ROI on variable costs, which have a critical value around $1435 per ton, beyond which the ROI becomes zero. This critical value is based on a hypothetical scenario of the gas oil hydrocracking process studied.
In the analyzed mass and energy-integrated gas oil hydrocracking process, the obtained value differs slightly from the present NVOC ($1384.74/t). This variation causes a modest extension of the indicator, thereby reducing the process’s resilience to fluctuations in VOC. Conversely, evaluating the opposite vertex of the triangle reveals that the process could theoretically reach a maximum ROI of 100% if the NVOC approach approximately $1296/t. The ROI value obtained in the mass and energy-integrated gas oil hydrocracking plant (36.97%) is greater than 30%, which reinforces the high economic potential of process optimization.
This behavior indicates that the gas oil hydrocracking process is slightly sensitive to variations in operating costs, meaning that any deviation from the current NVOC affects profitability. From a design and operational standpoint, this implies that special attention should be given to improving energy efficiency, optimizing utility consumption, and implementing preventive maintenance strategies to minimize variability in operating expenses. Additionally, selecting equipment and operating conditions that reduce dependence on utilities or labor-intensive operations can enhance the process’s economic resilience. In other words, process integration and optimization efforts should focus not only on maximizing ROI but also on stabilizing it against cost fluctuations, ensuring more robust and sustainable operation under real industrial conditions.
Figure 16 illustrates the PBP sensitivity and resilience assessment. A key finding is the pronounced dependence of the plant on fluctuations in the NVOC. Because of this strong influence, even small variations in operating costs can determine whether the project remains profitable or faces financial failure. Although this level of sensitivity is unfavorable, it is inevitable when processing feedstocks with highly variable prices such as gas oils. Accordingly, when the operating costs match the products’ selling price, the gross profit before taxes becomes null, preventing recovery of the FCI. Under these conditions, the PBP tends to approach infinity. For the mass- and energy-integrated gas oil hydrocracking plant evaluated, this situation arises when operating costs reach approximately US$1425 per ton. In this so-called out-of-control region, minor changes in operating costs lead to variations in the PBP measured not in years but in decades.
Additionally, a region of relative stability can be detected for NVOC values up to approximately $1325 per tonne, and from there, a transition region can be detected until a loss of control in the process economy occurs, detecting a critical point at approximately $1400 per tonne of gas oil. The process studied is below this critical point, reaching a PBP of 1.52 years with an NVOC of $1384.74/t. This is positive because it does not take many years to recover the investment. However, being so close to the critical point value makes the process less resilient to slight changes in NVOC.
This result implies that, from a process design and operational standpoint, special attention must be given to strategies that minimize the impact of fluctuations in NVOC. In practice, this means prioritizing operating conditions and integration schemes that reduce energy consumption and feedstock losses. Moreover, since the process operates near its critical economic point, even small inefficiencies or increases in utility costs can jeopardize profitability. Therefore, incorporating control systems, optimizing maintenance schedules, and ensuring feedstock quality stability become essential to maintain process resilience and prevent economic instability.
4. Conclusions
The mass and energy-integrated gas oil hydrocracking process evaluated in this study addresses the growing industrial demand for efficient middle distillate production while tackling the economic challenges associated with excessive utility consumption, particularly water and energy. The proposed approach considered both technical-economic evaluation and technical-economic resilience through the FP2O methodology, enabling a structured analysis of operational, productive, and financial variables. The objective was to determine the current commercial viability of the integrated process, identify opportunities for optimization, and assess its capacity to maintain profitability under fluctuating market and operating conditions. By quantifying twelve technical-economic indicators and three financial indicators, the study established a comprehensive performance profile, highlighting the influence of processing capacity, feedstock cost, sales prices, and operating costs on the plant’s profitability and resilience.
The results indicate that the integrated hydrocracking configuration achieves high economic performance, with a gross profit exceeding USD 90 million, a return on investment of 36.97%, an internal rate of return of 44.81%, and a net present value of USD 229.62 million. The payback period was calculated at 1.41 years, and the depreciable payback period at 2.99 years, demonstrating rapid capital recovery compared to other refining and upgrading technologies. However, resilience analysis revealed sensitivity to variations in feedstock costs, product sales prices, and normalized variable operating costs, particularly in proximity to critical points where profitability could be compromised. Despite these vulnerabilities, the process operates well above the break-even point, maintains competitive margins, and offers opportunities for further improvement through optimization of utility use and operational flexibility. This constitutes the first application of the FP2O methodology to a robust, mass and energy-integrated gas oil hydrocracking plant, setting a precedent for the combined use of techno-economic and resilience metrics in complex petrochemical process evaluation.
This study provides valuable insights for refiners and decision-makers by demonstrating a systematic framework to evaluate both the economic performance and resilience of integrated gas oil hydrocracking operations. The FP2O methodology enables stakeholders to identify the most influential variables affecting profitability, such as feedstock cost, product pricing, and operational efficiency, and to quantify their impact under fluctuating market conditions. By applying this structured approach, refiners can make more informed investment and optimization decisions, prioritize strategies that enhance flexibility and resource efficiency, and ultimately improve the long-term sustainability and competitiveness of refining operations. Finally, future research related to the calculation of the sustainability weighted return on investment metric (SWROIM) of the mass and energy-integrated gas oil hydrocracking process is proposed.
Author Contributions
Conceptualization, Á.D.G.-D. and S.R.-F.; methodology, S.G.-M.; software, S.G.-M.; validation, Á.D.G.-D.; formal analysis, S.G.-M. and S.R.-F.; investigation, S.G.-M.; resources, Á.D.G.-D.; data curation, S.G.-M.; writing—original draft preparation, S.G.-M.; writing—review and editing, Á.D.G.-D. and S.R.-F.; visualization, Á.D.G.-D.; supervision, Á.D.G.-D.; project administration, Á.D.G.-D.; funding acquisition, S.R.-F. All authors have read and agreed to the published version of the manuscript.
Funding
This research was funded by the project approved by Resolution 01880 of 2022 and commitment act No. 027 of 2022.
Institutional Review Board Statement
Not applicable.
Informed Consent Statement
Not applicable.
Data Availability Statement
The data that support the findings of this study are available from the corresponding author, Á.D.G.-D., upon reasonable request.
Acknowledgments
The authors thank the Universidad de Cartagena for technical support.
Conflicts of Interest
The authors declare no conflicts of interest.
References
- Iplik, E.; Aslanidou, I.; Kyprianidis, K. Hydrocracking: A Perspective towards Digitalization. Sustainability 2020, 12, 7058. [Google Scholar] [CrossRef]
- Mohanty, S.; Kunzru, D.; Saraf, D.N. Hydrocracking: A Review. Fuel 1990, 69, 1467–1473. [Google Scholar] [CrossRef]
- Gruia, A. Recent Advances in Hydrocracking. In Practical Advances in Petroleum Processing; Springer: New York, NY, USA, 2006; pp. 219–255. [Google Scholar] [CrossRef]
- Robinson, P.R.; Dolbear, G.E. Hydrotreating and Hydrocracking: Fundamentals. In Practical Advances in Petroleum Processing; Springer: New York, NY, USA, 2007; pp. 177–218. [Google Scholar] [CrossRef]
- Sun, P.; Elgowainy, A.; Wang, M.; Han, J.; Henderson, R.J. Estimation of U.S. Refinery Water Consumption and Allocation to Refinery Products. Fuel 2018, 221, 542–557. [Google Scholar] [CrossRef]
- Fan, Y.V.; Varbanov, P.S.; Klemeš, J.J.; Nemet, A. Process Efficiency Optimisation and Integration for Cleaner Production. J. Clean. Prod. 2018, 174, 177–183. [Google Scholar] [CrossRef]
- Herrera-Rodríguez, T.C.; Ramos-Olmos, M.; González-Delgado, Á.D. A Joint Economic Evaluation and FP2O Techno-Economic Resilience Approach for Evaluation of Suspension PVC Production. Results Eng. 2024, 24, 103069. [Google Scholar] [CrossRef]
- Mughees, W.; Al-Ahmad, M. Application of Water Pinch Technology in Minimization of Water Consumption at a Refinery. Comput. Chem. Eng. 2015, 73, 34–42. [Google Scholar] [CrossRef]
- El-Halwagi, M.M. Sustainable Design Through Process Integration: Fundamentals and Applications to Industrial Pollution Prevention, Resource Conservation, and Profitability Enhancement; Elsevier: Amsterdam, The Netherlands, 2025. [Google Scholar]
- Shokri, A.; Sanavi Fard, M. Techno-Economic Assessment of Water Desalination: Future Outlooks and Challenges. Process Saf. Environ. Prot. 2023, 169, 564–578. [Google Scholar] [CrossRef]
- Moreno-Sader, K.; Jain, P.; Tenorio, L.C.B.; Mannan, M.S.; El-Halwagi, M.M. Integrated Approach of Safety, Sustainability, Reliability, and Resilience Analysis via a Return on Investment Metric. ACS Sustain. Chem. Eng. 2019, 7, 19522–19536. [Google Scholar] [CrossRef]
- El-Halwagi, M.M. A Return on Investment Metric for Incorporating Sustainability in Process Integration and Improvement Projects. Clean. Technol. Environ. Policy 2017, 19, 611–617. [Google Scholar] [CrossRef]
- García-Maza, S.; González-Delgado, Á.D. Technical–Economic Assessment and FP2O Technical–Economic Resilience Analysis of the Gas Oil Hydrocracking Process at Large Scale. Sci 2025, 7, 17. [Google Scholar] [CrossRef]
- Herrera-Rodriguez, T.; Parejo-Palacio, V.; González-Delgado, Á.D. Technoeconomic Sensibility Analysis of Industrial Agar Production from Red Algae. Chem. Eng. Trans. 2018, 70, 2029–2034. [Google Scholar] [CrossRef]
- García-Maza, S.; González-Delgado, Á.D. Robust Simulation and Technical Evaluation of Large-Scale Gas Oil Hydrocracking Process via Extended Water-Energy-Product (E-WEP) Analysis. Digit. Chem. Eng. 2024, 13, 100193. [Google Scholar] [CrossRef]
- Qader, S.A.; Hill, G.R. Hydrocracking of Gas Oil. Ind. Eng. Chem. Process Des. Dev. 1969, 8, 98–105. [Google Scholar] [CrossRef]
- Zhou, H.; Lu, J.; Cao, Z.; Shi, J.; Pan, M.; Li, W.; Jiang, Q. Modeling and Optimization of an Industrial Hydrocracking Unit to Improve the Yield of Diesel or Kerosene. Fuel 2011, 90, 3521–3530. [Google Scholar] [CrossRef]
- Weitkamp, J. Catalytic Hydrocracking-Mechanisms and Versatility of the Process. ChemCatChem 2012, 4, 292–306. [Google Scholar] [CrossRef]
- Nekrasov, I.; Tynchenko, V.; Bukhtoyarov, V.; Panfilova, T.; Sokolnikov, A.; Gorodov, A.; Panfilov, I. Simulation of the Hydrocracking Process to Produce Diesel Fuel in the Aspen HYSYS System. AIP Conf. Proc. 2023, 2700, 020054. [Google Scholar] [CrossRef]
- Peters, M.S.; Timmerhaus, K.D.; West, R.E. Plant Design and Economics for Chemical Engineers; McGraw-Hill: New York, NY, USA, 1991. [Google Scholar]
- El-Halwagi, M.M. Overview of Process Economics. In Sustainable Design Through Process Integration; Elsevier: Amsterdam, The Netherlands, 2017; pp. 15–71. [Google Scholar] [CrossRef]
- Marchioni, A.; Magni, C.A. Investment Decisions and Sensitivity Analysis: NPV-Consistency of Rates of Return. Eur. J. Oper. Res. 2018, 268, 361–372. [Google Scholar] [CrossRef]
- Bullard, C.W.; Sebald, A.V. Monte Carlo Sensitivity Analysis of Input-Output Models. Rev. Econ. Stat. 1988, 70, 708–712. [Google Scholar] [CrossRef]
- Arrieta Chacón, S.M. Análisis de Costos Asociados al Mejoramiento de la Calidad del Combustible en Colombia. Bachelor’s Thesis, Universidad de los Andes, Bogota, Colombia, 2006. [Google Scholar]
- Zhou, X.; Zhao, H.; Feng, X.; Chen, X.; Yang, C. Hydrogenation and TMP Coupling Process: Novel Process Design, Techno-Economic Analysis, Environmental Assessment and Thermo-Economic Optimization. Ind. Eng. Chem. Res. 2019, 58, 10482–10494. [Google Scholar] [CrossRef]
- Almohamadi, H.; Alamoudi, M.; Ahmed, U.; Shamsuddin, R.; Smith, K. Producing Hydrocarbon Fuel from the Plastic Waste: Techno-Economic Analysis. Korean J. Chem. Eng. 2021, 38, 2208–2216. [Google Scholar] [CrossRef]
- Tan, E.C.D.; Marker, T.L.; Roberts, M.J. Direct Production of Gasoline and Diesel Fuels from Biomass via Integrated Hydropyrolysis and Hydroconversion Process—A Techno-Economic Analysis. Environ. Prog. Sustain. Energy 2014, 33, 609–617. [Google Scholar] [CrossRef]
- Umenweke, G.C.; Pace, R.B.; Santillan-Jimenez, E.; Okolie, J.A. Techno-Economic and Life-Cycle Analyses of Sustainable Aviation Fuel Production via Integrated Catalytic Deoxygenation and Hydrothermal Gasification. Chem. Eng. J. 2023, 452, 139215. [Google Scholar] [CrossRef]
- Zhang, Y.; Brown, T.R.; Hu, G.; Brown, R.C. Techno-Economic Analysis of Two Bio-Oil Upgrading Pathways. Chem. Eng. J. 2013, 225, 895–904. [Google Scholar] [CrossRef]
- Luk, H.T.; Lei, H.M.; Ng, W.Y.; Ju, Y.; Lam, K.F. Techno-Economic Analysis of Distributed Hydrogen Production from Natural Gas. Chin. J. Chem. Eng. 2012, 20, 489–496. [Google Scholar] [CrossRef]
Disclaimer/Publisher’s Note: The statements, opinions and data contained in all publications are solely those of the individual author(s) and contributor(s) and not of MDPI and/or the editor(s). MDPI and/or the editor(s) disclaim responsibility for any injury to people or property resulting from any ideas, methods, instructions or products referred to in the content. |
© 2025 by the authors. Licensee MDPI, Basel, Switzerland. This article is an open access article distributed under the terms and conditions of the Creative Commons Attribution (CC BY) license (https://creativecommons.org/licenses/by/4.0/).