Abstract
Accurate prediction of gas pipeline incidents through risk factor interdependencies is critical for proactive safety management. This study develops a hybrid SARIMA–association rule mining (ARM) framework integrating time-series forecasting with causal pattern decoding, using 60-month U.S. pipeline incident records (2010–2024) from the Pipeline and Hazardous Materials Safety Administration (PHMSA) database, covering leaks, mechanical punctures, and ruptures. Seasonal Autoregressive Integrated Moving Average (SARIMA) modeling with six-month rolling-window validation achieves precise leak forecasts (MAPE = 14.13%, MASE = 0.27) and reasonable mechanical damage predictions (MAPE = 31.21%, MASE = 1.15), while ruptures exhibit pronounced stochasticity. Crucially, SARIMA incident probabilities feed Apriori-based ARM, revealing three failure-specific mechanisms: (1) ruptures predominantly originate from natural force damage, with underground cases causing economic losses (lift = 3.70) and aboveground class 3 incidents exhibiting winter daytime ignition risks (lift = 2.37); (2) leaks correlate with equipment degradation, where outdoor meter assemblies account for 69.7% of fire-triggering cases (108/155 incidents) and corrosion dominates >50-year-old pipelines; (3) mechanical punctures cluster in pipelines <20 years during spring excavation, predominantly occurring in class 2 zones due to heightened construction activity. These findings necessitate cause-specific maintenance protocols that integrate material degradation laws and dynamic failure patterns, providing a decision framework for pipe replacement prioritization and seasonal monitoring in high-risk zones.
1. Introduction
1.1. Background
Gas distribution pipelines form the final segment of the natural gas delivery system, transporting gas from high-pressure transmission lines to end users, such as homes and businesses. These systems typically operate at low-to-medium pressures (generally below 200 psi), in contrast to high-pressure transmission pipelines that can exceed 1000 psi [1]. The design and material composition of distribution pipelines vary significantly based on construction era, regional standards, and regulatory frameworks. Older systems may contain legacy materials, such as cast iron and bare steel, which are more susceptible to corrosion and leakage. In contrast, modern installations predominantly use corrosion-resistant materials like polyethylene (PE) plastic, which has become the standard for new builds due to its durability and ease of installation [2].
The operational safety of gas distribution systems is governed by stringent regulatory standards. In the United States, the Pipeline and Hazardous Materials Safety Administration (PHMSA) enforces safety protocols under Title 49 of the Code of Federal Regulations, Parts 191 and 192 [3,4,5,6]. These regulations mandate comprehensive integrity management programs that include periodic pressure testing, routine leak surveys, cathodic protection for metallic segments, emergency response planning, incident reporting, and public awareness campaigns. Compliance with these requirements is essential for mitigating risks associated with pipeline failures in densely populated areas.
Despite the generally high safety performance of natural gas transportation compared to other energy carriers, distribution pipeline incidents continue to pose significant risks to public safety and economic stability. According to PHMSA’s incident database, there were 1490 reported gas distribution pipeline incidents in the United States between 2010 and 2024. These events resulted in 134 fatalities, 628 injuries, and direct economic losses exceeding USD 2.963 billion [7,8]. While the annual incident frequency remains relatively low, the societal and financial consequences of individual failures can be substantial, particularly when explosions or fires occur in urban environments. Therefore, the prevention of gas distribution pipeline incidents and the reduction in economic and human losses caused by gas distribution pipeline accidents have attracted a lot of attention.
Normally, pipeline managers and safety decision makers are interested in understanding the reasons for failure in gas pipeline incidents. Thus, numerous studies have been conducted in an effort to identify the risk factors that may lead to undesirable gas distribution pipeline incidents. For example, Duncan & Wang [8,9] assessed the potential for failures in offshore CO2 and natural gas pipelines and then expanded this analysis to include the failure rates of natural gas-gathering and transmission pipelines. Bianchini et al. [2] calculated the average accident rate for US natural gas distribution pipelines over the period from 2004 to 2015. Li et al. [10] investigated the contributing factors related to the severity of natural gas distribution pipeline incidents. Xiao et al. [11] analyzed the factors influencing gas transmission pipeline incidents in the United States and their consequences. The findings from these studies have undoubtedly helped to reduce the number of incidents, as well as the severity of consequences for those affected, by encouraging the implementation of appropriate improvements in pipeline integrity and safety measures.
However, a critical aspect that has received insufficient attention in the analysis of gas distribution pipeline accidents is their potential occurrence patterns, which are vital because they help identify when accidents occur and if there are any patterns. They also help us see if certain events or changes might be linked to accidents, which is important for improving safety measures. Considering temporal attributes of gas pipeline networks, such as fluctuations in pipeline length, diameter, and age, suggests that the likelihood of failure is not static and can evolve over time [1,12]. Therefore, this study aims to employ a hybrid SARIMA-ARM methodology to investigate the potential patterns related to the occurrence of natural gas distribution pipeline incidents based on the PHSMA database. The results are expected to assist pipeline operators and policymakers in devising and executing targeted safety-enhancement strategies. Specifically, by focusing more on safety management during the time window in which accidents frequently occur, the effect of safety management can be maximized even with limited resources. The outcomes of this research could be instrumental in developing these targeted safety strategies.
1.2. Literature Review
In recent years, numerous studies have been conducted to analyze the failure causes, occurrence rates, and risk assessment in gas pipeline systems. Tchórzewska-Cieślak et al. [13] analyzed the failure rate of low- and medium-pressure networks based on failure data from gas networks in a city aggregation area in southeastern Poland, using a Poisson distribution to determine the failure flow of distribution gas networks. Shan et al. [14] integrated historical failure data with modification factors to refine the baseline failure frequency of gas transmission pipelines. These studies typically calculate a baseline failure rate based on historical incident data, which is then adjusted by integrating system-specific factors to yield a more accurate failure probability under given conditions. Pesinis et al. [15,16] utilized nonparametric predictive inference to assess the risk of pipeline ruptures, providing interval estimates for future rupture probabilities. Ruiz-Tagle et al. [17] developed BaNTERA, a Bayesian network model that integrates data and expert knowledge to predict and mitigate the risk of third-party excavations damaging underground natural gas pipelines. Zhao et al. [18] employed an integrated subset simulation approach to determine the corrosion failure rate as it fluctuates over time, while the time-invariant failure rate was ascertained through the application of a modification factor technique. Li et al. [19] propose a data-driven risk assessment framework for oil- and gas-gathering pipelines by integrating Bayesian network (BN) modeling with LightGBM, leveraging machine learning to address real-time data challenges and supporting the digitalization of pipeline safety management.
The success of these methods depends on the accuracy of the models and the baseline failure rate, which can be hard to obtain. This is due to the fact that the related temporal attributes of gas pipeline networks, including fluctuations in pipeline length, diameter, and the age of the pipes, suggest that the likelihood of failure is not static and can evolve over time [20]. Therefore, a comprehensive understanding of risk factors is essential for calculating the failure probability and mitigating the severity of gas pipeline incidents, encompassing internal pressure, pipeline diameter, material defects, external damages, response times, and population distribution [21,22,23]. Duncan et al. [9] highlighted that the primary risk for injuries and fatalities in offshore natural gas pipelines is fires on offshore platforms, rather than pipeline integrity failures. Lam and Zhou [5], in their research, determined that the product of internal pressure and the square of the outside diameter is a significant predictor of the probability of ignition (POI) for onshore natural gas transmission pipeline ruptures, and that the pipeline’s location class does not strongly correlate with the probability of ignition. Xiao et al. [11] indicated that external force damage is the most common cause of accidents, accounting for 41.21% of total incidents, and the accident rate is significantly affected by the operating pressure ratio and the laying position category. Generally, accidents involving larger diameter, higher operating pressure ratio, and higher position category pipelines have more severe consequences. Shen and Zhou [24] conducted a comparative analysis of onshore oil and gas transmission pipeline mileage and incident data from 1995 to 2016 in Canada and the United States, revealing that material, weld, and equipment failures were the predominant causes of incidents in both nations. However, the specific patterns of how these factors contribute to the occurrence of pipeline accidents are not clear [11].
Prior research has focused on analyzing risk factors influencing the occurrence of gas pipeline incidents. The analytical approaches adopted a range from non-parametric methods (e.g., fault tree analysis and Bayesian networks) to predominantly parametric techniques like ordered logit/probit models [25,26,27,28,29,30,31]. While existing approaches have effectively identified gas pipeline incident risk factors, they present notable limitations. These methods excel in analyzing causal mechanisms, failure propagation paths, and qualitative or semi-quantitative risk prioritization based on expert judgment, particularly in complex socio-technical systems where data may be sparse.
In addition, a critical aspect that has received insufficient attention in the analysis of gas distribution pipeline accidents is their potential occurrence patterns [32]. Understanding these patterns is essential for identifying when accidents occur, recognizing recurring trends, and determining whether specific events or system changes are associated with incidents—information that is crucial for enhancing safety measures. Given the temporal evolution of gas pipeline networks, including changes in pipeline length, diameter, and age, the likelihood of failure is not static but varies over time [11,12]. To overcome the limitations of traditional analytical approaches, researchers have increasingly turned to SARIMA-ARM to uncover significant patterns linking incidents and their influencing factors across various industries, such as transportation [32,33], maritime accidents [34,35], and chemical explosion accidents [36]. To the best of our knowledge, few studies have applied SARIMA-ARM to analyze failure patterns in gas pipelines. This study addresses this gap by employing association rule mining to systematically identify causal patterns and their interdependencies in gas distribution pipeline incidents.
The objective of this study is to determine the patterns associated with the occurrence and severity of gas distribution pipeline incidents using a hybrid SARIMA-ARM methodology. Specifically, the SARIMA model is employed to conduct occurrence rate analysis for three distinct incident categories, including leaks, mechanical punctures, and ruptures. Then, association rule mining (ARM) is applied to discern type-specific incident patterns, facilitating targeted safety countermeasures for pipeline system enhancement. These findings enable gas pipeline safety managers to understand different types of incident patterns, implement targeted prevention strategies, and enhance operational reliability.
1.3. Organization
The rest of this paper proceeds as follows. Section 2 presents the preparation of the gas distribution pipeline incident data used for this research, followed by an empirical analysis of the collected data. In Section 3, the SARIMA model, ARM technique, and the information about the dataset details are illustrated. Then, the results derived from the SARIMA and ARM methods are analyzed in Section 4. Finally, the findings of this work are summarized, and some useful suggestions are proposed for further study in this area. The proposed framework of this study is illustrated in Figure 1.
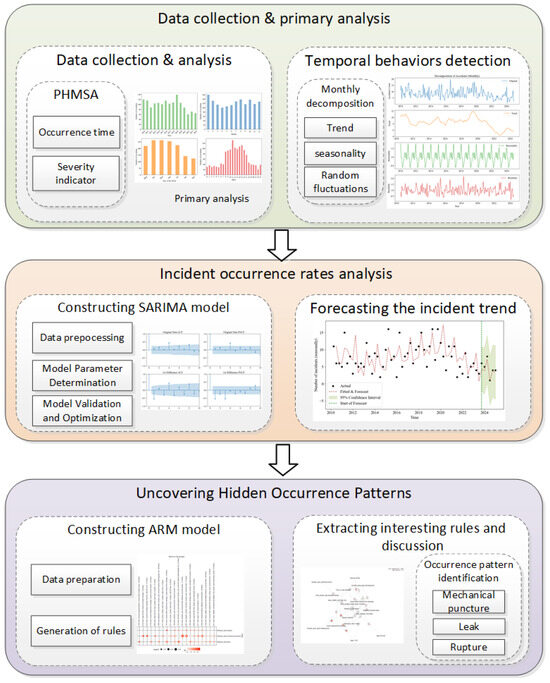
Figure 1.
Framework of the proposed methodology.
2. Data Preparation and Analysis
The gas distribution pipeline incident data used throughout our research is derived from the database published by the PHMSA. The PHMSA database contains detailed records of accident data and has been frequently employed in many studies on safety assessment [2,4,5,10,37].
In this study, gas distribution pipeline incidents that occurred between January 2010 and December 2024 have been collected. The 15-year PHMSA datasets (2010–2024) provide comprehensive coverage of gas distribution pipeline incidents, ensuring statistical robustness and practical relevance for real-world pipeline safety management. This extended temporal range captures long-term trends, seasonal variations, and the impact of regulatory changes, such as the PIPES Act of 2020. The dataset encompasses three primary failure types—leaks, mechanical punctures, and ruptures—collected from various geographical locations across the United States. Environmental conditions significantly influence failure mechanisms. Winter conditions exacerbate natural force damage through ground freezing and thawing cycles, while spring excavation activities increase mechanical puncture risks. Summer corrosion acceleration affects older pipelines, particularly in coastal regions with higher humidity. Before this study, the raw data had been processed to extract the information necessary for this research, including the location state, incident time, release types, total cost, accident cause, etc.
From the 1490 gas pipeline incidents recorded in the 2010–2024 PHMSA database, a rigorous data-quality filtering process was implemented to safeguard analytical integrity and ensure the reliability of subsequent pattern mining. Incidents were excluded based on three predefined criteria to eliminate noise and ambiguity: (1) incomplete attribute information (e.g., missing critical fields such as pipeline age, incident cause, or location type, which are essential for causal pattern analysis); (2) ambiguous failure classification (e.g., incidents where the release type—leak, mechanical puncture, or rupture—could not be definitively confirmed from the original records); (3) extreme outliers (e.g., one-off incidents triggered by unprecedented events, such as accidental damage from rare industrial equipment, which do not reflect generalizable failure patterns). The final analytical dataset, consisting of 842 incidents, includes cases with complete information across all analyzed variables—this ensures reproducible pattern mining while maintaining statistical significance. The primary analysis of the collected data is presented in the following sections. From the perspective of time-series analysis, breaking down a time series into its core elements, comprising the raw data, underlying trend, cyclical patterns, and random fluctuations, is a common practice. This method of dissection enables us to more accurately interpret the data’s inherent structures and more effectively pinpoint long-term trends and seasonal effects. As illustrated in Figure 2, there is a downward trajectory in the monthly count of gas distribution pipeline incidents—this aligns with the post-2020 decline of leaks and mechanical punctures, driven by the 2020 PIPES Act’s safety measures. Obviously, there is a recurring seasonal trend annually. The number of accidents tends to drop off at the year’s start, then ascends to a maximum point nearing year-end, only to decline once more. This is due to late-winter peak gas demand (raising pipeline pressure) and low temperatures (accelerating aging pipeline brittleness), which jointly increase incident risks. Moreover, the dataset displays occasional fluctuations that do not seem to be associated with any identifiable trend or factor. These random fluctuations come from one-off events (e.g., rare industrial equipment damage, extreme weather) and match the residual component of the time-series decomposition.
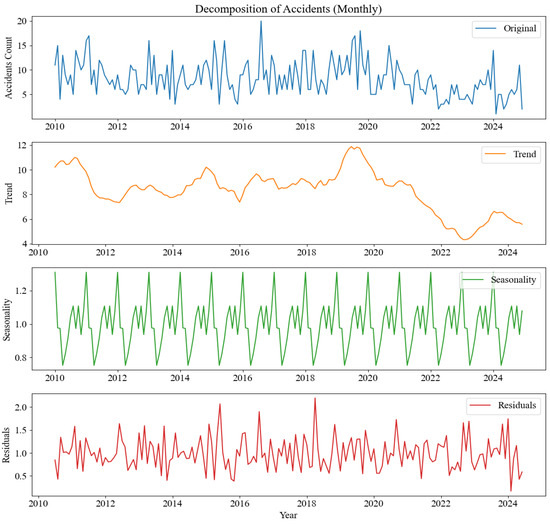
Figure 2.
Monthly decomposition of gas distribution pipeline incidents.
3. Methodology
This study uses a dual analytical framework: SARIMA modeling for occurrence rate analysis of leaks, mechanical punctures, and ruptures, detecting temporal patterns and seasonal variations; and ARM for extracting type-specific incident patterns. This integration offers a comprehensive understanding of incident mechanisms for data-informed safety management.
3.1. Seasonal AutoRegressive Integrated Moving Average (SARIMA)
Seasonal Autoregressive Integrated Moving Average (SARIMA) is a linear statistical model particularly effective for analyzing non-stationary and periodic time-series data. In the proposed methodology, SARIMA is employed to quantitatively evaluate the impact of safety interventions on occurrence rates of gas distribution pipeline incident types (leak, mechanical puncture, and rupture), serving as a foundational step for further analysis. To establish a theoretical foundation for SARIMA, this section begins with an overview of its precursor, the ARIMA model. By first explaining ARIMA’s core principles, readers can more intuitively grasp how SARIMA extends its framework to address seasonal patterns in time-series data.
The ARIMA model integrates both the moving average (MA) and autoregressive (AR) components, with an explicit inclusion of differencing in its structure [38,39,40]. Any non-seasonal time series that exhibits patterns and is not a random white noise can be modeled with ARIMA (p, d, q) models, expressed as follows:
where Yt is the analyzed time series at time t, B is the backshift operator, d is the order of differencing, θq is the operator of MA (q), φp is the AR (p) operator, and at is the error conforming to the normal distribution with a variance of 1 and a mean of 0. The procedures of the ARIMA (p, d, q) model’s forecasting include model identification, parameter estimation, and model application and evaluation; the details can be found in the previous research [41,42]. The SARIMA model extends the ARIMA framework by explicitly incorporating seasonal components and addressing potential seasonal unit roots in time-series data. For a series with periodicity m, the SARIMA model is presented as multiplicative ARIMA (p, d, q) × (pm, dm, qm), and also defends the following:
where dm is the seasonal integration order, which characterizes the degree of seasonal differencing required to achieve stationarity; (1 − Bm)dm is the seasonal differencing operator, which eliminates periodic non-stationarity across corresponding seasonal periods. Φ(B) is the seasonal autoregressive component, representing a stationary pm-order polynomial operator; Θ(B) constitutes an invertible qm-order moving average operator. Note that both Φ(B) and Θ(B) maintain the conventional φ(B) and θ(B) functional forms, respectively. The details can be found in the previous research [38,39,40,42,43]. As suggested by the prior researchers [41], the MAPE (mean absolute percentage error) and MASE (mean absolute scaled error) have been applied to evaluate the performance of the SARIMA model.
The SARIMA modeling process in this study followed a structured, iterative workflow to ensure robustness. The data flow and modeling steps are described as follows: (1) Data preparation and decomposition: The raw monthly incident time series for each failure type was decomposed into trend, seasonal, and residual components to visualize underlying patterns. (2) Stationarity transformation: The augmented Dickey–Fuller (ADF) test was applied to confirm non-stationarity. The series was then differenced both regularly (d = 1) and seasonally (D = 1) to achieve stationarity, a prerequisite for the SARIMA. (3) Model identification: The autocorrelation function (ACF) and partial autocorrelation function (PACF) plots of the differenced series were analyzed to identify potential values for the autoregressive (p), moving average (q), and their seasonal counterpart (P, Q) parameters. (4) Parameter estimation and selection: Four SARIMA (p, d, q) (P, D, Q) models were fitted, and the model with the lowest Akaike information criterion (AIC) and Bayesian information criterion (BIC) values was selected as the final model. (5) Diagnostic checking and validation: The model residuals were examined to ensure they resembled white noise, confirming that no patterns were left unexplained. Finally, the model’s predictive accuracy was rigorously validated on a holdout dataset (the last six seasons) using MAPE and MASE metrics. This systematic workflow ensures a transparent and reproducible modeling process.
3.2. Association Rule Mining (ARM)
In the analysis of natural gas distribution pipeline incidents, the SARIMA model is used to understand the future trend of safety performance of gas distribution pipelines. However, this model does not reveal the specific causes of the accidents, which is why researchers seldom translate these analytical results into practical intervention measures [41]. To better understand and apply these predictive outcomes, it is essential to identify the specific causes that lead to poor performance of gas distribution pipelines.
Data mining refers to extracting potentially useful insights from vast datasets by leveraging techniques from artificial intelligence, machine learning, statistics, and database systems. The association rule is a crucial data-mining technique that has proven effective in uncovering hidden relationships within vast datasets. It emphasizes the identification of patterns within the data rather than hypothesis testing and remains unaffected by missing data [35,41,44]. This research employed the association rule mining (ARM) to detect recurring combinations of contributing factors in gas distribution pipeline incidents.
The process of association rule mining (ARM) consists of two primary stages: identifying frequent itemsets and generating association rules [35]. Initially, all frequent itemsets are extracted from the database. An itemset is deemed a large itemset if its support meets or exceeds the predefined minimum support threshold. Specifically, a k-itemset that satisfies the minimum support is referred to as a frequent k-itemset. Subsequently, the confidence values of these frequent itemsets are computed. If the confidence value is at least as high as the minimum confidence threshold, the itemset is classified as an association rule. Numerous studies in data mining have introduced novel interest measures for rule mining to generate meaningful and insightful rules [45]. In this research, the Apriori algorithm was utilized to produce the rules. This algorithm employs a bottom-up methodology, where frequent itemsets are incrementally expanded by one item at a time through a breadth-first search based on a Hash tree structure.
In this study, we define an itemset as a set of items that includes at least one reported gas distribution pipeline incident that occurred in the U.S. Therefore, for an itemset, I = {i1, i2, i3, …, in} represents a collection of n unique attributes. A transaction dataset D comprises multiple records where each transaction T represents an itemset drawn from the universal item collection I (i.e., T ⊆ I). An association rule is expressed in the format of antecedent (left side) → consequent (right side), or X → Y, where X and Y are subsets of I. Association rules are quantified through three fundamental measures, including support (Supp or S) reflecting occurrence frequency, confidence (Conf or C) representing conditional probability, and lift (L) indicating statistical dependence strength, which can be calculated as follows:
Support measures the frequency of itemsets X and Y co-occurring, indicating their prevalence. Confidence assesses the probability of Y given X, showing rule reliability. Lift evaluates deviation from independence, with values > 1 indicating meaningful associations. These metrics help identify significant patterns by filtering spurious correlations. In this study, the Apriori algorithm for ARM used optimized support, confidence, and lift thresholds through iterative experimentation in the arules package on R 4.5.0.
4. Results
4.1. Forecasting the Incident Trend of Gas Distribution Pipelines
For the purpose of time-series forecasting, the frequency of incidents has been organized on a seasonal basis. A total of 60 seasons’ worth of incident data, spanning from January 2010 to December 2024, has been compiled into three distinct data series: mechanic punctures, leaks, and ruptures. In this analysis, Python 3.13.5 serves as the tool for implementing models such as SARIMA and conducting the necessary diagnostics. Within the dataset encompassing 60 seasons, the final six-season period from September 2023 to December 2024 has been earmarked as the holdout dataset. This segment is crucial for assessing the model’s predictive accuracy.
First of all, the SARIMA model focused on mechanical punctures of a gas distribution pipeline is trained and validated. It is determined that the series is not ‘white noise’ (p < 0.01) and is confirmed to be non-stationary following augmented Dickey–Fuller (ADF) tests. Once the series undergoes first differencing (d = 1) to achieve stationarity, plots of the autocorrelation function (ACF) and partial autocorrelation function (PACF) are generated (see Figure 3).
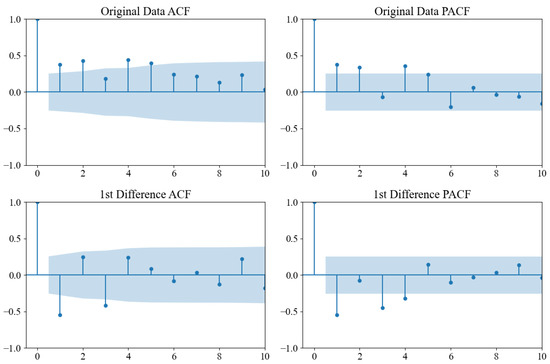
Figure 3.
ACF and PACF graphs for overall mechanical punctures of the gas distribution pipeline.
To determine the value of p and q for the SARIMA model, the AIC and BIC values have been calculated. Thus, the final model is SARIMA (2, 1, 1, 4). The final model’s precision, as indicated by the MAPE at 31.21 and the MASE, stands at 1.15, which falls within a reasonable range. Then, the seasonal mechanical puncture predictions for the period between September 2023 to December 2024 have been derived, complete with a 95% confidence interval, as shown in Figure 4.
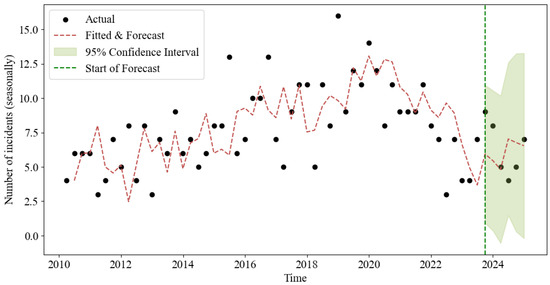
Figure 4.
Forecast for seasonal mechanical punctures of gas distribution pipeline between 2010 and 2024.
Like the mechanical puncture model, the leak model includes AR or MA elements (Figure 5). The dataset is not a ‘white noise’ process. The AIC and BIC values were calculated, and the final model is SARIMA (1, 1, 1, 4). The model’s predictive accuracy, with a MAPE of 14.13 and a MASE of 0.27, is acceptable (Figure 6).
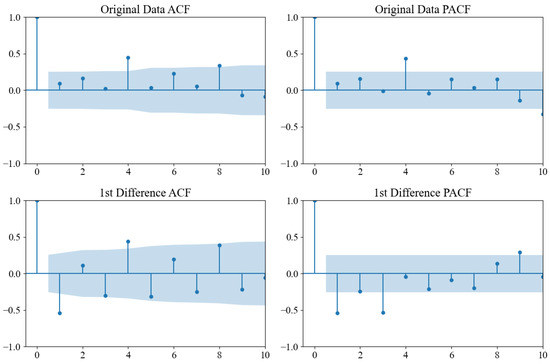
Figure 5.
ACF and PACF graphs for overall leaks of the gas distribution pipeline.
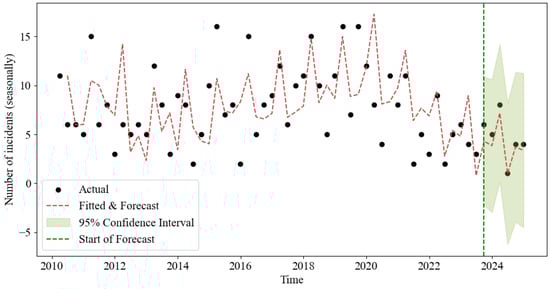
Figure 6.
Forecast for seasonal leaks of gas distribution pipeline between 2010 and 2024.
In contrast to the leak model, which incorporates time-series elements, the rupture model lacks both the autoregressive (AR) and moving average (MA) components, as depicted in Figure 7. The data in question exhibits characteristics of a ‘white noise’ sequence. Consequently, any meaningful forecasting is not feasible, and the series is expected to adhere to its mean value. The mathematical representation for the rupture series is outlined. The final model’s fit quality, as measured by the MAPE at 33.52, is deemed satisfactory, and the MASE value of 0.69 is within an acceptable range. In addition, as proposed by the former researchers, ruptures have more severe consequences than leaks, including impacts on human safety and the environment. Thus, a thorough analysis for ruptures will be conducted in the following sections.
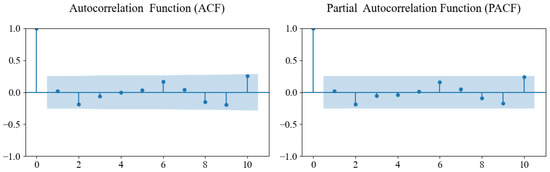
Figure 7.
ACF and PACF graphs for overall rupture data of gas distribution pipelines.
Results show that gas distribution pipeline incidents have an obviously decreasing trend for leaks and mechanical punctures since 2020. This may be due to the development of safety management for the gas industry and the enforcement of the Protecting Our Infrastructure of Pipelines and Enhancing Safety (PIPES) Act of 2020. Note that gas distribution pipeline ruptures do not occur frequently compared with other types of incidents, but the number of lives that were lost and social damage is very high when such a rupture occurs [46]. Therefore, it is essential to distinguish the leading causes of gas distribution pipeline ruptures from other types of incidents, such as leaks and mechanical punctures, in order to implement targeted countermeasures and enhance the safety of pipeline systems.
4.2. Generation of Association Rules
4.2.1. Data Description
To enhance the comprehension of incident trends within the gas distribution pipelines, association rule mining (ARM) is employed to analyze gas distribution pipeline incidents. In this study, we employed a robust dataset that includes 842 incidents related to gas distribution pipelines. Every incident is accompanied by extensive details, enabling us to conduct a comprehensive and meticulous analysis. The data, collected by PHMSA, are of high quality, ensuring the validity of the analysis results. The association rules were generated with the aid of the “arules” package in R and subsequently depicted through the “arulesViz” package.
The dataset employed in this analysis includes comprehensive details such as installation year, system part involved, material used, pipeline facility type, incident area type, class location type, ignition indicator, explosion indicator, injured indicator, fatality indicator, and cause. For the subsequent analysis, the installation year is converted into pipe age to better examine the factors influencing gas distribution pipeline accidents. Additionally, since each gas pipeline has a distinct maximum allowable pressure, this study employs the pressure ratio, defined as the ratio of incident pressure to the maximum allowable operating pressure, to characterize the operational status of gas transmission pipelines. Furthermore, season and time of day are utilized as additional indicators to address the temporal characteristics associated with gas distribution pipelines. Table 1 presents the summary statistics of the gas distribution pipeline rupture data used in this study. The majority of incidents (77.08%) occurred in underground locations, with excavation damage being the leading cause (50.10%). Steel and plastic pipelines were involved in over half of all cases, indicating their widespread use and potential vulnerability. These findings form the basis for identifying high-risk scenarios discussed in the following sections.

Table 1.
Descriptive statistics of the gas distribution pipeline data.
In the study, risk factors were categorized into finer details, including physical factors, operational factors, environmental factors, consequences of incidents, and causes. For instance, physical factors contributing to ruptures encompassed the material involved, like steel, and system parts involved, such as the main and service. The research encompassed a comprehensive analysis involving 11 primary variables and 50 sub-variables for the ARM analysis.
4.2.2. Generation of Rules Using the ARM
In the association rule mining (ARM) model, determining suitable support and confidence thresholds is essential for uncovering significant rules. Proper support and confidence thresholds facilitate the identification of valuable rules [47,48]. Too low thresholds can result in a large number of rules, which are difficult to interpret due to noise and overlap. Conversely, too high thresholds may produce fewer and less interesting rules. The existing literature does not provide specific criteria for setting these thresholds, and researchers typically need to determine the thresholds that can generate interesting rules based on the problem under study [34,41,45,49,50].
To identify meaningful association rules, we systematically experimented with various combinations of support and confidence levels, a common practice in ARM studies due to the absence of universal threshold criteria. Ultimately, we established the minimum thresholds for support and confidence at 0.01 and 0.10, respectively, based on their ability to generate actionable insights while maintaining statistical significance. In addition, given the nature of our data involving infrequent gas distribution pipeline ruptures, increasing the lift threshold further would significantly reduce the number of rules generated. Consequently, we chose a lift threshold of 1.1, which is similar to the values reported in previous studies [34,35], to ensure that we could still identify meaningful association rules despite the rarity of such events. Consequently, a total of 573,421 rules have been produced. While ARM generated 573,421 rules, we implemented a multi-stage filtering process to address rule similarity and comprehensibility concerns. First, we applied minimum thresholds (support = 0.01, confidence = 0.10, lift = 1.1) to eliminate trivial associations. Second, we employed rule clustering based on antecedent similarity to group redundant rules. Third, domain expertise was applied to select the most practically significant rules for each failure type. This systematic approach ensured that the final rule set (169 for ruptures, 14,529 for leaks, and 31,505 for mechanical punctures) contained meaningful, non-redundant patterns that are actionable for pipeline safety management. It should be emphasized that association rule mining (ARM) is an unsupervised machine learning approach designed to uncover significant relationships among items within individual transactions, rather than serving as a substitute for parametric methods.
4.2.3. ARM Rules Analysis
- Association rules for ruptures
The lift values for the top 20 association rules for ruptures exceed 2.27, suggesting a strong association between the itemsets X and Y. The highest lift value identified is 3.70, corresponding to the LHS {Incident_area_type = underground; cause = natural force damage}—this reflects that natural forces (e.g., frost heave) exert concentrated pressure on buried pipelines, leading to ruptures and associated economic losses (per Table 1). Another interesting discovery is that most gas pipeline ruptures were highly associated with steel pipelines, which had an age of at least 50 years and a pressure ratio of no less than 0.8, as shown in Figure 8. This is because long-term operation causes steel fatigue, and high pressure accelerates crack propagation—explaining why over half of ruptures involve steel pipelines over 50 years old. This result suggests that pipeline safety managers should pay more attention to aging steel pipelines in order to prevent rupture incidents. In addition, these rupture incidents mainly result from two distinct causes, natural force damage and other outside force damage, each presenting unique failure characteristics. Natural force-triggered gas pipeline ruptures primarily occur underground, causing economic damage. But gas pipeline ruptures due to other outside force damage often occur aboveground at Class 3 locations during daytime in winter, with ignition risks. This difference lies in more ignition sources and human activity in aboveground Class 3 areas in winter, justifying targeted prevention. Moreover, note that natural force damage and other outside force damage demonstrate significant randomness in failure mechanisms, consequently imparting high unpredictability to rupture incidents.
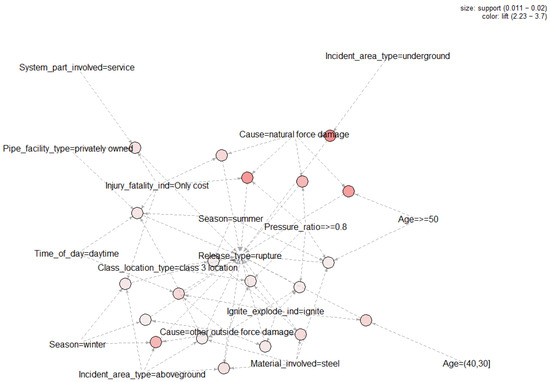
Figure 8.
Association rule network for incidents caused by rupture. Node size represents support (frequency), and color intensity reflects lift (association strength). Dashed arrows connect nodes, illustrating the interrelations among different factors.
- 2.
- Association rules for leaks
A total of 14,529 rules were generated for gas pipeline leaks. Among them, the highest lift value is 2.239 for the LHS {Age ≥ 50; cause = other incident cause}. The results reveal that aging gas pipeline incidents caused by other incidents have a high risk of leakage. To obtain more details, Figure 9 shows a graph-based visualization of the top 20 association rules ranked by lift values for leaks. As shown in Figure 9, there are four typical scenarios of pipeline leakage due to different causes of failure. Firstly, gas pipeline leaks caused by other incident causes are highly associated with steel pipelines with an operational age exceeding 50 years located in class 3 locations. This was validated by the significant lift values linked to their rules. Secondly, district regulator stations or metering stations located in Class 4 areas are highly susceptible to leakage accidents due to equipment failure. This is mainly due to factors such as high population density, frequent traffic, and complex underground facilities. The pipelines and equipment in these areas usually face more complex operating environments and higher safety requirements [51]. Third, leakages due to corrosion are associated with winter, investor-owned pipe facilities, and other pipeline system parts, and may result in consequences such as ignition and explosions. Note that freezing weather threatens the integrity of gas pipelines every year [52]. Lastly, aboveground pipeline leaks in Class 4 locations, caused by pipe, weld, or joint failures, often occur in summer or autumn. These leaks typically involve pipelines with a relatively lower pressure ratio and shorter operational age. Obviously, leakage accidents caused by different reasons for failure have distinct seasonal characteristics. This coincides with the former conclusions. Moreover, a helpful rule suggests that leakages of outside meter or a regular set are prone to lead to fire or an explosion. Therefore, the pipeline safety managers should pay more attention to such incidents. The analysis shows that pipeline physical factors, operational factors, and the surrounding environment mainly influence leak occurrences. Strengthening pipeline safety management can effectively prevent similar accidents and is the reason for the continuous decline in accident numbers in recent years.
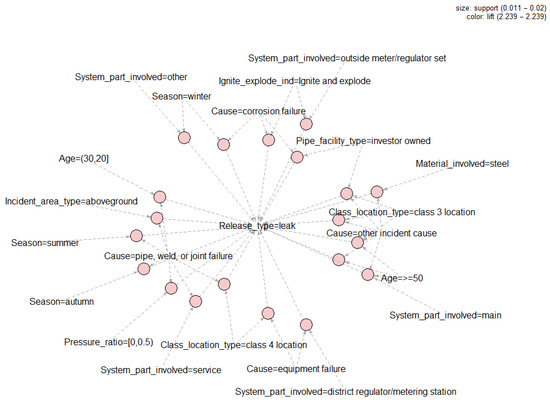
Figure 9.
Association rule network for leaks. Node size represents support (frequency), and color intensity reflects lift (association strength). Dashed arrows connect nodes, illustrating the interrelations among different factors.
- 3.
- Association rules for mechanical punctures
A total of 31,505 rules were generated for gas pipeline mechanical punctures. The highest lift value (2.095) corresponds to the rule {System_part_involved = main, Pipe_facility_type = municipally owned, Cause = excavation damage}, indicating that municipally owned main pipelines affected by excavation damage pose a significant mechanical puncture risk.
As depicted in Figure 10, mechanical puncture incidents demonstrated strong statistical associations with three primary factors, including excavation damage, Class 2 location designation, and seasonal occurrence in spring. This is because spring has more excavation projects, and Class 2 areas (suburban/newly developed) see frequent construction, raising third-party damage risks.
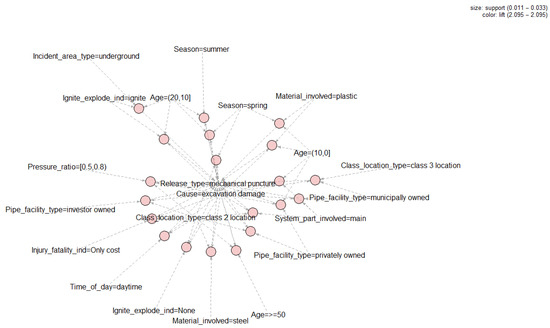
Figure 10.
Association rule network for mechanical punctures. Node size represents support (frequency), and color intensity reflects lift (association strength). Dashed arrows connect nodes, illustrating the interrelations among different factors.
Unlike ruptures, which are often caused by mechanical damage, mechanical punctures were predominantly triggered by excavation damage (e.g., third-party interventions), occurred in Class 2 locations (indicating higher vulnerability zones), and peaked during spring—potentially due to increased construction activity. Furthermore, these incidents predominantly involved main pipelines with operational ages under 20 years. This is because younger pipelines are mostly in Class 2 areas with ongoing construction, while older pipelines are in mature areas with less excavation. Excavation-induced mechanical puncture incidents in plastic main pipelines with less than 10 years of service show a pronounced seasonal pattern, occurring most frequently during spring months. Plastic’s lower impact resistance makes it more susceptible to excavation damage, especially in soft spring soil. In addition, mechanical puncture incidents in 10–20-year-old underground main pipelines have higher ignition risks, especially in summer and spring. High lift values from association rule analysis confirm the reliability of these patterns—higher temperatures lower gas ignition points, increasing fire likelihood.
5. Discussion
This study employs a dual-method framework comprising SARIMA and ARM to identify deterministic patterns in gas pipeline incidents. SARIMA quantifies temporal trends, while ARM uncovers interdependencies among causal factors. The SARIMA model generated short-term forecasts for gas pipeline incidents. Model identification through ACF/PACF analysis determined the optimal (s, p, d, q) orders. The final model selection was based on minimizing AIC, BIC, MAPE, and MASE values obtained from R outputs. The results show a significant decline in gas distribution pipeline leaks and mechanical punctures since 2020. In contrast, ruptures exhibit persistent random patterns, indicating that current mitigation measures are ineffective. Subsequently, association rule mining was applied to identify causal patterns across distinct gas pipeline release types, including leaks, ruptures, and mechanical punctures.
A total of 573,421 rules have been generated by association rule mining. The results of ARM reveal three key patterns: ruptures predominantly stem from natural/external force damage with stochastic failure mechanisms causing inherent unpredictability; leaks are primarily influenced by pipeline physical properties, operational parameters, and environmental conditions, necessitating enhanced safety management; and underground main pipelines aged 10–20 years show heightened mechanical puncture risks, particularly during spring–summer operations, with elevated ignition probabilities. These findings underscore the need for cause-specific prevention strategies across different failure modes.
Based on the above results, pipeline age is a crucial factor influencing gas distribution pipeline ruptures. Over 80% of ruptures happened on gas distribution pipelines that were more than 30 years old. This finding aligns with Tee et al. [16], who noted that the likelihood of rupture incidents rises as pipelines grow older. The current research reveals a significant correlation between operational pressure and pipeline age for gas distribution pipeline ruptures. Furthermore, the extracted rules for leak incidents reveal that pipelines older than 50 years are a critical factor linked to steel gas pipeline leaks caused by other incident causes in class 3 locations. Conversely, mechanical punctures primarily affected main pipelines under 20 years of operational age. These results highlight the divergent impacts of pipeline age on rupture and leak mechanisms, emphasizing the need for age-specific maintenance strategies.
While ruptures exhibit temporal randomness in their occurrence timing—making them difficult to forecast using time-series methods—ARM effectively identifies the underlying factor combinations associated with these events when they do occur. This distinction is crucial: temporal forecasting addresses when incidents might happen, while ARM explains what factors contribute to incidents that have already occurred. Thus, ARM provides valuable insights into rupture mechanisms, despite their stochastic temporal distribution. It is important to clarify that the stochasticity of ruptures (identified via SARIMA) refers to temporal unpredictability—ruptures cannot be forecasted via time-series trends due to the random occurrence of natural forces (e.g., sudden earthquakes). In contrast, ARM uncovers causal associations, which describe static relationships between factors rather than temporal patterns. These two findings are complementary: SARIMA tells operators “when ruptures cannot be predicted”, while ARM tells them “which factors to monitor to reduce rupture risk”.
For pipeline operators, the findings can be directly translated into actionable strategies to prioritize resources and reduce incident risks: implement bi-annual ultrasonic corrosion detection and replace aging outdoor meter assemblies within 5 years for steel pipelines over 50 years old (accounting for 69.7% of fire-triggering leaks), add monthly pressure monitoring and develop a 24 h emergency response protocol for leak shutdown at district regulator stations in Class 4 areas (with high leakage risk due to equipment failure); install real-time soil pressure sensors and conduct quarterly integrity checks for underground pipelines in natural force-prone zones (e.g., tornado or frost-heave areas), and train on-site staff to complete ignition source inspection (e.g., nearby electrical equipment) within 10 min of alarm activation for aboveground Class 3 pipelines (with winter daytime ignition risk); restrict non-essential excavation in Class 2 zones (where 72% of punctures occur) from October to February (non-spring months), and mandate pre-excavation pipeline mapping (using GIS) and require certified engineers to supervise on-site operations (with penalties for non-compliance) for spring construction. These strategies align with the 2020 PIPES Act’s safety requirements and help operators maximize the effectiveness of limited maintenance resources by targeting high-risk scenarios. Additionally, Gas distribution pipeline incidents are significantly influenced by failure causes, with distinct patterns observed across rupture, leak, and puncture events. Natural force damage and other external force damage are the primary causes of gas pipeline ruptures, exhibiting significant randomness in failure mechanisms and resulting in high unpredictability of rupture incidents. This result is consistent with the findings of Xiao et al. [53]. This study reveals that the consequences of ruptures vary depending on the failure causes. Natural force-induced gas pipeline ruptures predominantly occur underground, resulting in economic losses. In contrast, ruptures caused by external forces typically happen aboveground at Class 3 locations, with a higher incidence during winter daytime and potential ignition hazards. As for leaks, the main failure causes are equipment failure, corrosion, and pipe, weld, or joint failures. Note that leakages of outside meter or regular set are prone to lead to fire or explosion. Based on the PHMSA data, fires associated with outside meters or regular set installations totaled 155 incidents, among which 108 were directly triggered by natural gas leaks. Unlike ruptures and leaks, mechanical punctures primarily result from excavation-related incidents. These punctures predominantly occur in Class 2 locations and peak during spring, likely due to heightened construction activity. In summary, the findings underscore the critical need for cause-specific risk mitigation strategies, accounting for spatial, seasonal, and mechanistic disparities across incident types.
Under-reporting and a lack of environmental data in gas pipeline incident databases limit data-mining applications. Absence of soil property data compromises corrosion prediction accuracy. Future research should integrate multiple data sources for comprehensive pattern analysis to uncover significant correlations and causal relationships in gas pipeline incidents.
6. Conclusions
This study investigates the occurrence pattern of gas distribution pipeline incidents using SARIMA and ARM, yielding key findings as follows. First of all, the SARIMA model results indicate a marked decline in gas distribution pipeline leaks and mechanical punctures since 2020. However, ruptures exhibit persistent stochasticity, and current mitigation measures fail to significantly reduce their frequency. Then, the results of ARM reveal two key patterns: (1) Pipeline age significantly impacts gas distribution pipeline failures, with over 80% of ruptures occurring in pipelines over 30 years old, particularly in older steel pipes. While aging pipelines (over 50 years) are prone to leaks from external causes, mechanical damage primarily affects younger pipelines (less than 20 years). (2) Ruptures mainly stem from natural/external forces with underground economic losses or aboveground ignition risks, while leaks originate from equipment/corrosion failures (particularly outdoor meters triggering fires), and punctures predominantly arise from spring excavation activities in Class 2 areas. These findings underscore the need for cause-specific prevention strategies across different failure modes. To our knowledge, this study marks the first attempt to examine gas distribution pipeline incidents through ARM techniques, enabling pipeline safety managers to efficiently develop relevant safety measures.
To bridge the gap between analytical findings and practical application, this study proposes a set of evidence-based, scenario-driven operational strategies derived directly from the identified spatiotemporal risk patterns. First, in light of the pronounced age dependency of failure mechanisms—where over 80% of ruptures occur in pipelines exceeding 30 years of service, while mechanical punctures predominantly affect pipelines under 20 years—a stratified integrity management framework is recommended. For aging infrastructure (>30 years), operators should implement a risk-based inspection (RBI) program, prioritizing internal corrosion direct assessment (ICDA), hydrostatic retesting, and targeted replacement of high-consequence-area (HCA) segments. In contrast, for newer pipelines (<20 years), proactive external threat mitigation should be emphasized, including enhanced public awareness campaigns (e.g., “Call Before You Dig”), increased aerial and ground surveillance, and real-time excavation monitoring in Class 2 locations. Second, given the distinct causal pathways and seasonal dynamics of failure types, cause- and season-specific intervention protocols are proposed. During the spring construction season, a “Spring Excavation Safety Initiative” should be deployed in Class 2 areas, integrating permit tracking, contractor coordination, and intensified patrols to reduce third-party damage. In winter months, heightened vigilance is warranted for aboveground facilities in Class 3 locations, where external-force-induced ruptures peak during daytime hours; this includes enhanced visual monitoring and physical protection measures (e.g., protective barriers). Furthermore, due to the significant fire and explosion hazard associated with leaks at service meters and regulator stations—accounting for 108 out of 155 PHMSA-reported fires—operators should establish a “Meter and Regulator Safety Program” involving routine integrity assessments, corrosion control, and community outreach on leak recognition and emergency response. Collectively, these recommendations operationalize the study’s analytical insights into actionable, context-specific safety measures, enabling a transition from reactive maintenance to proactive, data-driven risk management. By aligning mitigation strategies with the underlying age, cause, and temporal patterns of failure, this framework supports more efficient resource allocation and enhanced resilience in gas distribution networks.
Obviously, there are two main limitations in this study: (1) the United States case study may limit the generality of the findings, and (2) interpreting numerous items remains a persistent challenge in rule mining applications. While this analysis draws on U.S. PHMSA data, which represents one of the most comprehensive national pipeline incident databases, the transferability of these findings to other regions must be considered in light of differing regulatory, environmental, and infrastructural contexts. International studies indicate that regulatory design significantly influences pipeline safety performance. For example, international research indicates that regulatory design significantly influences pipeline safety performance, with different approaches observed globally: for example, the United States employs a long-standing legislative framework with agencies like PHMSA, focusing on federal and state cooperation and public education, while Canada emphasizes stricter environmental regulations and economic liability mechanisms to enhance pipeline safety [24]. Moreover, environmental factors, such as soil corrosivity, freeze–thaw cycles, and seismic activity—known to accelerate pipeline degradation—are not uniformly distributed and may amplify failure risks in regions with less robust corrosion control practices [52,54]. Urban development patterns also play a critical role: high excavation rates in densely populated Asian cities have been linked to elevated third-party damage incidents, a leading cause of pipeline failures, even in systems with modern materials [17,55,56,57,58]. These comparative studies underscore that while the U.S. data provide valuable insights into failure trends and risk drivers, the absolute incident frequencies and effectiveness of mitigation strategies may vary significantly across jurisdictions. Future research leveraging harmonized international incident datasets could enable more robust cross-national risk modeling and support the development of adaptable safety policies.
Concerning the second issue, while ARM effectively identifies factor co-occurrences and correlations, it remains limited to qualitative analysis—unable to determine causal directions or quantify impact magnitudes. Furthermore, this study primarily employed the SARIMA model for time-series forecasting. To more comprehensively evaluate the predictive performance across different pipeline failure types—particularly for rare and high-impact events like ruptures—future research should include a comparative analysis with advanced machine learning and deep learning benchmarks (e.g., LSTM, XGBoost, Prophet) as well as alternative probabilistic approaches such as Bayesian networks.
Funding
This research was funded by supported by Science and Technology Project of Hebei Education Department (QN2022172).
Data Availability Statement
The data presented in this study are available in PHMSA at [https://www.phmsa.dot.gov/].
Acknowledgments
During the preparation of this manuscript/study, the author used [DeepSeek, R1] for the purposes of improving language clarity, enhancing grammatical accuracy, and refining the overall expression to ensure the text is clear, concise, and academically appropriate. The author has reviewed and edited the output and takes full responsibility for the content of this publication.
Conflicts of Interest
The author declares no conflicts of interest.
References
- Xiao, R.; Zayed, T.; Meguid, M.A.; Sushama, L. Improving failure modeling for gas transmission pipelines: A survival analysis and machine learning integrated approach. Reliab. Eng. Syst. Saf. 2024, 241, 109672. [Google Scholar] [CrossRef]
- Bianchini, A.; Guzzini, A.; Pellegrini, M.; Saccani, C. Natural gas distribution system: A statistical analysis of accidents data. Int. J. Press. Vessel. Pip. 2018, 168, 24–38. [Google Scholar] [CrossRef]
- PHMSA. Pipeline Facility Incident Report Criteria History. Available online: https://www.phmsa.dot.gov/data-and-statistics/pipeline/pipeline-facility-incident-report-criteria-history (accessed on 10 October 2025).
- Vitali, M.; Zuliani, C.; Corvaro, F.; Marchetti, B.; Tallone, F. Statistical analysis of incidents on onshore CO2 pipelines based on PHMSA database. J. Loss Prev. Process Ind. 2022, 77, 104799. [Google Scholar] [CrossRef]
- Lam, C.; Zhou, W. Statistical analyses of incidents on onshore gas transmission pipelines based on PHMSA database. Int. J. Press. Vessel. Pip. 2016, 145, 29–40. [Google Scholar] [CrossRef]
- PHMSA Incident Reporting. Available online: https://www.phmsa.dot.gov/hazmat-program-management-data-and-statistics/data-operations/incident-reporting (accessed on 22 March 2025).
- AGA. AGA Playbook 2024. Available online: https://playbook.aga.org/ (accessed on 19 November 2024).
- Wang, H.; Duncan, I.J. Likelihood, causes, and consequences of focused leakage and rupture of U.S. natural gas transmission pipelines. J. Loss Prev. Process Ind. 2014, 30, 177–187. [Google Scholar] [CrossRef]
- Duncan, I.; Wang, H. Evaluating the likelihood of pipeline failures for future offshore CO2 sequestration projects. Int. J. Greenh. Gas Control. 2014, 24, 124–138. [Google Scholar] [CrossRef]
- Li, X.; Penmetsa, P.; Liu, J.; Hainen, A.; Nambisan, S. Severity of emergency natural gas distribution pipeline incidents: Application of an integrated spatio-temporal approach fused with text mining. J. Loss Prev. Process Ind. 2021, 69, 104383. [Google Scholar] [CrossRef]
- Xiao, R.; Zayed, T.; Meguid, M.A.; Sushama, L. Understanding the factors and consequences of pipeline incidents: An analysis of gas transmission pipelines in the US. Eng. Fail. Anal. 2023, 152, 107498. [Google Scholar] [CrossRef]
- Xiao, R.; Zayed, T.; Meguid, M.A.; Sushama, L. Dynamic risk assessment of natural gas transmission pipelines with LSTM networks and historical failure data. Int. J. Disaster Risk Reduct. 2024, 112, 104771. [Google Scholar] [CrossRef]
- Tchórzewska-Cieślak, B.; Pietrucha-Urbanik, K.; Urbanik, M.; Rak, J.R. Approaches for safety analysis of gas-pipeline functionality in terms of failure occurrence: A case study. Energies 2018, 11, 1589. [Google Scholar] [CrossRef]
- Shan, K.; Shuai, J.; Xu, K.; Zheng, W. Failure probability assessment of gas transmission pipelines based on historical failure-related data and modification factors. J. Nat. Gas. Sci. Eng. 2018, 52, 356–366. [Google Scholar] [CrossRef]
- Pesinis, K.; Tee, K.F. Statistical model and structural reliability analysis for onshore gas transmission pipelines. Eng. Fail. Anal. 2017, 82, 1–15. [Google Scholar] [CrossRef]
- Tee, K.F.; Pesinis, K.; Coolen-Maturi, T. Competing risks survival analysis of ruptured gas pipelines: A nonparametric predictive approach. Int. J. Press. Vessel. Pip. 2019, 175, 103919. [Google Scholar] [CrossRef]
- Ruiz-Tagle, A.; Lewis, A.D.; Schell, C.A.; Lever, E.; Groth, K.M. BaNTERA: A Bayesian Network for Third-Party Excavation Risk Assessment. Reliab. Eng. Syst. Saf. 2022, 223, 108507. [Google Scholar] [CrossRef]
- Zhao, L.; Qi, G.; Dai, Y.; Ou, H.; Xing, Z.; Zhao, L.; Yan, Y. Integrated dynamic risk assessment of buried gas pipeline leakages in urban areas. J. Loss Prev. Process Ind. 2023, 83, 105049. [Google Scholar] [CrossRef]
- Li, X.; Liu, Y.; Zhang, R.; Zhang, N. Probabilistic Failure Assessment of Oil and Gas Gathering Pipelines Using Machine Learning Approach. Reliab. Eng. Syst. Saf. 2025, 256, 110747. [Google Scholar] [CrossRef]
- Xiao, R.; Zayed, T.; Meguid, M.; Sushama, L. Rapid failure risk analysis of corroded gas pipelines using machine learning. Ocean Eng. 2024, 313, 119433. [Google Scholar] [CrossRef]
- Afrin, T.; Yodo, N.; Huang, Y. AI-Driven Framework for Predicting Oil Pipeline Failure Causes Based on Leak Properties and Financial Impact. J. Pipeline Syst. Eng. Pract. 2025, 16, 04025009. [Google Scholar] [CrossRef]
- Xu, J.; Ji, C.; Yang, L.; Liu, Y.; Xie, Z.; Fu, X.; Jiang, F.; Liao, M.; Zhao, L. Urban Natural Gas Pipeline Operational Vulnerability under the Influence of a Social Spatial Distribution Structure: A Case Study of the Safety Risk Patterns in Kunming, China. Reliab. Eng. Syst. Saf. 2025, 254, 110593. [Google Scholar] [CrossRef]
- Wu, X.; Du, M.; Liu, H.; Song, Z.; Jia, W. Coupled Assessment and Risk Reconfiguration of Debris Hazards in Natural Gas Pipeline Incidents via Multi-Scale Stochastic Modeling. Process Saf. Environ. Prot. 2025, 200, 107344. [Google Scholar] [CrossRef]
- Shen, Y.; Zhou, W. A comparison of onshore oil and gas transmission pipeline incident statistics in Canada and the United States. Int. J. Crit. Infrastruct. Prot. 2024, 45, 100679. [Google Scholar] [CrossRef]
- Raveendran, A.; Renjith, V.R. Corroboration of sparse failure data through Bayesian estimation for natural gas cross country pipelines: A case study with reference to the Indian scenario. J. Loss Prev. Process Ind. 2018, 55, 347–358. [Google Scholar] [CrossRef]
- Liu, C.; Wang, Y.; Li, X.; Li, Y.; Khan, F.; Cai, B. Quantitative assessment of leakage orifices within gas pipelines using a Bayesian network. Reliab. Eng. Syst. Saf. 2021, 209, 107438. [Google Scholar] [CrossRef]
- Wang, W.; Shen, K.; Wang, B.; Dong, C.; Khan, F.; Wang, Q. Failure probability analysis of the urban buried gas pipelines using Bayesian networks. Process Saf. Environ. Prot. 2017, 111, 678–686. [Google Scholar] [CrossRef]
- Hong, B.; Shao, B.; Guo, J.; Fu, J.; Li, C.; Zhu, B. Dynamic Bayesian network risk probability evolution for third-party damage of natural gas pipelines. Appl. Energy 2023, 333, 120620. [Google Scholar] [CrossRef]
- Guo, X.; Zhang, L.; Liang, W.; Haugen, S. Risk identification of third-party damage on oil and gas pipelines through the Bayesian network. J. Loss Prev. Process Ind. 2018, 54, 163–178. [Google Scholar] [CrossRef]
- Woldesellasse, H.; Tesfamariam, S. Failure assessment of oil and gas transmission pipelines using an integrated Bayesian belief network and GIS model. Int. J. Press. Vessel. Pip. 2023, 205, 104984. [Google Scholar] [CrossRef]
- Feng, X.; Jiang, J.-C.; Wang, W.-F. Gas pipeline failure evaluation method based on a Noisy-OR gate bayesian network. J. Loss Prev. Process Ind. 2020, 66, 104175. [Google Scholar] [CrossRef]
- Xiao, R.; Zayed, T.; Meguid, M.A.; Sushama, L. Time Varying Reliability Analysis of Corroded Gas Pipelines Using Copula and Importance Sampling. Ocean. Eng. 2024, 306, 118086. [Google Scholar] [CrossRef]
- Liu, P.; Guo, Y.; Liu, P.; Ding, H.; Cao, J.; Zhou, J.; Feng, Z. What can we learn from the AV crashes?—An association rule analysis for identifying the contributing risky factors. Accid. Anal. Prev. 2024, 199, 107492. [Google Scholar] [CrossRef]
- Hong, J.; Tamakloe, R.; Park, D. Application of association rules mining algorithm for hazardous materials transportation crashes on expressway. Accid. Anal. Prev. 2020, 142, 105497. [Google Scholar] [CrossRef] [PubMed]
- Lan, H.; Ma, X.; Ma, L.; Qiao, W. Pattern investigation of total loss maritime accidents based on association rule mining. Reliab. Eng. Syst. Saf. 2023, 229, 108893. [Google Scholar] [CrossRef]
- Li, X.; Chen, C.; Hong, Y.D.; Yang, F.Q. Exploring Hazardous Chemical Explosion Accidents with Association Rules and Bayesian Networks. Reliab. Eng. Syst. Saf. 2023, 233, 109099. [Google Scholar] [CrossRef]
- Vetter, C.P.; Kuebel, L.A.; Natarajan, D.; Mentzer, R.A. Review of failure trends in the US natural gas pipeline industry: An in-depth analysis of transmission and distribution system incidents. J. Loss Prev. Process Ind. 2019, 60, 317–333. [Google Scholar] [CrossRef]
- Cui, T.; Shi, Y.; Lv, B.; Ding, R.; Li, X. Federated learning with SARIMA-based clustering for carbon emission prediction. J. Clean. Prod. 2023, 426, 139069. [Google Scholar] [CrossRef]
- Negre, P.; Alonso, R.S.; Prieto, J.; García, Ó.; de-la-Fuente-Valentín, L. Prediction of footwear demand using Prophet and SARIMA. Expert. Syst. Appl. 2024, 255, 124512. [Google Scholar] [CrossRef]
- Cheng, J.; Tiwari, S.; Khaled, D.; Mahendru, M.; Shahzad, U. Forecasting Bitcoin prices using artificial intelligence: Combination of ML, SARIMA, and Facebook Prophet models. Technol. Forecast. Soc. Change 2024, 198, 122938. [Google Scholar] [CrossRef]
- Verma, A.; Dhalmahapatra, K.; Maiti, J. Forecasting occupational safety performance and mining text-based association rules for incident occurrences. Saf. Sci. 2023, 159, 106014. [Google Scholar] [CrossRef]
- Ren, F.; Tian, C.; Zhang, G.; Li, C.; Zhai, Y. A hybrid method for power demand prediction of electric vehicles based on SARIMA and deep learning with integration of periodic features. Energy 2022, 250, 123738. [Google Scholar] [CrossRef]
- Bilgili, M.; Pinar, E. Gross electricity consumption forecasting using LSTM and SARIMA approaches: A case study of Türkiye. Energy 2023, 284, 128575. [Google Scholar] [CrossRef]
- Zhu, Y.; Liao, H.; Huang, D. Using text mining and multilevel association rules to process and analyze incident reports in China. Accid. Anal. Prev. 2023, 191, 107224. [Google Scholar] [CrossRef] [PubMed]
- Das, S.; Tamakloe, R.; Zubaidi, H.; Obaid, I.; Alnedawi, A. Fatal pedestrian crashes at intersections: Trend mining using association rules. Accid. Anal. Prev. 2021, 160, 106306. [Google Scholar] [CrossRef] [PubMed]
- Pourazizi, R.; Mohtadi-Bonab, M.A.; Szpunar, J.A. Investigation of different failure modes in oil and natural gas pipeline steels. Eng. Fail. Anal. 2020, 109, 104400. [Google Scholar] [CrossRef]
- Das, A.; Ahmed, M.M.; Ghasemzadeh, A. Using trajectory-level SHRP2 naturalistic driving data for investigating driver lane-keeping ability in fog: An association rules mining approach. Accid. Anal. Prev. 2019, 129, 250–262. [Google Scholar] [CrossRef]
- Duan, P.; He, Z.; He, Y.; Liu, F.; Zhang, A.; Zhou, D. Root cause analysis approach based on reverse cascading decomposition in QFD and fuzzy weight ARM for quality accidents. Comput. Ind. Eng. 2020, 147, 106643. [Google Scholar] [CrossRef]
- Wang, L.; Huang, R.; Shi, W.; Zhang, C. Domino effect in marine accidents: Evidence from temporal association rules. Transp. Policy 2021, 103, 236–244. [Google Scholar] [CrossRef]
- Paiva, R.G.N.; Cavalcante, C.A.V.; Do, P. Applying association rules in the maintenance and reliability of physical systems: A review. Comput. Ind. Eng. 2024, 194, 110332. [Google Scholar] [CrossRef]
- Cheng, N.; Li, M.; Liu, P.; Luo, Q.; Tang, C.; Zhang, W. Pipeline incidents and property values. J. Environ. Econ. Manag. 2024, 127, 103041. [Google Scholar] [CrossRef]
- Ohaeri, E.G.; Szpunar, J.A. An overview on pipeline steel development for cold climate applications. J. Pipeline Sci. Eng. 2022, 2, 1–17. [Google Scholar] [CrossRef]
- Xiao, R.; Zayed, T.; Meguid, M.A.; Sushama, L. A statistical perspective on natural gas distribution pipeline incidents in the United States. Gas Sci. Eng. 2025, 134, 205524. [Google Scholar] [CrossRef]
- He, R.; Jin, H. Permafrost and Cold-Region Environmental Problems of the Oil Product Pipeline from Gol-mud to Lhasa on the Qinghai-Tibet Plateau and Their Mitigation. Cold Reg. Sci. Technol. 2010, 64, 279–288. [Google Scholar] [CrossRef]
- Qin, G.; Gong, C.; Wang, Y. A Probabilistic-Based Model for Predicting Pipeline Third-Party Hitting Rate. Process Saf. Environ. Prot. 2021, 148, 333–341. [Google Scholar] [CrossRef]
- Aulia, R.; Tan, H.; Sriramula, S. Dynamic Reliability Model for Subsea Pipeline Risk Assessment Due to Third-Party Interference. J. Pipeline Sci. Eng. 2021, 1, 277–289. [Google Scholar] [CrossRef]
- Ruiz-Tagle, A.; Groth, K.M. Comparing the Risk of Third-Party Excavation Damage between Natural Gas and Hydrogen Pipelines. Int. J. Hydrogen Energy 2024, 57, 107–120. [Google Scholar] [CrossRef]
- Sandri, O.; Hayes, J.; Holdsworth, S. Regulating Urban Development around Major Accident Hazard Pipelines: A Systems Comparison of Governance Frameworks in Australia and the UK. Environ. Syst. Decis. 2020, 40, 385–402. [Google Scholar] [CrossRef]


Disclaimer/Publisher’s Note: The statements, opinions and data contained in all publications are solely those of the individual author(s) and contributor(s) and not of MDPI and/or the editor(s). MDPI and/or the editor(s) disclaim responsibility for any injury to people or property resulting from any ideas, methods, instructions or products referred to in the content. |
© 2025 by the author. Licensee MDPI, Basel, Switzerland. This article is an open access article distributed under the terms and conditions of the Creative Commons Attribution (CC BY) license (https://creativecommons.org/licenses/by/4.0/).