Abstract
This study presents an experimental optimization of an industrial-scale compressed air system aimed at improving energy efficiency and operational performance. The evaluation was conducted in accordance with ISO 11011 standards, covering supply, distribution, demand, and air quality aspects. Reference and optimized scenarios were directly compared under equivalent operating conditions. The most significant improvement was the elimination of a 0.54-bar pressure drop, which enabled the compressor’s set pressure to be reduced from 7.0 bar to 6.5 bar and prevented unnecessary load cycles. In addition, the detection and repair of leakage points significantly reduced constant loads during non-production hours. As a result, average power consumption decreased by 32.6%, while idle consumption was reduced by 70%. Improvements in filtration and condensate management lowered moisture and oil carryover, thereby enhancing process reliability. Considering annual operating hours, the optimization was estimated to offer a potential reduction of approximately 63.5 tons of CO2 emissions. The results demonstrate that substantial efficiency and sustainability gains can be achieved through physical adjustments and operational measures without modifying control algorithms.
1. Introduction
Compressed air is an essential auxiliary energy source widely used in modern industry. Its accessibility and reliability enable a broad range of applications, from operating pneumatic equipment to process automation [1,2]. The utilization of this resource in industry is made possible through compressed air systems. These systems can be defined as integrated structures consisting of compressors, storage tanks, dryers, filters, and pipelines [3]. Although compressed air plays a critical role in ensuring continuous production in industrial plants, its generation is an energy-intensive process due to high electricity demand. Consequently, it imposes a significant burden on operating costs [4]. In the industrial sector, the share of compressed air in total electricity consumption has been reported in the literature to range between 10% and 35% [5,6,7,8]. Due to its high energy intensity, significant share in electricity consumption, and impact on operating costs, compressed air is an energy source that requires careful management. For these reasons, the savings potential in compressed air systems has become a focal point of energy efficiency studies [9,10].
However, under real operating conditions, various inefficiencies limit the performance of these systems [11]. The most common losses are leakages, which occur as a result of damaged sealing elements in fittings and pneumatic equipment [12]. In addition, pipeline length, improper mechanical sizing, and unnecessary connections lead to pressure drops. This condition requires compressors to operate at higher pressures, thereby increasing energy consumption. Similarly, elevated pressure levels often adopted as a safety margin result in unnecessary energy use [13,14]. Keeping compressors running during non-production periods also results in additional losses [15]. Air quality is another critical factor. Contaminants such as moisture, oil, and particles shorten equipment lifetime and affect process reliability [16,17]. When these factors are considered together, it becomes evident that existing systems offer substantial potential for improvement.
Numerous studies have been conducted to evaluate the performance of compressed air systems. Both experimental and numerical approaches have been employed to enhance system performance. Frequent research topics include the analysis of pressure losses, the development of leakage detection techniques, the investigation of the impact of operating pressure on energy consumption, and approaches for system optimization [18,19,20,21,22,23,24,25,26,27,28,29,30,31,32,33,34,35,36,37,38]. In addition, recent studies have extended the optimization perspective toward machine-level pneumatic systems. These works have highlighted that actuator configuration, valve control strategy, and circuit design play a significant role in compressed air utilization [39,40,41]. Previous research has established a body of knowledge in this field and enabled the topic to be addressed from various perspectives. However, most studies have been limited to describing the performance of existing systems or theoretically estimating potential improvements. The experimental implementation of optimized systems and their direct comparison with baseline configurations have rarely been investigated [42,43].
This study is based on comprehensive field measurements conducted on an industrial compressed air system in Turkey. In line with ISO 11011 guidelines, both the baseline and optimized configurations were experimentally investigated under directly comparable conditions. Unlike many previous works that rely mainly on simulations, theoretical projections, or subsystem analyses, this research provides a holistic experimental evaluation encompassing supply, distribution, demand, and air quality. The results demonstrate measurable improvements in energy efficiency, pressure stability, and air quality, along with environmental benefits achieved through CO2 emission reduction. In addition to these findings, the study offers one of the few full-scale experimental validations of system-level reconfiguration on an active industrial network, establishing verifiable plant-level evidence of energy and emission reduction.
The remainder of this paper is organized as follows: Section 2 introduces the materials and methods, including the system description, measurement methodology, optimization approach, and post-optimization measurements. Section 3 presents and discusses the results, covering baseline and optimized performance, comparative analyses, and the corresponding CO2 emission and sustainability improvements. Finally, Section 4 concludes the paper by summarizing the main findings and outlining their implications for improving industrial energy management practices.
2. Materials and Methods
2.1. System Description
The baseline compressed air system investigated in this study is illustrated in Figure 1. Compressed air is generated by two parallel-connected, oil-injected compressors rated at 37 kW each, with pressure stabilization provided by a wet air receiver. The compressors operate under a load/unload control principle. The system is configured with a set pressure of 7.0 bar, a load pressure of 6.7 bar, and an unload pressure of 7.2 bar. The produced air is passed through a refrigerant dryer to reduce the dew point temperature and subsequently filtered to minimize oil and particulate content. The conditioned air is then collected in a dry air receiver and distributed to the factory processes via two main ring pipelines. The first ring has a DN80 diameter with an approximate length of 400 m, while the second ring has a DN50 diameter and an approximate length of 250 m. Both distribution rings supply different sections of the plant. The compressors are operated simultaneously depending on the system load. This arrangement is considered the baseline condition, serving as the reference for comparisons with the optimized design in this study. The capacities and technical specifications of the main system components are summarized in Table 1.
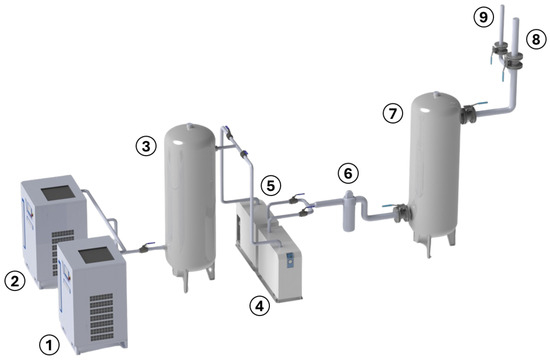
Figure 1.
General layout of the baseline compressed air system. (1–2) Compressors; (3) wet air receiver; (4–5) dryers; (6) filtration unit; (7) dry air receiver; (8–9) distribution pipelines.

Table 1.
Technical specifications of the baseline compressed air system.
2.2. Measurement Methodology
The measurement methodology applied in this study was based on the ISO 11011:2013 compressed air energy efficiency assessment, an international reference for evaluating the energy performance of compressed air systems. The standard requires a holistic system assessment that considers all components rather than focusing solely on compressors [44]. Accordingly, the evaluation was conducted along three principal dimensions:
- Supply side: compressors, dryers, filtration units, and storage receivers;
- Distribution: the overall mechanical piping system;
- Demand side: factory processes and end-use points.
To assess the system’s performance, power consumption, pressure, flow rate, air quality, and leakage losses were monitored. Measurements were conducted under both normal production and non-production conditions, enabling the evaluation of not only instantaneous losses but also the overall system behavior. The sensors were integrated into a data acquisition system, and continuous monitoring was performed for 24 h with a 2 min sampling interval. This duration was chosen to be representative of production conditions. Both the baseline and optimized systems were analyzed using the same methodology, allowing for directly comparable results.
The monitored parameters and measurement points of the system are presented in Figure 2. Accordingly, power consumption was measured at the compressors, flow rates were monitored at the compressor outlets, and pressure measurements were taken on the wet side, the dry side, and the farthest point of the distribution line. Air quality was assessed after the conditioning stage in terms of dew point temperature and oil content. The compressors supplied pneumatic equipment along the main production line, including actuators and process automation units. The measured thermal mass flow variations reflected the changing air demand of these significant energy users throughout the production cycle, providing an indirect indication of how process load influenced total system demand. In addition, on the demand side, the end-use points in the production line were scanned with an ultrasonic leak detector both during operating and non-operating periods. This approach enabled the identification of leakage losses occurring from the distribution lines to the equipment connections and quantitatively demonstrated their impact on system efficiency. The main technical specifications of the measurement devices used are summarized in Table 2. Since both baseline and optimized scenarios were recorded using the same instruments and calibration conditions, the observed performance differences are well above the specified accuracy limits, ensuring high reliability and repeatability of the experimental data.
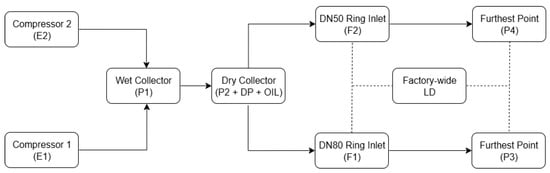
Figure 2.
Schematic representation of the measurement setup. Energy analyzers (E1–E2) were installed at each compressor. A pressure sensor (P1) was located at the wet collector, while the dry collector was equipped with a pressure sensor (P2), a dew point sensor (DP), and an oil content monitor (OIL). Flow meters (F1–F2) were positioned at the inlets of the DN80 and DN50 ring lines, respectively. Pressure was monitored at the furthest points of each ring (P3 for DN50, P4 for DN80). Leakage detection (LD) was carried out factory-wide at the distribution points of both ring lines during production and non-production periods. Note: In the baseline configuration, collectors were not present; measurements at these locations were taken from equivalent junctions.
Table 2.
Main technical specifications of the measurement instruments used in the study.
2.3. Optimization Approach
The optimized design was developed based on the system integrity approach prescribed by ISO 11011. The objective was to reduce pressure losses, improve air quality, and enhance operational continuity. In this study, the term optimization does not imply a mathematical or algorithmic process. Instead, it refers to a system-level improvement procedure consistent with ISO 11011, in which design and operational parameters are iteratively refined and experimentally validated under real industrial conditions to achieve measurable efficiency gains. In the baseline configuration, branch connections with T joints, limited use of collectors, and a single central tank arrangement resulted in flow imbalances and localized pressure drops. Therefore, the system was restructured by reconsidering the supply, conditioning, and distribution sides. The optimized configuration is illustrated in Figure 3.
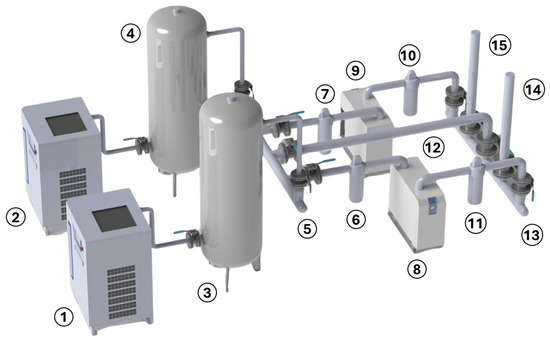
Figure 3.
Layout of the optimized compressed air system. (1–2) Compressors; (3–4) wet air receivers; (5) wet collector; (6–7) pre-filters; (8–9) dryers; (10–11) final filters; (12) by-pass line; (13) dry collector; (14–15) distribution lines.
On the supply side, each compressor was connected to a separate DN50 pipeline and equipped with a dedicated wet air receiver. This configuration facilitates the damping of pressure fluctuations, enabling more stable operation of the parallel compressors. The tank outlets were combined in a DN100 wet collector, with condensate drains installed at both the collector and tank bottoms. In this way, the condensate load was removed from the system, thereby supporting dryer performance. In addition, a DN100 dryer by-pass line was provided from the collector to avoid production interruptions during maintenance or failure. This precaution allows continuous system operation under maintenance conditions. The pipelines from the wet collector to the dryers were designed with DN80 diameters, and each line was equipped with a 1 µm pre-filter. This arrangement protects the dryer heat exchangers from particle and oil contamination, thus improving drying capacity. The dryer outlets were kept at the same diameter, and the airflow was passed through 0.01 µm final filters before being balanced in a DN100 dry collector. The dry collector was also equipped with a condensate drain, thereby improving the quality of air supplied to the ring lines.
On the distribution side, the bottleneck sections at the transitions from the dry collector to the ring lines were enlarged to DN100, while the internal diameters of the DN80 and DN50 ring lines were maintained. This modification reduced hydraulic losses at the ring inlets and ensured symmetric feeding. As a result, the required process pressures could be achieved with a lower compressor discharge set point.
On the demand side, end-use points along the production lines were scanned with an ultrasonic leak detector, and the detected leakages were eliminated. In this way, losses throughout the chain from the distribution lines to the equipment connections were minimized, thereby enhancing the overall system efficiency. In addition, the compressors were set to automatic standby mode during non-production periods, which significantly reduced idle operation losses.
In summary, the optimization strategy was defined by four guiding principles: (i) flow balancing through additional receivers and collectors, (ii) enhancement of air quality via integrated filtration and condensate management, (iii) reducing hydraulic losses through pipeline diameter adjustments, and (iv) reinforcement of operational practices, including pressure control, standby management, and leakage mitigation. These measures were implemented while preserving the monitoring framework established in the methodology, ensuring that the baseline and optimized conditions remained directly comparable. The experimental outcomes of these improvements are presented in Section 3.
2.4. Post-Optimization Measurements
The performance of the optimized configuration was evaluated using the same sensor layout and data acquisition protocol as in the baseline scenario. This approach ensured direct comparability and guaranteed the impartiality of the measurements. Consequently, the observed performance differences could be attributed solely to the implemented optimization measures.
The optimized configuration was finalized after iterative adjustments and on-site evaluations, where each modification was assessed in terms of compressor power consumption, pressure stability, and end-use air quality. The configuration that provided the most stable pressure profile with the lowest specific energy consumption was adopted as the optimized setup.
3. Results and Discussion
3.1. Baseline Performance
The performance evaluation was based on the simultaneous monitoring of energy consumption, pressure, flow rate, and air quality parameters. Sensors were installed at representative points of the supply, distribution, and demand sides. Data were synchronously recorded over a 24 h period through a unified acquisition system (see Section 2.2). Representative photographs of the measurement instruments used in the field are presented in Figure 4.
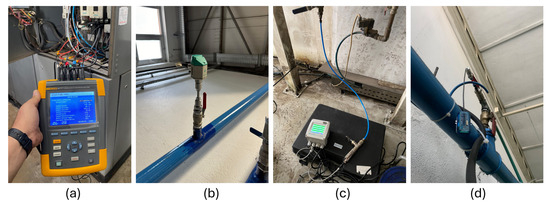
Figure 4.
Measurement instruments used in the field: (a) power analyzer for compressors, (b) thermal mass flow meter for distribution lines, (c) dew point and oil sensors installed downstream of air treatment, (d) pressure sensors positioned at different points of the system.
Figure 5 presents the total power consumption of the system. During non-production hours, a single compressor was observed to idle at 25–30 kW, representing idle losses since the leakage flow did not require a transition to load mode. At production startup, the sudden loading of the compressors resulted in transient losses, while during the lunch break, despite the demand dropping to zero, the compressors failed to reach a fully unloaded state, sustaining partial idle consumption at around 40–50 kW. Frequent load/unload cycles observed throughout the day clearly indicate inefficient operation of the parallel compressors. Under these conditions, the average power consumption was measured at 57.1 kW, with a total daily energy consumption of 1371 kWh.
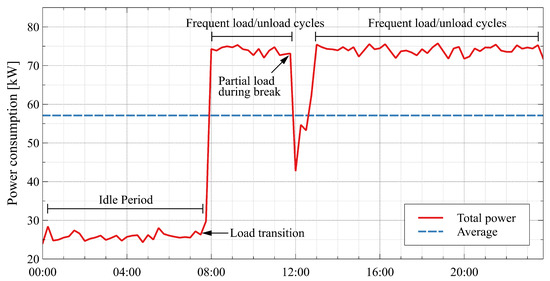
Figure 5.
Total power consumption of the compressors. The red line denotes the instantaneous demand, and the dashed blue line indicates the average value.
The pressure measurements presented in Figure 6 reveal the magnitude and distribution of system losses. The pronounced high-amplitude fluctuations observed at the compressor outlet (P1) directly reflect the influence of load/unload cycling. At the compressor room outlet (P2), a pressure difference of approximately 1 bar was detected, accounting for the majority of the total 1.25-bar pressure drop. In contrast, measurements at the most distant points of the distribution network, corresponding to P3 (DN80) and P4 (DN50), indicated only a 0.25-bar reduction, representing about 20% of the overall loss. These results demonstrate that the primary source of pressure losses lies within the compressor room, while the contribution of the distribution network remains limited.
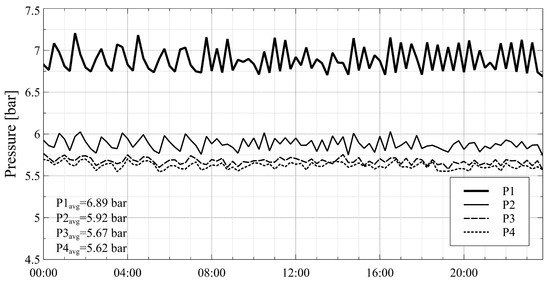
Figure 6.
Pressure profiles of the system at measurement points P1–P4.
The flow measurements presented in Figure 7 illustrate the demand profile of the system. During non-production hours, the total flow stabilized at approximately 4 m3/min, representing static consumption. A substantial portion of this consumption originated from widespread leakages within the system.
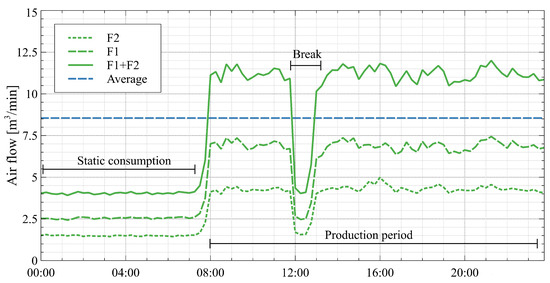
Figure 7.
Measured flow rates in the DN80 (F1) and DN50 (F2) ring lines, along with the total consumption (F1 + F2). The dashed blue line represents the average value.
Once production commenced, the total demand increased to the range of 11–12 m3/min, whereas a temporary decline was observed during the short midday break. However, the system was unable to fully switch to an idle regime during this period. Throughout the day, the average flow was determined to be 8 m3/min. Moreover, the F1 line carried higher and more fluctuating flows compared to F2 during production, indicating an unbalanced distribution between the lines. Although the presence of leakages produced a smoother flow profile by creating a constant load, such regularity reflects an unfavorable condition in terms of system efficiency.
Ultrasonic inspections on the demand side identified a total of 77 leakage points. The majority of these leakages originated from connection fittings and sealing surfaces. The total leakage flow rate detected and subsequently repaired was 2.82 m3/min, corresponding to approximately 20% of the system capacity. A significant portion of the static consumption observed during non-production periods can be attributed to these leakages. Screenshots of several detected leakages are presented in Figure 8.
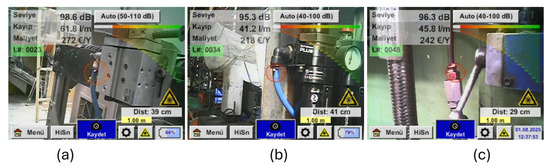
Figure 8.
Screenshots from leakage detection measurements: (a) leakage at a cylinder connection, (b) leakage at an air preparation unit connection, (c) leakage at a valve connection.
Air quality analyses were conducted at the outlet of the air preparation line. The measurements indicated a dew point of 6.4 °Ctd and an oil content of 5.12 mg/m3. According to the purity classes defined in ISO 8573-1:2010 [45], these values correspond to Class 5. Although the standard encompasses particle, humidity, and oil parameters, direct particle measurement was not performed in this study. The main reason for this is that particle counting in compliance with ISO 8573 cannot be practically conducted on site and requires specialized equipment. In contrast, the dew point and oil content could be reliably measured using standard sensors, and classification was therefore carried out based on these two parameters. This classification reveals the baseline air quality profile of the system.
3.2. Optimized Performance
This section presents the performance data obtained for the optimized system and describes the characteristics observed under different operating conditions.
Figure 9 illustrates the power consumption profile of the optimized system. The set pressure was maintained at 6.5 bar, with load/unload thresholds of 6.3/6.7 bar. During nighttime hours, only a single compressor operated in standby mode, resulting in a consumption level of approximately 17 kW. At the start of production, the power level increased to the range of 42–54 kW through a single loading transition. Short-term peaks between 60 and 72 kW were observed during the day in response to varying demand. The average power consumption was measured as 38.5 kW, while the total daily energy consumption reached 924 kWh. Compared to the baseline scenario, the frequent load/unload cycles and high idle consumption were largely eliminated in the optimized case. The power profile is now characterized by fluctuations within a defined band and limited peak occurrences.
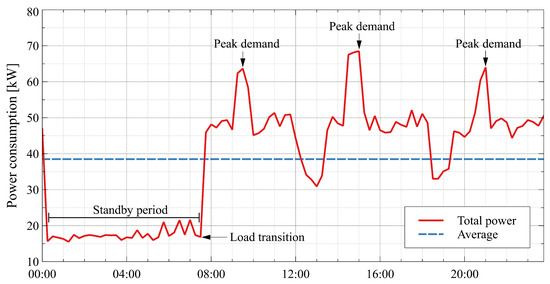
Figure 9.
Power consumption profile of the optimized system. The standby period, loading transition, and peak demands are indicated; the dashed line represents the daily average.
Figure 10 presents the pressure profiles measured in the optimized configuration. The average pressure in the wet collector (P1) was 6.42 bar, where the amplitude of loading cycles remained relatively low. During the standby period, P1 exhibited a saw-tooth pattern of regular fluctuations, which resulted from the periodic activation of a single compressor to maintain the line pressure within the specified range. In the dry collector (P2), the measured pressure was 5.97 bar, leading to a difference of approximately 0.45 bar between P1 and P2. This difference originated from the pre-filters installed at the dryer inlets, which introduced the expected pressure drop. While the filters effectively limited oil and particle carryover to protect the performance of the dryer heat exchanger, they also contributed to an additional pressure loss. At the line ends, average values of P3 = 5.78 bar and P4 = 5.71 bar were recorded. The low amplitudes of the curves at these points indicate that pressure fluctuations were attenuated along the distribution lines. Overall, the optimized configuration resulted in a more balanced distribution of pressure losses and ensured a stable profile at the endpoints.
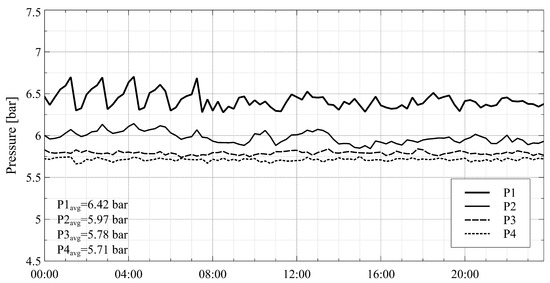
Figure 10.
Pressure profiles measured at points P1–P4 in the optimized system. Average values are provided in the legend.
The flow profiles obtained after optimization are presented in Figure 11. During non-production hours, consumption decreased significantly, directly reflecting the impact of leakage elimination. Throughout the daily demand period, the total consumption exhibited a more balanced trend, and the flow distribution between the lines became more uniform compared to the previous condition. In particular, the increased load observed in the F2 line indicates that the imbalance evident in the baseline case was substantially reduced. During temporary stoppages, the flows rapidly declined and then recovered steadily with the resumption of production. In the optimized case, the curves appear more variable, demonstrating that the system responded only to the actual process requirements. By contrast, in the baseline scenario, leakages imposed a constant load, which made the profile appear smoother. Consequently, the optimized system profile more accurately reflects the true demand behavior of the system.
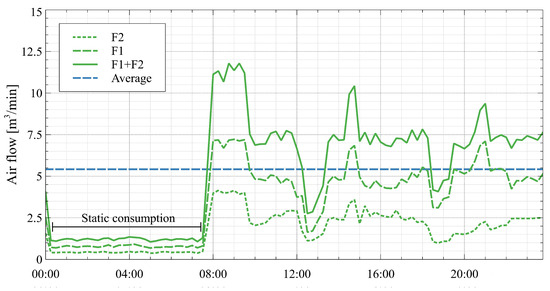
Figure 11.
Measured flow rates in the DN80 (F1) and DN50 (F2) ring lines, along with the total consumption (F1 + F2) in the optimized system. The dashed blue line represents the average value.
Ultrasonic inspections performed on the demand side confirmed that the leakages identified in the baseline condition were eliminated. As a result of this improvement, the static consumption recorded during non-production hours decreased significantly. The idle energy load of the system was minimized, thereby reducing energy losses and preventing unnecessary compressor operation.
Air quality analyses were repeated in the dry collector under the optimized condition. The measurements indicated a dew point of 1.31 °Ctd and an oil content of 3.87 mg/m3. According to ISO 8573-1:2010, these values correspond to Class 4. Compared with the classes obtained in the baseline condition, higher quality levels were achieved. By reducing moisture and oil carryover, process reliability was enhanced. Consequently, the optimized condition improved not only the energy performance but also the air quality of the system.
3.3. Comparative Analysis
This section presents a direct comparison of the performance indicators for the baseline and optimized systems. The analysis covers power consumption, pressure losses, flow distribution, leakage levels, and air quality parameters. The measurement period encompassed a typical production day, ensuring that system behavior was represented under both production and non-production conditions. Thus, the results were not limited to short-term sampling but instead provided a comprehensive evaluation reflecting the normal operating cycle. The slightly lower average pressure in the optimized conditions resulted from the elimination of network losses, which allowed the compressor’s set pressure to be reduced from 7.0 bar to 6.5 bar while maintaining stable end-use pressure. A summary of the comparative findings is presented in Table 3.
Table 3.
Comparative performance indicators of the baseline and optimized systems.
The comparative results presented demonstrate that the optimization measures provided multi-dimensional contributions to system performance. Reductions in energy consumption and improvements in pressure losses enabled more efficient system operation. The balancing of flow distribution and the advancement in air quality emerged as key factors enhancing process reliability. It should be noted that the reported efficiency improvements represent the cumulative impact of all optimization measures implemented simultaneously, as isolating the effect of individual factors such as leakage repair, pipeline resizing, or pressure regulation was not feasible under real operating conditions. In this regard, the optimized configuration offered advantages not only in terms of energy efficiency but also in maintaining operational continuity. Furthermore, the optimization was implemented through low-cost physical modifications such as installing additional filtration units, reconfiguring the compressor room layout, and partially rebuilding the main pipelines with supplementary valves, demonstrating that significant efficiency gains can be achieved without major capital investment.
3.4. CO2 Emissions and Sustainability Gains
The impact of reduced energy consumption on environmental performance was evaluated through CO2 emissions. The calculation was based on the measured daily energy savings (447 kWh). This value was extrapolated to an annual scale using 330 operating days, which reflects the typical production schedule of heavy industrial facilities in Turkey after accounting for holidays and planned maintenance. The national grid emission factor for Turkey (0.43 kgCO2/kWh) was applied [46]. The change in CO2 emissions was calculated using
where kWh, days, and kgCO2/kWh. According to this calculation, the annual reduction is estimated at about 63.5 tCO2/year. In the baseline scenario, annual emissions were 194.6 tCO2/year, while in the optimized case they decreased to 131.1 tCO2/year. These results indicate that the efficiency improvements not only reduced operating costs but also achieved a significant reduction in greenhouse gas emissions. Extrapolating from a single measurement day introduces some uncertainty in absolute values, as production schedules and grid emission factors may vary annually. However, since both systems were monitored under identical conditions, the direction and magnitude of the reduction can be considered reliable. This confirms that operational improvements such as lowering the set pressure and eliminating leakages provide tangible benefits for environmental sustainability in addition to energy efficiency.
4. Conclusions
This study experimentally demonstrated that the optimization measures implemented in an industrial-scale compressed air system led to substantial improvements in both energy efficiency and air quality. The most significant outcome was the elimination of a 0.54-bar pressure drop, which enabled the compressor’s set pressure to be reduced from 7.0 bar to 6.5 bar and prevented unnecessary load cycles. This adjustment stabilized the pressure regime and provided a more balanced operating profile across the network. In addition, the detection and repair of leakage points significantly reduced idle energy consumption during non-production periods, while the enlargement of critical pipeline sections and the balancing of ring inlets minimized pressure losses and ensured a more uniform end-of-line pressure distribution. Improvements in filtration and condensate management further enhanced air quality and process reliability by reducing moisture and oil carryover.
As a result of these combined measures, the optimized configuration achieved a 32.6% reduction in total power consumption, a 70% decrease in static consumption, and an estimated annual reduction of 63.5 tons in CO2 emissions, confirming the measurable sustainability benefits of the proposed approach. These outcomes were achieved without modifying the control algorithms, showing that the observed gains resulted solely from physical reconfiguration and improved operational practices rather than automation-based interventions. While the experimental findings are based on a single industrial facility, the evaluated system configuration and operating conditions are representative of typical medium-scale manufacturing plants utilizing centralized compressed air networks. Nonetheless, extending this methodology to facilities with different layouts, load profiles, or control strategies would help to further assess the general applicability of the proposed approach. Although the annual emission reduction estimates are derived from a single-day dataset and thus subject to some uncertainty, the magnitude and direction of improvement remain robust. Future work will focus on integrating advanced control strategies such as variable-speed drives, intelligent load sharing, and demand-responsive pressure management, supported by continuous monitoring-based supervisory systems. Expanding the validation to multiple facilities and longer operating periods will further clarify the scalability and long-term environmental impacts of this optimization framework. Overall, the findings demonstrate both the technical significance and practical applicability of the proposed approach.
Funding
This research received no external funding.
Institutional Review Board Statement
Not applicable.
Informed Consent Statement
Not applicable.
Data Availability Statement
Data supporting the findings of this study are available from the corresponding author upon reasonable request. Public access is restricted due to industrial confidentiality.
Conflicts of Interest
The author declares no conflicts of interest.
Abbreviations
The following abbreviations are used in this manuscript:
| DN | Diameter Nominal |
| EF | Emission Factor |
| FAD | Free Air Delivery |
| IE2 | International Efficiency Class 2 |
| IEA | International Energy Agency |
| ISO | International Organization for Standardization |
| LD | Leakage Detection |
References
- Mousavi, S.; Kara, S.; Kornfeld, B. Energy efficiency of compressed air systems. Procedia CIRP 2014, 15, 313–318. [Google Scholar] [CrossRef]
- Herron, D.J. Understanding the basics of compressed air systems. Energy Eng. 1999, 96, 19–32. [Google Scholar] [CrossRef]
- Foss, R.S. Optimizing the compressed air system. Energy Eng. 2005, 102, 49–60. [Google Scholar] [CrossRef]
- Terrell, R.E. Improving compressed air system efficiency—Know what you really need. Energy Eng. 1999, 96, 7–15. [Google Scholar] [CrossRef]
- Bredenkamp, J.I.G.; van der Zee, L.F.; van Rensburg, J.F. Reconfiguring mining compressed air networks for cost savings. In Proceedings of the 2014 International Conference on the Eleventh Industrial and Commercial Use of Energy (ICUE), Cape Town, South Africa, 13–14 August 2014; IEEE: Piscataway, NJ, USA, 2014; pp. 1–8. [Google Scholar] [CrossRef]
- Widayati, E.; Nuzahar, H. Compressed air system optimization: Case study food industry in Indonesia. IOP Conf. Ser. Mater. Sci. Eng. 2016, 105, 012018. [Google Scholar] [CrossRef]
- Herrera, H.H.; Villalba, D.P.; Angarita, E.N.; Ortega, J.S.; Echavarría, C.C. Energy savings in compressed air systems: A case study. IOP Conf. Ser. Mater. Sci. Eng. 2021, 1154, 012009. [Google Scholar] [CrossRef]
- Tian, X.L.; Hu, S.G.; Qin, H.B.; Zhao, J.; Ran, L.Y. Energy consumption and energy saving research status of air compressor system. Appl. Mech. Mater. 2014, 628, 225–228. [Google Scholar] [CrossRef]
- Benedetti, M.; Bertini, I.; Introna, V.; Ubertini, S. Explorative study on compressed air systems’ energy efficiency in production and use: First steps towards the creation of a benchmarking system for large and energy-intensive industrial firms. Appl. Energy 2018, 227, 436–448. [Google Scholar] [CrossRef]
- Eret, P.; Harris, C.; O’Donnell, G.; Meskell, C. A practical approach to investigating energy consumption of industrial compressed air systems. Proc. Inst. Mech. Eng. A J. Power Energy 2012, 226, 28–36. [Google Scholar] [CrossRef]
- Dindorf, R. Estimating potential energy savings in compressed air systems. Procedia Eng. 2012, 39, 204–211. [Google Scholar] [CrossRef]
- Šešlija, D.D.; Milenković, I.M.; Dudić, S.P.; Šulc, J.I. Improving energy efficiency in compressed air systems—Practical experiences. Therm. Sci. 2016, 20, S355–S370. [Google Scholar] [CrossRef]
- Perz, K.; Rewolińska, A. Impact of network expansions on energy losses in compressed air. IOP Conf. Ser. Mater. Sci. Eng. 2020, 743, 012045. [Google Scholar] [CrossRef]
- Carello, M.; Ivanov, A.; Mazza, L. Pressure drop in pipe lines for compressed air: Comparison between experimental and theoretical analysis. WIT Trans. Eng. Sci. 1998, 18, 10. [Google Scholar]
- Doyle, F.; Cosgrove, J. An approach to optimising compressed air systems in production operations. Int. J. Ambient Energy 2018, 39, 194–201. [Google Scholar] [CrossRef]
- Ripol-Saragosi, T.; Ripol-Saragosi, L.; Smychok, I. Compressed air quality increase for rolling stock pneumatic systems based on energy efficiency. Transp. Probl. 2018, 13, 13–21. [Google Scholar] [CrossRef]
- Indah, N.; Kusuma, Y. Compressed air quality: A case study in Paiton coal fired power plant unit 1 and 2. IOP Conf. Ser. Mater. Sci. Eng. 2018, 343, 012031. [Google Scholar] [CrossRef]
- Kaya, D.; Phelan, P.; Chau, D.; Sarac, H.I. Energy conservation in compressed-air systems. Int. J. Energy Res. 2002, 26, 837–849. [Google Scholar] [CrossRef]
- Saidur, R.; Rahim, N.A.; Hasanuzzaman, M. A review on compressed-air energy use and energy savings. Renew. Sustain. Energy Rev. 2010, 14, 1135–1153. [Google Scholar] [CrossRef]
- Hernandez-Herrera, H.; Silva-Ortega, J.I.; Martínez Diaz, V.L.; García Sanchez, Z.; González García, G.; Escorcia, S.M.; Zarate, H.E. Energy savings measures in compressed air systems. Int. J. Energy Econ. Policy 2020, 10, 414–422. [Google Scholar] [CrossRef]
- Eras, J.J.C.; Gutiérrez, A.S.; Santos, V.S.; Ulloa, M.J.C. Energy management of compressed air systems: Assessing the production and use of compressed air in industry. Energy 2020, 213, 118662. [Google Scholar] [CrossRef]
- Trianni, A.; Accordini, D.; Cagno, E. Identification and categorization of factors affecting the adoption of energy efficiency measures within compressed air systems. Energies 2020, 13, 5116. [Google Scholar] [CrossRef]
- Nehler, T.; Parra, R.; Thollander, P. Implementation of energy efficiency measures in compressed air systems: Barriers, drivers and non-energy benefits. Energy Effic. 2018, 11, 1281–1302. [Google Scholar] [CrossRef]
- Benedetti, M.; Bonfà, F.; Introna, V.; Santolamazza, A.; Ubertini, S. Real time energy performance control for industrial compressed air systems: Methodology and applications. Energies 2019, 12, 3935. [Google Scholar] [CrossRef]
- Abela, K.; Refalo, P.; Francalanza, E. Analysis of pneumatic parameters to identify leakages and faults on the demand side of a compressed air system. Clean. Eng. Technol. 2022, 6, 100355. [Google Scholar] [CrossRef]
- Çağman, S.; Soylu, E.; Ünver, Ü. A research on the easy-to-use energy efficiency performance indicators for energy audit and energy monitoring of industrial compressed air systems. J. Clean. Prod. 2022, 365, 132698. [Google Scholar] [CrossRef]
- Loganathan, A.K.; Stonier, A.A.; Uma Maheswari, Y.; Peter, G.; Lawrence, T.S. A real-time implementation of air audit system for compressors towards energy conservation: An industrial case study. Math. Probl. Eng. 2022, 2022, 5168153. [Google Scholar] [CrossRef]
- Nascimento, G.F.M.; Wurtz, F.; Kuo-Peng, P.; Delinchant, B.; Batistela, N.J. Quantifying compressed air leakage through non-intrusive load monitoring techniques in the context of energy audits. Energies 2022, 15, 3213. [Google Scholar] [CrossRef]
- Dindorf, R.; Wos, P. Indirect method of leakage flow rate measurement in compressed air pipelines. Appl. Mech. Mater. 2014, 630, 288–293. [Google Scholar] [CrossRef]
- Dudić, S.; Ignjatović, I.; Šešlija, D.; Blagojević, V.; Stojiljković, M. Leakage quantification of compressed air using ultrasound and infrared thermography. Measurement 2012, 45, 1689–1694. [Google Scholar] [CrossRef]
- Zaim, A.; Aras, H. Energy efficiency in pneumatic systems. Mühendis Makina 2020, 61, 31–45. (In Turkish) [Google Scholar] [CrossRef]
- Gryboś, D.; Leszczyński, J.S. A review of energy overconsumption reduction methods in the utilization stage in compressed air systems. Energies 2024, 17, 1495. [Google Scholar] [CrossRef]
- Abela, R.; Refalo, P.; Borg, M.; Francalanza, E. Pneumatic control for sustainable compressed air systems: Multi-criteria optimisation for energy efficient production. Procedia CIRP 2024, 122, 247–252. [Google Scholar] [CrossRef]
- Barad, D.; Buechler, J.; Rasmussen, B. Optimizing compressed air system efficiency in manufacturing: A study on air leak repairs and economical impact. In Proceedings of the International Manufacturing Science and Engineering Conference, Greenville, SC, USA, 23–27 June 2025; ASME: New York, NY, USA, 2025; Volume 89022, p. V002T10A010. [Google Scholar] [CrossRef]
- McNelly, M.; Choi, J.K. Pathway to decarbonization through industrial energy efficiency: Micro and macro perspectives from compressed air usage. Int. J. Precis. Eng. Manuf. Green Technol. 2024, 11, 1575–1591. [Google Scholar] [CrossRef]
- Uyan, E. Energy saving potential analysis of a short cycling industrial air compressor in a marine equipment manufacturing plant in Türkiye. Clean. Responsible Consum. 2023, 11, 100147. [Google Scholar] [CrossRef]
- Ismail, M.A.; Mohd Tohid, M.Z.W.; Bakri, A.; Januddi, F.S.; Narasiah, N.; Yusof, M.I. Compressed air (CdA) system energy audit: A case study on quantifying the CdA leak with the SONAPHONE UT technology. In Advanced Transdisciplinary Engineering and Technology; Springer: Cham, Switzerland, 2022; pp. 213–220. [Google Scholar] [CrossRef]
- Salomone-González, D. Advanced strategies for the efficient optimization and control of industrial compressed air systems. Results Eng. 2025, 26, 105429. [Google Scholar] [CrossRef]
- Du, H.; Liu, W.; Bian, X.; Xiong, W. Energy-saving for industrial pneumatic actuation systems by exhausted air reuse based on a constant pressure elastic accumulator. Sustainability 2022, 14, 3535. [Google Scholar] [CrossRef]
- Boyko, V.; Weber, J. Energy efficiency of pneumatic actuating systems with pressure-based air supply cut-off. Actuators 2024, 13, 44. [Google Scholar] [CrossRef]
- Yu, Q.; Han, Z.; Yu, R.; Qin, R.; Hao, X.; Sun, G. Research on energy-saving characteristic analysis, optimization, and performance evaluation of a dual-mode pneumatic actuator system. Iran. J. Sci. Technol. Trans. Mech. Eng. 2025, 1–17. [Google Scholar] [CrossRef]
- Marshall, R.C. Optimization of single-unit compressed air systems. Energy Eng. 2012, 109, 10–35. [Google Scholar] [CrossRef]
- Dharma, A.; Budiarsa, N.; Watiniasih, N.; Antara, N.G. No cost–low cost compressed air system optimization in industry. J. Phys. Conf. Ser. 2018, 989, 012002. [Google Scholar] [CrossRef]
- ISO 11011:2013; Compressed Air—Energy Efficiency—Assessment. International Organization for Standardization: Geneva, Switzerland, 2013.
- ISO 8573-1:2010; Compressed Air—Contaminants and Purity Classes. International Organization for Standardization: Geneva, Switzerland, 2010.
- International Energy Agency. CO2 Emissions from Fuel Combustion: Highlights; IEA Publications: Paris, France, 2023. [Google Scholar]
Disclaimer/Publisher’s Note: The statements, opinions and data contained in all publications are solely those of the individual author(s) and contributor(s) and not of MDPI and/or the editor(s). MDPI and/or the editor(s) disclaim responsibility for any injury to people or property resulting from any ideas, methods, instructions or products referred to in the content. |
© 2025 by the author. Licensee MDPI, Basel, Switzerland. This article is an open access article distributed under the terms and conditions of the Creative Commons Attribution (CC BY) license (https://creativecommons.org/licenses/by/4.0/).