Abstract
2-Methyl-3-butenenitrile, a key intermediate in the industrial production of Nylon-66, is often accompanied by two other by-products, 2-methyl-2-butenenitrile and 2-pentenenitrile, which have been proven to affect the production yield and quality of Nylon-66. Pure 2-pentenenitrile is a commercial synthetic intermediate for many chemical products and bioactive substances. As important foundational data for designing large-scale separation and purification processes for these three compounds are lacking, the saturated vapor pressure of pure 2-pentenenitrile was measured over the temperature range 298.5 K to 401.4 K, and vapor–liquid equilibrium (VLE) data for the binary systems (2-methyl-3-butenenitrile + 2-pentenenitrile, 2-methyl-2-butenenitrile + 2-pentenenitrile) were determined at pressures of 50.0 kPa and 100.0 kPa. In order to better utilize these experimental data for the design of large-scale separation distillation processes, the experimental saturated vapor pressure data of pure 2-pentenenitrile were well correlated using the Antoine equation, yielding an average relative deviation of 0.92%. For all binary systems, the thermodynamic consistency of the VLE results was verified using both the point test and the direct test. The binary VLE data were correlated with the Wilson and NRTL activity coefficient models, and the corresponding model parameters were obtained by regression, which can help to obtain complete data in the whole mole fraction range for industrial separation design.
1. Introduction
The large-scale production of adiponitrile (AdN), a key precursor of Nylon-66, represents a significant catalytic industrial process [1,2,3]. AdN synthesis routes have been extensively studied [4,5,6], with the DuPont process constituting a prominent method. This process features a critical step: the isomerization of 2-methyl-3-butenenitrile (2M3BN) to 3-pentenenitrile (3PN) [7]. However, undesirable side reactions generate by-products, primarily 2-methyl-2-butenenitrile (2M2BN) and 2-pentenenitrile (2PN), within the reaction system. These by-products have been demonstrated to significantly inhibit catalyst activity, leading to a reduced yield [8]. 2M3BN, 2M2BN, and 2PN are all commercial compounds as synthetic intermediates of many chemical products such as amines, imines, amides, aldehydes, ketones, and carboxylic acid derivatives [9]. 2PN was proven to be main bioactive volatile in brassica juncea for the management of tribolium castaneum and corcyra cephalonica [10]. Consequently, developing effective separation methods for the 2M3BN, 2M2BN, and 2PN mixture is essential.
Because of their similar physical properties, the separation and purification of 2M3BN, 2M2BN, and 2PN is difficult. Large-scale separation research on them was greatly restricted due to the lack of basic thermodynamic data on pure 2M3BN, 2M2BN, and 2PN. For example, the research of 2M3BN mainly focused on its transformation, including method and theory [11]. Although there has been biologically selective catalysis research [12], large-scale separation is difficult to achieve on this basis. In the early literature [13], researchers studied the separation of 2M2BN and 2PN, but the work aimed at removing them from a mixed solution and not obtaining pure material of 2M2BN and 2PN. So, it is a very important and necessary foundational work to test the vapor–liquid phase equilibrium of 2M3BN, 2M2BN, and 2PN, which can provide basic data for large-scale separation process design, for example, distillation and absorption.
Distillation remains a preferred industrial separation technique, particularly for large-scale operations, due to its economic advantages. Successful distillation requires sufficient differences in component boiling points. However, conventional distillation is ineffective for separating 2M2BN and 2PN from 2M3BN due to their close boiling points. In such cases, rigorous distillation design, necessitating comprehensive VLE data, is required. From previous research, VLE data for the (2M3BN + 2M2BN) system have been reported [14]. But the design of a large-scale distillation separation process for 2M3BN, 2M2BN, and 2PN is restricted because of the lack of vapor pressure data on 2PN and VLE data on binary systems (2PN + 2M3BN, 2PN + 2M2BN). In recent years, research on vapor–liquid equilibrium (VLE) measurements, a field of fundamental importance with direct industrial relevance, has been largely driven by its industrial applicability. For example, Zanghelini et al. [15] determined the isobaric VLE data of α-terpineol highly diluted in hydroalcoholic mixtures at 101.3 kPa because of its application in the design and simulation of distillation processes for the production of alcoholic beverages. Recent VLE research has mainly focused on new systems or systems with significant industrial application value [16,17,18]. In addition, the determination of VLE data under extreme conditions has been one of the hot topics in binary-phase equilibrium research in recent years [19,20,21].
Because the process optimization of distillation often requires vapor–liquid phase equilibrium data across the entire mole fraction range, it is necessary to perform model correlation on the measured VLE data. Over the past decades, numerous models have been employed to correlate vapor–liquid equilibrium (VLE) data, such as the PC-SAFT, mG-SAFT [21], PR + vdW [22,23], UNIFAC [18], CPA EoS [24,25], and NRTL [17,18,26] models. In addition, machine learning has been employed for VLE data correlation [27], alongside the well-established use of Aspen for process simulation [28]. The selection of an appropriate model primarily depends on the specific properties of the system under study. Among numerous thermodynamic models, the UNIFAC and NRTL models are the most widely used. The NRTL model, in particular, is well suited for this study due to its proven capability in handling polar and non-ideal systems. The UNIFAC model is more suitable for the systems with significant structural differences. According to the properties of 2M3BN, 2M2BN, and 2PN, the Wilson model, usually used in partially miscible systems, is also worth using as a model for processing the VLE data of binary systems (2PN + 2M3BN, 2PN + 2M2BN).
This work addresses the gap described above by measuring the saturated vapor pressure of pure 2PN across a temperature range and determining the isobaric VLE data for the relevant binary systems. The objective of this research is to perform model regression on the experimental data to predict binary VLE data over the full mole fraction range at a specified temperature.
2. Materials and Methods
2.1. Chemicals
2M3BN (mass fraction purity 0.9163), 2M2BN (mass fraction purity 0.7686), and 2PN (mass fraction purity 0.9167) were provided by Chongqing Unislendour Chemical Co., Ltd. (Chongqing, China). Prior to their use in subsequent VLE measurements, the raw materials were purified by distillation with about 100 theoretical plates to enhance their purity. The mass fractions of the raw materials and chemical reagents are summarized in Table 1.

Table 1.
Mass fractions of chemical samples.
2.2. Apparatus and Procedure
The apparatus used to measure the vapor pressure of pure 2PN is shown in Figure 1. The apparatus, using a three-necked flask as the main test vessel, was heated by an electric heater. Before use, the equipment was checked for air tightness. During the airtightness inspection, the system was subjected to a positive pressure of 2 atm and a negative pressure of −1 atm (relative to atmospheric pressure) for one hour each, using a high-pressure cylinder (Natural Gas Research Institute of Southwest Oil and Gas Field Company. Chengdu, China) and a vacuum pump (Shanghai Haoxin Electromechanical Equipment Co., Ltd., Shanghai, China), respectively. The system demonstrated excellent airtightness, as evidenced by no change in the U-tube manometer (Wuqiang County Yuanfang Instrument Co., Ltd., Hengshui, China) reading over the one-hour test period. To validate the reliability of the apparatus for saturated vapor pressure measurement, the vapor pressure of water was determined. The mean and maximum relative deviations between the measured values and the literature data [29] were 0.14% and 0.83%, respectively. This level of agreement confirms the reliability of the apparatus. When the vapor pressure (with a standard uncertainty of ±2 mmHg) was tested, about 100 mL of 2PN was first added to the flask, and the liquid was heated to a temperature of about 50 °C. Then, the vacuum pump (No. 13 in Figure 1) was started to evacuate the test system; the air in the system, vapor generated by 2PN, and air dissolved in 2PN were extracted from the system. After 5 min, the air in the system and the air dissolved in 2PN were completely eliminated from the system. The vacuum pump was turned off and the 2PN was cooled in the vacuum apparatus. At this point, there was only 2PN as a component in the system. Then, the 2PN was warmed to a given temperature (with a standard uncertainty of ±0.1 K). The standard uncertainty of temperature, u(T) = ±0.1 K, is based on the calibrated accuracy of the platinum resistance thermometer. The contributions from potential thermal gradients within the equilibrium cell were estimated to be an order of magnitude smaller and are therefore considered negligible. Data on the temperature and pressure were recorded upon stabilization of the mercury thermometer and differential pressure gauge readings over a 20 min period.
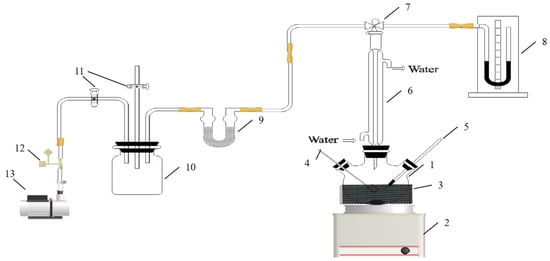
Figure 1.
Vapor pressure apparatus: 1—three-necked flask; 2—magnetic stirrer; 3—thermal insulation material; 4—heater; 5—mercury-in-glass thermometer; 6—condenser; 7—three-way valve; 8—mercury differential pressure gauge; 9—molecular sieve; 10—buffer bottle; 11—two-way valve; 12—solenoid valve; 13—vacuum pump.
The VLE data for the binary system were measured using a custom-built apparatus that was designed and utilized in our previous studies [30]. In this study, the apparatus was slightly optimized for simpler operation as shown in Figure 2. The apparatus contained a stainless steel VLE cell (Shanghai Baikaltech Technology Group Co., Ltd., Shanghai, China) that was heated by a thermostatic magnetic stirrer (Shanghai Sile Instrument Co., Ltd, Shanghai, China) and was entangled by resistance wire to ensure uniform and stable heat. All ports were made hermetic using silica gel gaskets (Shanghai Techcomp Instrument Ltd., Shanghai, China), and a 2XZ-4 vacuum pump (Shanghai Haoxin Electromechanical Equipment Co., Ltd. Shanghai, China) was used to vacuum the VLE cell. The temperature was measured using a mercury-in-glass thermometer (Wuqiang Feiyang Instrument Factory, Hengshui, China) with standard uncertainty of ±0.1 K, and the pressure was ensured by a pressure transmitter (Beijing collihigh sensing technology Co., Ltd., Beijing, China) with a relative standard uncertainty of 0.001 (±0.1 kPa in this apparatus).
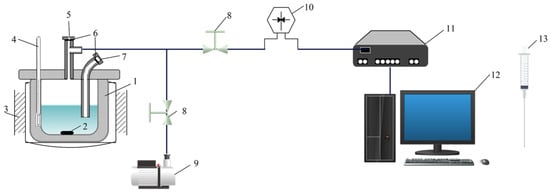
Figure 2.
VLE apparatus: 1—stainless vapor–liquid balance still; 2—magnetic stirrer; 3—insulation resistance wire; 4—mercury-in-glass thermometer; 5—vapor and liquid sample port; 6—silica gel gasket; 7—injection port; 8—regulating valve; 9—vacuum pump; 10—pressure transmitter; 11—data acquisition system; 12—operation desk; 13—sampling needle.
Prior to use, the VLE apparatus was checked for airtightness following the same procedure as described for the vapor pressure measurements. The reliability of the apparatus was verified by benchmarking the measured VLE data for the n-propanol + N,N-dimethylformamide system against the literature [31], which yielded maximum and mean relative deviations of 2.59% and 1.09%, respectively. To remove dissolved air, all reagents were degassed by ultrasonication in conical flasks for 15 min before use. The VLE data measurement procedure was as follows: Firstly, the vacuum pump was used to evacuate the air in the VLE cell, and 15 mL of mixture with a certain proportion was injected into the cell. Then, the pressure was adjusted to a certain value. When the temperature was retained for over 20 min, the temperature was recorded. Finally, vapor and liquid samples were simultaneously withdrawn using a 15 cm syringe and transferred into Eppendorf tubes (Beijing Labgic Technology Co., Ltd. Beijing, China) containing 0.5 mL of methanol for subsequent gas chromatography analysis.
2.3. Analysis
The composition analyses of the vapor and liquid phases were performed using a gas chromatograph (GC7900, Shanghai Tianmei, Co., Ltd., Shanghai, China) equipped with a flame ionization detector (FID) and a TM-1701 column (30 m × 0.32 mm). The D-7900P workstation (Shanghai Techcomp Instrument Co., Ltd., Shanghai, China) was used for data acquisition and processing. An external standard, n-propanol, was used for peak-area quantification. The GC analysis was conducted under the following conditions: high-purity nitrogen as the carrier gas (50 mL·min−1); hydrogen generated by an SPGH-300 generator (Shanghai Tianmei, Co., Ltd., Shanghai, China) (20 mL·min−1); an air flow rate of 150 mL·min−1. The column, injector, and detector temperatures were set at 363, 473, and 473 K, respectively. Very good peak separation was achieved under these conditions, and calibration analyses were carried out to convert the peak area ratio to the mass composition of the samples. Each sample was analyzed in triplicate, yielding a mean absolute deviation in mole fraction of less than 0.001.
3. Results and Discussion
3.1. Pure Component Vapor Pressures
The saturated vapor pressures for the pure component 2PN were determined experimentally in the temperature range 298.5–401.4 K, and the results are shown in Table 2. The measured vapor pressures were correlated using the Antoine equation. The Antoine equation was selected for its proven accuracy within the experimental temperature range and its established utility in industrial process design.

Table 2.
Vapor pressure data and deviation for 2PN a.
In Equation (1), pio is the saturated vapor pressure of 2PN, and T is the temperature at which this vapor pressure is measured. The parameters (A, B, C) for the Antoine equation were determined by performing a non-linear least-squares regression on the experimental vapor pressure data. The Antoine equation parameters obtained from regression are summarized in Table 3. The fit quality was excellent, as evidenced by a coefficient of determination (R2) of 0.9999 and an average residual of 0.28. The vapor pressures calculated using the regressed Antoine coefficients are summarized in Table 2. The agreement between the calculated and experimental values is shown in Figure 3, and their relative deviation was evaluated using the following equation:
where pe is the experimental vapor pressure and pc is the value calculated by the Antoine equation.

Table 3.
Antoine parameters used to calculate vapor pressure of pure components.
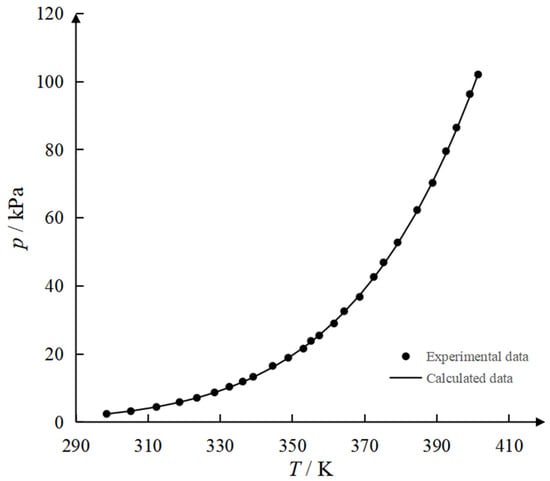
Figure 3.
Experimental and calculated vapor pressures of 2PN.
Figure 3 suggests that the vapor pressure of 2PN is well represented by the Antoine equation. The consistent adherence of the vapor pressure data to the Antoine equation demonstrated a regular and continuous evaporation process. This ruled out significant abnormal phase transitions or molecular associations and verified the stability of the substance’s physicochemical properties. These coefficients can be directly applied to subsequent thermodynamic calculations, including data regression, distillation process design, and optimization control for the binary system.
3.2. Isobaric Binary Systems
The temperature T and the liquid-phase x1 and vapor-phase y1 mole fractions at 50.0 kPa and 100.0 kPa for the binary systems 2M3BN (1) + 2PN (2) and 2M2BN (3) + 2PN (2) are reported in Table 4 and Table 5, respectively. Experimental VLE data from this research are graphically presented as y-x and T-x,y diagrams in Figure 4 and Figure 5. For every experiment’s data, the vapor and liquid samples were analyzed, and the average mole fraction and standard deviation were estimated. The maximum standard deviations were 0.0167 and 0.0134 for the binary system 2M3BN + 2PN at 50.0 kPa and 100.0kPa, respectively. The average standard deviations were 0.0089 and 0.0078 for the binary system 2M3BN + 2PN at 50.0 kPa and 100.0 kPa, respectively. For the binary system 2M2BN + 2PN, the maximum standard deviations were 0.0142 and 0.0129, respectively. The average standard deviations were 0.0073 and 0.0058 for the binary system 2M2BN + 2PN at 50.0 kPa and 100.0 kPa, respectively.

Table 4.
VLE data, experimental temperature T, liquid-phase mole fraction of 2M3BN x1, vapor-phase mole fraction of 2M3BN y1, activity coefficients γi, calculated temperature deviation ∆T, and calculated 2M3BN mole fraction of vapor–liquid deviation ∆y1 for the binary system of 2M3BN (1) + 2PN (2) at 50.0 kPa and 100.0 kPa a.

Table 5.
VLE data, experimental temperature T, liquid-phase mole fraction of 2M2BN x1, vapor-phase mole fraction of 2M2BN y1, activity coefficients γi, calculated temperature deviation ∆T, and calculated 2M2BN mole fraction of vapor–liquid deviation ∆y1 for the binary system of 2M2BN (3) + 2PN (2) at 50.0 kPa and 100.0 kPa a.
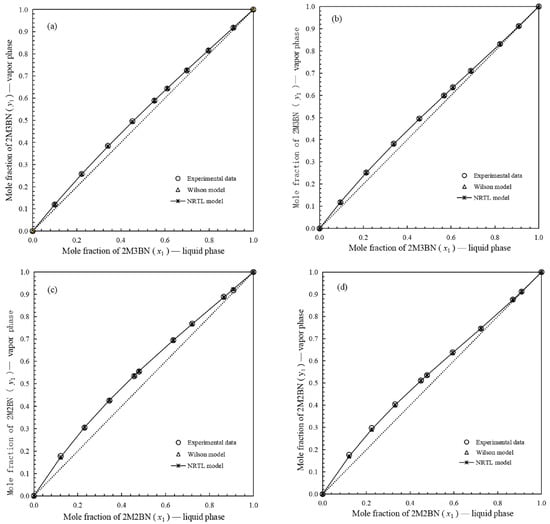
Figure 4.
Vapor mole fraction as function of liquid mole fraction for binary systems: (a), y-x for binary system of 2M3BN (1) + 2PN (2) at 50.0 kPa; (b), y-x for binary system of 2M3BN (1) + 2PN (2) at 100.0 kPa; (c), y-x for binary system of 2M2BN (3) + 2PN (2) at 50.0 kPa; (d), y-x for binary system of 2M2BN (3) + 2PN (2) at 100.0 kPa; ○, experimental data on mole fraction; ∆, calculated data on mole fraction by Wilson model;  , calculated data on mole fraction by NRTL model.
 , calculated data on mole fraction by NRTL model.
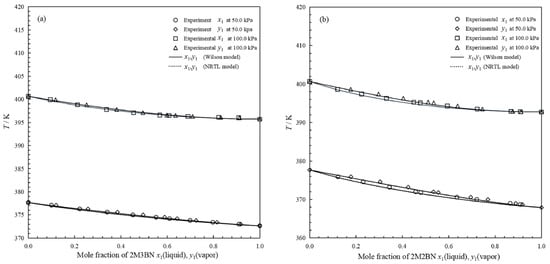
Figure 5.
Comparison of experimental data and calculated data for binary systems: (a), binary system of 2M3BN (1) + 2PN (2); (b), binary system of 2M2BN (3) + 2PN (2); ○, experimental data on mole fraction in liquid phase (50 kPa); ◊, experimental data on mole fraction in vapor phase (50 kPa); □, experimental data on mole fraction in liquid phase (100 kPa); ∆, experimental data on mole fraction in vapor phase (100 kPa); ―, calculated data by Wilson model; ⋯, calculated data by NRTL model.
In Table 4 and Table 5, the activity coefficients of pure liquid i (γi) were calculated from the equality of component fugacity in both liquid and vapor phase under the assumptions of an ideal vapor phase and unity in the Poynting factor, i.e.,
where xi and yi are the liquid and vapor mole fractions at equilibrium for pure component i, p is the total binary system pressure, and pio is the vapor pressure for pure component i calculated by the Antoine equation.
For the binary system 2M3BN + 2PN, Figure 4 shows a slight deviation of the gas–liquid equilibrium line from the diagonal, indicating a small difference in volatility between the two components. This means that 2M3BN and 2PN can be separated by distillation but require a larger number of plates. As observed in Figure 4a,b, the relative volatility of 2M3BN + 2PN exhibits minimal sensitivity to operating pressures between 50 and 100 kPa. Therefore, the distillation separation efficiency is largely unaffected within this pressure range. As shown in Figure 4c,d, the vapor–liquid equilibrium curve of the 2M2BN + 2PN system deviated more significantly from the diagonal than did that of the 2M3BN + 2PN system, confirming its higher relative volatility. This result means that 2M2BN and 2PN can be easily separated using distillation. A comparison of Figure 4c,d reveals that mixtures 2M2BN and 2PN exhibit higher relative volatility at 50 kPa than at 100 kPa, suggesting a significant advantage for low-pressure distillation operations.
The results in Figure 5a indicate that the difference in volatility between 2M3BN and 2PN is sufficient to permit separation by distillation. However, the feasible operating temperature range for this process is narrow. The design of the distillation process is critically dependent on the vapor–liquid equilibrium (VLE) data for the 2M3BN + 2PN system. This dependency is particularly critical due to the exceptionally narrow operating temperature range. In contrast to the 2M3BN + 2PN system, the results in Figure 5b demonstrated that the 2M2BN + 2PN system exhibited a wider operating temperature range and a more pronounced separation tendency, thus making distillation a highly effective separation method.
3.3. Thermodynamic Consistency Test
According to Wisniak’s detailed discussion on thermodynamic testing methodologies [32], the experimental data from these two binary systems were tested for thermodynamic consistency by using the point test of Fredenslund et al. [33]. According to Fredenslund et al., a set of p-T-x1-y1 data is declared consistent if the average absolute deviation of yie and yic is less than 0.01 units, that is,
where n is the number of components, and yic and yie represent the vapor-phase mole fractions of component i calculated by Legendre polynomials and obtained from experiments, respectively. The results of the point consistency test for the VLE data from the two binary systems are shown in Table 6. The results from the point consistency tests of Fredenslund et al. indicated that the VLE data for all binary systems were thermodynamically consistent.

Table 6.
Consistency test for the binary systems of 2-methyl-3-butenenitrile (1) + 2-pentenenitrile (2) and 2-methyl-2-butenonitrile (3) + 2-pentenenitrile (2).
Moreover, the “direct test of consistency” discussed by Van Ness [34] was used to verify the quality of the binary VLE experimental data. In the direct test, a consistency index associated with the test characterizes the degree of departure of a data set from consistency. This method does not directly assess the experimental data points themselves but rather evaluates the thermodynamic consistency by examining the deviation between the model’s predictions and the experimental values. In essence, it operates on the principle that a high-quality, internally consistent dataset should be faithfully reproducible by a sufficiently robust thermodynamic model, such as an activity coefficient model. Therefore, a high degree of agreement indicates that the data are inherently consistent with thermodynamic laws. The consistency is quantified by the root mean square (RMS) of the deviation, δln(γ1/γ2), between the experimental and predicted values. Based on the RMS value, the VLE data are assigned a consistency level from 1 to 10, where a smaller level indicates higher thermodynamic consistency. For the binary systems in this study, the RMS of δln(γ1/γ2) was calculated between the activity coefficients obtained from experimental data and those correlated by the Wilson equation. The RMS δln(γ1/γ2) values of all binary VLE data in this study did not exceed 2. As shown in Table 6, the direct test results indicate that all binary VLE data exhibit acceptable thermodynamic consistency.
3.4. Correlation
The activity coefficients were correlated with the Wilson [35] and NRTL [36] models (α = 0.3 in this study), which are given by Equations (4) and (5).
The parameters of both the equations studied were obtained by using the Marquardt method. The sum of the squares of relative deviations between experimental activity coefficients and calculated values was minimized during optimization of the parameters. The objective function (OF) used was as follows:
where n is the number of components, γic is the activity coefficient of component i calculated by models, and γie is the experimental activity coefficient of component i calculated by Equation (2). All calculation processes containing model parameters, activity coefficients γic, calculated temperatures Tc, and vapor mole fractions yic are shown in Figure 6.
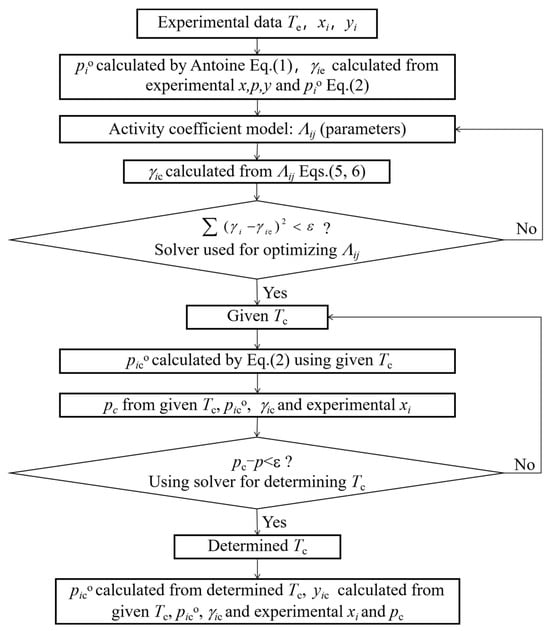
Figure 6.
Calculation procedure for binary system data using models.
The correlation results were evaluated by calculating RMS(T) and RMS(y1) as follows:
where N is the number of data points, m is the number of experimental data points, Tmc is the temperature calculated by models for isobaric binary systems, and Tme is the experimental temperature data. y1mc is the composition of the vapor phase calculated by models for isobaric binary systems, and y1me is the experimental data on the composition of the vapor phase. The correlation parameters and the deviations between the experimental and calculated data are shown in Table 7.

Table 7.
Correlation parameters for activity coefficients and deviation for studied binary systems.
For the experimental binary system of 2M3BN + 2PN, the RMS deviations were 0.0024 (p = 50.0 kPa) and 0.0013 (p = 100.0 kPa) in mole fraction, and RMS deviations of 0.20 K (p = 50.0 kPa) and 0.11 K (p = 100.0 kPa) in temperature were observed for the Wilson model. For the experimental binary system of 2M2BN + 2PN, the RMS deviations were 0.0043 (p = 50.0 kPa) and 0.0051 (p = 100.0 kPa) in mole fraction, and RMS deviations of 0.37 K (p = 50.0 kPa) and 0.38 K (p = 100.0 kPa) in temperature were observed for the Wilson model. The temperature and mole fraction deviations for the two models are summarized in Table 7. Comparisons between experimental binary data and calculated data from the Wilson and NRTL models in the form of y-x and T-y-x diagrams are shown in Figure 4 and Figure 5.
The results in Figure 4 indicate that the calculated vapor mole fractions for the two binary systems were both consistent with the experimental data at 50.0 kPa and 100.0 kPa. The calculated data from the NRTL model were close to those from the Wilson model. These two models predicted the vapor mole fraction well from the given liquid mole fraction. As shown in Figure 5, for the binary systems 2M3BN + 2PN and 2M2BN + 2PN, the curves fitted by both the Wilson and NRTL models closely matched the experimental data points, confirming the feasibility of these models for correlating the binary VLE data. Consequently, these models can be employed to provide accurate vapor–liquid equilibrium data for the binary systems 2M3BN + 2PN and 2M2BN + 2PN at relevant operating temperatures for distillation design. The data calculated by both the Wilson and NRTL models are crucial for determining the theoretical number of stages and predicting separation efficiency, thereby facilitating process optimization.
4. Conclusions
This study presented experimentally measured vapor–liquid equilibrium (VLE) data for two binary systems (2M3BN + 2PN and 2M2BN + 2PN), which successfully passed thermodynamic consistency tests. The analysis revealed distinct separation characteristics for each system. The 2M3BN + 2PN system exhibits moderate relative volatility, suitable for distillation but constrained by a narrow operating temperature window. In contrast, the 2M2BN + 2PN system demonstrates significantly higher relative volatility, indicating its potential for efficient separation with fewer theoretical stages.
The influence of pressure was found to be system-dependent. While the relative volatility of the 2M3BN + 2PN system showed negligible sensitivity to pressure reduction between 100 kPa and 50 kPa, the separation efficiency of the 2M2BN + 2PN system was markedly enhanced under lower pressure, suggesting that vacuum operation is favorable for its distillation.
Both the Wilson and NRTL models correlated the experimental data with high accuracy, as the model-fitted curves passed closely through the experimental data points. This further corroborates the high quality and thermodynamic consistency of the measured data. It is concluded that both models provide reliable parameters for predicting VLE data at arbitrary temperatures, thereby offering a robust foundation for the design and optimization of distillation processes for these specific systems.
Author Contributions
Conceptualization, Y.C.; methodology, Y.C. and F.L. data curation, Z.J.; writing—original draft preparation, Y.C. and T.L.; formal analysis, H.T.; writing—review and editing, Y.C., H.T. and S.Y.; supervision, H.S. and S.Y.; funding acquisition, S.Y. and Y.C. All authors have read and agreed to the published version of the manuscript.
Funding
This work was supported by the Scientific Research Foundation of Mianyang Teachers’ College (QD2014A008) and Natural Science Foundation of Sichuan Province (2022NSFSC1604).
Data Availability Statement
Data are contained within the article.
Acknowledgments
All the authors’ respective affiliations provided conveniences for related studies.
Conflicts of Interest
The authors declare no conflicts of interest.
Abbreviations
| p | Pressure |
| A, B, C | Antoine coefficients |
| po | Saturated vapor pressure |
| T | Temperature |
| x, y | Mole fraction |
| g | Binary interaction parameter NRTL |
| n | Number of components |
| RMS(T) | Root-mean-square deviation of temperature |
| RMS(p) | Root-mean-square deviation of pressure |
| RMS(y) | Root-mean-square deviation of mole fraction in vapor phase |
| N | Number of data points |
| γ | Activity coefficient |
| α | Non-randomness parameter of NRTL model |
| Λ | Binary interaction parameter of Wilson model |
| i | Component i |
| j | Component j |
| m | Number of experimental data |
| ie | Experimental for ith component |
| ic | Calculated for ith component |
References
- Mathison, R.; Rani, E.; Patel, M.K.; Cerrato, A.L.; Bloomquist, C.K.; Modestino, M.A. Accelerated analysis of the electrochemical production route for biomass-derived adiponitrile. Chem. Catalysis 2024, 4, 100998. [Google Scholar] [CrossRef]
- Su, J.S.; Huang, S.C.; Tsai, M.C.; Yen, C.H.; Lin, C.Y. Efficient and selective electrosynthesis of adiponitrile by electrohydrodimerization of acrylonitrile over a bismuth nanosheet modified electrode. Green Chem. 2024, 26, 8220–8229. [Google Scholar] [CrossRef]
- Guo, T.; Yan, F.Y.; Wang, Y.F.; Xu, X.F.; Jia, Q.Z.; Xu, B.H. Boosted nitrilation of dimethyl adipate with NH3 to adiponitrile over bimetallic oxide: Synergetic effect between Nb and W. Chem. Eng. Sci. 2023, 281, 119121. [Google Scholar] [CrossRef]
- Tessonnier, J.P. When bio- and electrocatalysis meet: A leap forward in the sustainable production of adiponitrile. Chem. Catalysis 2024, 4, 101008. [Google Scholar] [CrossRef]
- Lv, Y.; Cui, H.; Liu, P.; Hao, F.; Xiong, W.; Luo, H. Functionalized multi-walled carbon nanotubes supported Ni-based catalysts for adiponitrile selective hydrogenation to 6-aminohexanenitrile and 1,6-hexanediamine: Switching selectivity with [Bmim]OH. J. Catal. 2019, 372, 330–351. [Google Scholar] [CrossRef]
- Bini, L.; Houben, E.J.E.; Pidko, E.A.; Müller, C.; Vogt, D. Nickel-catalyzed isomerization of 2-methyl-3-butenenitrile to 3-pentenenitrile: A kinetic study using in situ FTIR-ATR spectroscopy. Catal. Today 2010, 155, 271–278. [Google Scholar] [CrossRef]
- Liu, K.; Xin, H.; Han, M. Elucidation of key factors in nickel-diphosphines catalyzed isomerization of 2-methyl-3-butenenitrile. J. Catal. 2019, 377, 13–19. [Google Scholar] [CrossRef]
- Liu, K.; Wang, T.; Han, M. Rational design of efficient steric catalyst for isomerization of 2-methyl-3-butenenitrile. Mol. Catal. 2020, 498, 111259. [Google Scholar] [CrossRef]
- Thiyagarajan, S.; Diskin-Posner, Y.; Montag, M.; Milstein, D. Manganese-catalyzed base-free addition of saturated nitriles to unsaturated nitriles by template catalysis. Chem. Sci. 2024, 15, 2571–2577. [Google Scholar] [CrossRef] [PubMed]
- Horijan, B.; Kundu, A.; Nebapure, S.M.; Mandal, A.; Patanjali, N.; Mukhopadhyay, A.; Yadava, D.K.; Singh, A. Bioactive volatiles of Allium sativum and Brassica juncea for management of Tribolium castaneum and Corcyra cephalonica: Comprehensive in-silico and in-vitro analysis. J. Stored Prod. Res. 2025, 114, 102736. [Google Scholar] [CrossRef]
- Li, T.; Jones, W.D. DFT Calculations of the Isomerization of 2-Methyl-3-butenenitrile by [Ni(bisphosphine)] in Relation to the DuPont Adiponitrile Process. Organometallics 2011, 30, 547–555. [Google Scholar] [CrossRef]
- Hann, E.C.; Sigmund, A.E.; Fager, S.K.; Cooling, F.B.; Gavagan, J.E.; Bramucci, M.G.; Chauhan, S.; Payne, M.S.; DiCosimo, R. Regioselective biocatalytic hydrolysis of (E,Z)-2-methyl-2-butenenitrile for production of (E)-2-methyl-2-butenoic acid. Tetrahedron 2004, 60, 577–581. [Google Scholar] [CrossRef]
- Musser, M.T.; Streitwieser, A., Jr. Selective Removal of 2-Pentenenitrile and 2-Methyl-2-Butenenetrile from 3-Pentenenitrile. U.S. Patent 3865865, 11 February 1975. [Google Scholar]
- Cao, Y.; Dai, X.; Song, H.; Yao, S.; Lan, X. Vapour pressures and isobaric vapour-liquid equilibria for binary mixtures of (ZE-2-methyl-2-butenenitrile and 2-methyl-3-butenenitrile. J. Chem. Eng. Data 2016, 61, 1573–1577. [Google Scholar] [CrossRef]
- Zanghelini, G.; Athès, V.; Esteban-Decloux, M.; Glampaoli, P.; Vitu, S. Isobaric vapour-liquid equilibrium of α-terpineol highly diluted in hydroalcoholic mixtures at 101.3 kPa: Experimental measurements and thermodynamic modeling. J. Chem. Thermodynamics 2022, 171, 106806. [Google Scholar] [CrossRef]
- Khairutdinova, V.F.; Khabrieva, I.S.; Akhmetzyanova, T.R.; Yarullina, L.Y.; Gabitova, F.R.; Polishukb, I.; Abdulagatov, I.M. Experimental study and modeling of the isothermal VLE properties of ethylbenzene in supercritical solvents (CO2 and C3H8). J. Supercrit. Fluids 2023, 203, 106060. [Google Scholar] [CrossRef]
- Moghimia, M.; Roosta, A.; Hekayati, J.; Rezaei, N. Estimating VLE behavior from SLE data in aqueous mixtures of choline chloride-sorbitol deep eutectic solvents: Experimental investigation and thermodynamic modeling using the e-NRTL model. J. Mol. Liq. 2023, 371, 121126. [Google Scholar] [CrossRef]
- Arnautovic, Z.; Weith, T.; Heberle, F.; Brüggemann, D. Isobaric vapor-liquid equilibrium for ethanol/water and binary linear siloxane mixtures at 100 kPa. Fluid Phase Equilib. 2022, 556, 113371. [Google Scholar] [CrossRef]
- Henao, J.D.; Velásquez, J.A.; Cardona, L.F.; Forero, L.A. Modeling and experimental data of LLE, VLE, kinematic Viscosity, and density for the 2-Phenylethanol+n-Heptane mixture at low pressure. J. Chem. Thermodyn. 2025, 205, 107459. [Google Scholar] [CrossRef]
- Ganesan, J.; van der Ham, A.G.J.; Brilman, D.W.F. Experimental validation of kinetics and VLE of carbon di-oxide absorption in aqueous MEA at deep removal conditions. Chem. Eng. Sci. 2026, 320, 122487. [Google Scholar] [CrossRef]
- Khabriev, I.S.; Khairutdinov, V.F.; Akhmetzyanov, T.R.; Radifovich, G.I.; Polishuk, I.; Abdulagatov, I.M. Partial molar and microstructural properties of binary propane + o-toluidine system near the critical point of pure solvent based on the VLE measurements and modeling with CP-PC-SAFT and mg-SAFT equation of states. J. Chem. Thermodyn. 2025, 201, 107395. [Google Scholar] [CrossRef]
- Liao, Y.; Dai, Y.; Xu, C. Experimental investigation on vapor-liquid equilibrium for 1,1-difluoroethane(R152a) +trans-1,3,3,3-tetrafluoropropene (R1234ze (E)) binary systems. J. Chem. Thermodyn. 2022, 175, 106899. [Google Scholar] [CrossRef]
- Peng, S.; Li, S.; Yang, Z.; Duan, Y. Vapor-liquid equilibrium measurements for the binary mixtures of pentafluoroethane (R125) with 2,3,3,3-Tetrafluoroprop-1-ene (R1234yf) and 3,3,3-Trifluoropropene (R1243zf). Int. J. Refrig. 2022, 134, 115–125. [Google Scholar] [CrossRef]
- Nwokoye, C.; Nath, D.; Abdi, M.; Khalifi, M.; Hassanzadeh, H. Vapor-liquid equilibria (VLE) of the binary mixture of normal hexane and water at P = 2.5 MPa and T = (456.85–487.85 K). Fluid Phase Equilib. 2023, 572, 113837. [Google Scholar] [CrossRef]
- Turkman, S.; Nath, D.; Abdi, M.; Hassanzadeh, H. Vapor–liquid equilibria (VLE), density, and viscosity of the ternary mixtures of ethane, water, and bitumen at T = 190–210 °C and P = 2.5 MPa—Measurements and CPA-EoS modeling. Fluid Phase Equilib. 2025, 590, 114285. [Google Scholar] [CrossRef]
- Luo, Y.; Liu, Z.; Lu, C.; Wang, X. Vapor-liquid equilibrium measurements of 3,3,3-trifluoropropene with pentaerythritol tetraheptanoate and pentaerythritol tetranonanoate. J. Chem. Thermodyn. 2022, 174, 106874. [Google Scholar] [CrossRef]
- Sharma, A.; Lee, B.S.; Shin, H.Y. Assessing suitability of glycerol-derived green solvent for the separation of n-hexane + ethanol azeotropic mixture, accompanied by VLE studies using machine learning. J. Mol. Liq. 2025, 423, 127003. [Google Scholar] [CrossRef]
- Guo, J.; Hu, B.; Li, Z.; Zheng, Y.; Zhou, C.; Li, Q. Vapor-liquid equilibrium experiment and extractive distillation process design for the azeotrope ethyl propionate n-propanol using ionic liquid. J. Mol. Liq. 2022, 350, 118492. [Google Scholar] [CrossRef]
- International Association for the Properties of Water and Steam. Revised Release on the IAPWS Industrial Formulation 1997 for the Thermodynamic Properties of Water and Steam; IAPWS: Lucerne, Switzerland, 2007. [Google Scholar]
- Wang, D.C.; Yao, S.; Cao, Y.; Yao, T.; Song, H. Vapor pressures and isobaric (vapor + liquid) equilibrium data for the binary system of (RS-4-vinyl-1-cyclohexene + ZE-3-pentenenitrile) at (50.0 and 100.0) kPa. J. Chem. Thermodyn. 2016, 92, 55–59. [Google Scholar] [CrossRef]
- Wang, C.; Li, H.; Zhu, L.; Han, S. Isothermal and isobaric vapor + liquid equilibria of N,N-dimethylformamide + n-propanol + n-butanol. Fluid Phase Equilib. 2001, 189, 119–127. [Google Scholar] [CrossRef]
- Wisniak, J.; Ortega, J.; Fernández, L. A fresh look at the thermodynamic consistency of vapour-liquid equilibria data. J. Chem. Thermodyn. 2017, 105, 385–395. [Google Scholar] [CrossRef]
- Fredenslund, A.; Gmehling, J.; Rasmussen, P. Vapour-Liquid Equilibria Using UNIFAC a Group-Contribution Method, 1st ed.; Elsevier: Amsterdam, The Netherlands, 1977. [Google Scholar]
- Van Ness, H.C. Thermodynamics in the treatment of capor/liquid equilibrium (VLE) data. Pure Appl. Chem. 1995, 67, 859–872. [Google Scholar] [CrossRef]
- Wilson, G.M. Vapor-liquid equilibria XI. A new expression for the excess free energy of mixing. J. Am. Chem. Soc. 1964, 86, 127–130. [Google Scholar] [CrossRef]
- Renon, H.; Prausnitz, J.M. Local compositions in thermodynamics for liquid mixtures. AIChE J. 1968, 14, 135–144. [Google Scholar] [CrossRef]
Disclaimer/Publisher’s Note: The statements, opinions and data contained in all publications are solely those of the individual author(s) and contributor(s) and not of MDPI and/or the editor(s). MDPI and/or the editor(s) disclaim responsibility for any injury to people or property resulting from any ideas, methods, instructions or products referred to in the content. |
© 2025 by the authors. Licensee MDPI, Basel, Switzerland. This article is an open access article distributed under the terms and conditions of the Creative Commons Attribution (CC BY) license (https://creativecommons.org/licenses/by/4.0/).