Article

Research on Electrical Properties of the Cutting Zone in Cutting Metal/Insulation Materials

1
Zhejiang Engineering Research Center of Advanced Water Conservancy Equipment, Zhejiang University of Water Resources and Electric Power, Hangzhou 310018, China
2
Nanxun Innovation Institute, Zhejiang University of Water Resources and Electric Power, Hangzhou 310018, China
3
Hangzhou Borong Science and Technology Co., Ltd., Hangzhou 311103, China
4
Zhejiang Key Laboratory of Pumps and Turbines, Zhejiang University of Water Resources and Electric Power, Hangzhou 310018, China
5
Key Laboratory of Key Technologies for Mechanical Industry Hydroelectric Power Generation Pump Turbine, Zhejiang University of Water Resources and Electric Power, Hangzhou 310018, China
6
National Academy of Sciences of Tajikistan Center of Innovative Development of Science and New Technologies, 64 lsmoili Somoni, Dushanbe 734026, Tajikistan
7
College of Mechanical Engineering, Zhejiang University of Technology, 288, Liuhe Road, Hangzhou 310023, China
*
Author to whom correspondence should be addressed.
Processes 2025, 13(11), 3587; https://doi.org/10.3390/pr13113587
Submission received: 1 October 2025 / Revised: 22 October 2025 / Accepted: 25 October 2025 / Published: 6 November 2025
(This article belongs to the Section Materials Processes)

Abstract

The cutting process is accompanied by complex electrical phenomena, which are particularly evident in narrow cutting clearances. To further explore the laws of electrical phenomena in the capillary of the cutting zone, this paper uses a Faraday collector with an external bias electric field to investigate the electrical phenomena in the narrow slit of the cutting zone under different cutting parameters and when different tool and workpiece materials are combined. The results show that there is a stable and continuous electrical phenomenon in the cutting contact area, and the emission intensity of charged particles when cutting insulating materials is significantly higher than that of metals. The emission intensity of negative ions is higher than that of positive ions. The electrical and mechanical properties of materials have a significant impact on the electrical phenomena in the cutting zone. In addition, it was found that there is a linear relationship between the electrical phenomena in the cutting zone and the cutting parameters. Finally, based on the morphology of the capillaries in the cutting zone, the self-excited electric field intensity generated in it during the cutting process was estimated.

1. Introduction

The cutting contact zone is a very mysterious and ingenious place. It can affect the surface quality of the workpiece, the service life of the cutting tool, the energy consumption of the machine tool, the lubrication effect of the cutting fluid, etc. Among numerous research objectives, the electrical performance of the cutting zone is an influencing factor that cannot be ignored [1].
The scratches produced during friction and wear, grinding, forming, and cutting lead to different charges on the two contact pair surfaces. This phenomenon is called frictional electrification [2,3], which is mainly caused by the different work functions of the material [4], the surface morphology [5], and the hardness of the workpiece, etc. [6]. The potential caused by the frictional electrification is named triboelectrification electrostatic potential. Because there are small gaps between the two contact pairs during machining, a strong radial electric field emerged in this gap under the action of triboelectrification electrostatic potential. The particle emission phenomenon, including negatively charged (NC) and positively charged (PC) particles, will occur in the contact interface gap due to the discharging of ambient gas in the action of the radial electric field, and microplasma may be generated [7]. Microplasma is mainly composed of electrons generated from the newly machined workpiece surface and the PC particles produced by the electrons bombarding the gas molecules [8,9]. Nakayama et al. [10] studied microplasma at the friction interface by observing the ultraviolet and infrared light morphology. It was found that the intensity of microplasma would increase with the test load and rotational speed. Moreover, the intensity of triboelectrification electrostatic potential [11] and charged particle emission can also be directly affected by the resistivity of the workpiece, and the order of intensity is insulator > semiconductor > conductor [4]. We can draw the conclusion that triboelectrification electrostatic potential is the driving force for charged particle emission. Additionally, this charged particle emission also exists under water and oil lubrication conditions [12]. The velocity and emission intensity of NC particles are much higher than those of PC particles in the contact zone [13,14]. The directional movement of charged particles in the cutting zone capillary will form a potential difference between the two ends of the capillary, which is defined as a self-excited axial electric field because there is no interference from an external energy field. The self-excited axial electric field produced by NC particles is dominant (pointing to the interior of the capillary).
In this study, the intensity of triboelectrification electrostatic potential and charged particle emission when cutting different workpieces was studied experimentally, which could be used to calculate the self-excited axial electric field in the cutting zone.

2. Materials and Methods

2.1. Measurement of Triboelectrification Electrostatic Potential in Turning

In a dry cutting environment, the triboelectrification electrostatic potential of the workpiece was measured during cutting, which follows the schematic diagram shown in Figure 1a,b. The experiments were performed on a CAK6150D precision lathe (as shown in Figure 1c). The workpieces used in this investigation were AISI 1015 (Baoshan Iron and Steel Co., Ltd., Shanghai, China), AISI 304, PE, and ABS with a diameter of 60 mm and a cutting length of 5 mm (if the cutting length was too long, the chip would disturb the normal operation of the electrometer probe; a chip baffle plate was set above the rake face to prevent chips from falling, as Figure 1c shows). Before testing, the workpieces were pre-machined with a cut depth of 1 mm to eliminate any surface irregularities and ensure cutting continuity for all tests. Furthermore, to eliminate the influence of feed and withdraw on the experiment results, the workpiece was divided into 5 mm segments in advance. The cutting tools employed in this investigation were PVD-TiAlN-coated cemented carbide cutting tools (CCMT09T304N-SU, Sumitomo Electric, Tokyo, Japan). For the measurement, a vibratory capacitance electrometer (EST102, Beijing Hua Jinghui Technology Ltd., Beijing, China) equipped with a probe was placed 20 mm below the workpiece, as represented in Figure 1b. It was difficult to measure the triboelectrification electrostatic potential of the chip directly due to the limitations of experimental conditions. Considering that the chip and workpiece were the same material and underwent the similar cutting condition, the triboelectrification electrostatic potentials of the chip were approximately expressed by those of the workpiece in this study. Each set of tests was carried out using a fresh workpiece and tool edge to maintain an identical experimental context. Table 1 and Table 2 summarize the experimental conditions and the parameters of workpiece and tool materials, respectively. Each experiment was repeated three times, and the average value was recorded.

2.2. Measurement of Charged Particles Emission Intensity in Turning

A Faraday ion collector could be employed to measure the intensity of charged particles under atmospheric conditions. A Faraday collector is simply a sheet or plate made of a conducting material like copper [15] or Ag and is used to capture the charged particles. The emitted charged particles will be scattered in all directions due to their low energies (usually 10 to 200 eV), and these charged particles can be accelerated towards the Faraday plate by providing an external bias electric field. The intensity of either PC (positive ion) or NC (electron, negative ion) particles can be separately measured by using this principle, but the simultaneous measurement of both is not possible. A bias electric field (of say −700 V/cm or +700 V/cm) supplied to the Faraday collector will attract only negatively or positively charged particles and repels the positively or negatively charged particles, respectively, as shown in Figure 2a–c.
These collected charged particles lose their charge to the plate, and this will create a current flow within the electrical circuit to which the plate is connected. An electrometer which can measure currents of as little as 1 femto-ampere could be used to measure this ultra-low ion current. A 0.05 mm thickness silver sheet attached on to the major flank acts as a Faraday plate ion collector. To prevent the influence of chip winding on the experiment, a tool withdrawal groove was set every 5 mm of the workpiece, and a chip baffle plate was set above the rake face to prevent chips from falling (as Figure 2d shows). High-temperature insulation tape was introduced between the silver sheet and major flank to electrically isolate the Faraday plate ion collector. The distance between the top edge of the silver sheet and the cutting edge was maintained at 4 mm to make sure it would not rub against the machined surface. A Keithley 6517B electrometer (Tektronix Inc., Beaverton, OR, USA) was employed to measure the ultra-low ion current delivered to the silver sheet. The bias electric field plate was made of copper sheet. Emission intensities were largely independent of the value of the bias electric field. A high-voltage electrostatic generator (EST802A, Beijing Hua Jinghui Technology Ltd., Beijing, China) was used to provide the bias electric field. The electrical connections and the method of data acquisition from the sensor are shown in Figure 2d.
The experiment lathe, workpieces, cutting tool, experimental conditions, and the parameters of the workpiece and tool materials are the same as those introduced in Section 2.1. A photographic view of this ion current intensity measurement experimental set-up is shown in Figure 2e.

3. Results and Discussion

3.1. Measurement of Triboelectrification Electrostatic Potential

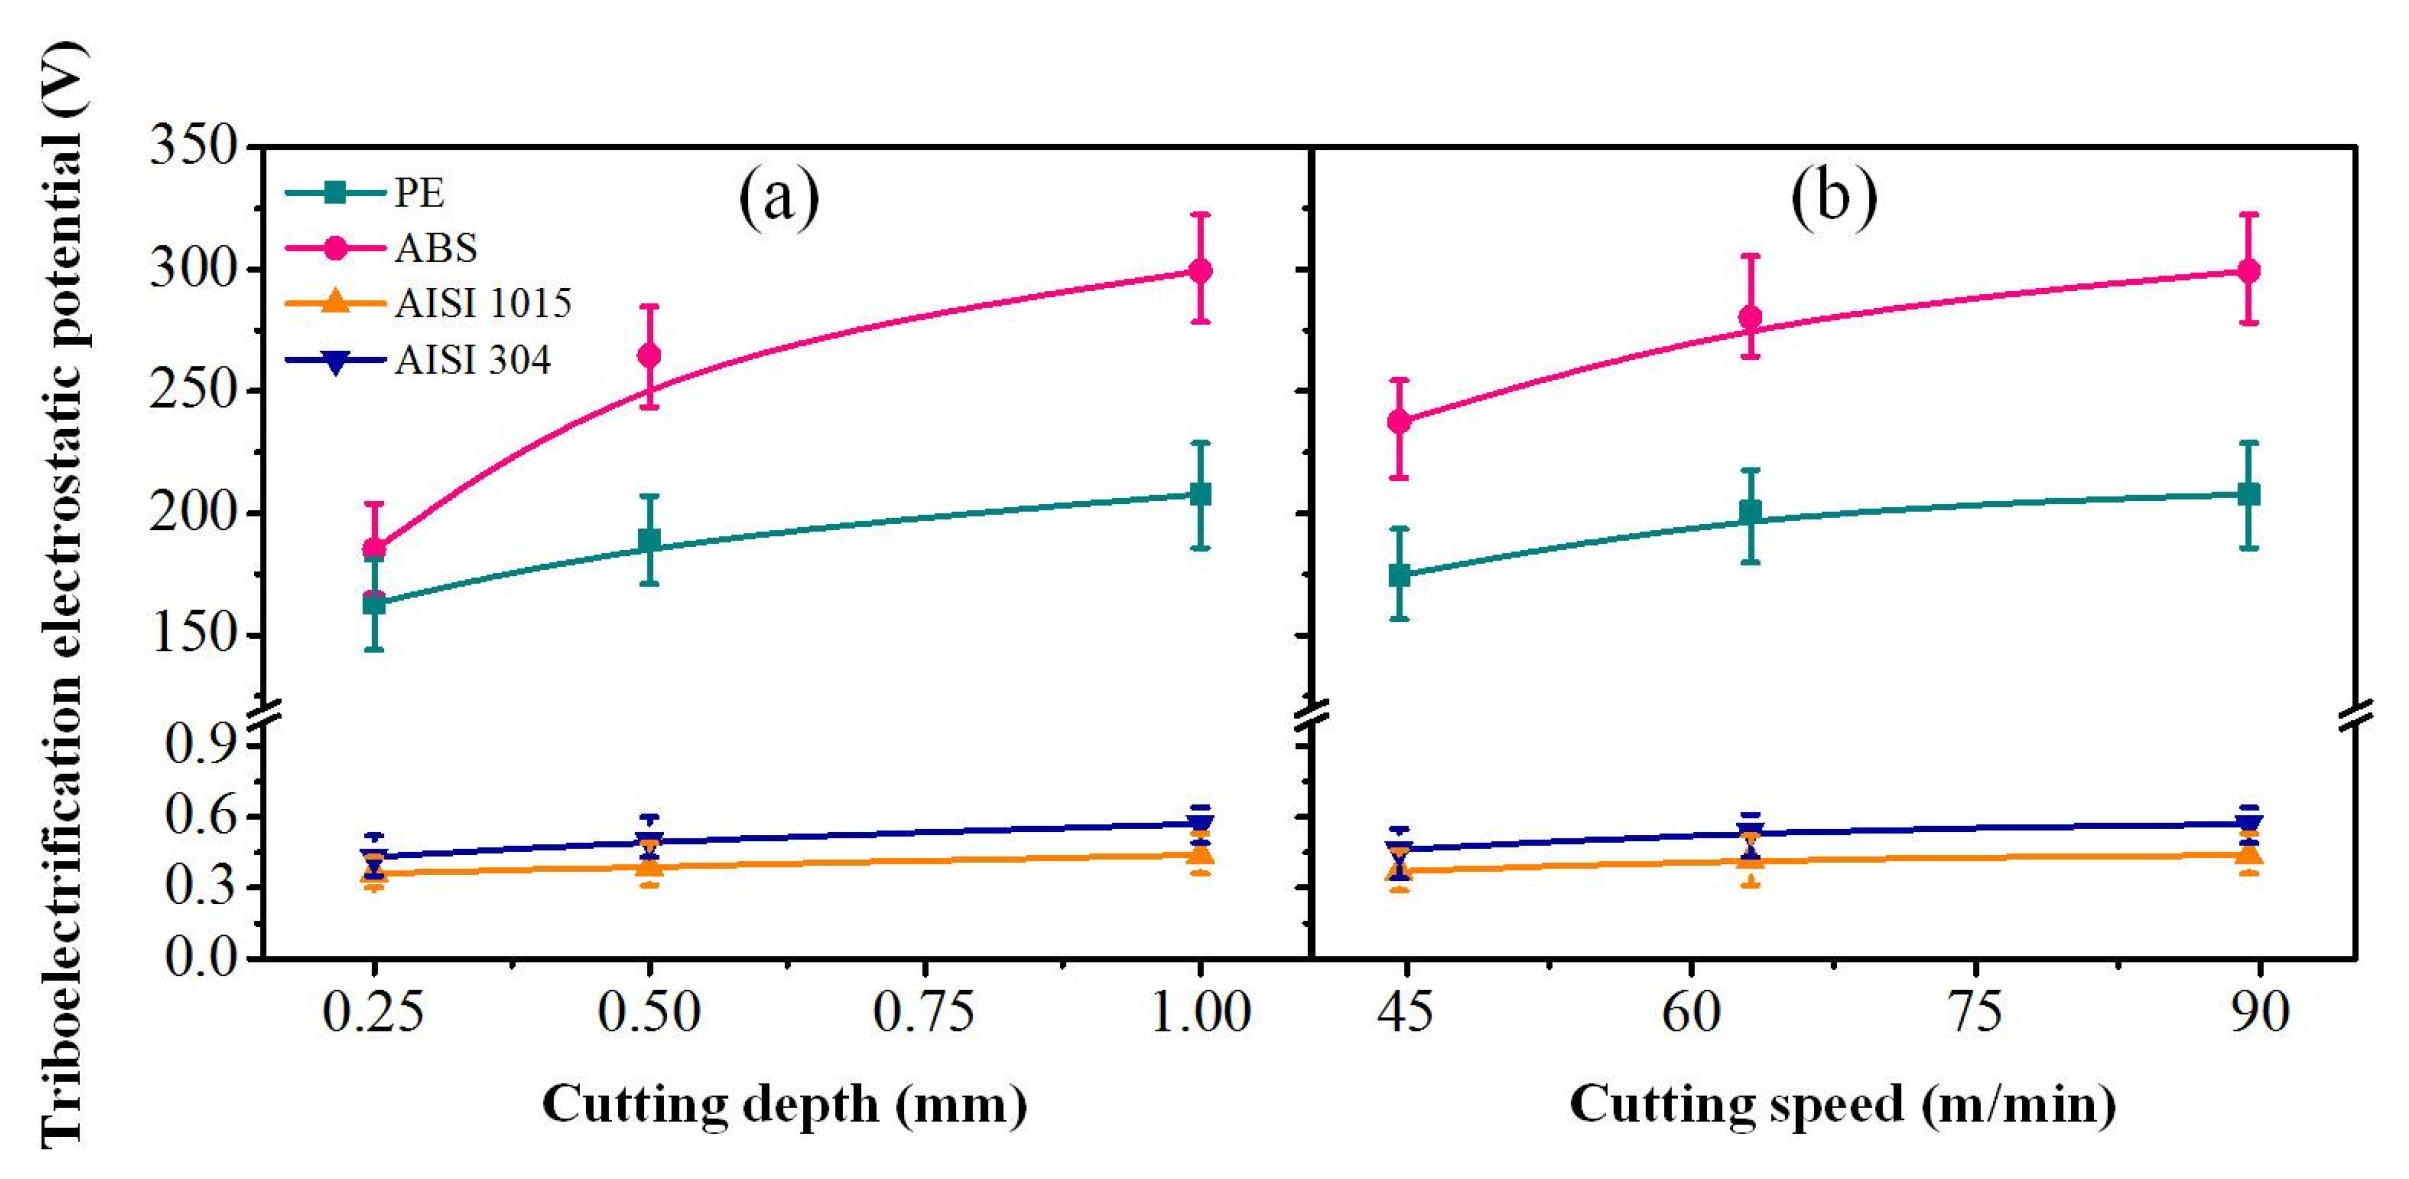
Figure 3 shows the effect of workpiece material and cutting parameters on triboelectrification electrostatic potential during turning. Triboelectrification electrostatic potential is one of the measure standards of frictional electrification [16]. It can be seen from this figure that the influence of the workpiece material on the triboelectrification electrostatic potential is very obvious. The triboelectrification electrostatic potentials of insulators are about two orders of magnitude larger than those of conductors when comparing those of these four workpieces in the cutting process. This discrepancy could be attributed to the fact that the resistivity of the material plays a decisive role in the generation of triboelectrification electrostatic potential [17]. As Table 2 shows, the resistivity of insulating materials is much higher than that of metals.
For conductors, the triboelectrification electrostatic potential of AISI 304 was 29.5% higher than that of AISI 1015 when the cutting parameters were as follows: 1 mm cutting depth, 89.4 m/min cutting speed, and 0.25 mm/r feed rate. As for insulators under the same cutting parameters as conductors, the triboelectrification electrostatic potential of ABS was 44.1% higher than that of PE. A possible explanation for these results may be that in addition to the resistivity, which plays a major role, the triboelectrification electrostatic potential between workpieces with similar resistivity is closely related to the hardness and ultimate strength. The triboelectrification electrostatic potential increases with the hardness and ultimate strength of the workpiece [18].
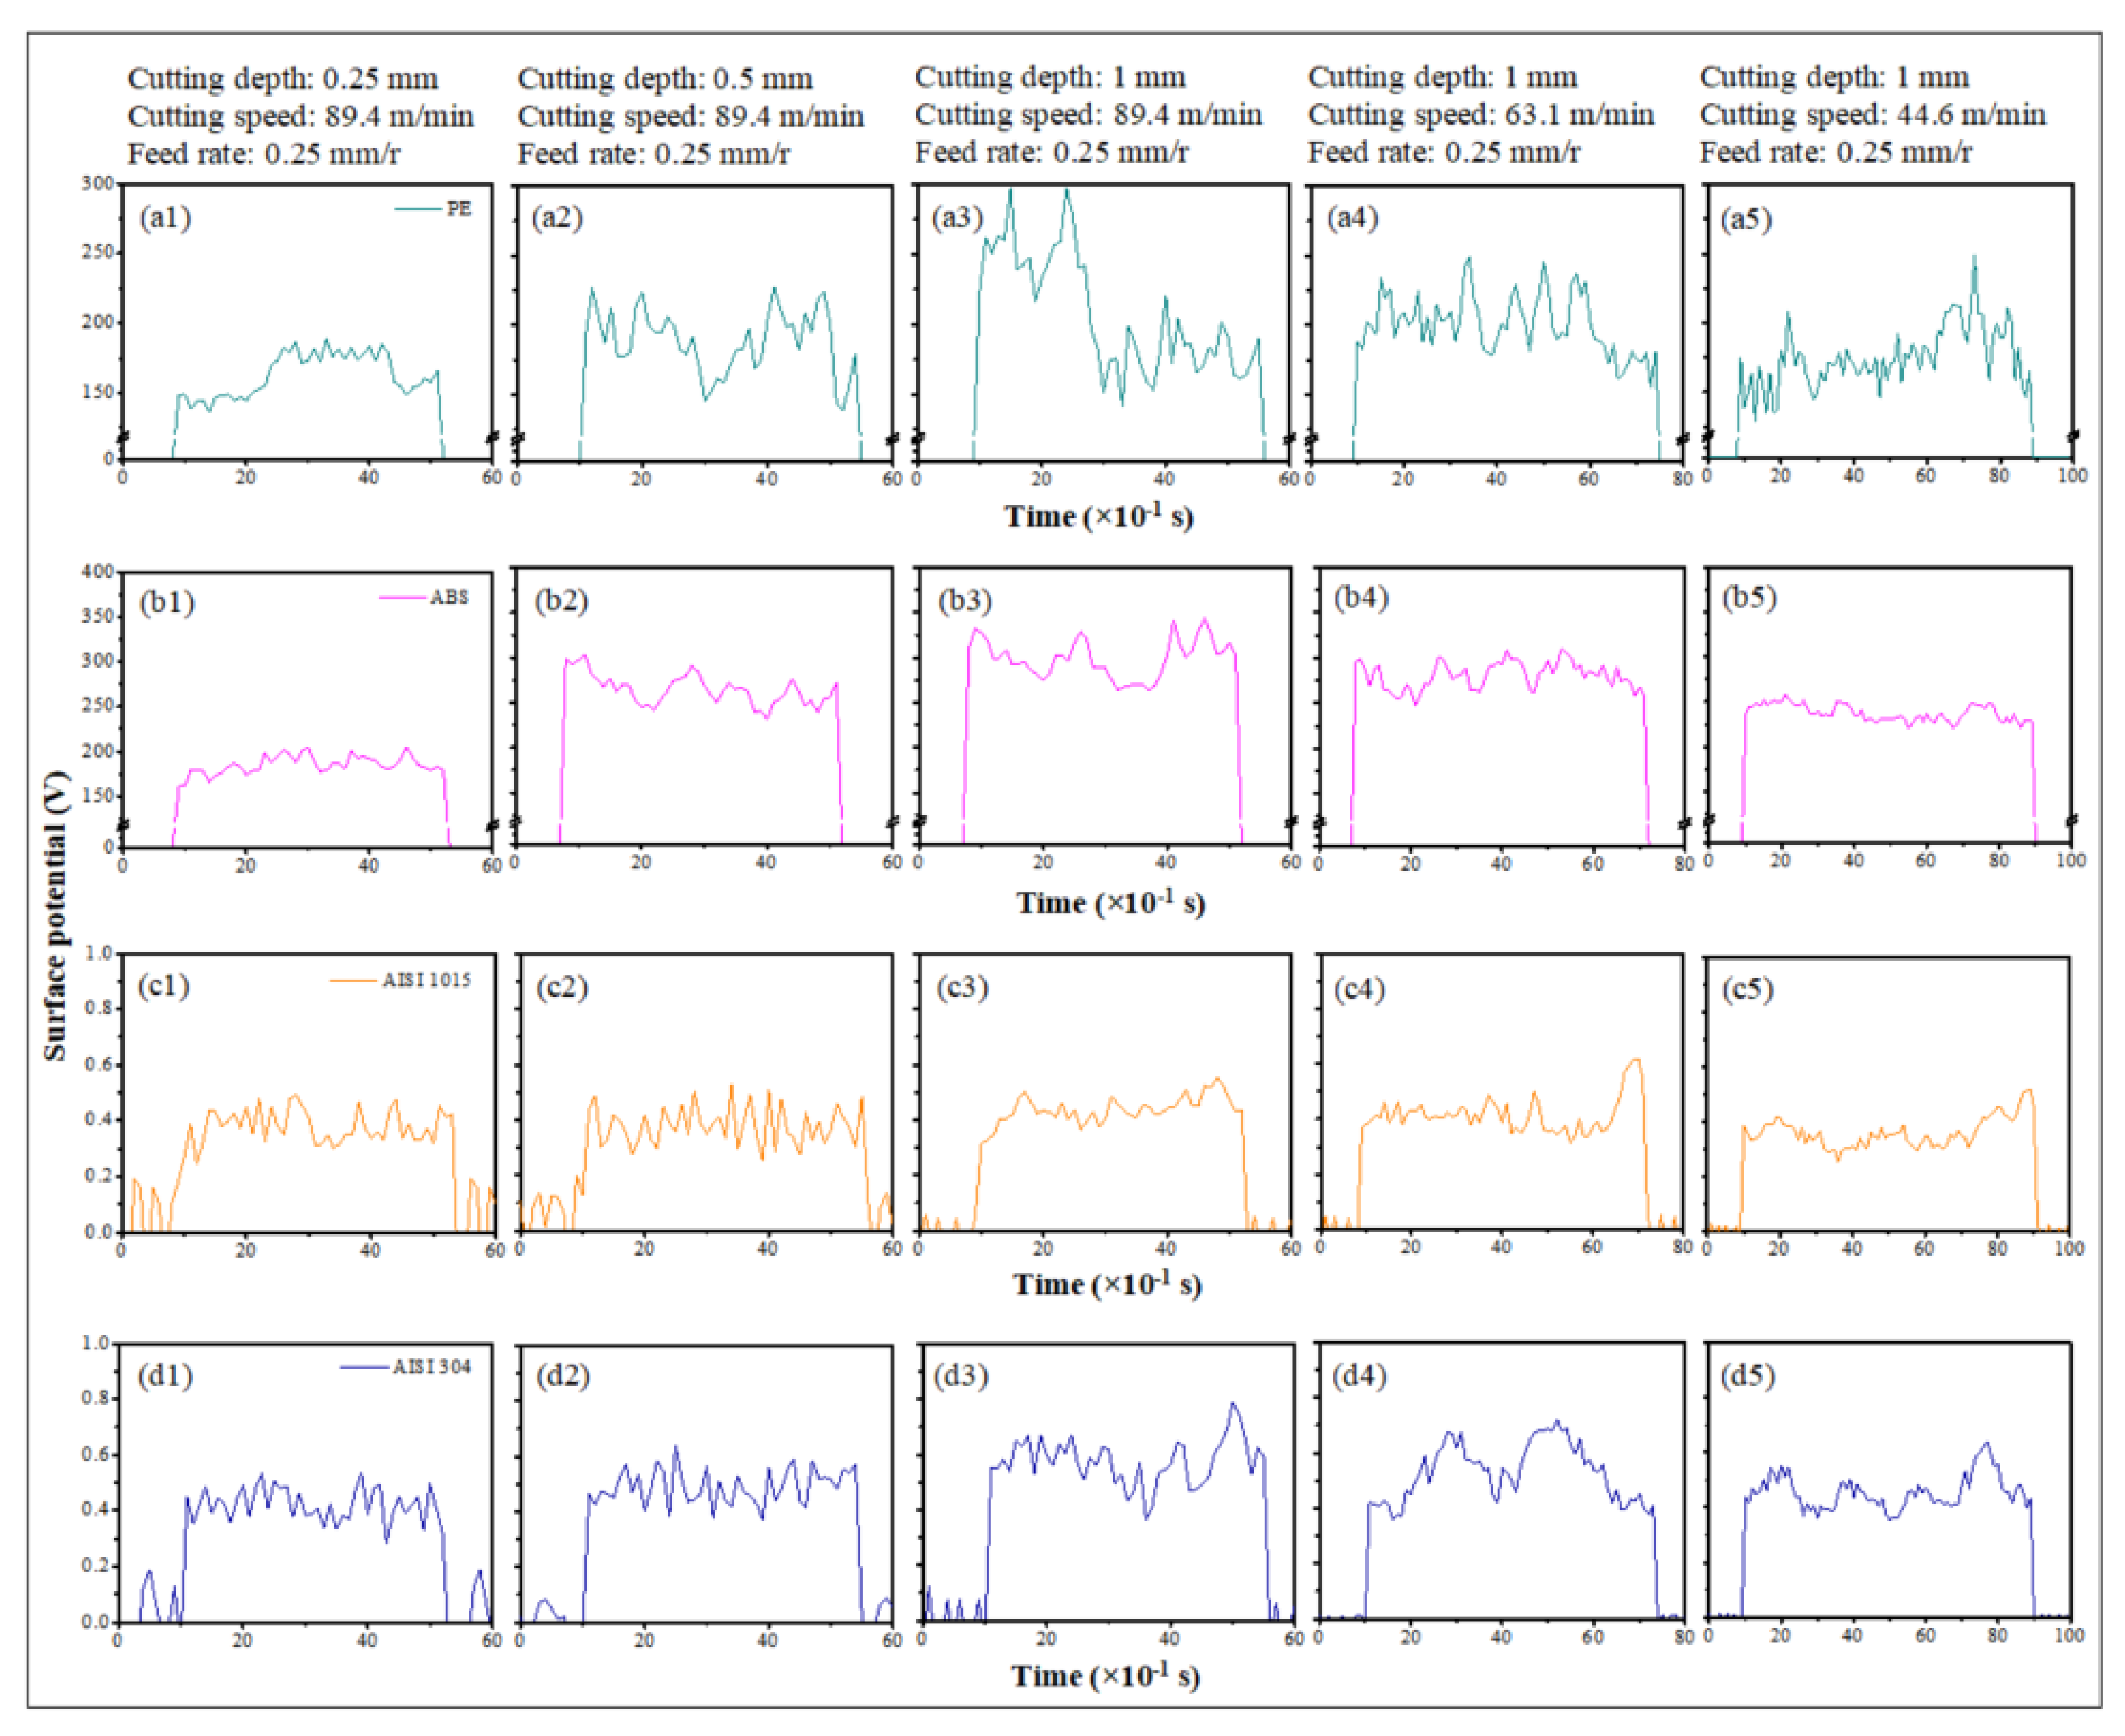
It is clear from the results presented in Figure 3 thus far that a higher cutting depth and cutting speed would yield a higher triboelectrification electrostatic potential. This may be attributed to the fact that increasing the cutting depth can increase the cutting force and then increase the actual contact area in the interstitial spaces between the tool and the chip, thus increasing the triboelectrification electrostatic potential [19]. Moreover, the increase in rotational speed could increase the distance of the tool scratch workpiece in the same processing time and also increase the contact area per unit time to enhance the triboelectrification electrostatic potential [18]. Figure 4 depicts the triboelectrification electrostatic potential curves when cutting different workpieces under various cutting parameters. An increase in triboelectrification electrostatic potential promotes the emission of charged particles, which in turn affects the intensity of the self-excited axial electric field.
For metals, the triboelectrification electrostatic potential measured was only a few tenths of a volt, but this was not equal to the actual triboelectrification electrostatic potential generated at the contact interface. Most of the surface charges dissipated into the air during the workpiece rotation. The triboelectrification electrostatic potential measured by the electrometer probe was that which remained on the workpiece surface after dissipation.
To reveal the law of triboelectrification electrostatic potential dissipation into the air, we assumed that the workpiece surface was uniformly charged. The half decay time t1/2 is usually used to represent the time when the electric quantity Q0 is reduced to Q0/2 [20]:
t 1 / 2 = τ ln 2 = 0.69 τ = 0.69 ε 0 ε rw γ
where γ is the conductivity, ε r w is the relative dielectric constant of workpiece, and ε 0 is the vacuum dielectric constant (8.85 × 10⁻¹² F/m). Metals have an extremely short half-life and their charges decay too rapidly, so the measured values are much lower than the actual initial values. The half-life of insulators is long, and the measured value is close to the initial value.
Table 3 presents the relative dielectric constant of workpieces and the half decay times of electrostatic dissipation of workpiece and tool materials into the air. It can be observed that the electrostatic dissipation rates of metals are much faster than those of insulators. The time required for the workpiece to rotate 1/4 turn at 89.4 m/min is 0.03 s, which is the shortest time required for the cutting zone turn to the measurement area directly above the electrometer probe. It can be concluded that the triboelectrification electrostatic potentials of insulators measured by electrometer probe are the majority of the actual values, while those of metals are only a very small part of actual values. This is the reason why the measured metal triboelectrification electrostatic potential is only a few tenths of a volt.
Turning is a continuous process, and the tool is cutting the workpiece all the time, which creates a strong radial electric field between the upper and lower walls of the interstitial spaces [21]. It is difficult to measure the triboelectrification electrostatic potential of the cutting zone accurately under existing conditions. Under the action of this radial electric field, there is an electron emission phenomenon in the capillary first, and then the electrons move directionally and collide with the neutral molecules in the capillary, resulting in an electron avalanche, which finally causes the charged particle emission in the interstitial spaces [9,10].

3.2. The Measurement of Emission Intensity of Charged Particles and the Calculation of Self-Excited Axial Electric Field Intensity

3.2.1. Measurement of Emission Intensity of Charged Particles

Figure 5 depicts a comparison of the NC and PC particle intensity magnitude of PE, ABS, AISI 1015, and AISI 304 workpieces under different cutting parameters. Figure 5a,b present the emission intensity of NC particles when the bias electric field was −700 V/cm, and the other two pictures are the PC particle emission intensity when the +700 V/cm bias electric field was applied.
Figure 5 shows that the charged particle emission intensities of insulators were significantly higher than those of conductors, which was mainly because the resistivity of insulators was much higher than that of metals. The emission of broken electrons was larger when the insulating material broke during cutting, so that more charged particles were generated in the interstitial spaces [18]. When the material resistivity is unchanged, the greater the hardness, ultimate strength, and yield strength of the material, the greater the charged particle emission intensity. When the cutting parameters were 1 mm cutting depth, 89.4 m/min cutting speed, and 0.25 mm/r feed rate, the NC particle emission intensities of AISI 304 and ABS were 25% and 30.1% higher than those of AISI 1015 and PE, respectively. The PC particle emission intensities of AISI 304 and ABS were 24.5% and 33.3% higher than those of AISI 1015 and PE, respectively.
In addition, the emission intensity is seen to monotonically increase with the cutting depth and cutting speed. At a higher cutting depth, there is an increase in the volume of material that undergoes shear, which increases the fracto-emission intensity [22]. At the same time, the tool–workpiece rubbing area also increases due to the rise in pressure between the tool flank face and the machined surface, which generates intense tribo-emissions [23]. The charged particles emission intensity increases for deeper cutting depths due to these reasons.
Figure 5b,d, respectively, show the comparison of the NC and PC particle intensity magnitude for three different cutting speeds at a constant cutting depth of 1 mm. It is evident from the results that the intensity of the ion emission increases with the increase in cutting speed. This trend could possibly be attributed to the fact that at higher cutting speeds, the material deformation and shear rate are greater than those at lower cutting speeds. The number of charged particles captured by the Faraday plate in a unit time interval is measured as the emission intensity. At higher cutting speeds, the number of charged particles emitted will be comparatively more, which results in an increase in emission current intensity.
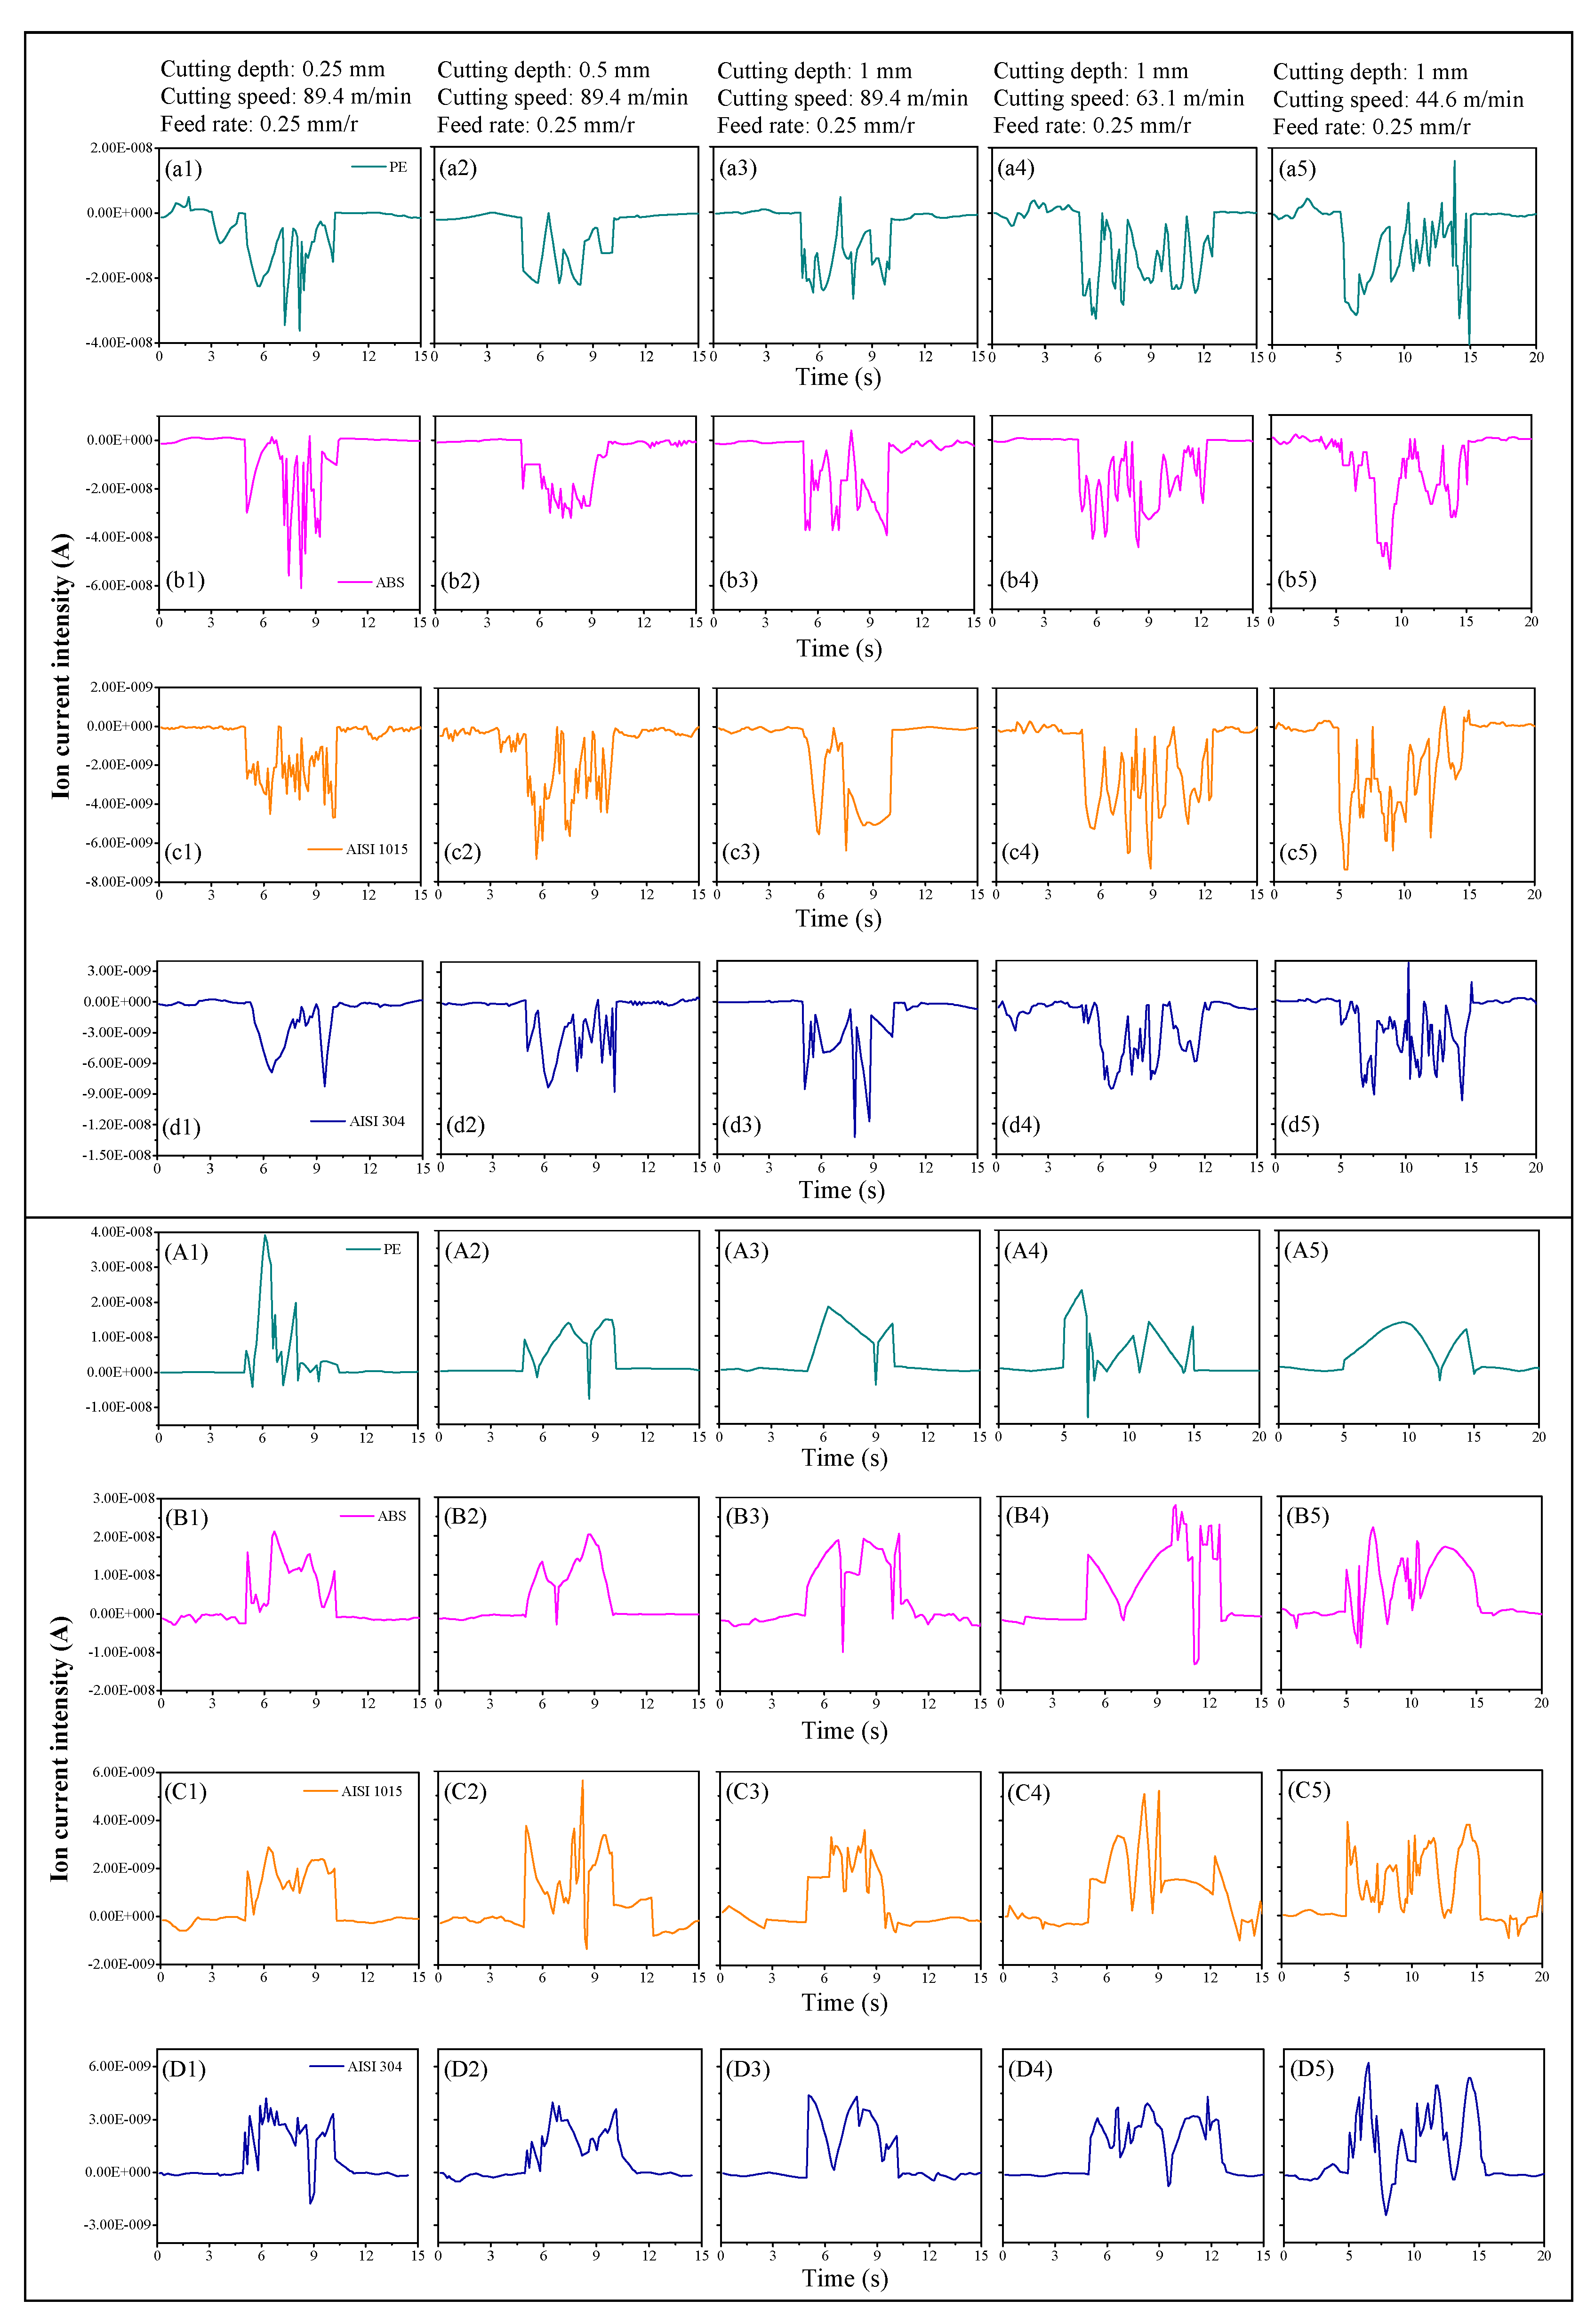
Additionally, the NC particle emission intensities of the four workpieces were significantly higher than the PC particle emission intensities. This gave the self-excited axial electric field formed by the negative ions in the capillary a dominant role in the cutting fluid electro-osmosis process. This is because electrons are the most emitted particles by insulators and metals during mechanical damage [14,18]. Also, emissions of NC particles are a combination of electrons and negative ions, while the emissions of PC particles consist of only positive ions. This behavior of higher NC emission intensity was observed in almost all different cutting conditions, which was consistent with the research results produced by K. Nakayama et al. [24]. The NC and PC particle emission intensity curves are depicted when cutting different workpieces under various cutting parameters in Figure 6.

3.2.2. Self-Excited Axial Electric Field Formed by the Charged Particle Emission in the Capillary

A large number of charged particles were generated in the cutting zone capillary and moved rapidly to the capillary open end under the action of the radial electric field. The charged particles flowed out of the capillary, and then they were collected by the Faraday ion collector and formed an electric current after a short distance [18]. As illustrated in Figure 7, the path of charged particles from where they are generated to where they are collected was defined as the charged particles flow channel. The test results were all obtained after multiple repetitions under uniform conditions.
According to the law that the electric current generated by the directional movement of electrons in different conductors under the same power supply is the same everywhere, the electric current in the charged particle flow channel is also the same. Based on the equation E = ρJ, the self-excited axial electric field formed in the capillary by the charged particles passing through can be calculated, where E is the self-excited axial electric field intensity (V/m), ρ is the resistivity of air in the capillary (Ω·m), and J is the current density (A/m2).
According to the equation of current density J = I/A, where I is the net current measured by the electrometer under different experimental conditions (in this study, the net current is negative current minus positive current due to the negative current intensity was greater than the positive current intensity), and A is the cross-sectional area of the capillary. Then, the self-excited axial electric field E is E = ρI/A.
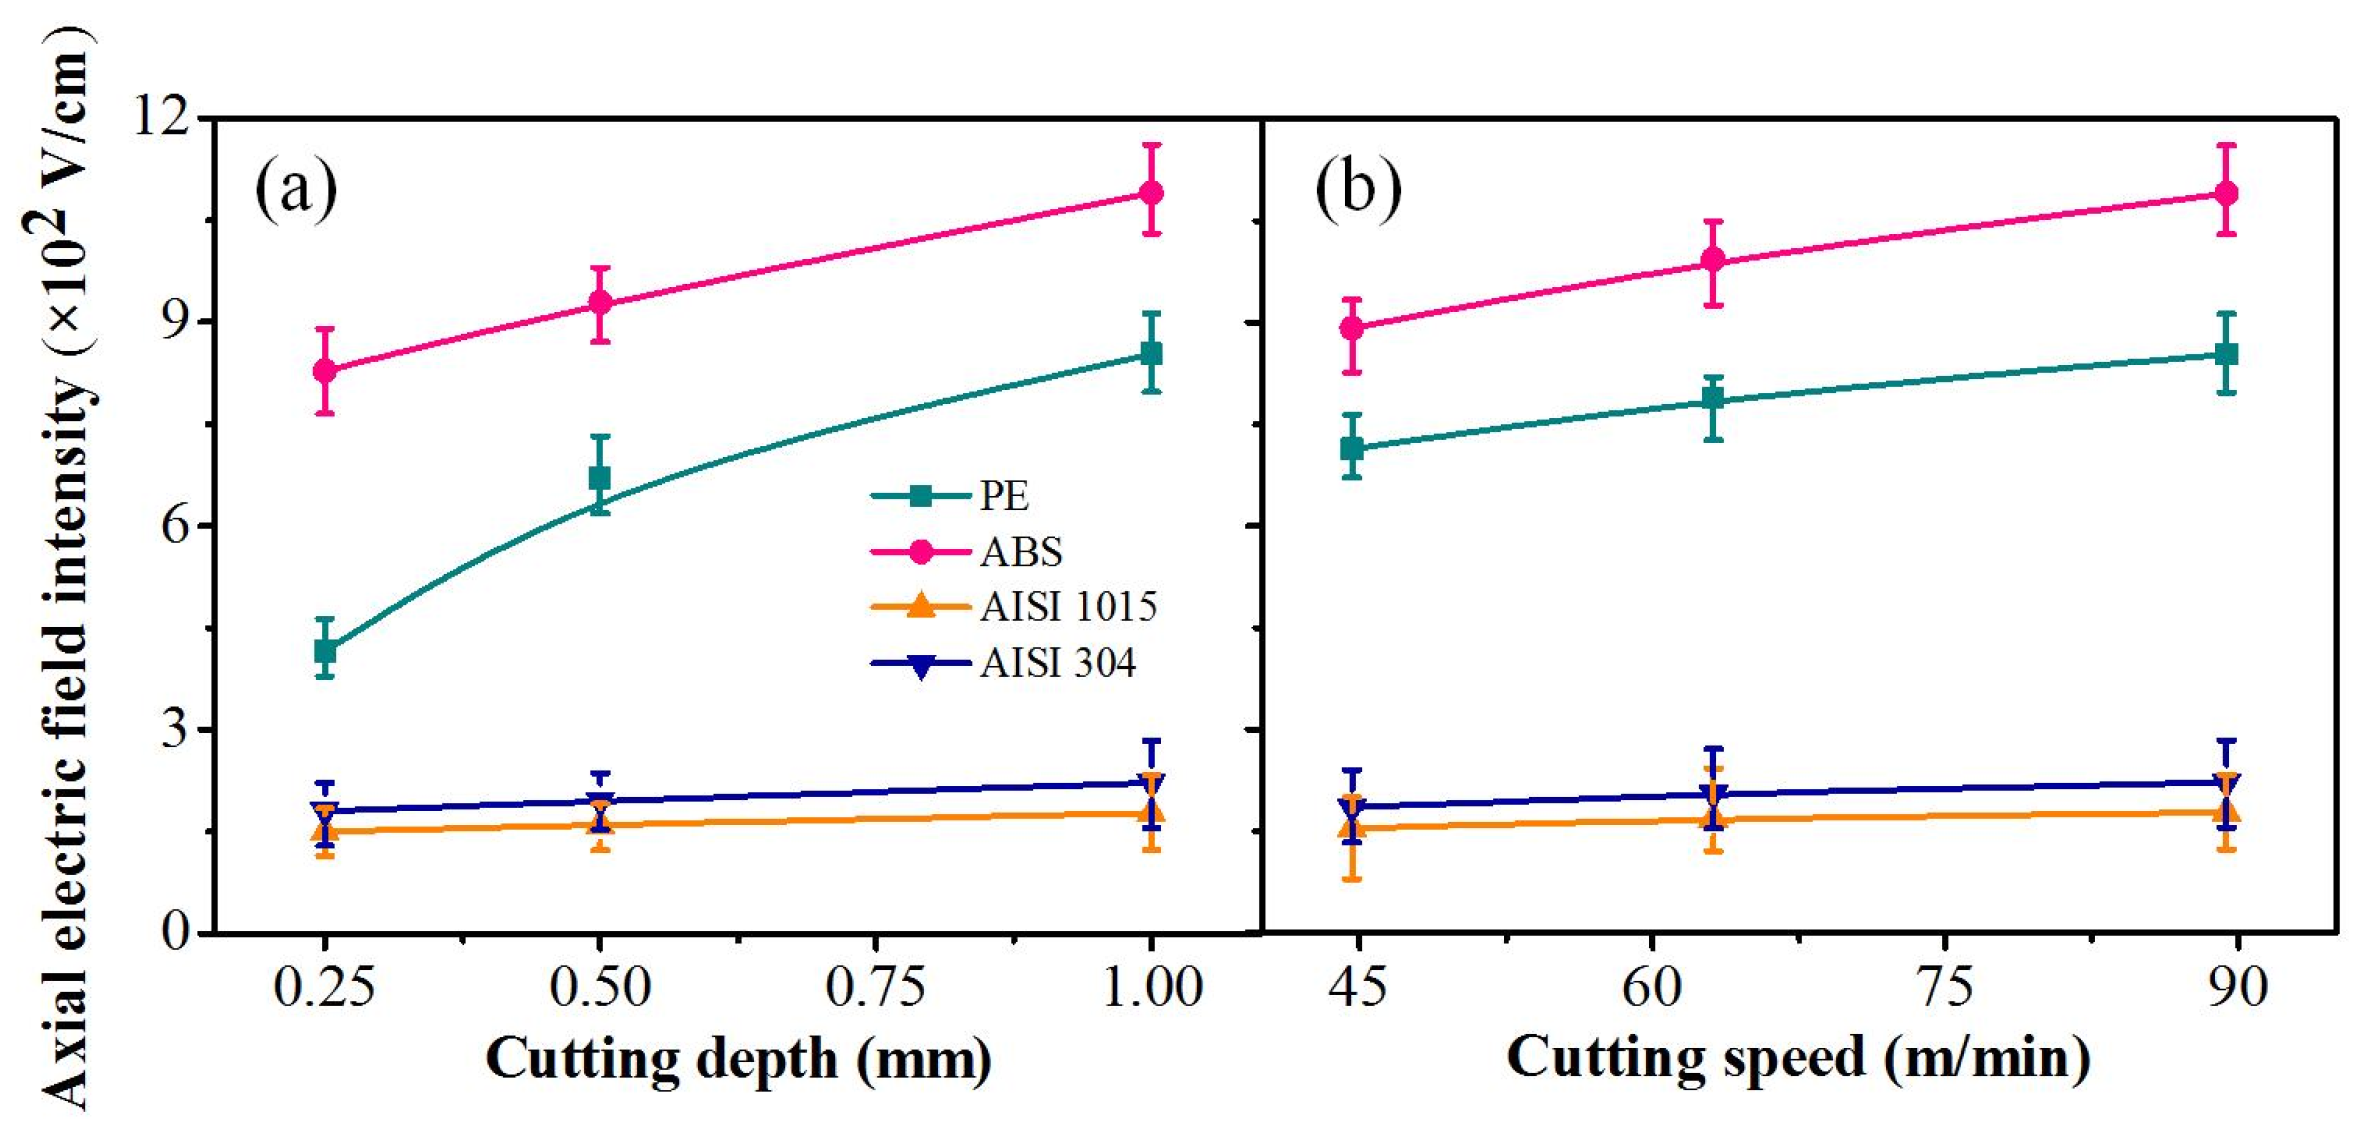
The use of air resistivity in ambient conditions (3 × 10¹³ Ω·m) to calculate the self-excited axial electric field has been attempted because it was difficult to measure the air resistivity in the cutting zone capillary, and the results were greater than 1 × 10¹² V/cm. This can approximately indicate the self-excited axial electric field intensity at both ends of the capillary under dry cutting conditions. On the other hand, cutting fluid always existed in the interstitial spaces during the lubrication cutting process. The resistivity of DI water (1 × 10⁴ Ω·m) was selected to calculate the self-excited axial electric field. The range of the results was 1.5 × 10² V/cm to 1.09 × 10³ V/cm, which was in line with the range of electric field intensity needed for the electro-osmosis of aqueous solution in the capillary [19]. The axial electric field in the capillary of the cutting zone can affect the penetration of the cutting fluid in the capillary [1].
As described in previous studies, the capillary radius range in the cutting zone is 1–50 μm [25]. Due to the existence of many uneven and small grooves on the chip surface, 5 μm was taken as the average value of the capillary radius according to the measurement of the groove depth on the chip surface, which was measured with a 3D surface profiler (VHX-6000, Keyence, Osaka, Japan), as shown in Figure 8. Furthermore, the width of the grooves on the chip surface varies from 100 μm to 300 μm and changes with the cutting parameters [16]. The width of the chip in this study is approximately 1–2 mm, and there are about 10–20 capillaries on the chip surface. It was assumed that the number of capillaries under different cutting parameters selected in this study was 10 to calculate the self-excited axial electric field intensity. Then, the self-excited axial electric field intensity in each capillary is as follows:
E e a c h = E 10 = ρ J 10
Figure 9 depicts the effect of the cutting parameters and workpiece on the self-excited axial electric field intensity in the capillary. It can be seen from this figure that the influence of the workpiece on electric field intensity was very remarkable. The self-excited axial electric field intensities produced in insulator capillaries were obviously higher than those in conductor capillaries. The electric field intensity in ABS was 390.9% and 515.8% higher than that in AISI 304 and AISI 1015, respectively, and the electric field intensity in PE was also 284.2% and 381.9% higher than that in AISI 304 and AISI 1015, respectively, under 1 mm cutting depth, 89.4 m/min cutting speed, and 0.25 mm/r feed rate conditions. Furthermore, the increasing speed of self-excited axial electric field intensity in the insulator capillaries was much faster than that in metal capillaries with the cutting parameters. This inconsistency might be due to the fact that the resistivity of the insulator workpiece was far larger than that of the conductor. Under the same cutting parameters, the stimulation of the radial electric field on the charged particle emission in insulator was far higher than that in metal, and a stronger self-excited axial electric field was formed in the insulator capillary. When the resistivity of the capillary material was similar (ABS is similar to PE, and AISI 304 is similar to AISI 1015), the material with higher hardness and ultimate strength could obtain a higher charged particle emission intensity compared with that of lower hardness and ultimate strength. This is because the workpiece with higher hardness is more difficult to cut, and more severe scratches and ploughing are produced at the contact interface during the cutting process, leading to the generation of higher-intensity energy in the capillary to induce charged particle emission.

4. Conclusions

In this work, a self-excited axial electric field generated by charged particle emission in the cutting zone interstitial spaces was proposed, and theoretical and experimental verification was carried out. The experiments revealed that the intensity of triboelectrification electrostatic potential and charged particle emission is linked to factors including the resistivity, hardness, and ultimate strength of the workpiece. In addition, the intensities of triboelectrification electrostatic potential and charged particle emission increased with the cutting depth and cutting speed. The polarity of the net charged particles in the capillary was negative, by which a self-excited axial electric field directed to the capillary interior was produced.
The exploration of electrical phenomena in the cutting zone in this paper is only the tip of the iceberg of this physical phenomenon, and there are still many shortcomings. Many scientific issues need further exploration, for example the intuitive demonstration of the mathematical relationship between the surface electrostatic potential of the material and the emission intensity of charged particles in the cutting zone, because mathematical/physical models help clarify the underlying physical correlation between these two quantities.
In addition, due to the existence of the charge decay period on the material surface and the limitations of the experimental equipment placement in the narrow cutting zone, there is currently no way to directly compare the surface charge values before decay. This will also be the focus of our subsequent work, using more direct experimental schemes to directly measure charge values, thereby enhancing the research significance of this work.

Author Contributions

Conceptualization, X.X. and B.F.; methodology, B.F.; software, X.G.; validation, X.X., G.Z. and Z.T.; formal analysis, B.F.; investigation, B.F.; resources, X.X.; data curation, G.Z.; writing—original draft preparation, B.F.; writing—review and editing, X.X., Q.S.S. and C.Y.; visualization, X.G. and Q.Z.; supervision, Z.T.; project administration, Z.T.; funding acquisition, B.F. All authors have read and agreed to the published version of the manuscript.

Funding

The work was sponsored by the National Key R&D Program Project (No. 2025YFE0102900), the National Natural Science Foundation of China (No. 52376037), “Pioneer” and “Leading Goose” R&D Program of Zhejiang (No. 2025C02030), the Project of Fundamental Commonweal Research of Zhejiang Province (grant no. LGG22E050034), “Pioneer” and “Leading Goose” R&D Program of Zhejiang (grant nos. 2022C01070 and 2023C01156), and the Nanxun Scholars Program for Young Scholars of ZJWEU: RC2022021117.

Data Availability Statement

The data used to support the findings of this study are available from the corresponding author upon request.

Conflicts of Interest

The authors declare no conflicts of interest. Author Chen Yang was employed by the company Hangzhou Borong Science and Technology Co., Ltd. The remaining authors declare that the research was conducted in the absence of any commercial or financial relationships that could be construed as a potential conflict of interest.

References

  1. Feng, B.; Luan, Z.; Zhang, R.; Xia, Y.; Yao, W.; Liu, J.; Ma, Y.; Hu, X.; Xu, X. Effect of electroosmosis on lubricant penetration at the tool–chip interface. J. Mater. Process. Technol. 2022, 307, 117653. [Google Scholar] [CrossRef]
  2. Zhang, Y.Y.; Shao, T.M. A method of charge measurement for contact electrification. J. Electrostat. 2013, 71, 712–716. [Google Scholar] [CrossRef]
  3. Nakayama, K. Contact geometry and distribution of plasma generated in the vicinity of sliding contact. Jpn. J. Appl. Phys. 2007, 46, 6007–6014. [Google Scholar] [CrossRef]
  4. Jian, L.Q.; Ning, L.P.; Yang, S.R.; Wang, J.M.; Hua, M.Q. Triboelectrification Electrostatic Potential of MC Nylon 6 under Point Contact Dry Sliding. Tribol. Lett. 2009, 36, 199–208. [Google Scholar] [CrossRef]
  5. Sow, M.; Lacks, D.J.; Sankaran, R.M. Effects of material strain on triboelectric charging: Influence of material properties. J. Electrostat. 2013, 71, 396–399. [Google Scholar] [CrossRef]
  6. Tang, J.; He, L.; Jin, Z.H.; Lu, J.D. Material tribo-electrification potential changing during wear. Mater. Des. 2003, 24, 223–226. [Google Scholar] [CrossRef]
  7. Nakayama, K.; Martin, J.M. Tribochemical reactions at and in the vicinity of a sliding contact. Wear 2006, 261, 235–240. [Google Scholar] [CrossRef]
  8. Nakayama, K.; Leiva, J.A.; Enomoto, Y. Chemi-emission of electrons from metal surfaces in the cutting process due to metal/gas interactions. Tribol. Int. 1995, 28, 507–515. [Google Scholar] [CrossRef]
  9. Nakayama, K. Triboemission of electrons, ions, and photons from diamondlike carbon films and generation of tribomicroplasma. Surf. Coat. Technol. 2004, 188, 599–604. [Google Scholar] [CrossRef]
  10. Nakayama, K. The plasma generated and photons emitted in an oil-lubricated sliding contact. J. Phys. D Appl. Phys. 2007, 40, 1103–1107. [Google Scholar] [CrossRef]
  11. Ning, L.P.; Jian, L.Q.; Yang, S.R.; Wang, J.Q.; Ren, J.F.; Wang, J.M. Effect of carbon black on triboelectrification electrostatic potential of MC nylon composites. Tribol. Int. 2010, 43, 568–576. [Google Scholar] [CrossRef]
  12. Nakayama, K. Mechanism of Triboplasma Generation in Oil. Tribol. Lett. 2011, 41, 345–351. [Google Scholar] [CrossRef]
  13. Nakayama, K.; Tanaka, M. Simulation analysis of triboplasma generation using the particle-in-cell/Monte Carlo collision (PIC/MCC) method. J. Phys. D Appl. Phys. 2012, 45, 49. [Google Scholar] [CrossRef]
  14. Nakayama, K. Triboemission of Charged Particles from Various Solids Under Boundary Lubrication Conditions. Wear 1994, 178, 61–67. [Google Scholar] [CrossRef]
  15. Scudiero, L.; Dickinson, J.T.; Enomoto, Y. The electrification of flowing gases by mechanical abrasion of mineral surfaces. Phys. Chem. Miner. 1998, 25, 566–573. [Google Scholar] [CrossRef]
  16. Wang, Z.L.; Wang, A.C. On the origin of contact-electrification. Mater. Today 2019, 30, 34–51. [Google Scholar] [CrossRef]
  17. Nakayama, K.; Fujimoto, T. The energy of electrons emitted from wearing solid surfaces. Tribol. Lett. 2004, 17, 75–81. [Google Scholar] [CrossRef]
  18. Govindaraj, J.; Subbiah, S. Charged-Particle Emissions During Material Deformation, Failure and Tribological Interactions of Machining. J. Tribol. 2019, 141, 031101. [Google Scholar] [CrossRef]
  19. Nakayama, K. Effect of Normal Force on the Triboplasma Generation Under Oil Lubrication. Tribol. Lett. 2014, 53, 449–456. [Google Scholar] [CrossRef]
  20. You, P. Generation and harm of static electricity. Phys. Technol. 1992, 29–31. [Google Scholar]
  21. Olufayo, O.A.; Abou-El-Hossein, K.; Kadernani, M.M. Tribo-electric Charging in the Ultra-high Precision Machining of Contact lens Polymers. Procedia Mater. Sci. 2014, 6, 194–201. [Google Scholar] [CrossRef]
  22. Dickinson, J.T. Fracto-emission: The role of charge separation. J. Vac. Sci. Technol. A Vac. Surf. Film. 1984, 2, 1112. [Google Scholar] [CrossRef]
  23. Ciniero, A.; Le Rouzic, J.; Baikie, I.; Reddyhoff, T. The origins of triboemission—Correlating wear damage with electron emission. Wear 2017, 374, 113–119. [Google Scholar] [CrossRef]
  24. Nakayama, K.; Hashimoto, H. Triboemission From Various Materials In Atmosphere. Wear 1991, 147, 335–343. [Google Scholar] [CrossRef]
  25. Smith, T.; Naerheim, Y.; Lan, M.S. Theoretical analysis of cutting fluid interaction in machining. Tribol. Int. 1988, 21, 239–247. [Google Scholar] [CrossRef]
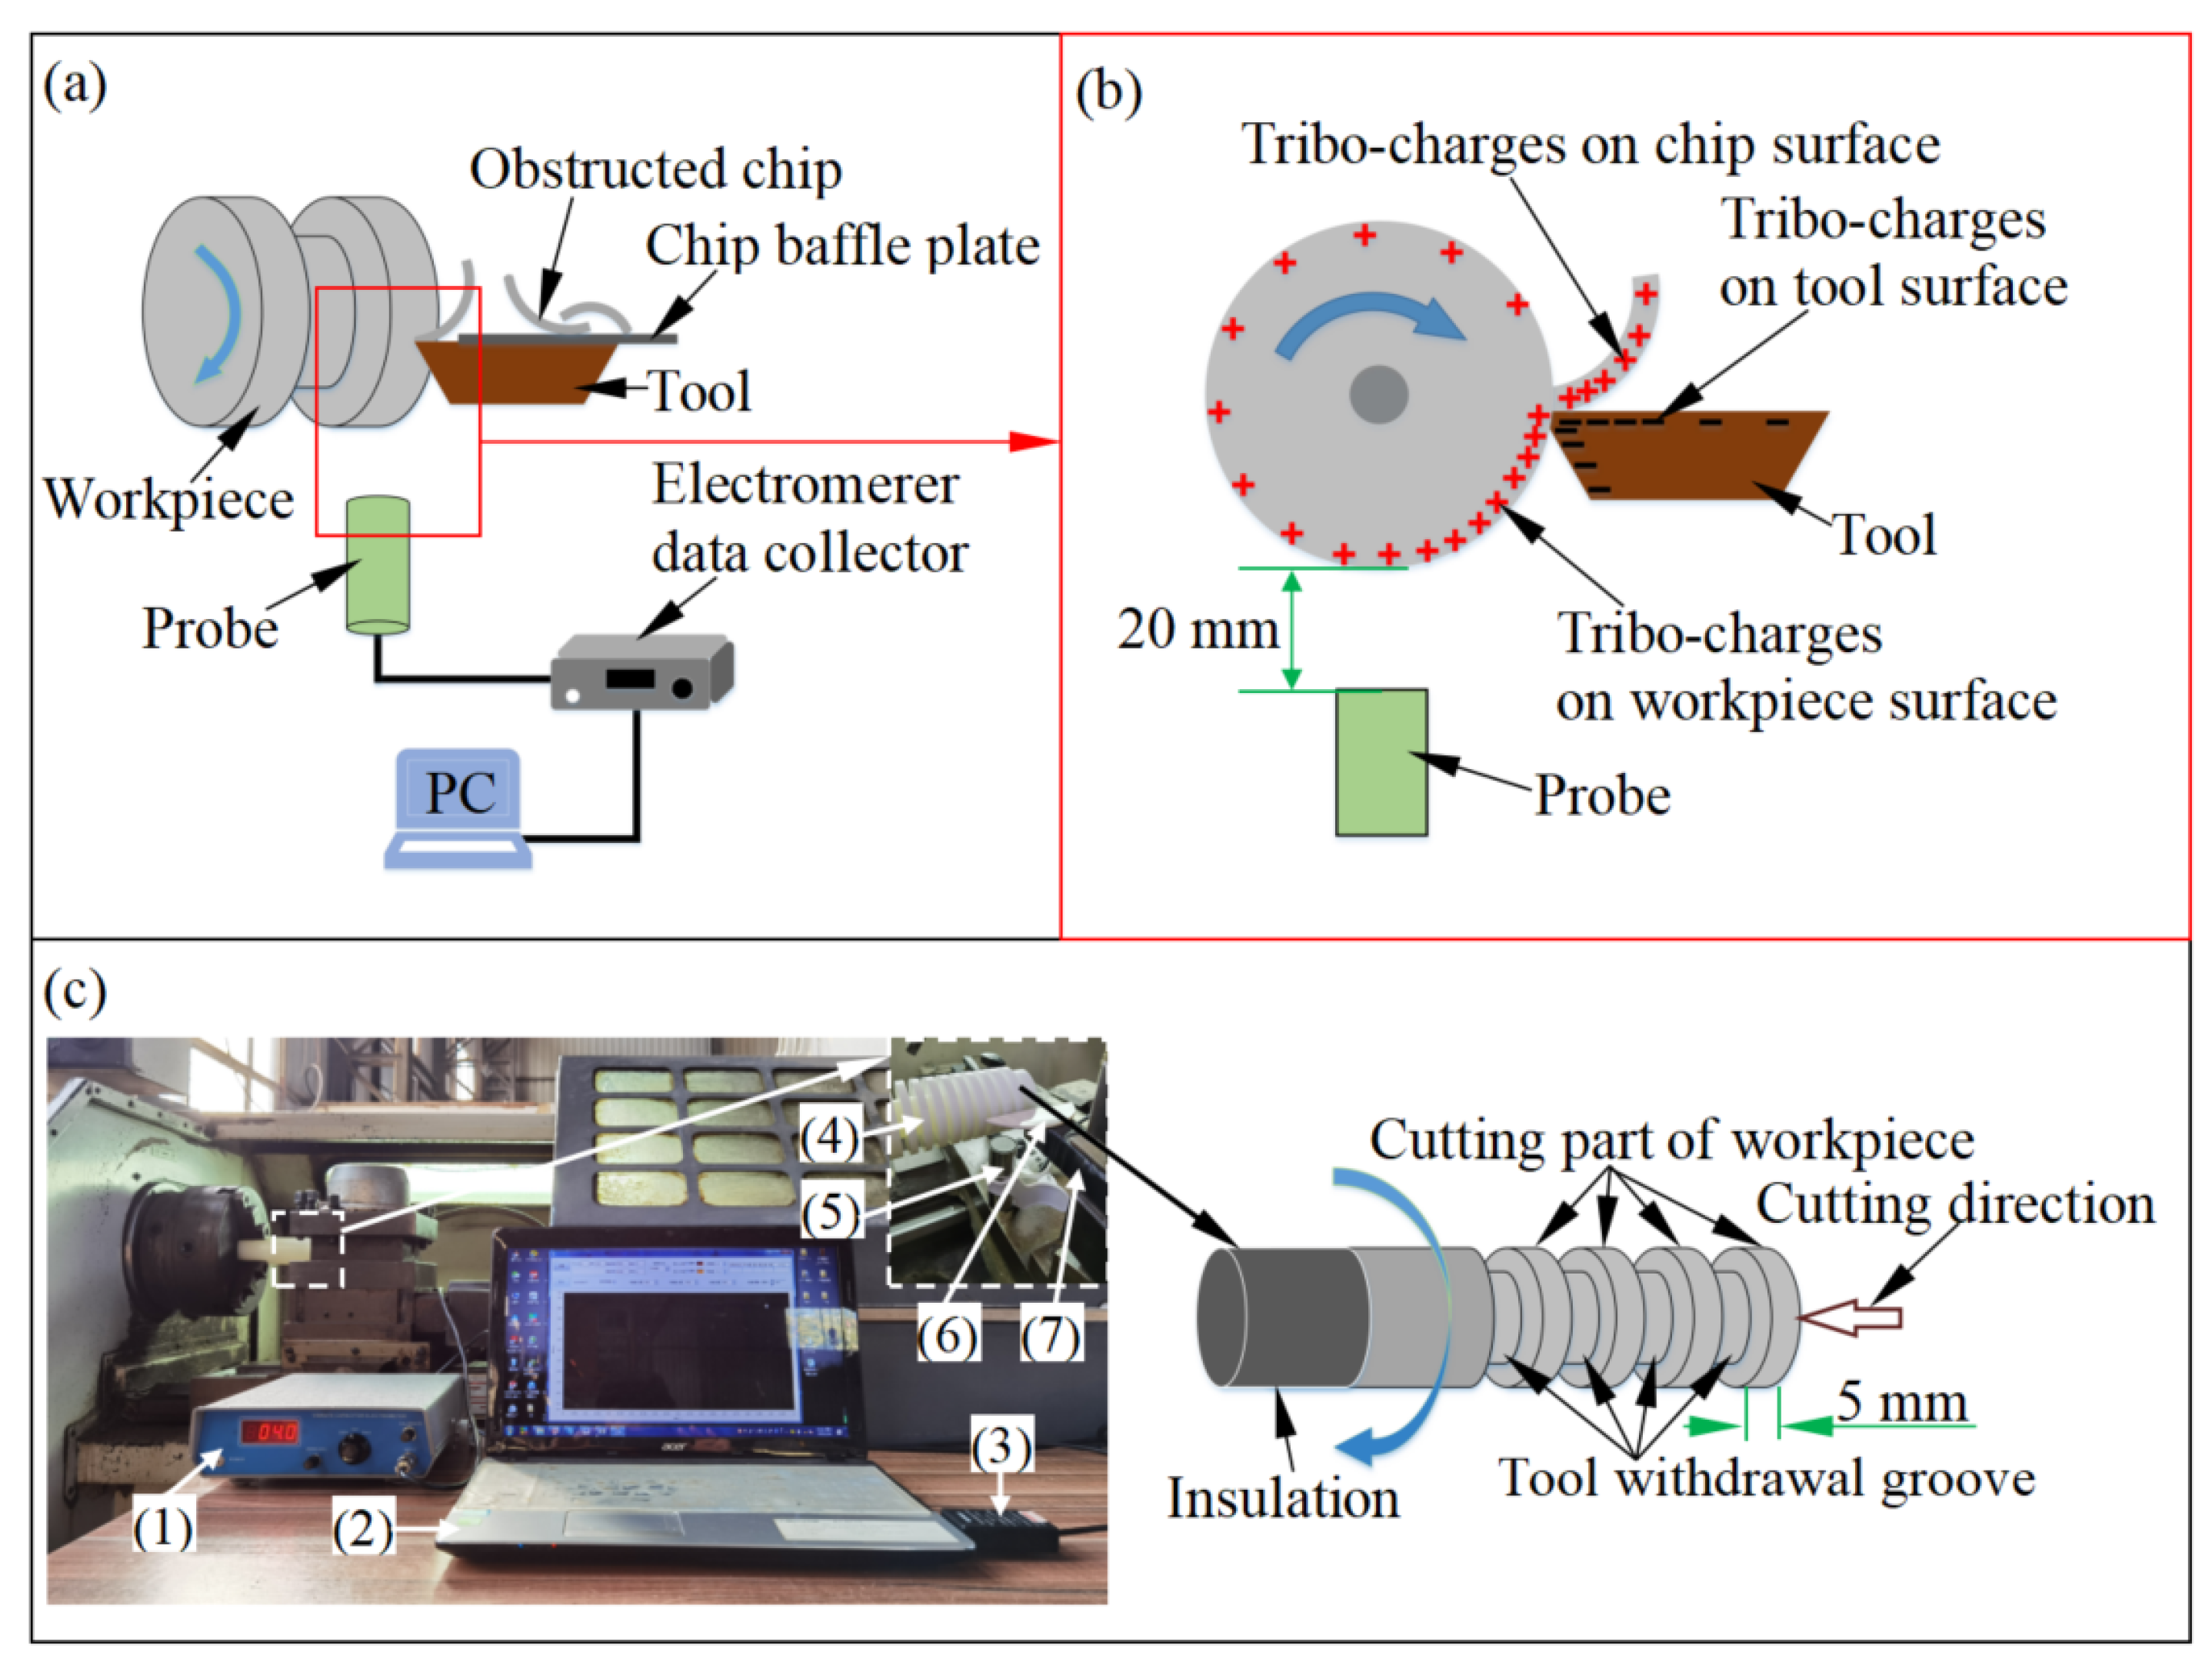
Figure 1. Schematic illustration of the triboelectrification electrostatic potential measurement of the workpiece during the cutting process (a,b) and photographic view of the triboelectrification electrostatic potential measurement of the workpiece experimental set-up (c). (1) Electrometer data collector, (2) PC, (3) data acquisition card, (4) workpiece, (5) probe, (6) chip baffle plate, and (7) tool.
Processes 13 03587 g001
Figure 2. Principle of charged particle emission intensity measurement under atmospheric conditions. (a) Without bias electric field, (b) with negative bias electric field, and (c) with positive bias electric field. (d) Schematic diagram of the ion collector for emission intensity measurement in cutting and (e) photographic view of the ion current intensity measurement experimental set-up. (1) PC, (2) precision ammeter, (3) high-voltage electrostatic generator (EST802A), (4) workpiece, (5) bias electric field plate, (6) tool, and (7) chip baffle plate.
Processes 13 03587 g002
Figure 3. Variation of triboelectrification electrostatic potential under different cutting parameters when processing different materials. (a) Cutting depth as a variable, and the cutting speed and feed rate are fixed at 89.4 m/min and 0.25 mm/r; (b) cutting speed as a variable, and the cutting depth and feed rate are fixed at 1 mm and 0.25 mm/r.
Processes 13 03587 g003
Figure 4. The triboelectrification electrostatic potential curves when cutting different workpieces under various cutting parameters. (a1d1) The cutting materials are PE, ABS, AISI 1015, and AISI 304, respectively when the cutting speed, the cutting depth and the feed rate are fixed at 89.4 m/min, 0.25 mm and 0.25 mm/r. (a2d2) The cutting materials are PE, ABS, AISI 1015, and AISI 304, respectively when the cutting speed, the cutting depth and the feed rate are fixed at 89.4 m/min, 0.5 mm and 0.25 mm/r. (a3d3) The cutting materials are PE, ABS, AISI 1015, and AISI 304, respectively when the cutting speed, the cutting depth and the feed rate are fixed at 89.4 m/min, 1 mm and 0.25 mm/r. (a4d4) The cutting materials are PE, ABS, AISI 1015, and AISI 304, respectively when the cutting speed, the cutting depth and the feed rate are fixed at 63.1 m/min, 1 mm and 0.25 mm/r. (a5d5) The cutting materials are PE, ABS, AISI 1015, and AISI 304, respectively when the cutting speed, the cutting depth and the feed rate are fixed at 44.6 m/min, 1 mm and 0.25 mm/r.
Processes 13 03587 g004
Figure 5. Variation of the NC and PC particle emission intensity under different cutting parameters when cutting various materials. (a,c) Cutting depth as a variable, and the cutting speed and feed rate are fixed at 89.4 m/min and 0.25 mm/r; (b,d) cutting speed as a variable, and the cutting depth and feed rate are fixed at 1 mm and 0.25 mm/r.
Processes 13 03587 g005
Figure 6. The (ad) NC and (AD) PC particle emission intensity curves when cutting different workpieces under various cutting parameters.
Processes 13 03587 g006
Figure 7. Calculation schematic diagram of the self-excited axial electric field generated by the charged particle emission in the capillary.
Processes 13 03587 g007
Figure 8. The chip surface topography. (a) AISI 304 stainless steel and (b) PE; (a3,b3) the measurements of groove depth on chip surfaces. The cutting environment was as follows: cut depth: 0.25 mm; cutting speed: 89.4 m/min; and feed rate: 0.25 mm/r.
Processes 13 03587 g008
Figure 9. Variation of the self-excited axial electric field intensity under different cutting parameters when cutting various workpieces. (a) Cutting depth as a variable, and the cutting speed and feed rate are fixed at 89.4 m/min and 0.25 mm/r; (b) cutting speed as a variable, and the cutting depth and feed rate are fixed at 1 mm and 0.25 mm/r.
Processes 13 03587 g009
Table 1. Experimental conditions.
Machine ToolCAK6150D Precision Lathe
Cutting toolCoated cemented carbide, PVD-TiAlN,
CCMT09T304N-SU, Sumitomo Co., Ltd., Fukuoka, Japan
Tool holderSCLCR2020KO9C
Workpiece materialsMild steel (AISI 1015);
Stainless steel (AISI 304);
Polyethylene (PE);
Acrylonitrile Butadiene Styrene (ABS).
Cutting parametersCutting speed: 44.6, 63.1, and 89.4 m/min;
Depth of cut: 0.25, 0.5, and 1 mm;
Feed rate: 0.25 mm/r;
Cutting length: 5 mm.
EnvironmentDry
Triboelectrification
electrostatic potential detector
Vibratory capacitance electrometer (EST102, Beijing Hua Jinghui Technology Ltd., Beijing, China)
Table 2. Parameters of workpiece and tool materials.
MaterialElectrical Resistivity
(nΩ·m)
HardnessUltimate Strength
(MPa)
Yield Strength
(MPa)
Mild steel
(AISI 1015)
159111 (HB)385325
Stainless steel
(AISI 304)
720201 (HB)515215
Tungsten carbide
(YG6) as tool material
80090 (HRA)344
Polyethylene
(PE)
≥1 × 101945 (Ball Indentation Hardness) 28
Acrylonitrile Butadiene Styrene (ABS)≥1 × 101993.2 (Ball Indentation Hardness)3845.1
Table 3. The half decay time of electrostatic dissipation of workpiece and tool materials into air.
MaterialAISI 1015AISI 304YG6PEABS
Conductivity (S/m)6.3 × 1061.4 × 1061.25 × 106≤1 × 10⁻¹⁰≤1 × 10⁻¹⁰
t 1 / 2 (s)<2.3 × 10⁻¹⁸<1.05 × 10⁻¹⁷<1.17 × 10⁻¹⁷≥0.147≥0.201
ε r w 2~1080~10010~202.3~3.42.4~4.1
Disclaimer/Publisher’s Note: The statements, opinions and data contained in all publications are solely those of the individual author(s) and contributor(s) and not of MDPI and/or the editor(s). MDPI and/or the editor(s) disclaim responsibility for any injury to people or property resulting from any ideas, methods, instructions or products referred to in the content.