You are currently viewing a new version of our website. To view the old version click .
Processes
  • Article
  • Open Access

5 November 2025

Method for Partition Reconfiguration and Mutual Aid of Power Grids Under Extreme Events Oriented to Critical Load Guarantee

,
,
,
,
and
1
Department of Electrical Engineering, School of Electrical and Electronic Engineering, Shandong University of Technology, Zibo 255049, China
2
State Grid Shandong Electric Power Company, Jinan 250013, China
3
Electric Power Research Institute of State Grid Shandong Electric Power Company, Jinan 250013, China
*
Author to whom correspondence should be addressed.
This article belongs to the Section Energy Systems

Abstract

To address the challenge of frequent extreme events causing power grid failures and traditional post-fault recovery modes struggling to meet the rigid demand for continuous power supply to critical loads, this paper proposes a partition-based two-layer optimization strategy. First, a partitioning index coupling active power flow with reactive voltage sensitivity is constructed, and the Fast Newman algorithm is applied to obtain partitions tailored to extreme events. Second, a two-layer optimization model is established: the upper layer performs network reconfiguration to minimize the total load curtailment, while the lower layer coordinates adjustable resources and power mutual aid between partitions. A simulation verification using the IEEE 39-bus system shows that the proposed method efficiently makes decisions during extreme events, achieving zero interruption for critical loads and reducing the curtailment of non-critical loads to 374.9 MW—a reduction of 54 percent compared to the traditional centralized dispatch model. The partitioning results also exhibit a high modularity of 0.6554 and a low boundary power flow factor of 0.1321, confirming the structural and functional advantages of the proposed approach. The method demonstrates good practical application value in enhancing grid resilience.

1. Introduction

Global climate change continues to intensify, with a significant increase in the frequency of extreme weather events such as hurricanes, blizzards, earthquakes, and heavy rainfall. This has led to a growing number of cases where power systems suffer damage. Taking the 2023 fault investigation in Hefei, China, as an example, a total of 533 power outage incidents occurred during the meteorological early warning period, with a daily average of 1.46 incidents. Power system faults caused by extreme weather not only occur more frequently, but their scope of impact and severity also continue to expand. Some severe faults even trigger cascading failures, ultimately leading to the paralysis of regional power grids [,]. Such incidents may further affect important infrastructure such as satellite operations, communication and navigation systems, and power transmission networks [], resulting in extensive social impacts and economic losses. Therefore, effectively identifying power grid oscillation sources, mitigating the impacts of extreme events on power systems, and ensuring the continuous power supply for critical loads have become major issues related to social order and national security [,,]. Against this backdrop, various methods for ensuring the continuity of power supply have been proposed. Ref. [] improves the power supply reliability for critical loads by establishing an integrated modeling of the transmission and distribution networks. Ref. [] points out that, once power is cut off for life-safety-related loads such as hospitals, it will seriously affect public safety and social stability, and even hinder post-disaster rescue efforts, triggering secondary disasters. Therefore, ensuring the uninterrupted power supply for such loads is of utmost importance.
The power generation capacity of renewable energy sources such as wind power and photovoltaic power is highly dependent on natural conditions, rendering them vulnerable during extreme events. Traditional power system restoration strategies primarily focus on “post-fault restoration” and typically achieve power supply recovery through island partitioning and hierarchical load regulation []. However, for critical users like hospitals and research centers that cannot tolerate power supply interruptions, the traditional restoration mode can barely meet the strict requirement of an uninterrupted power supply for critical loads.
To achieve a truly uninterrupted power supply, it is essential to ensure a continuous electrical connectivity between power sources and critical loads through power grid reconfiguration. With the rapid development of distributed generation, electrochemical energy storage, and flexible load regulation technologies, the number of factors that need to be coordinated in the process of power grid reconfiguration has increased significantly. Efficiently coordinating these adjustable resources has become a key issue in current research []. Ref. [] takes minimizing fault outage losses as the objective function and improves the economy and reliability of the distribution network by reconfiguring the network topology. Ref. [] introduces the operating characteristics of distributed generation for structural optimization based on load balancing. Ref. [] explores the impact of the installation location and capacity configuration of adjustable resources on reconfiguration strategies.
To achieve a rapid reconfiguration of the transmission network under extreme events, dynamic partitioning can be carried out based on the actual impact of the event and the fault characteristics of the power grid, which decomposes the complex system reconfiguration problem into multiple sub-problems, significantly reducing computational complexity and improving response speed. The existing power grid partitioning methods mainly focus on two key aspects: topological modeling and partitioning algorithms. In terms of topological modeling, most studies define line weights to characterize connection relationships, but there remains controversy regarding the criteria for weight selection; for instance, using line impedance [] or reactance [] as a weight fails to fully reflect the operational characteristics of the power grid. Although some studies have adopted an improved reactance power flow model to coordinate network structure and active power distribution [], they overlook the impact of reactive power, while another study [] uses the Jacobian matrix to calculate active and reactive voltage sensitivities separately to consider both characteristics—however, this method has a limited applicability in transmission networks where resistance is much smaller than reactance. Overall, the existing research mostly focuses on active power or handles active and reactive power separately and has not yet systematically solved the problem of active–reactive power-coupling modeling. In terms of partitioning algorithms, the existing methods can be categorized into two types: intelligent algorithms and graph theory-based methods [,]; while intelligent algorithms have a simple structure, they tend to suffer from low computational efficiency and local optimality when dealing with large-scale power grids, whereas graph theory-based methods, with their clear structure and high computational efficiency, are more suitable for transmission network partitioning. Currently, mainstream graph theory-based methods include splitting methods [,], clustering methods [], and complex network modularity methods [,]; for example, Ref. [] uses the GN splitting algorithm to achieve partitioning by iteratively cutting lines with high edge betweenness, but it has a high computational complexity, and Ref. [] combines an electrical coupling matrix with K-means clustering to improve partitioning speed, yet it still requires pre-specifying the number of partitions, which is a significant limitation.
To address the aforementioned issues, this paper proposes an improved dynamic partitioning and reconfiguration method. Building upon the reactive power–voltage sensitivity analysis from [], we integrate it with active power flow to construct a novel coupled weight index that more comprehensively characterizes the operational characteristics of the power grid. For the partitioning task, the Fast Newman algorithm [,] is selected due to its superior performance compared to alternative approaches. While meta-heuristic algorithms [,] often face challenges in computational efficiency and local optima for large-scale grids, and clustering methods such as K-means [,] require pre-specifying the number of partitions, the Fast Newman algorithm efficiently achieves optimal modularity partitioning without such prerequisites, ensuring both a high solution quality and rapid response capability critical under extreme events. On the basis of partitioning, a hierarchical coordinated reconfiguration strategy is established where the upper-layer network reconfiguration, formulated as a high-dimensional combinatorial optimization problem, is solved using the Tabu Search algorithm [], which demonstrates a superior global search capability and effectiveness in escaping local optima compared to other heuristic methods, while the lower-layer coordination problem, formulated as a convex quadratic programming model, is solved using the primal-dual interior point method [], which offers polynomial time complexity and superior numerical stability compared to the conventional optimization methods for large-scale convex optimization problems. The distributed coordination between the upper and lower layers, as well as the power mutual aid between adjacent partitions, is implemented via the Alternating Direction Method of Multipliers [,], which is specifically chosen over other decentralized coordination methods such as dual decomposition or heuristic rules for its robust performance in handling coupled constraints through the efficient decomposition of the global problem into parallel solvable sub-problems, guaranteed convergence to an optimal solution for our convex model, and faster demonstrated convergence rates in practice compared to purely dual-based approaches, all of which are vital for the rapid decision-making required in extreme events. Finally, a case analysis demonstrates the effectiveness of the proposed method through comprehensive performance metrics including switch strategies, power interaction, and load curtailment schemes, with quantitative comparisons against traditional centralized optimization methods confirming that the established model exhibits a significantly better recovery performance and operational rationality under extreme events.

2. Power Grid Partitioning and Post-Validation Evaluation Indicators

2.1. Active–Reactive Power-Coupling Weight Matrix

In the field of complex network research, a power grid can be abstracted as a complex network G = (V,E). Among them, V represents the set of power grid nodes, including generation, transmission, and load nodes. After simplification, all types of nodes are equivalent to undifferentiated nodes, and neutral point grounding branches are ignored. E, the set of edges, represents transmission lines and transformers, both of which are equivalent to edges. To carry out power grid regional division using complex network theory, it is necessary to first reasonably simplify the power grid nodes, lines, and their associated relationships. Based on the actual operating scenario of the power grid, it is transformed into a weighted undirected network. Active power flow and reactive voltage sensitivity are selected as the line-coupling weights, and then the complex network-coupling matrix of the power grid is constructed, which provides a basic support for the subsequent power grid regional division.

2.1.1. Active Power Flow

To construct an active power weight that fits the characteristics of a weighted undirected network and is set reasonably, it is necessary to process the active power flow Pij. Specifically, first, take the absolute value of Pij to eliminate the interference of the power flow direction on weight construction; on this basis, carry out normalization processing, and map the absolute value of the active power flow to the interval [0, 1] through a specific mathematical transformation, so that the processed data can accurately reflect the relative intensity of the active power interaction between lines. Thus, for the subsequent power grid analysis based on complex network theory, an active power weight that meets the requirements of the weighted undirected network, has a clear physical meaning, and has a reasonable numerical setting is constructed.
w i j p = | P i j | min { | P i j | } max { | P i j | } min { | P i j | } i , j   directly   connected 0 i , j   not   directly   connected
where w i j P is the active power flow weight between node i and node j; Pij is the active power flow value between node i and node j; and min{|Pij|} and min{|Pij|} are the minimum and maximum values of the absolute values of the active power flows of all lines in the power grid, respectively. Through linear normalization, the active power flow is mapped to a weight between 0 and 1: the line with a larger power flow has a weight closer to 1, indicating that the line is more critical in power transmission; the line with a smaller power flow has a weight closer to 0, indicating that the line has a smaller impact on the overall power flow.

2.1.2. Reactive Power–Voltage Sensitivity

To characterize the reactive power characteristics of power grids, it is necessary to construct a reactive power–voltage sensitivity matrix, which is normalized to generate reactive power weights for supporting analysis and optimization. The matrix reflects the coupling relationship between reactive power and voltage, and the normalized weights are used for topological analysis or regional division. In power flow calculations, after linearizing the equations, a linear relationship between power disturbances and voltage changes is established based on the inverse transformation of the Jacobian matrix, with the mathematical expression as follows:
Δ θ Δ V = S P θ S Q θ S P V S Q V Δ P Δ Q
where S and S characterize the variation in the voltage phase angle of the corresponding node when unit active power and reactive power are injected into the node, respectively; and SPV and SQV characterize the variation in the voltage amplitude of the corresponding node when unit active power and reactive power are injected into the node, respectively.
In transmission network analysis, line resistance is much smaller than reactance, so voltage losses from active power transmission are negligible. Node voltage changes are mainly dominated by reactive power interactions. Thus, when analyzing node voltage dynamics, the impact of active power injection can be ignored to establish node voltage changes:
Δ V = S QV Δ Q
To fully capture the reactive power-coupling characteristics of transmission network nodes, PV nodes must be included. Using a recursive method, sequentially explore the impact of reactive power changes in PV nodes on the voltage of other nodes: take the reactive power fluctuation of a single PV node as input, track the propagation and influence of voltage changes through the power flow calculation or sensitivity recursion, repeat for all PV nodes, and construct a reactive power–voltage sensitivity matrix covering both PQ and PV nodes, with the following form:
S QV Aug = S 11 S 1 m S 1 ( m + 1 ) S 1 n S m 1 S m m S m ( m + 1 ) S m n S ( m + 1 ) 1 S ( m + 1 ) m S ( m + 1 ) ( m + 1 ) 0 S n 1 S n m 0 S n n
The full-dimensional reactive power–voltage sensitivity matrix in Equation (4) covers all power supply and load nodes in the transmission network. Compared with traditional models, it breaks boundaries by integrating the reactive power–voltage characteristics of power supply nodes into partitioning. By quantifying node association strengths, it captures the entire network’s reactive power coupling, compensates for the insufficient portrayal of power supply-side coordination in traditional partitioning, and further derives normalized reactive power weights for each edge in the complex network:
w i j Q = 1 2 ( S i j + S j i ) min 1 2 ( S i j + S j i ) max 1 2 ( S i j + S j i ) min 1 2 ( S i j + S j i ) , i , j   directly   connected 0 , i , j   not   directly   connected
After obtaining the normalized active power weight w i j P and the reactive power weight w i j Q derived above, a linear weighting strategy is adopted to fuse the two, so as to construct a comprehensive weight that can simultaneously reflect the active power flow coupling and the reactive power–voltage interaction characteristics:
w i j com = λ w i j P + ( 1 λ ) w i j Q
where λ ∈ [0, 1] is the weight distribution coefficient.

2.2. Verification and Evaluation Indicators

To comprehensively and scientifically measure the effectiveness of power grid partitioning, a dual-dimensional evaluation framework integrating structural and functional aspects is constructed. This framework systematically verifies the partitioning quality from two dimensions: the topological architecture of the power grid and its actual operational characteristics.

2.2.1. Partition Structure Indicator

To characterize the local aggregation of power grid partition topology, the average clustering coefficient is used as the core indicator, which reflects the high cohesion of the region by measuring the connection tightness between nodes and their neighbors, supporting topological rationality, with its mathematical definition as follows:
C = 1 N i = 1 N 2 E i k i ( k i 1 )
where C is the overall clustering coefficient; N is the total number of nodes in the network; i is the node index; Ei is the number of edges actually existing between the neighboring nodes of node i; and ki is the degree of node i.

2.2.2. Partition Functional Indicators

To quantify the rationality of power interaction between power grid partitions, the boundary power flow factor is proposed to evaluate the relative relationship between power flows on inter-partition tie-lines and loads, supporting the analysis of partition independence and stability, with its mathematical expression as follows:
B pf = v w | P v w | i = 1 n L i
where Pvw is the active power flow of the tie-line between node v and node w on the boundary of the sub-partition; Li is the active load of the i-th load node within the sub-partition; and n is the total number of load nodes within the sub-partition.

2.3. Partitioning Algorithm

To accurately identify the partitions with tight electrical coupling in the transmission grid for supporting hierarchical control and safe operation of the power grid, a partitioning method based on the comprehensive edge weight matrix Aij is constructed. It uses the Fast Newman algorithm to iteratively merge communities and maximize the modularity Q, explores the structure of “strong internal coupling and weak inter-partition connection”, and supports subsequent operation control.

2.3.1. Principle of Partitioning Algorithm

The Fast Newman algorithm identifies network communities using the weighted modularity Q via greedy optimization. It uses modularity to measure the difference in connection strength between the actual and expected network communities, matching the characteristic of “strong internal coupling within regions” in transmission grid scenarios. The mathematical expression is as follows:
Q = 1 2 m i j A i j k i k j 2 m δ ( c i , c j )
where Aij is the total edge weight representing the coupling strength between nodes; ki is the weighted degree of node i; and m is the total number of all edges in the network.
Δ Q = 1 2 m 2 i C 1 j C 2 A i j ( k C 1 + k C 2 ) 2 2 m + k C 1 2 + k C 2 2 2 m
where C1 and C2 represent the node sets of two communities; and k C 1 and k C 2 are the total degrees of communities C1 and C2, respectively.
The algorithm adopts a “bottom-up” approach: treat each node as an independent community, iteratively merge adjacent communities to maximize modularity Q until one community remains, generate a “modularity–community count” curve, select the division at maximum Q as the optimal transmission grid partition, and use the modularity to capture electrical coupling for refined operation control.

2.3.2. Algorithm Implementation Process

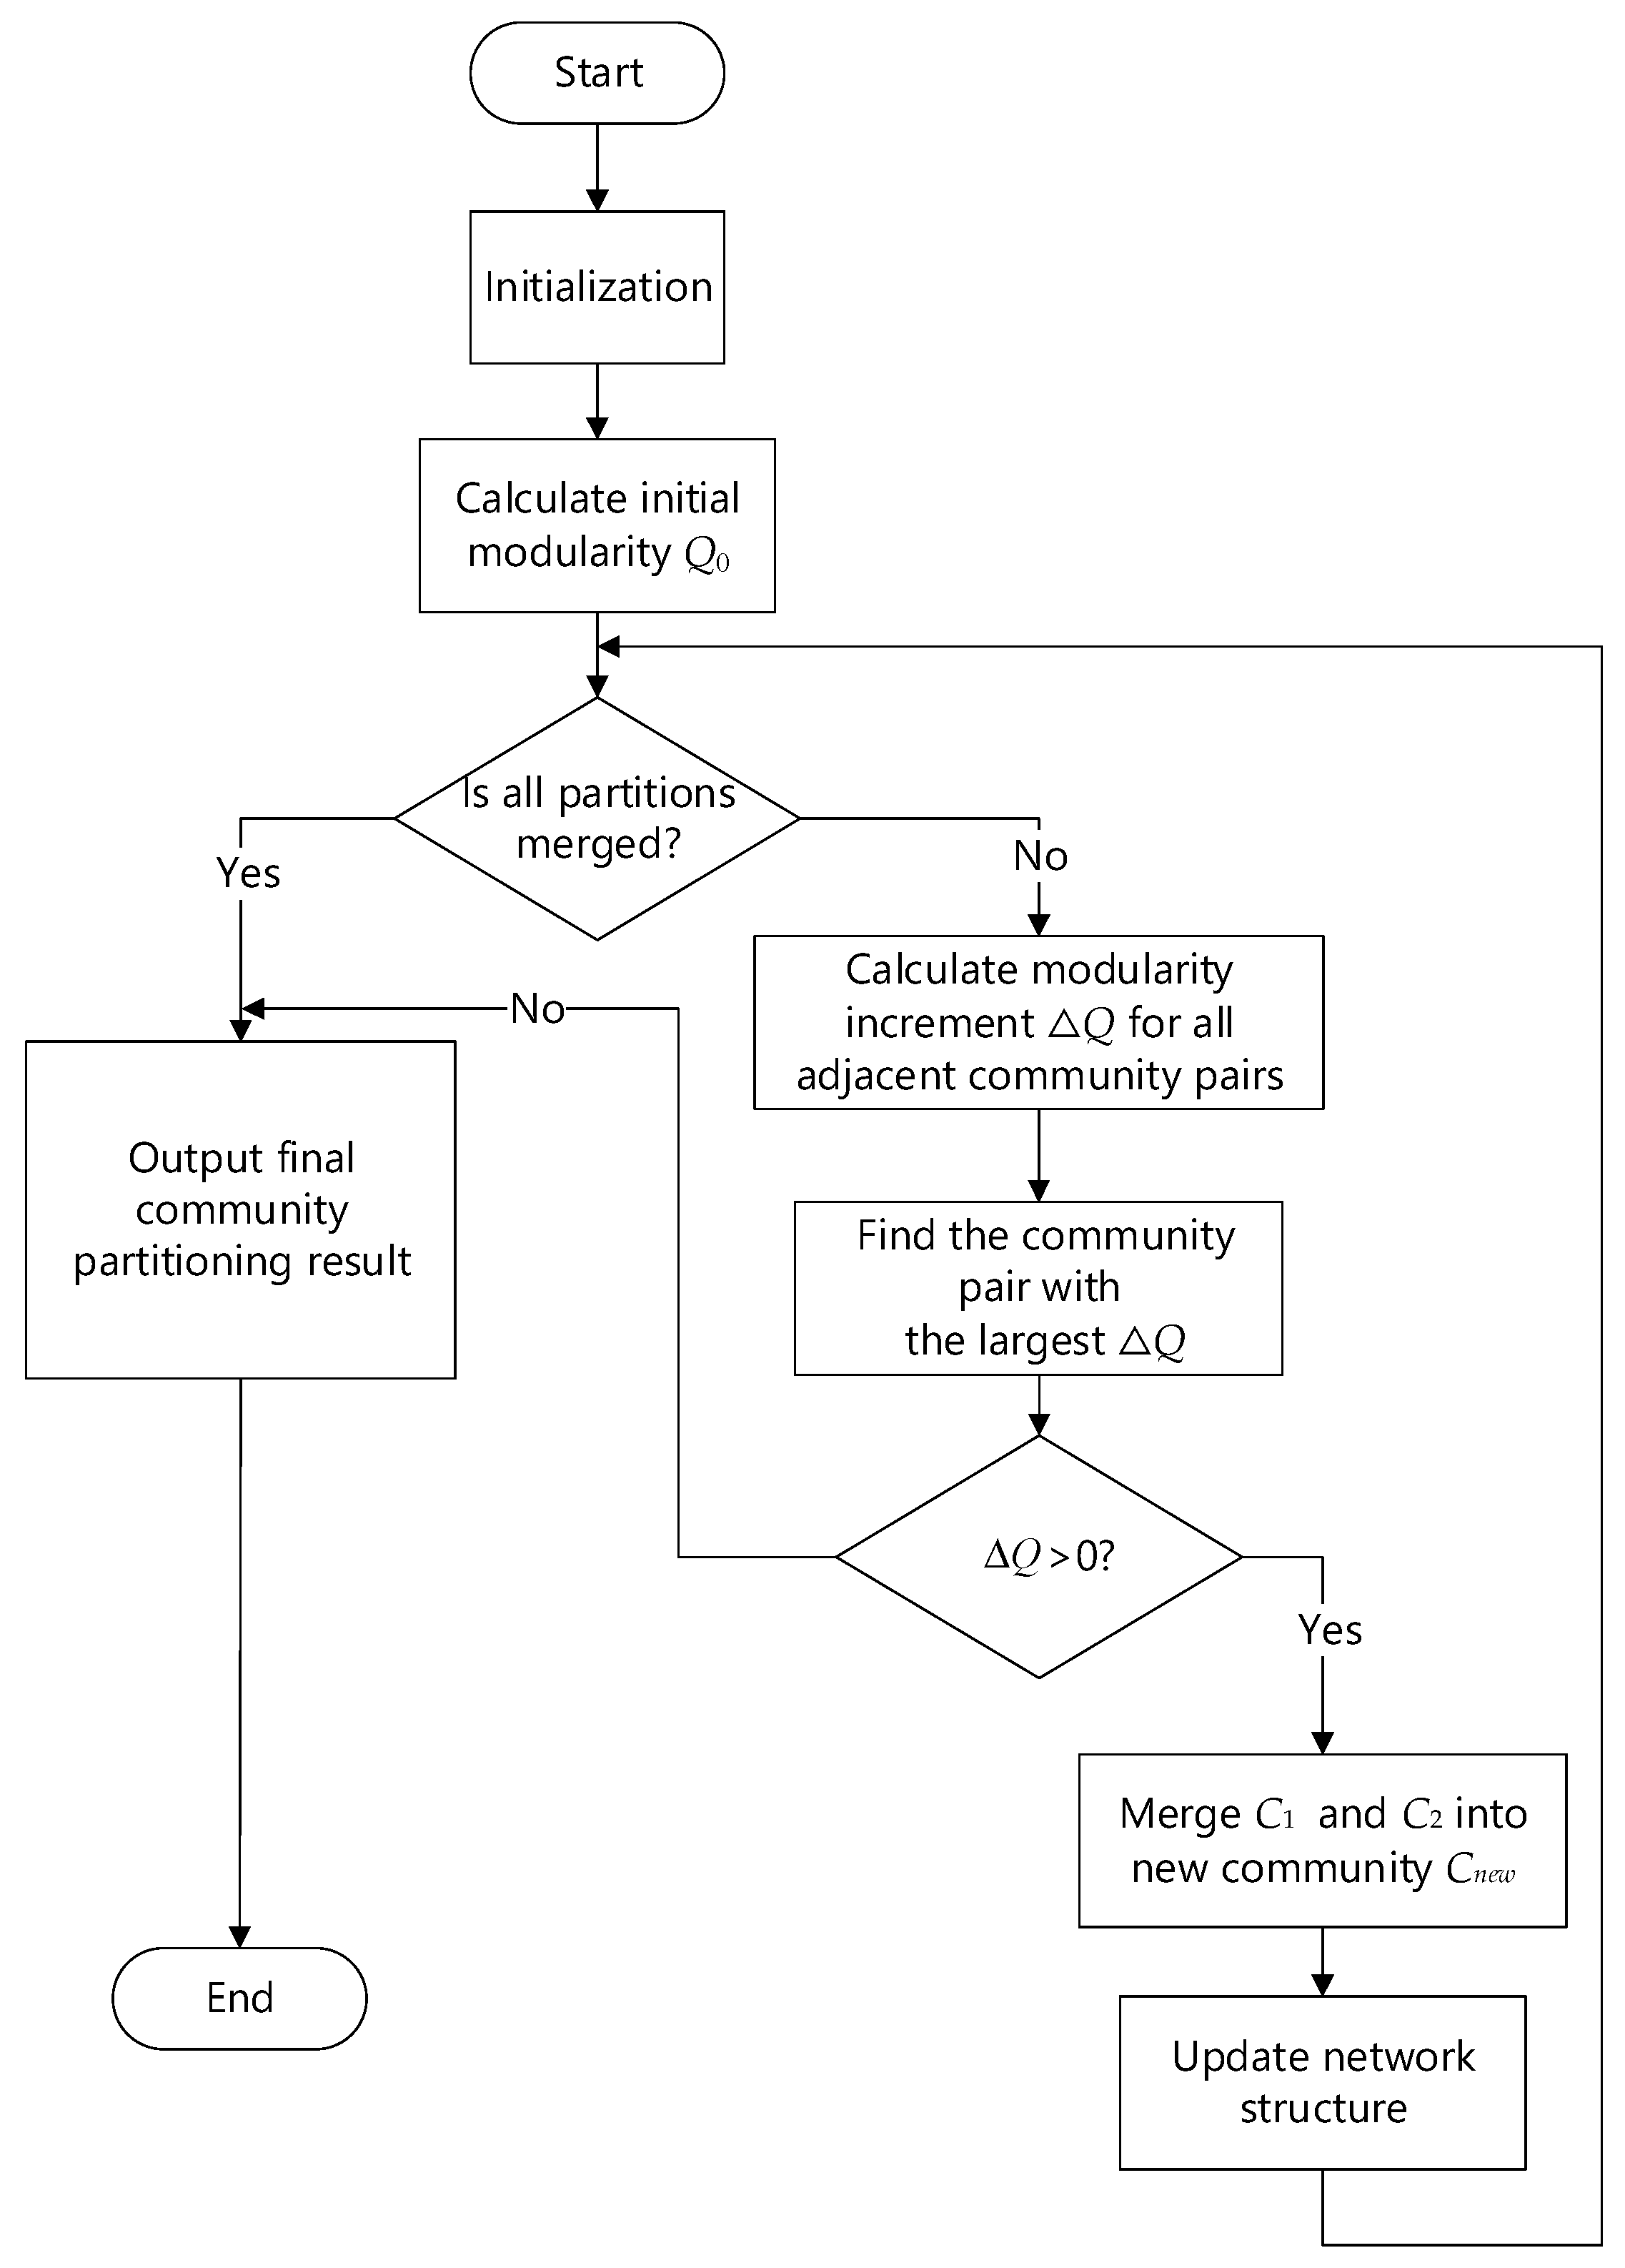
The Fast Newman algorithm adopts a greedy strategy and gradually merges communities to maximize the modularity increment. The specific steps are as follows:
(1)
Step 1: Treat each node as an independent community. Initially, there are n communities. Calculate the initial modularity.
(2)
Step 2: For each pair of adjacent communities connected by at least one edge, calculate the modularity increment ΔQ after merging them.
(3)
Step 3: Find the two adjacent communities C1 and C2 that maximize ΔQ. If ΔQ > 0, merge these two communities and update the modularity Q; If ΔQ ≤ 0, it means that further merging will not improve the modularity, and the algorithm terminates.
(4)
Step 4: After merging C1 and C2, generate a new partition. Let Cnew = C1C2, update the adjacency matrix A, merge the edges between C1 and C2 into Cnew, and update the community list to reduce the number of communities by one.
(5)
Step 5: Repeat the calculation of ΔQ, community merging, and network structure updating until all possible merges cannot increase Q. Finally, the optimal partition scheme is obtained.
The flowchart of the Fast Newman algorithm is shown in Figure 1.
Figure 1. Flowchart of the Fast Newman algorithm.

3. Double-Layer Optimal Power Supply Guarantee Model for Transmission Grid Under Extreme Events

To ensure the power supply for critical loads and enhance power grid resilience under extreme events, while addressing the shortcomings of traditional centralized optimization, this paper constructs a bi-level optimization model. The model consists of a network reconfiguration layer and a coordination optimization layer. The upper and lower layers achieve a collaborative optimization via the Alternating Direction Method of Multipliers, and ultimately rely on an integrated closed-loop control mechanism combining topological adjustment and power optimization to realize the precise guarantee of critical loads.

3.1. Overall Architecture of the Two-Layer Optimization Model

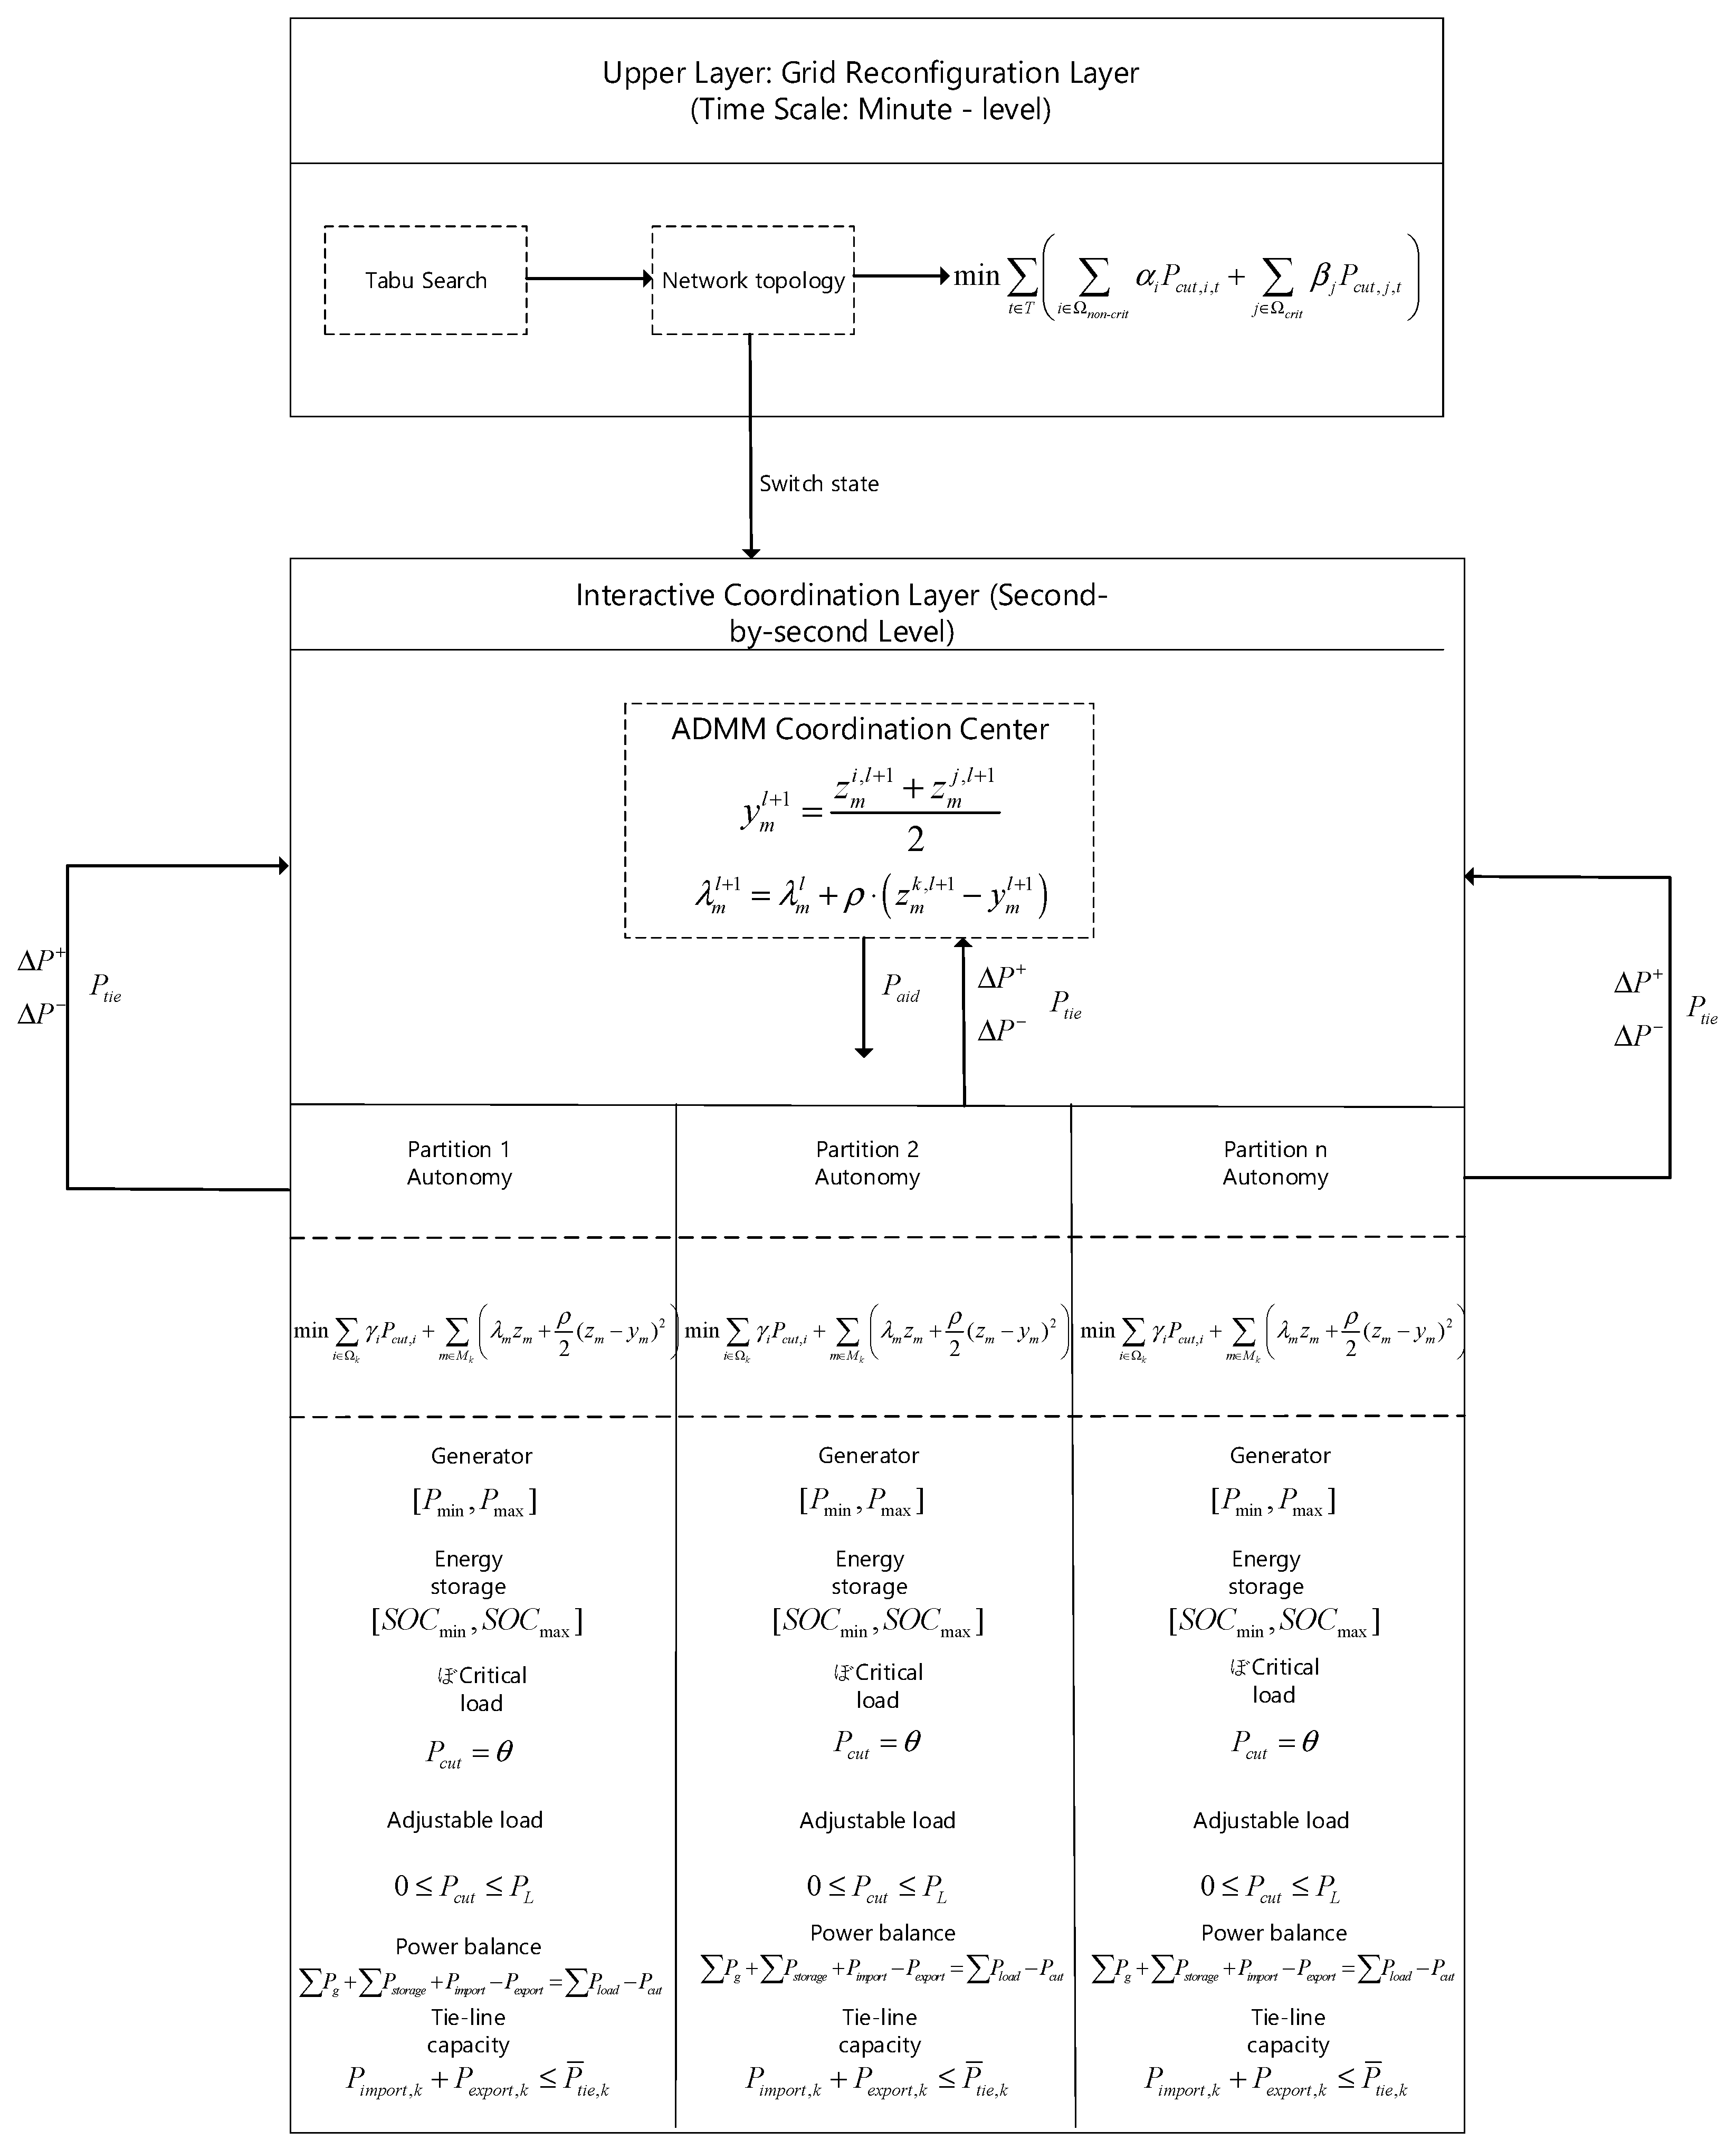
The two-layer optimization model proposed in this chapter adopts a hierarchical control structure of “upper-level network reconfiguration and lower-level partition coordination”: the upper layer adjusts switches to realize topological reconfiguration, conduct power mutual assistance, and curtail non-critical loads; the lower layer performs independent power optimization for each partition, achieves interactive coordination with the upper layer via the Alternating Direction Method of Multipliers to ensure zero curtailment of critical loads, and ultimately forms the two-layer optimization model. The overall architecture of the two-layer optimization model is depicted in Figure 2.
Figure 2. Architecture diagram of two-layer optimization model for transmission network under extreme events.

3.2. Model Construction of Upper-Level Network Reconfiguration Layer

The upper-level model takes the switch state as the core decision variable. A binary variable uk,t ∈ {0, 1} is set to represent the state of the k-th switch at time t, where uk,t = 1 means the switch is closed and uk,t = 0 means the switch is open. This variable covers two types of switches, namely tie switches and circuit breakers. The system topology structure is determined through the combination of switch states.

3.2.1. Objective Function

The upper-level model aims to minimize the load shedding amount of the entire system, giving priority to ensuring the power supply for important loads. Its mathematical expression is as follows:
min t T i Ω non - crit α i P cut , i , t + j Ω crit β j P cut , j , t
where Ωnon-crit and Ωcrit denote the sets of non-critical loads and critical loads, respectively; αi and βj are weight coefficients; and βj is two orders of magnitude higher than αi.
In extreme event scenarios, non-critical loads like lighting in ordinary commercial premises and electricity for non-essential production equipment are first distinguished from critical loads such as electricity for hospital operating rooms and urban flood control and drainage pumping stations. Then, a dual protection mechanism is established through upper-level objective guidance and lower-level hard constraints—specifically ensuring zero curtailment of critical loads. This mechanism supports the achievement of the “zero power outage” goal for critical loads while enhancing the resilience and power supply guarantee capability of the transmission grid under extreme events.

3.2.2. Constraints

In scenarios involving system partitioning and operational adjustments in response to extreme events, it is necessary to comply with multi-dimensional constraint conditions to ensure the reliable, safe, and feasible operation of the system. The specific constraint types, core formulas, and functions are as follows:
(1)
Radial structure constraint
u k = N bus N source
where Nbus is the number of partition nodes; Nsource is the number of power source points within the partition; and uk indicates whether a line is in operation or out of operation. The constraint ensures the network operates without loops and avoids short-circuit faults.
(2)
Switch operation constraints
| u k , t u k , t 1 | Δ u max
where Δumax is the maximum allowable number of switch operations; and uk,t and uk,t−1 represent the states of switch k at time t and t − 1, respectively. This constraint avoids equipment damage caused by frequent switch operations under extreme events.
(3)
Partition power feasibility constraint
| Δ P k | η
where ΔPk is the partition power deficit or surplus fed back from the lower layer; and η is the preset power deviation threshold. This constraint ensures the feasibility of the system power after topology reconfiguration.

3.3. Model Construction of the Lower-Level Partition Coordination Layer

As the lower-level execution unit of the global resilience improvement strategy, the partition-independent optimization model focuses on the autonomous optimization of a single partition. Through the configuration of refined decision-making variables and the design of a hierarchical objective function, it ensures the power balance of the partition under extreme events, and at the same time provides interactive “local optimization results” for the upper-level global coordination, supporting cross-partition mutual assistance and the closed loop of overall resilience.

3.3.1. Objective Function

The partition objective function consists of two parts: the minimization of the local load shedding amount and the ADMM coordination term. The objective function of the lower-level planning is the minimum loss of the entire distribution network, and its mathematical expression is as follows:
min i Ω k γ i P cut , i + m M k λ m z m + ρ 2 ( z m y m ) 2
where γi is the load weight of non-critical loads; Mk is the set of tie-lines of partition k; zm is the local mutual-aid power variable of tie-line m; ym is the global consensus value of the tie-line power; λm is the Lagrange multiplier; and ρ is the penalty coefficient. The second ADMM coordination term is used to realize the consistency optimization of the mutual-aid power among partitions and ensure the global power balance.

3.3.2. Constraints

To ensure the feasibility of the partition-independent optimization model and the operational safety of the system under extreme events, this model needs to comply with the following multi-dimensional constraint conditions, and construct a complete constraint system in terms of power balance, equipment safety, load guarantee, tie-line transmission, and other aspects:
(1)
Power balance constraint
P g + P storage + P import P export = P load P cut
where Pg is the active power of the generator; Pstorage is the net power of the energy storage device; Pimport is the active power input from the outside to this partition, i.e., the power received by the partition; Pexport is the active power output from this partition to the outside, i.e., the power transmitted by the partition; Pload is the active power of the load within the partition; and Pcut is the active power of the load curtailment.
(2)
Generator ramp rate limit
| P g , t P g , t 1 | Δ P g , max
where Pg,t and Pg,t−1 represent the active power outputs of generator g at time t and t − 1, respectively; |Pg,tPg,t−1| represents the absolute value of the change in the active power output of generator g between adjacent moments, reflecting the magnitude of the output fluctuation; and ΔPg,max represents the maximum allowable ramp rate of generator g, which is a preset threshold, limiting the variation range of the active power output of the generator between adjacent moments and avoiding equipment damage caused by severe fluctuations in the output.
(3)
Energy storage SOC constraint
SOC ¯ SOC t SOC ¯
where SOCt represents the state of charge of the energy storage device at time t, reflecting the proportion of the actual remaining electricity of the energy storage device at that moment; and SOC represents the lower limit of the state of charge of the energy storage device. This constraint ensures that the energy storage operates within a safe and reasonable electricity range, avoiding both over-discharge and over-charge.
(4)
Constraint for Critical Load Guarantee
P cut , j = 0 j Ω crit
where Pcut,j represents the load curtailment amount for the j-th load; and Ωcrit represents the set of all objects defined as critical loads.
(5)
Tie-line capacity constraint
P import , k + P export , k P ¯ tie , k
where Pimport,k represents the received active power of tie-line k, that is, the active power input from tie-line k to the local area; and Pexport,k represents the transmitted active power of tie-line k, that is, the active power output from the local area to the outside through tie-line k.

4. Design and Implementation of the Solution Algorithm for the Bi-Level Optimization Model

Aiming at the significant differences in optimization objectives and constraint conditions between the upper-level network reconfiguration layer and the lower-level coordination optimization layer in the bi-level optimization model for transmission networks under extreme events, this chapter focuses on the solution logic. It elaborates on the upper-level Tabu Search algorithm, the lower-level solution based on the primal-dual interior point method, and the implementation method of interactive coordination between the upper and lower layers based on the Alternating Direction Method of Multipliers. Through algorithm adaptation and collaboration, an efficient solution for critical load power supply guarantee under extreme events is achieved.

4.1. Solution Algorithm for the Upper-Level Model: Tabu Search

The upper-level model focuses on discrete combinatorial optimization problems such as grid reconfiguration, which require an adaptation to high-dimensional discrete solution spaces and global optimization requirements. Tabu Search, with its meta-heuristic characteristics based on a memory mechanism, becomes a key algorithm suitable for this scenario.

4.1.1. Algorithm Principle and Adaptability Analysis

As a memory-based metaheuristic algorithm, Tabu Search avoids local optima through a “tabu list” and expands the solution space via neighborhood search. Its discrete search capability and memory mechanism effectively adapt to the high-dimensional discrete optimization needs of 0–1 combinations of switch states in the upper-level network reconfiguration layer. It efficiently explores topological reconfiguration schemes through neighborhood strategies and prevents falling into locally optimal topological configurations using the tabu list, meeting the demand for globally optimal solutions under multiple constraints.

4.1.2. Algorithm Flow Design

(1)
Step 1: Initialization: Based on the normal operation topology of the transmission grid or the topology right before an extreme event, randomly generate the initial switch state combination uinit = { u k , t i n i t } as the starting point for the algorithm’s search. Ensure that the initial solution meets basic constraints such as no isolated nodes and an initial switch operation count of 0 to minimize invalid searches. Simultaneously, initialize an empty tabu list and set its length to record recently searched switch state combinations and prevent repetitive exploration.
(2)
Step 2: Neighborhood Solution Generation Strategy: For the current switch state combination ucurrent, design the following rules:
  • Single-switch flipping: Randomly select a switch k and flip its state (0 to 1 or 1 to 0) to generate a neighborhood solution uneighbor. This strategy is simple and efficient and can quickly explore topological fine-tuning schemes.
  • Multi-switch combination flipping: Select 2–3 switches with a strong correlation and flip their states simultaneously to generate a more breakthrough neighborhood solution. This strategy is suitable for scenarios where the topology needs to be adjusted significantly under extreme events, but the combination scale needs to be controlled to prevent the explosion of the solution space.
(3)
Step 3: Solution Evaluation and Selection: First, for the generated neighborhood solution uneighbo, check whether it satisfies the constraints of the upper-level model. If not, directly discard it to reduce invalid calculations. Then, for the neighborhood solutions that pass the constraint screening, call the lower-level partition coordination layer model to calculate the system load curtailment amount under this topology as the evaluation index. Finally, check whether the neighborhood solution is in the tabu list. If it is not in the tabu list and the load curtailment amount is better than the current optimal solution, update it; if it is in the tabu list but the load curtailment amount is significantly better than the historical optimal solution, break the tabu and update.
(4)
Step 4: Tabu List Update and Convergence Judgment: Add the currently selected neighborhood solution to the tabu list. If the length of the tabu list exceeds TabuSize, remove the solution that was added earliest to maintain the size. Set the convergence conditions: no change in the optimal solution for 100 consecutive iterations, or the number of iterations reaching the upper limit of 500. Then, the algorithm terminates and outputs the current optimal switch state combination uopt.
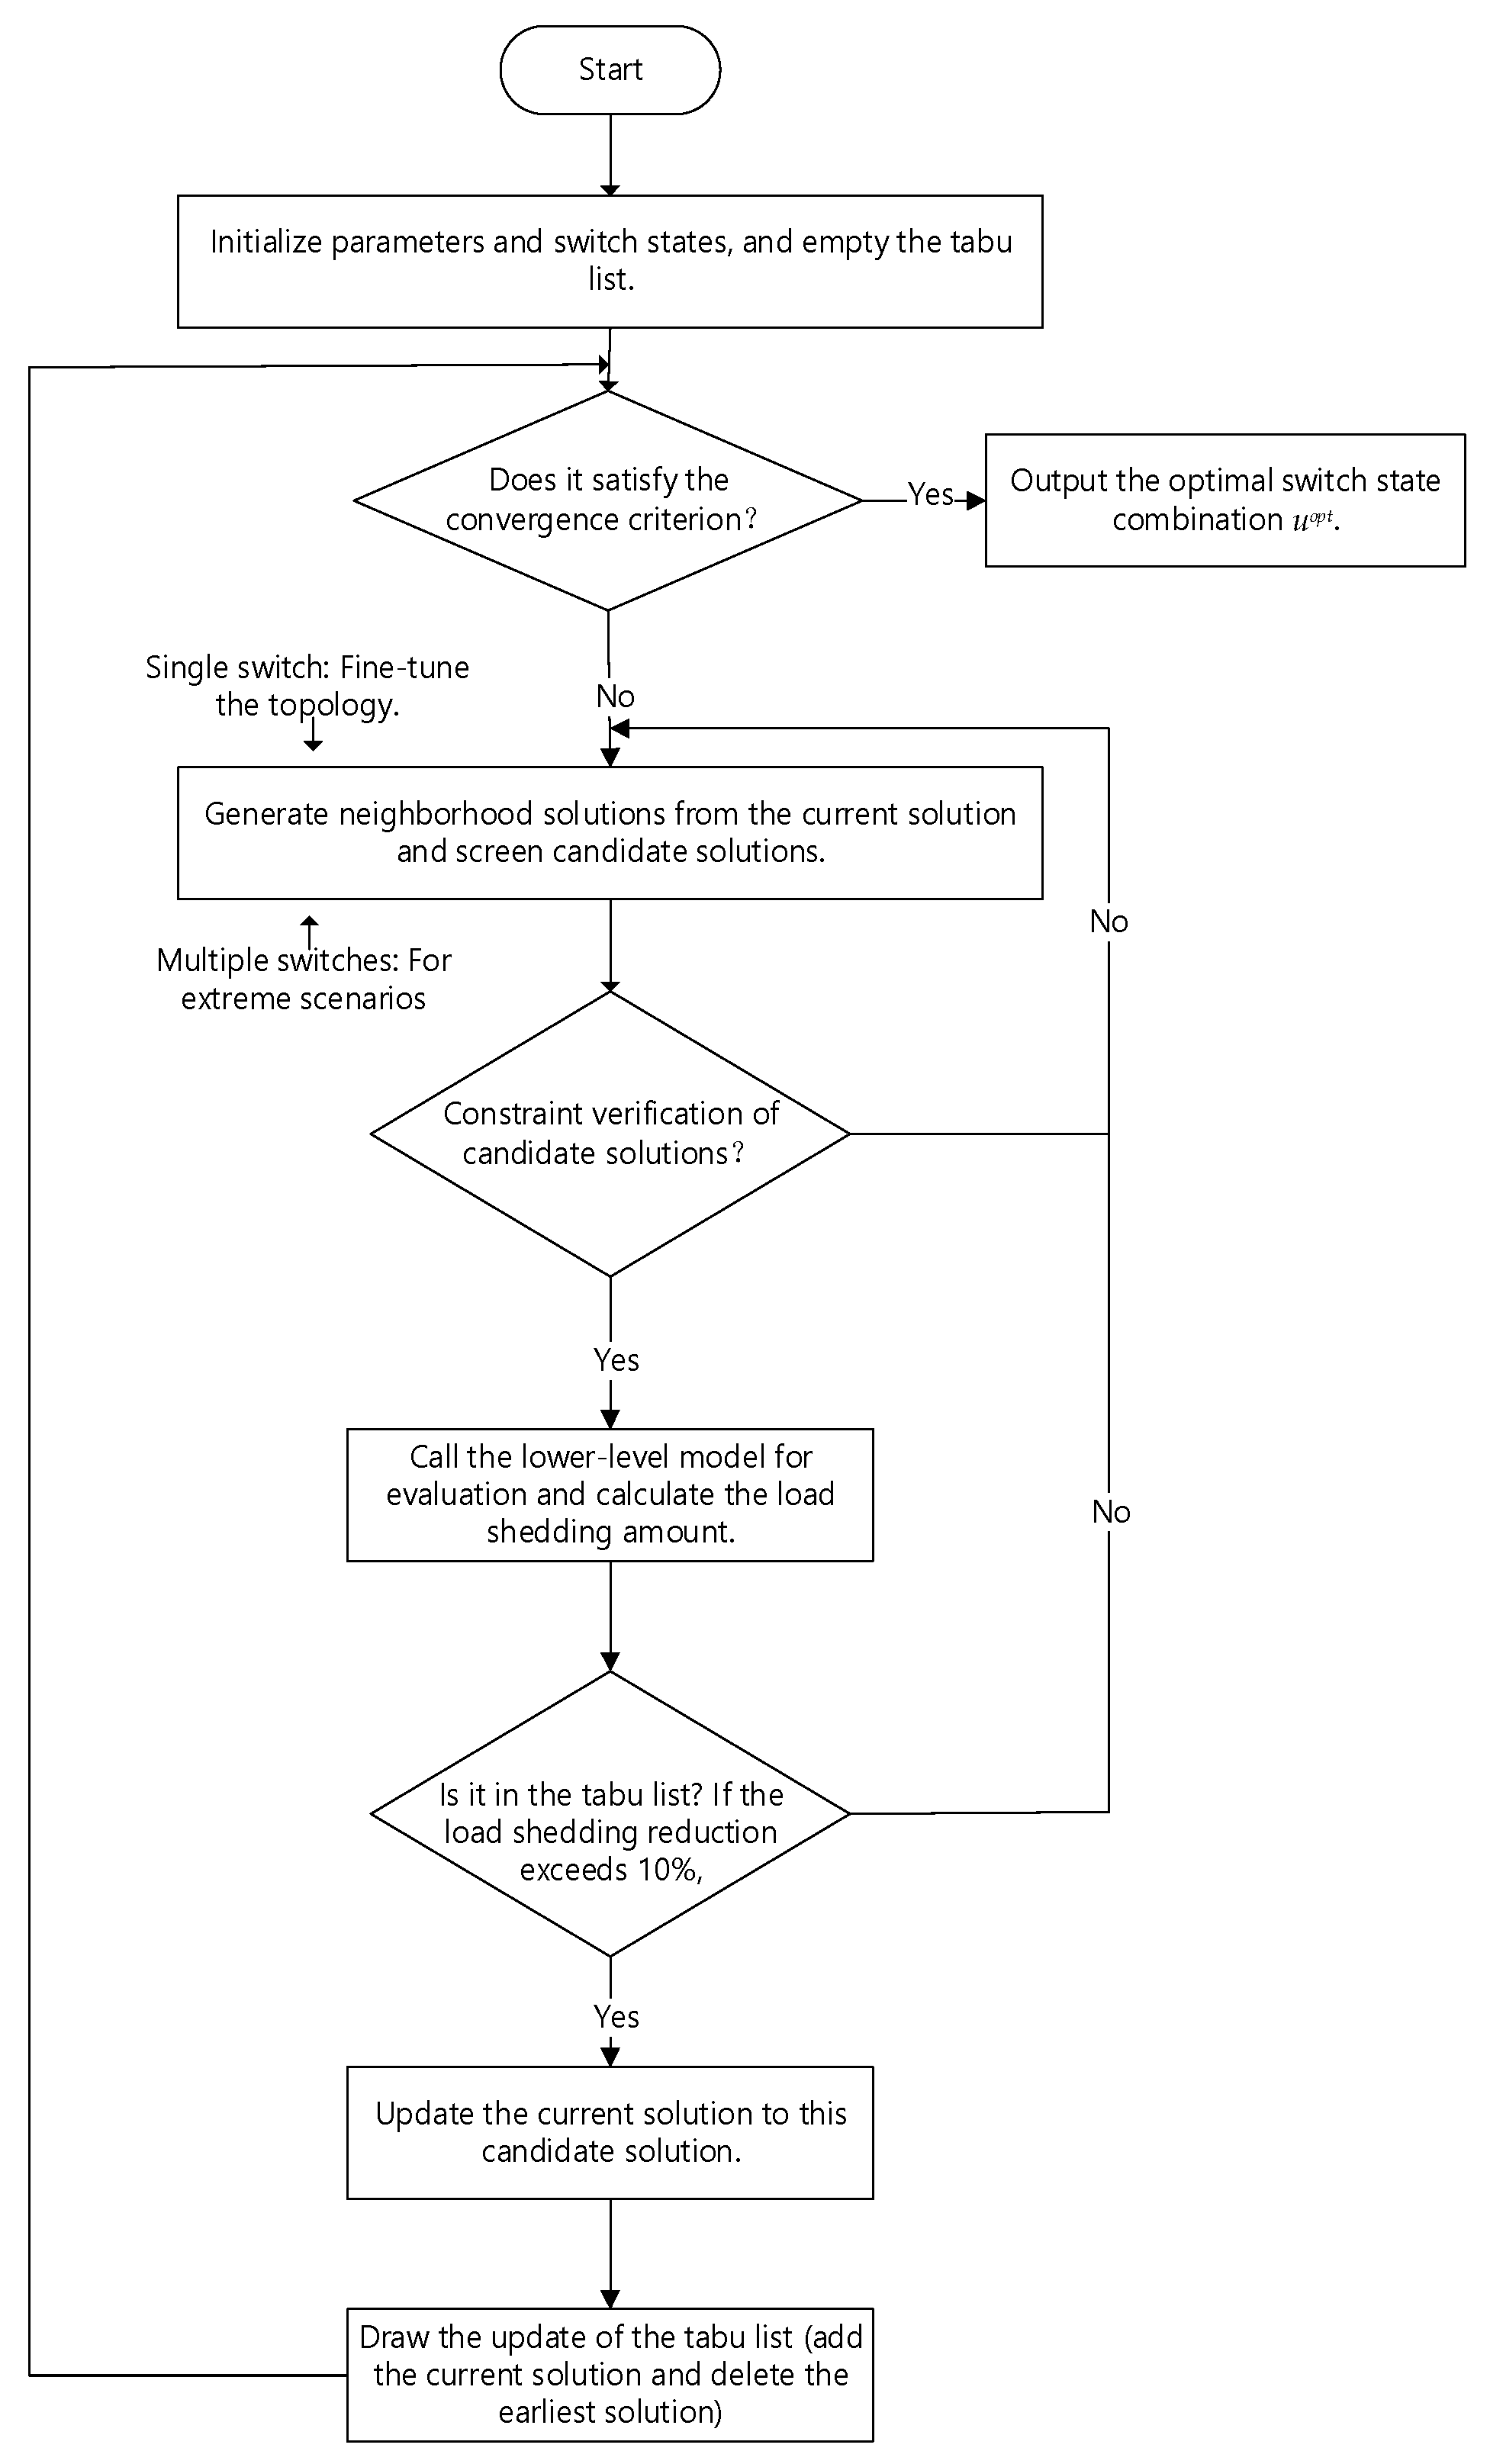
The detailed procedure of the Tabu Search algorithm is illustrated in Figure 3.
Figure 3. Tabu Search flowchart.

4.2. Lower-Level Model Solution Algorithm: Convex Quadratic Programming via Primal-Dual Interior Point Method

All decision variables of the lower-level partition coordination and optimization model are continuous variables. Its constraint conditions form a linear feasible region, while the objective function exhibits a quadratic form due to the inclusion of the quadratic penalty term of the ADMM coordination term. Together, these define a standard convex quadratic programming problem. Given the convex nature of this problem, its local optimal solution is the global optimal solution, which provides a theoretical basis for an efficient and reliable solution. This section aims to elaborate on the efficient numerical solution algorithm suitable for this model.

4.2.1. Algorithm Principle and Adaptability Analysis

The primal-dual interior point method is the preferred algorithm for solving such large-scale convex quadratic programming problems. Its core principle lies in introducing a barrier parameter to convert inequality constraints into a logarithmic barrier function, which is then integrated into the objective function. Subsequently, the Newton method is applied to iteratively solve a series of modified Karush–Kuhn–Tucker (KKT) optimality conditions. This algorithm features polynomial time complexity, strong convergence, and high numerical stability, making it highly suitable for addressing partitioned collaborative optimization problems that require a rapid response under extreme events.

4.2.2. Algorithm Flow Design

Based on the primal-dual interior point method, the solution process of the lower-level model is described as follows:
(1)
Step 1, Model Standardization:
  • Integrate all continuous decision variables, including unit output power Pg, energy storage power Pstorage, load curtailment Pcut, and tie-line mutual power zm, and construct the following decision variable vector:
x = P g , P storage , P cut , z m T
2.
Based on the objective function, extract and construct the sparse Hessian matrix H and vector f so that the objective function can be expressed as follows:
min 1 2 x T H x + f T x
3.
Classify and organize all linear constraints, and convert them into matrices and vectors required for standard QP constraints.
(2)
Step 2: Initialize the iteration points and parameters.
(3)
Step 3, Iterative Solution:
  • Calculate the current duality gap η and the constraint violation degree. If η < ε and the constraints are satisfied, determine the convergence and jump to Step 4.
  • Calculate the Hessian matrix and constraint Jacobian matrix at the current iteration point, and form the following linear system of equations to solve for the search direction (Δx, Δλ, Δλeq):
H + θ 1 A T A e q T A I 0 A e q 0 0 Δ x Δ λ Δ λ e q = r d r p r c
3
Calculate the primal step size, αp, and the dual step size, αd, respectively, through backtracking line search to ensure that all iteration points always remain inside their feasible regions (s, λ > 0).
4
Update the iteration points:
x k + 1 = x k + α p Δ x λ k + 1 = λ k + α d Δ λ s k + 1 = s k + α d Δ s
Update the barrier parameter as μk+1 = σ·η/(2nineq), increment the iteration count to k = k + 1, and return to Step 1.
(4)
Step 4, Result Output:
After the algorithm converges, output the optimal decision variable x*, that is, the optimal output of each unit in the partition, the optimal charging and discharging strategy of energy storage devices, the optimal curtailment of non-critical loads, and the optimal mutual assistance power of tie-lines. Feed back these results and the partition net power deficit ΔPk to the upper-layer model, and use zm* for the global consistency update of ADMM at the same time.

4.3. Solution Process of Upper–Lower-Layer Interaction and Inter-Interval Coordination

The collaboration between the upper and lower layers is the core of achieving global optimization. This process follows a nested loop structure: the outer loop is the upper-layer Tabu Search for topology optimization, while the inner loop is the lower-layer Alternating Direction Method of Multipliers algorithm for cross-partition power coordination.

4.3.1. Bi-Level Model Solution Framework

The interaction between the upper and lower layers follows the closed-loop logic of “upper-layer decision-making, lower-layer feedback, and upper-layer adjustment”.
(1)
Upper-Layer Initialization and Decision-Making: The upper-layer model, based on the post-fault system state, adopts the Tabu Search algorithm to generate a new switch state combination uTS. This decision defines the network topology and transmits it to the lower-layer model.
(2)
Lower-Layer Partition Coordination via ADMM: For the fixed topology uTS provided by the upper layer, the lower-layer model solves the optimal power flow problem. Considering that partitions are only coupled through tie-line power zm, the Alternating Direction Method of Multipliers is adopted to decompose this problem and solve it in a parallel and coordinated manner. This process forms the inner loop:
  • Step 1, Local Sub-Problem Solving: Each partition k solves its own local optimization problem in parallel, given the latest global consensus variables ym and multipliers λm.
  • Step 2, Global Variable Update: A central coordinator collects the local tie-line power results z m k from all connected partitions and updates the global consensus variables ym and Lagrange multipliers λm.
  • Step 3, Inner Loop Convergence Check: Calculate the primal and dual residuals of the Alternating Direction Method of Multipliers. If both residuals are below the predefined tolerance ε, the inner loop converges; otherwise, return to Step 1.
(3)
Feedback and Upper-Layer Evaluation: After the inner ADMM loop converges, the lower layer feeds back the overall load shedding amount and the power deficit/surplus ΔPk of each partition to the upper layer.
(4)
Upper-Layer Adjustment: The upper-layer TS algorithm receives the feedback. The load shedding amount is used to evaluate the fitness of the current topology uTS. Based on this fitness and the tabu rules, the TS algorithm generates a new neighborhood solution, and the process repeats from (1). The outer loop terminates when the TS convergence criteria are met.

4.3.2. Implementation of the ADMM Coordination Algorithm

The ADMM algorithm is implemented within the lower layer to coordinate the tie-line power zm between adjacent partitions i and j. Its steps for a fixed upper-layer topology are as follows:
(1)
Step 1, Initialization: Set the iteration counter. Initialize the global consensus variables y m 0 for all tie-lines, the Lagrange multipliers λ m 0 , and the penalty parameter ρ > 0. Broadcast these to all partitions.
(2)
Step 2: Solve for each partition k in parallel. Each partition k solves its local QP problem, whose objective function is as follows:
min i Ω k γ i P c u t   , i + m M k λ m 1 z m + ρ 2 z m y m 1 2
subject to its local constraints (16)–(20). The solution yields the optimal local tie-line power z m k + 1 for this iteration.
(3)
Step 3, Global Coordination:
1.
Global Consensus Update: The coordinator gathers z m i , l + 1 and z m j , l + 1 from the two partitions connected by tie-line m. The new global consensus value is their average:
y m l + 1 = z m i , l + 1 + z m j , l + 1 2
This step ensures the power flow on the tie-line is consistent for both sides.
2.
Lagrange Multiplier Update: The multiplier for each tie-line is updated based on the deviation between the local value and the global consensus:
λ m l + 1 = λ m l + ρ z m k , l + 1 y m l + 1
This update penalizes discrepancies between local decisions and the global agreement, driving the system towards consensus.
(4)
Step 4, Convergence Check: Calculate the primal residual rl+1 and the dual residual sl+1:
r l + 1 = z l + 1 y l + 1 2 s l + 1 = ρ y l + 1 y l 2
If rl+1 < εpri and sl+1 < εdual, the inner ADMM loop converges. The coordinated power flow solution is found. Otherwise, set l = l + 1 and return to Step 2.
(5)
Step 5, Termination and Feedback: Upon convergence, the final values of Pcut,i for all loads within each partition are summed to calculate the total load shedding for the current topology. This value, along with the partition power imbalances ΔPk, is fed back to the upper-layer TS algorithm for evaluation and subsequent iteration.

5. Practical System Examples and Result Analysis

5.1. Overview of Actual System Instance

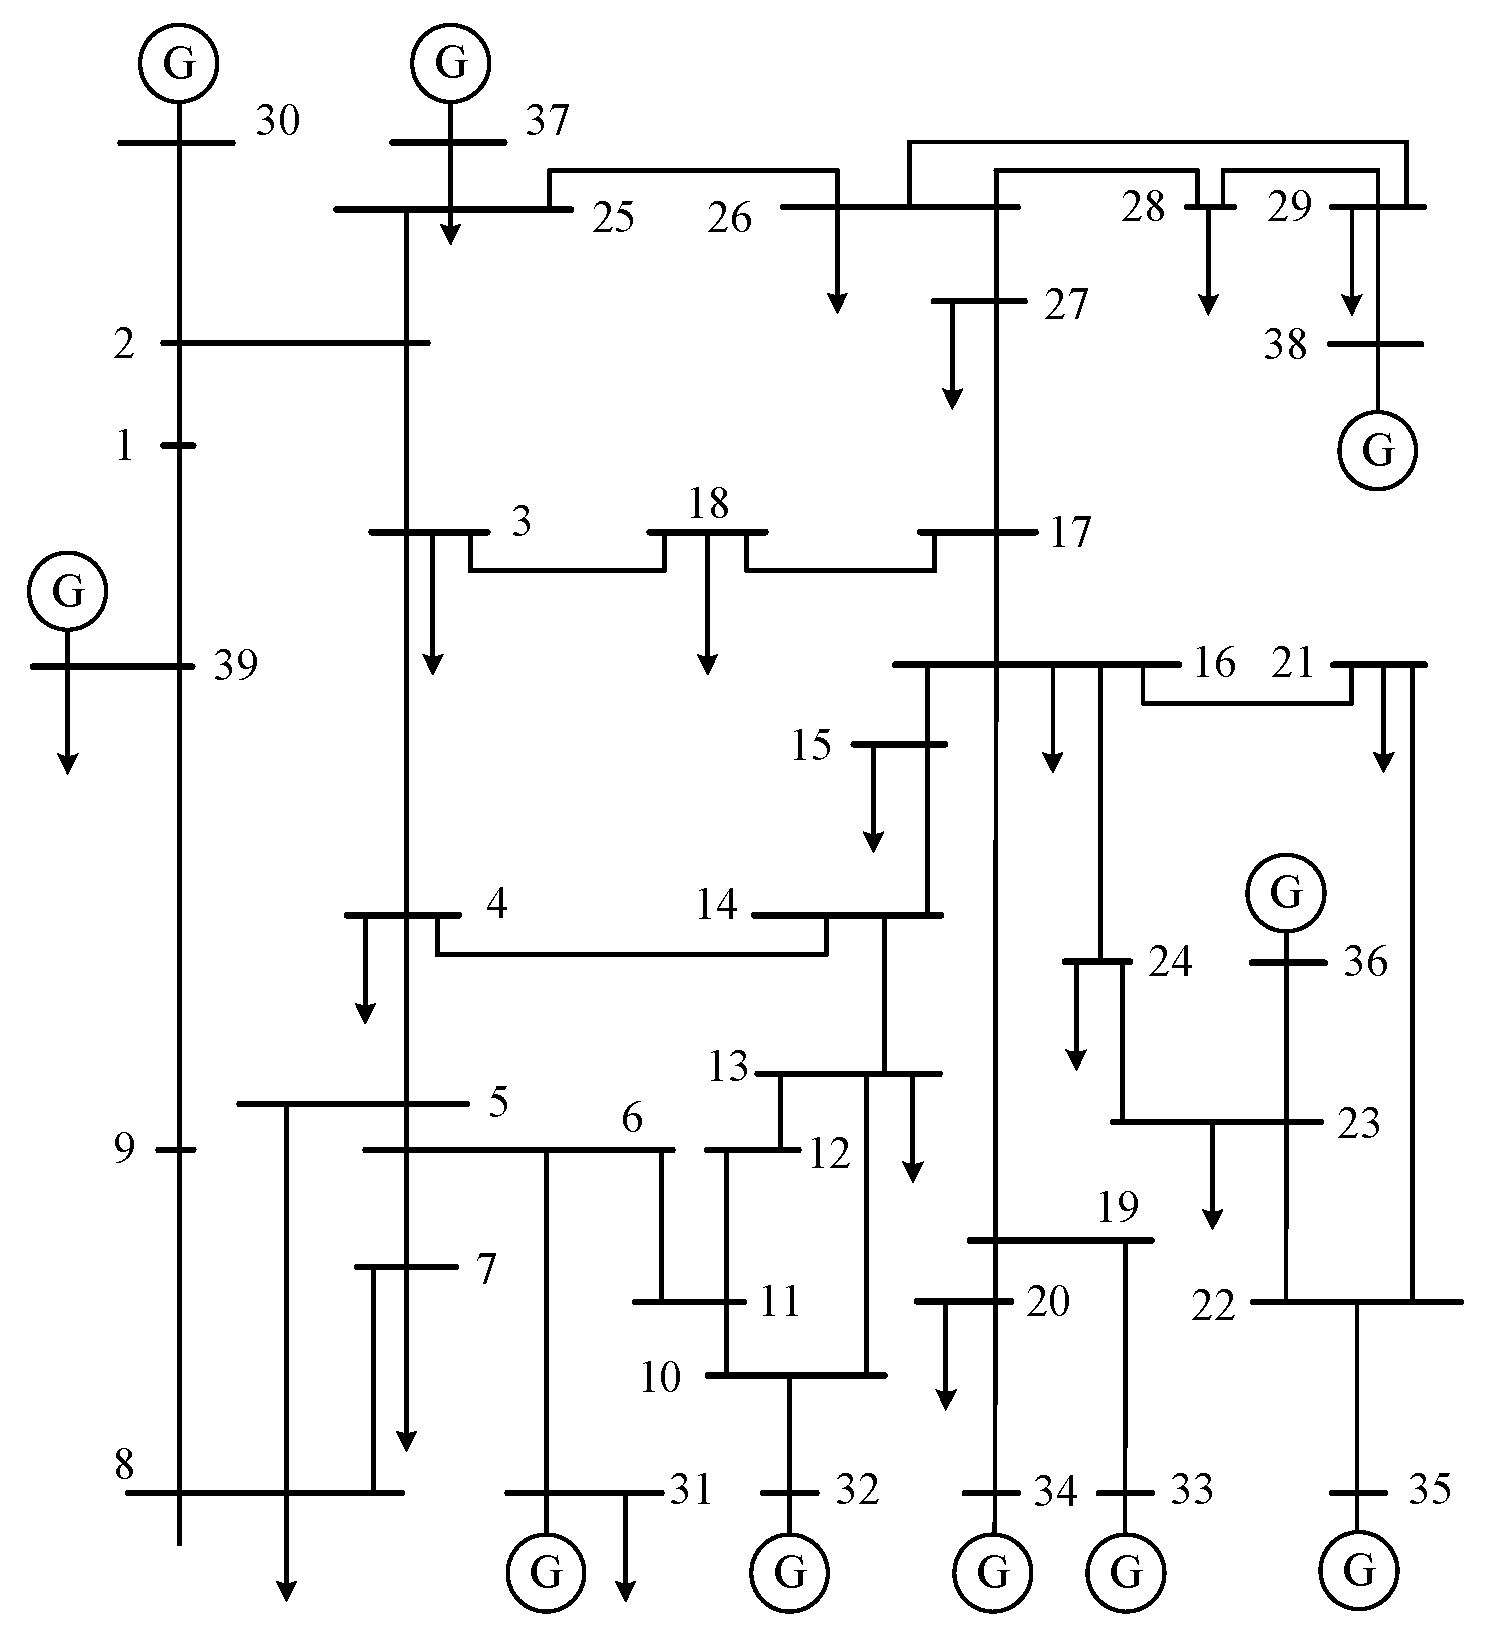
Taking the IEEE 39-bus system as the research object, this paper simulates extreme operating conditions and conducts a simulation study on the partitioning and operational characteristics of the transmission network. The grid topology of this system is shown in Figure 4, which serves as the basis for analysis under extreme scenarios. Subsequently, based on this topology, the aforementioned partitioning algorithm will be applied to explore the impact of extreme events on grid partitioning and operation.
Figure 4. Topology diagram of IEEE 39-bus system.
As a classic transmission network test model, the IEEE 39-bus system has a clear topological structure and typical operating characteristics, providing basic grid support for this research. On this basis, targeted component configuration adjustments and fault simulations are carried out to meet the analysis requirements of extreme scenarios.
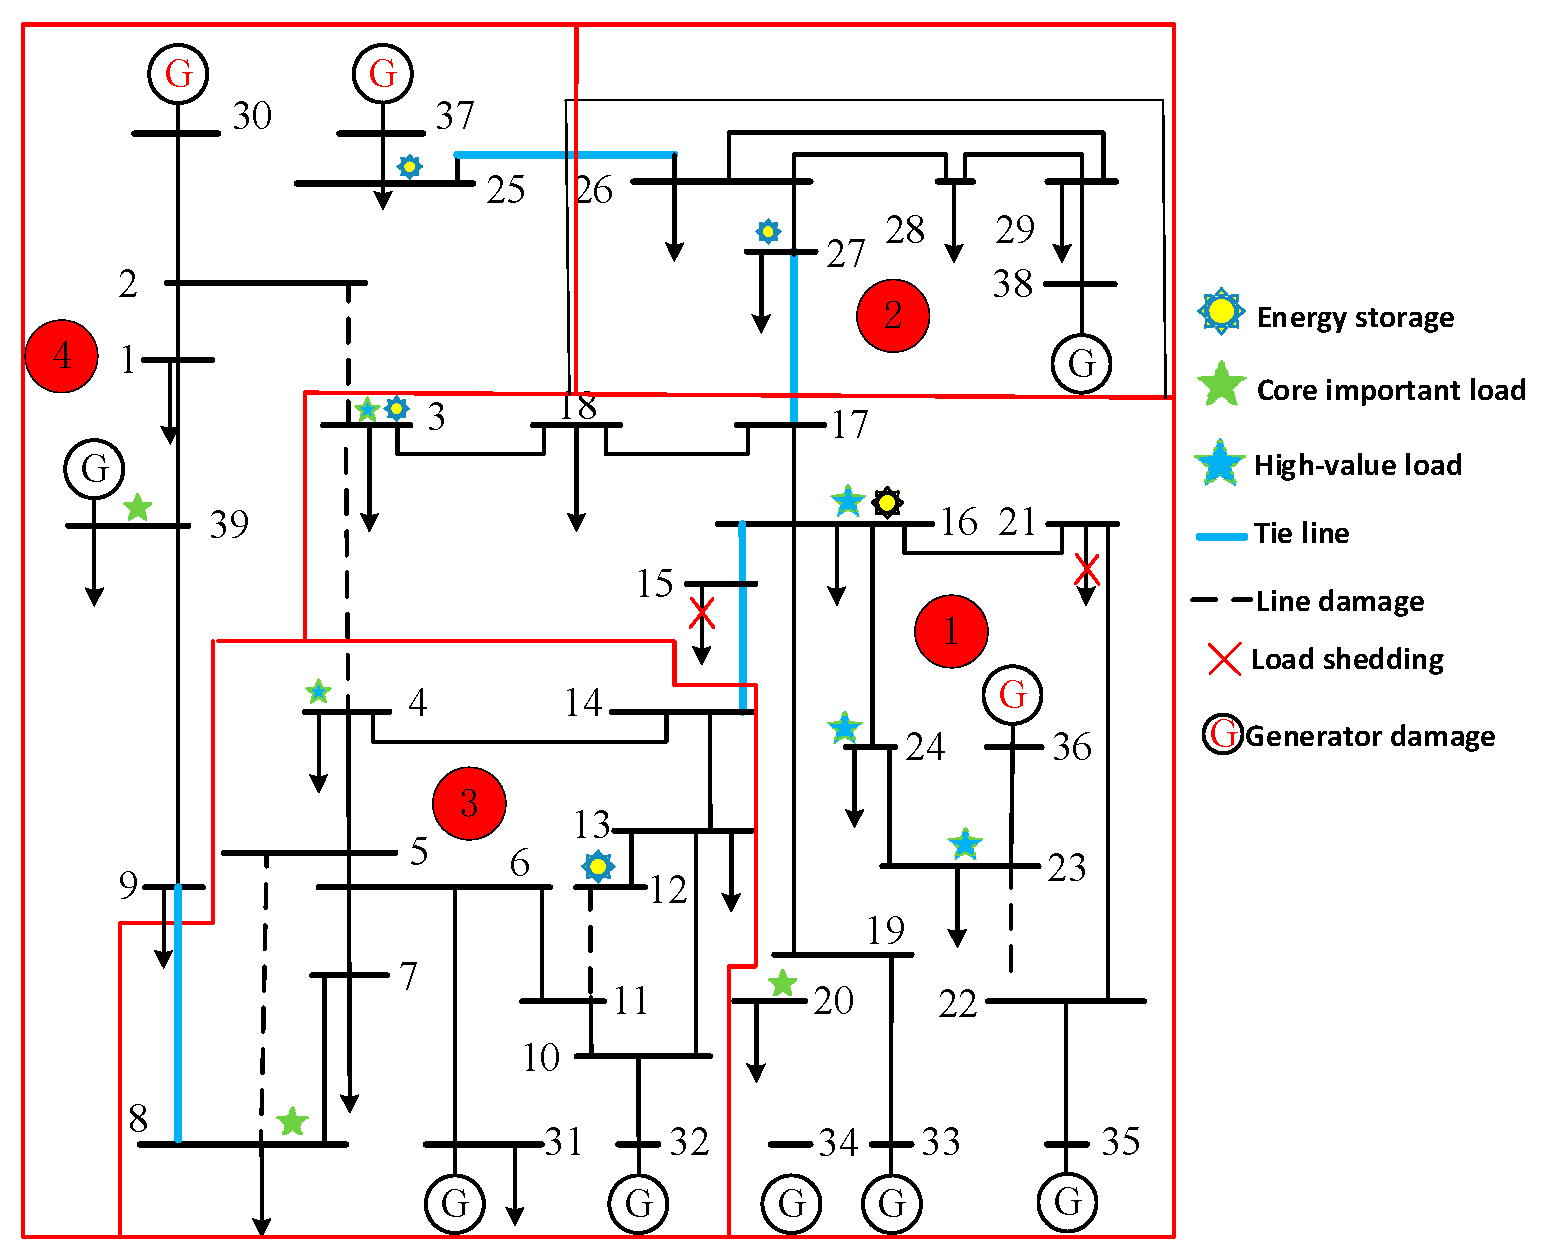
To enhance the system’s resilience to extreme events, energy storage devices are configured at nodes 3, 12, 16, 25, and 27, and the maximum output power of a single energy storage unit is set to 200 MW. The layout of these energy storage nodes aims to utilize their fast charging and discharging characteristics to smooth out power fluctuations in extreme scenarios, providing flexible adjustment means for power balance regulation within partitions and guarantee of important loads. Especially when generators or lines are damaged, they can serve as backup power sources to supplement power gaps.
Simulate the scenario where extreme events cause line damage, and select five lines as the damaged objects, namely lines 2–3, 3–4, 5–8, 12–11, and 22–23. The damage of these lines will change the original power flow distribution of the power grid, increase the transmission pressure of the remaining lines, and may cause power transmission blockage within or between partitions, testing the adaptability of the partition strategy to line faults and the power grid resilience.
Simultaneously simulate generator faults, and set that the generators at nodes 30, 36, and 37 are damaged. As the main power sources of the system, the damage of generators will directly lead to a decline in the regional power generation capacity and cause a power deficit. In extreme scenarios, it is necessary to rely on means such as energy storage and inter-partition mutual assistance to maintain the system power balance and ensure the power supply for important loads.

5.2. Comparison of Partitioning Results of Models with Different Weights

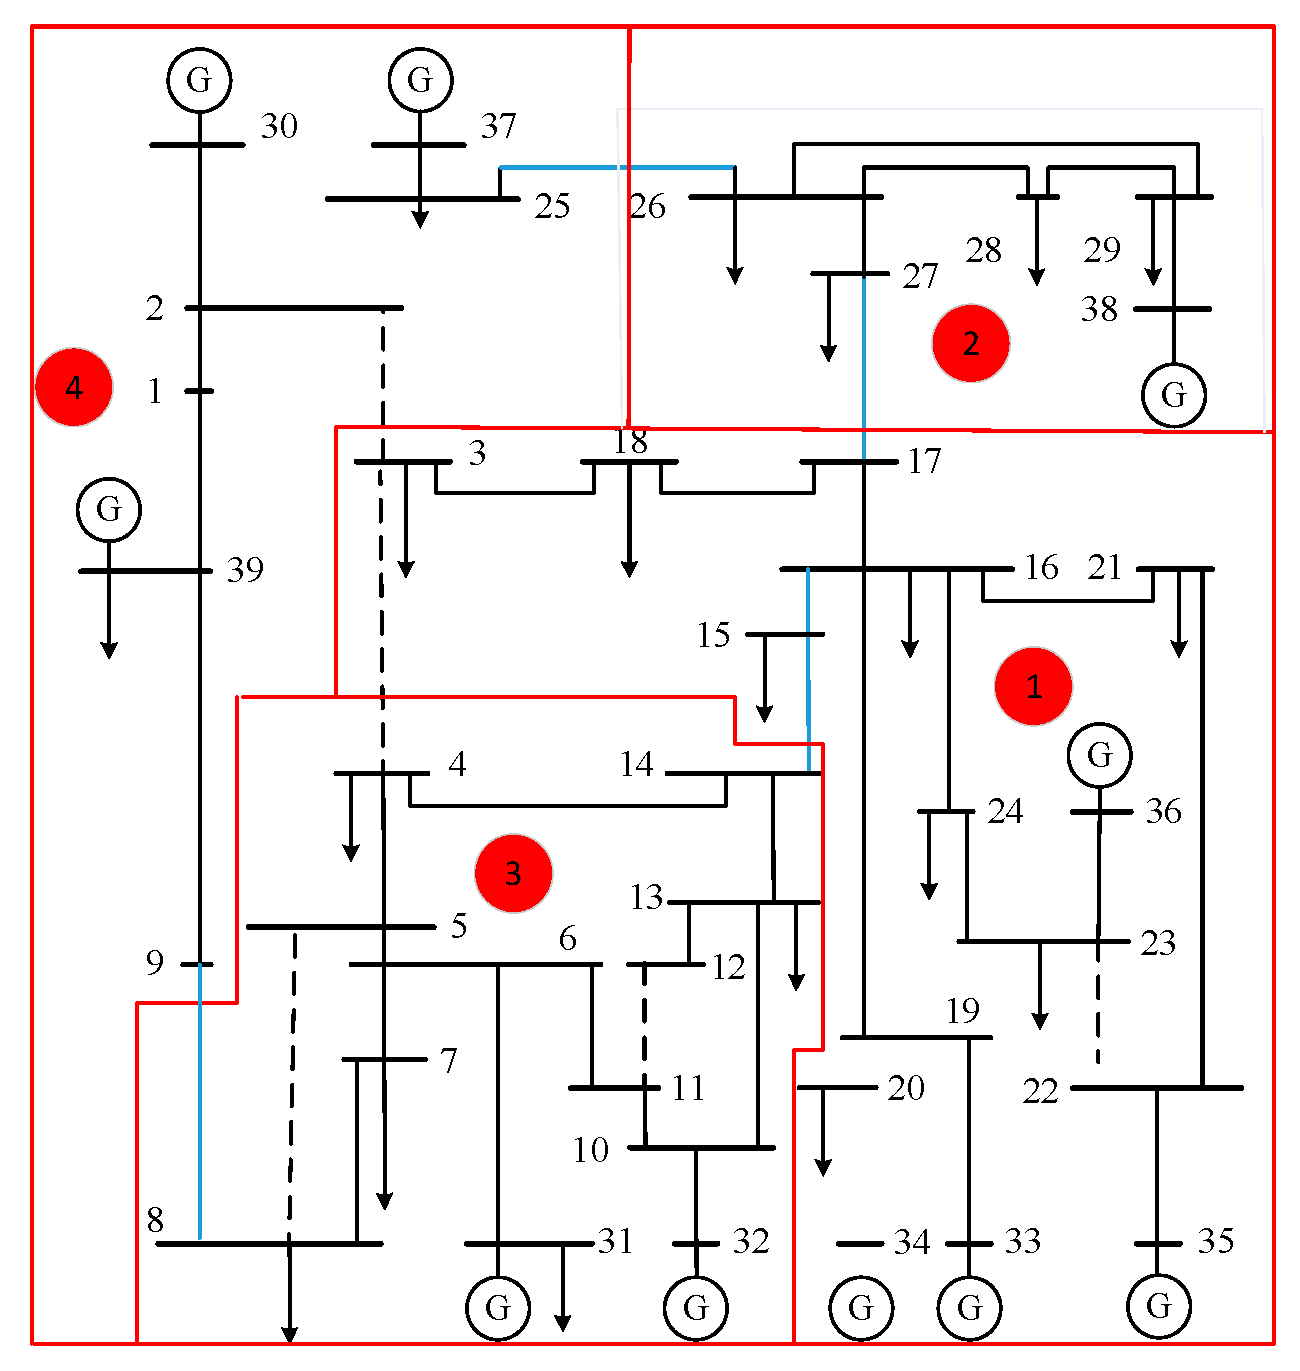
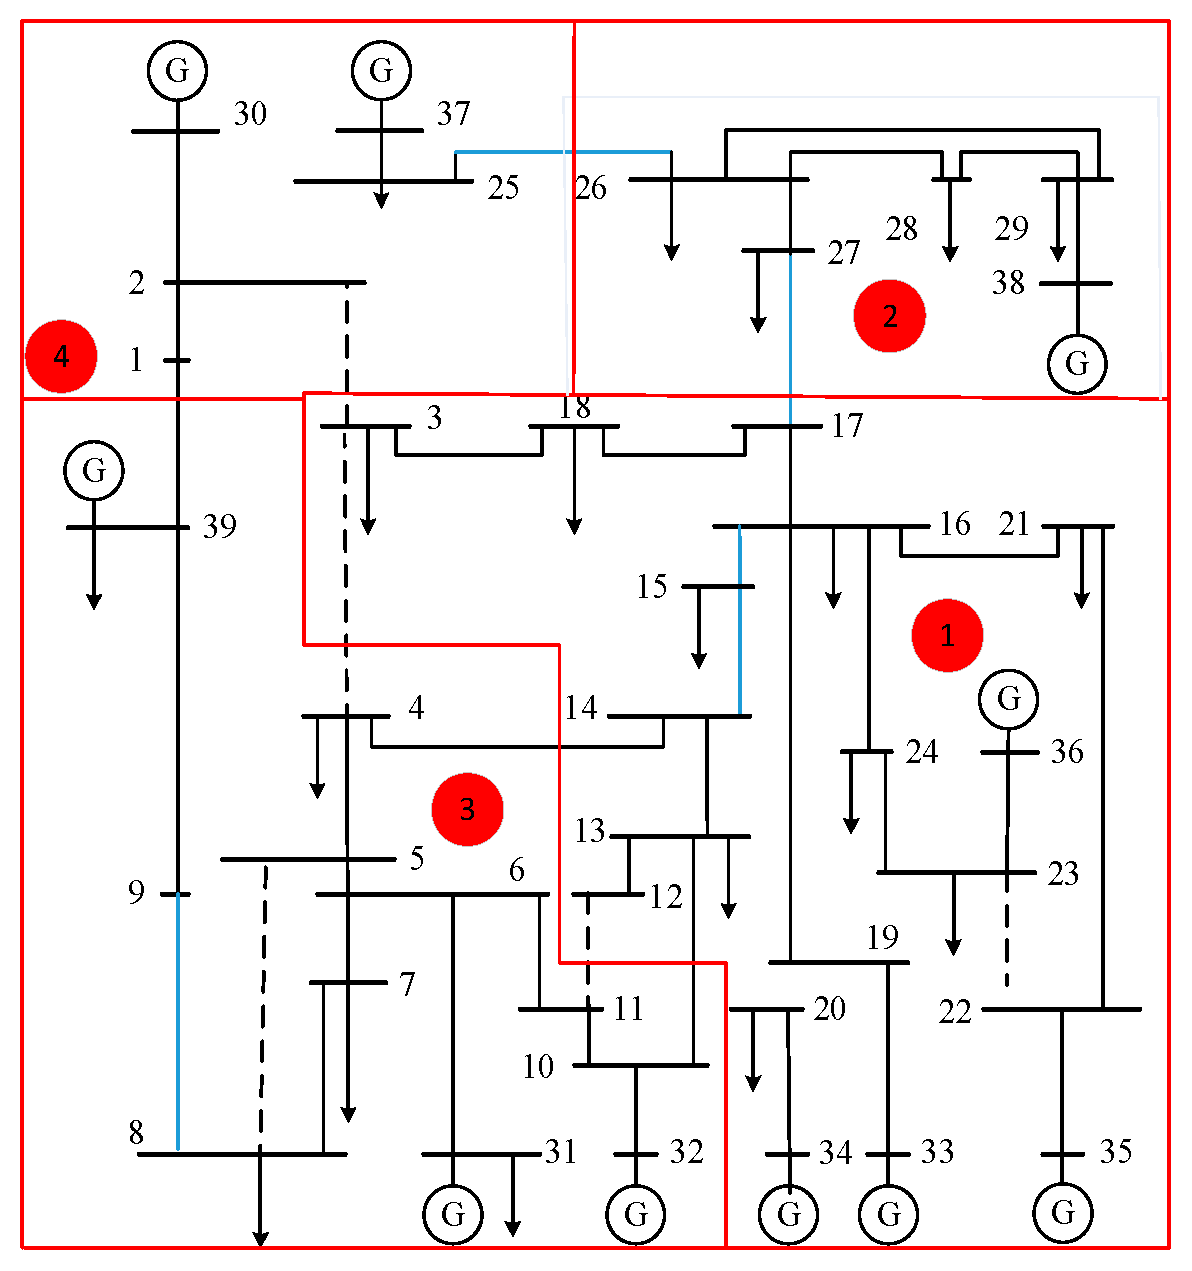
Based on the active–reactive power-coupling matrix, the Fast Newman algorithm is used to obtain the partitioning results of the IEEE 39-bus system under extreme events, as shown in Figure 5.
Figure 5. Power grid partitioning results of the IEEE 39-bus system.
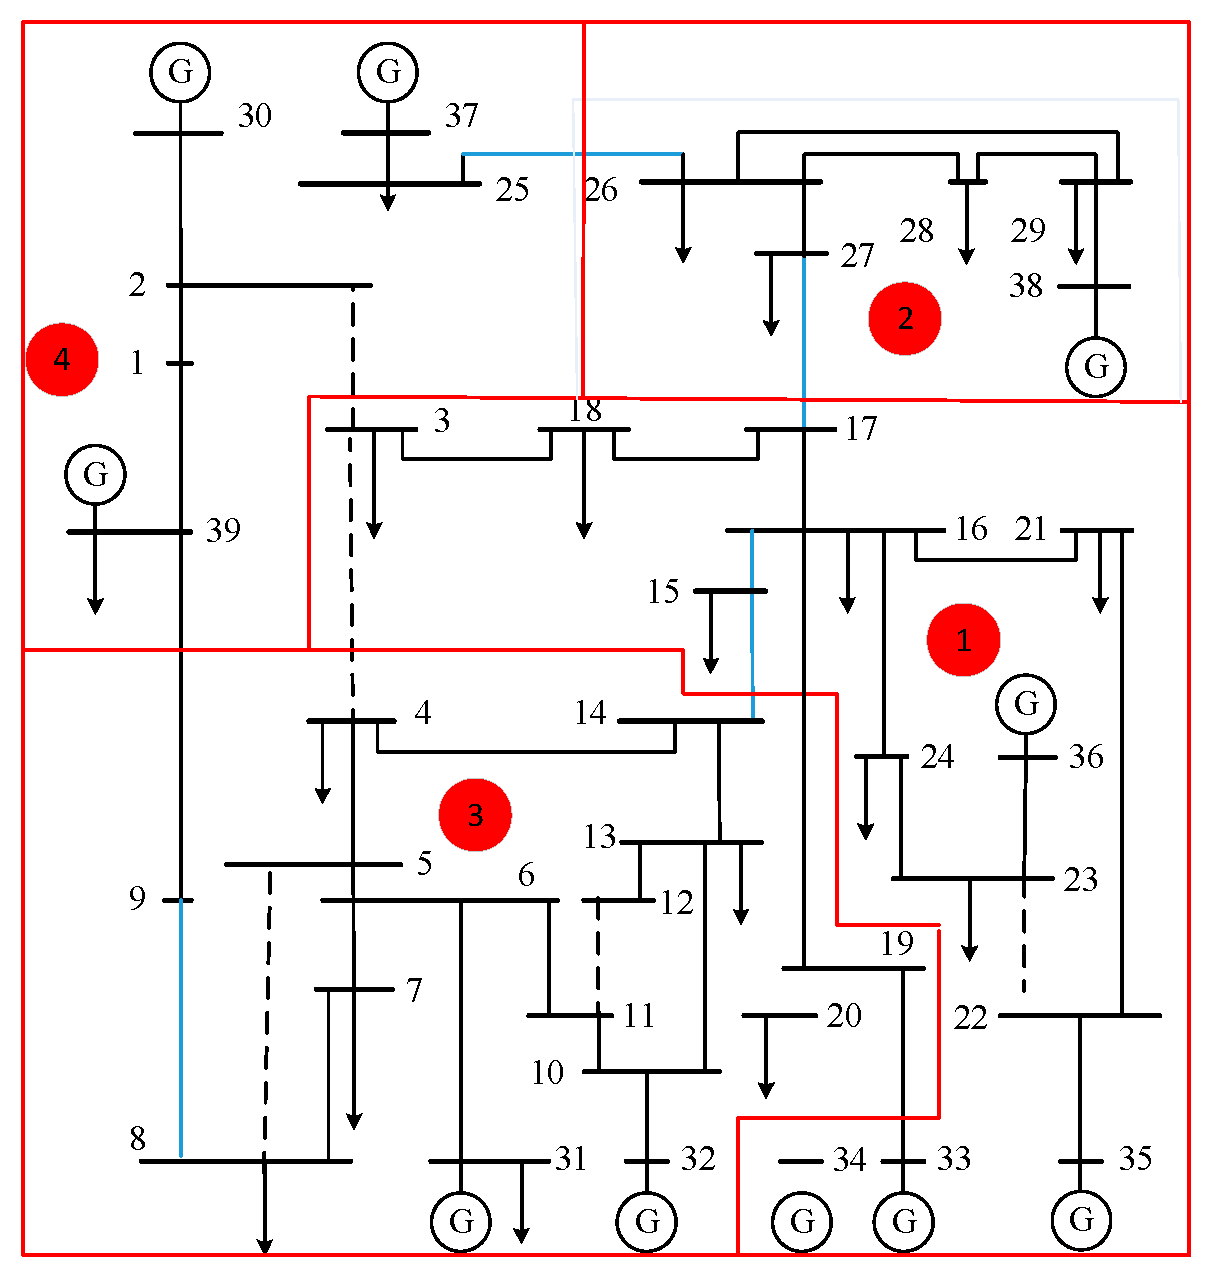
To explore the impact of different weight settings on partitioning results and verify the effectiveness of the active–reactive power-coupling weight index, two power grid complex network models with different weighting methods are set as control groups. The partitioning results of Model 1 and Model 2 are shown in Figure 6 and Figure 7, respectively.
Figure 6. Grid partitioning results of Model 1.
Figure 7. Grid partitioning results of Model 2.
(1)
Model 1: Unweighted network, where the line weights are uniformly set to 1.
(2)
Model 2: Similarity-weighted network, where the reciprocal of the line reactance value is used as the line weight.
(3)
Model 3: The complex network-coupling weighted model constructed in this paper.

5.2.1. Evaluation of Structural Indicators

To quantitatively evaluate the quality of community structures in the partitioning results of different models, this paper calculates the modularity of the partitioning schemes for the three models, with the results shown in Table 1. As a core indicator for measuring community division quality in complex networks, the closer the modularity is to 1, the tighter the connections within communities, the sparser the connections between communities, and the clearer the division.
Table 1. Comparison of modularity among the three models.
The results show that the modularity of all three models exceeds the 0.3 threshold, confirming the reliability and effectiveness of their community structures, which successfully capture the potential community characteristics in the network. Among them, Model 3 performs best, with a modularity of 0.6554, far exceeding the other two models and leading in similar studies. It shows an increase of approximately 23% and 33% compared to Model 1 and Model 2, respectively, indicating a more accurate division, clearer community boundaries, and more compact structures, providing a more reliable basis for subsequent analysis and applications.

5.2.2. Functional Indicator Evaluation

Table 2 presents the power flow factor data at the boundaries of each sub-region in the partitioning results of the three models. Analysis of this table reveals that the boundary power flow factor of Model 3 is 0.1321, a value significantly lower than those of Model 1 and Model 2. This represents a 58% reduction compared to Model 1 and a 48% reduction compared to Model 2.
Table 2. Comparison of boundary power flow factors.
This data disparity highlights the distinctive advantage of Model 3 in community partitioning: a lower boundary power flow factor indicates a weaker power flow interaction intensity between sub-regions, while power flow exchanges within sub-regions are more concentrated. This characteristic suggests that the power distribution within each sub-region partitioned by Model 3 is more balanced, with energy flow primarily confined within sub-regions, reducing the interference of cross-regional power flows. This further confirms the superiority of its community structure partitioning in enhancing sub-region independence and internal coordination.

5.3. Case Analysis of the Bi-Level Optimization Model

In terms of fault scenario setting, this paper simulates a severe situation where three generators are damaged under extreme disasters, involving nodes 30, 36, and 37. This results in a total system capacity loss of up to 1725 MW, accounting for 25.3% of the original system’s installed capacity. This fault setting not only conforms to the characteristics of real disasters damaging power facilities but also can fully stimulate the optimization potential of system recovery strategies. Based on the electrical distance theory, the system is divided into four partition topologies. This partitioning method is based on the tightness of electrical connections between nodes in the power system, ensuring that the electrical characteristics within each partition are relatively independent, thus laying a foundation for subsequent partition control and coordinated recovery.

5.3.1. In-Depth Analysis of Partition Power Balance

After an extreme event, based on the system state and optimization objectives, the model makes intelligent decisions for each sub-area: close Tie-Line 1 (8–9) and Tie-Line 2 (14–15), while shutting down the remaining two tie-lines. Within the sub-areas, the loads at nodes 15 and 21 are cut off by circuit breakers, and the reconstructed network topology is shown in Figure 8. By accurately constructing power mutual-assistance channels, an effective power complementarity among sub-areas is achieved, providing key support for the system to resume stable operation. In the initial state after the fault occurs, the system presents a significant asymmetric power shortage mode.
Figure 8. Network topology after network reconfiguration.
The changes and transmitted power of the tie-lines before and after reconfiguration are shown in Table 3:
Table 3. Status of tie-lines before and after reconfiguration.
The simulation results show that the model successfully ensures the continuous power supply for critical loads across the entire system, while 374.9 MW of non-critical loads are curtailed, accounting for 16.7% of the total non-critical load capacity. Compared with traditional black-start schemes, under the premise of ensuring power supply for critical loads, this model significantly reduces the curtailment volume of non-critical loads, demonstrating a stronger load guarantee capability and more efficient resource optimal allocation ability. Table 4 details the comparison of optimization results for each sub-area.
Table 4. Comparison table of optimization results for each partition.

5.3.2. Cross-Region Power Mutual Assistance Mechanism

During the optimal operation of the system, Sub-area 3, acting as a power surplus area, transmits 182.1 MW of power to Sub-area 4 (a power deficit area) to achieve power balance in Sub-area 4. It also exports 117.24 MW of power to Sub-area 1 (another power deficit area), with this power output accounting for 20% of the tie-line capacity. Through cross-area power support, the power deficit of Sub-area 1 has been reduced from the initial 492.1 MW to 374.86 MW, representing a deficit reduction ratio of 24%. Specifically, before receiving power support, Sub-area 1 faced a severe power shortage, which would have led to massive load interruptions without effective measures. After Sub-area 3 started providing power support, key indicators of Sub-area 1 such as system frequency and voltage gradually recovered to stability. By establishing a quantitative relationship model between power transmission and load curtailment, it is calculated that this measure effectively avoided an additional 117.24 MW of load curtailment in Sub-area 1, fully demonstrating the significant advantages of the inter-sub-area collaboration mechanism in enhancing system economy and reliability.

5.3.3. Comparative Analysis with the Benchmark Scheme

To quantitatively verify the superiority of the proposed bi-level optimization model, it is compared with the non-partitioned centralized dispatch model from multiple dimensions. The specific results are shown in the following Table 5:
Table 5. Performance comparison between the bi-level optimization model and the non-partitioned centralized dispatch model.
As can be seen from the comparison results, the bi-level optimization model achieves significant breakthroughs in key performance indicators: the reduction in the amount of load curtailment directly reduces economic losses and social impacts. The core lies in that the model can accurately identify load priorities through dynamic partitioning and fill the deficit with the help of cross-regional power support; the interruption rate of critical loads drops to 0%, reflecting the model’s ultimate guarantee capability for the power supply reliability of key users. This benefits from the collaborative guarantee system of “critical loads–power sources–tie-lines” built after partitioning. The above comparison fully proves that the proposed model has a significantly better effect on improving the grid resilience under extreme events than the traditional schemes.

6. Conclusions

To address the demand for the rapid protection of critical loads in power grids under extreme events, this paper proposes a defense strategy integrating rapid partitioning and bi-level collaborative optimization. Through theoretical construction, algorithm design, and case study verification, the following conclusions are drawn:
(1)
An innovative active–reactive power-coupling partitioning index system is constructed. When a single electrical parameter is used as the weight of the modularity function in power grid partitioning, it can only reflect the local electrical correlation characteristics of the power grid and cannot fully characterize the coupling relationship between active power transmission and reactive voltage support under extreme events, resulting in the poor adaptability of partitioning results to the state of the transmission grid after extreme events. To address this, this paper constructs a comprehensive edge weight matrix by integrating active power flow and reactive voltage sensitivity and realizes rapid power grid partitioning in combination with the Fast Newman algorithm. This coupling index not only covers the core characteristics of active power flow in the power grid but also incorporates the key impact of reactive power regulation on node voltage, enabling it to more comprehensively and accurately capture the overall electrical correlation laws of the power grid under extreme scenarios. A case study verification shows that the modularity of Model 3 reaches 0.6554, which is 23% and 33% higher than that of the unweighted network Model 1 and the weighted network Model 2 based only on reciprocal reactance, respectively; the boundary power flow factor is as low as 0.1321, which is 58% and 48% lower than that of Model 1 and Model 2, respectively. These results fully prove that this partitioning method can more accurately identify sub-regions with close electrical coupling, effectively make up for the one-sidedness of traditional single-index partitioning, and lay a structural foundation that is more in line with the dynamic characteristics of the power grid for subsequent power mutual assistance.
(2)
A tightly coupled bi-level optimization model and a collaborative solution mechanism are proposed. The upper layer optimizes the states of inter-partition tie-line switches and intra-partition circuit breaker switches using the Tabu Search algorithm, while the lower layer optimizes the local partition’s generator output and energy storage output via the primal-dual interior point method, ensuring the continuous power supply of critical loads under extreme events. Simulations on the IEEE 39-bus system show that, under the extreme scenario where three generators are damaged, the model makes decisions on tie-line switches and circuit breakers, closes key tie-lines to construct mutual assistance channels, and enables Partition 3 to supply 117.24 MW and 182.1 MW of power to Partition 1 and Partition 4, respectively. This reduces the curtailment of non-critical loads to 374.9 MW, a 54% decrease compared with the traditional centralized dispatch model.
(3)
A zero-interruption guarantee for critical loads has been achieved. By setting the guarantee of critical loads as a hard constraint and integrating the defense logic of “mutual assistance as the primary measure and load curtailment as the supplementary measure”, a 100% power supply for critical loads is realized under extreme fault scenarios. The comparative analysis shows that, through partition autonomy and cross-partition collaboration, the model can not only utilize the flexible adjustment capability of energy storage to achieve zero load curtailment in Partition 2 by adjusting generator output, but also limit the scope of impact through fault isolation—only part of non-critical loads are curtailed in Partition 4. This characteristic significantly enhances the resilience of the power grid under extreme events.
In conclusion, the partitioning reconfiguration and mutual assistance method proposed in this paper provides a new technical path for the protection of critical loads in power grids under extreme events. Its dynamic adaptability and collaborative optimization characteristics can offer theoretical references and engineering insights for enhancing the resilience of new-type power systems. Future research can be further extended to complex systems with a high proportion of new energy sources, and robustness optimization for multiple extreme scenarios can be considered. Specifically, subsequent work will include a validation for larger-scale test systems (e.g., IEEE 118-bus and 300-bus) to demonstrate scalability, and the refinement of equipment models, such as incorporating charging/discharging efficiencies for energy storage, to enhance practical fidelity. Additionally, to bridge the gap between theoretical models and field deployment, subsequent studies will prioritize addressing practical implementation issues such as communication latency, data uncertainty, and the development of real-time computational strategies.

Author Contributions

G.S.: Responsible for resources, formal analysis, program compilation, and writing—original draft. C.X.: Responsible for writing—review and editing. W.M.: Responsible for methodology and project administration. N.Z.: Responsible for obtaining the experimental data. X.W.: Responsible for investigation and resources. F.X.: Responsible for funding acquisition and resources. All authors have read and agreed to the published version of the manuscript.

Funding

This research work was supported by the Science and Technology Project of State Grid Corporation of China Headquarters titled “Research on Full-Cycle Analysis and Emergency Support Technology for Unconventional Events in Large Power Grids” (Topic 2: Research on Emergency Technology for Collaborative Dispatching of Source-Grid-Load Resources to Cope with Strong Impacts of Unconventional Events, Project No.: 5100-202416027A-1-1-ZN).

Data Availability Statement

Data are contained within the article.

Conflicts of Interest

Author Weiwei Miao is employed by State Grid Shandong Electric Power Company. Authors Ning Zhou, Xinyu Wei, and Facai Xing are employed by Electric Power Research Institute of State Grid Shandong Electric Power Company. The remaining authors declare that the research was conducted in the absence of any commercial or financial relationships that could be construed as a potential conflict of interest.

References

  1. Cao, C.; Wang, Z. Thoughts on the Impacts of Extreme Weather on New-Type Power Systems and Countermeasures. South Energy Constr. 2025, 12, 43–57. (In Chinese) [Google Scholar] [CrossRef]
  2. Lu, G.; Deng, J.; Wang, Y.; Cao, J.; Yue, Y. Analysis on the Impact of Extreme Weather on Power Systems and Its Adaptation Strategies. Power Gener. Technol. 2021, 42, 751–764. (In Chinese) [Google Scholar] [CrossRef]
  3. Rong, X. Strengthening Power Grid Planning and Construction to Address the Impact of Extreme Weather on Power Grids. Technol. Innov. Appl. 2016, 218. (In Chinese) [Google Scholar] [CrossRef]
  4. Ye, X.; Hu, H.; Wang, S.; Cheng, X. Real-Time Monitoring and Early Warning Technology for Risks of Typical Power Grid Equipment Under Severe Weather. Energy Environ. Prot. 2022, 44, 248–254. (In Chinese) [Google Scholar] [CrossRef]
  5. Liu, L. Issues of Large-Scale Power Grids in Responding to Space Hazardous Weather. Power Syst. Technol. 2010, 34, 1–5. (In Chinese) [Google Scholar] [CrossRef]
  6. Feng, S.; Chen, J.; Ye, Y.; Wu, X.; Cui, H.; Tang, Y.; Lei, J. A Two-Stage Deep Transfer Learning for Localisation of Forced Oscillations Disturbance Source. Int. J. Electr. Power Energy Syst. 2022, 135, 107577. [Google Scholar] [CrossRef]
  7. Wu, C.; Zhang, H.; Hu, J.; Wang, Z.; Xu, Y. Research on generation technology of fault outage recovery plan for distribution network considering new energy integration. Telecom Power Technol. 2020, 37, 264–265. (In Chinese) [Google Scholar] [CrossRef]
  8. Hou, Y. Ensuring Power Supply Safety for Important Power Users. Power Supply Consum. 2014, 16–17. (In Chinese) [Google Scholar] [CrossRef]
  9. Yang, X.; Xiang, B.; Jin, Z.; Wang, K.; Zhong, J.; Xu, F. Optimal Algorithm for Fault Power Supply Load Recovery of Distribution Network Based on Integer Programming. Sichuan Electr. Power Technol. 2025, 48, 55–60. (In Chinese) [Google Scholar] [CrossRef]
  10. Li, Y.; Chang, Y.; Liang, X. Research on Optimal Benefit Reconfiguration Method for Distribution Network with New Energy Integration. Control Eng. China 2021, 28, 931–937. (In Chinese) [Google Scholar] [CrossRef]
  11. Xie, X.; Liu, X.; Li, C.; Hu, Z.; Liu, X.; Chen, T. Reconfiguration of Distribution Network Considering Distributed Generation and Electric Vehicle Cluster Scheduling. Electr. Power 2023, 56, 119–125. (In Chinese) [Google Scholar] [CrossRef]
  12. Yang, X.; Lü, H.; Zhu, H. Distribution Network Reconfiguration Based on Improved Artificial Fish Swarm Algorithm. Electr. Meas. Instrum. 2020, 57, 72–78+98. (In Chinese) [Google Scholar] [CrossRef]
  13. Muhammad, M.A.; Mokhlis, H.; Naidu, K.; Amin, A.; Franco, J.F.; Othman, M. Distribution Network Planning Enhancement via Network Reconfiguration and DG Integration Using Dataset Approach and Water Cycle Algorithm. J. Mod. Power Syst. Clean Energy 2019, 8, 86–93. [Google Scholar] [CrossRef]
  14. Balasubramaniam, K.; Abdlrahem, A.; Hadidi, R.; Makram, E.B. Balanced, Non-Contiguous Partitioning of Power Systems Considering Operational Constraints. Electr. Power Syst. Res. 2016, 140, 456–463. [Google Scholar] [CrossRef]
  15. Chen, C.; Zhou, Y.; Chi, M.; Wang, B. A Review on Vulnerability Research of Large-Scale Power Grids Based on Complex Network Theory. Control Decis. 2022, 37, 782–798. (In Chinese) [Google Scholar] [CrossRef]
  16. Tang, Y.; Zheng, C.; Xiao, J.; Hou, J. A Search Method for Active Splitting Sections Considering Multiple Factors. J. Glob. Energy Interconnect. 2019, 2, 393–400. (In Chinese) [Google Scholar] [CrossRef]
  17. Song, M.; Tao, J.; Zhang, H.; Zhu, Q. Autonomous-Cooperative Voltage and Reactive Power Control for Distribution Networks with New Energy Integration. Proc. CSU-EPSA 2022, 34, 38–47. (In Chinese) [Google Scholar] [CrossRef]
  18. Yu, J.; Li, Z.; Gong, X.; Wang, Y.; Zhu, K.; Yang, D. Robust State Estimation for Power System Partitioning Based on Parallel Particle Swarm Optimization Algorithm. Power Syst. Technol. 2022, 46, 3139–3148. (In Chinese) [Google Scholar] [CrossRef]
  19. Hua, H.; Zhai, J.; Chen, X. Dynamic Partitioning of Virtual Microgrid Clusters and Local Energy Autonomy Based on Enhanced Elite-Preserved Genetic Algorithm. Proc. CSEE 2024, 44, 4652–4666. (In Chinese) [Google Scholar] [CrossRef]
  20. Wan, Y.; Tan, X.; Shu, H. Finding and Evaluating Community Structures in Spatial Networks. ISPRS Int. J. Geo-Inf. 2023, 12, 187. [Google Scholar] [CrossRef]
  21. Yang, C.; Liang, H.; Gu, X.; Tang, X.; Xie, Y.; Liu, Y. A Partitioning Method for Recovery of Asynchronous Receiving-End Power Grids with Multiple HVDC Infeed. Autom. Electr. Power Syst. 2019, 43, 162–170. (In Chinese) [Google Scholar] [CrossRef]
  22. Ye, Y.; Ouyang, L.; Zhong, L.; Fang, Y.; Zhang, S.; He, Y. A Power Grid Recovery Partitioning Method Based on Improved Spectral Clustering Algorithm Considering Unit Grouping. Zhejiang Electr. Power 2021, 40, 12–18. (In Chinese) [Google Scholar] [CrossRef]
  23. Ling, R.; Shao, B.; Li, M.; Chen, X.; Cao, C.; Xue, C. Research on Power Grid Partitioning Based on Community Similarity of Complex Networks. Zhejiang Electr. Power 2021, 40, 47–53. (In Chinese) [Google Scholar] [CrossRef]
  24. Zarei, B.; Meybodi, M.R. Detecting Community Structure in Complex Networks Using Genetic Algorithm Based on Object Migrating Automata. Comput. Intell. 2020, 36, 824–860. [Google Scholar] [CrossRef]
  25. Lin, J.; Liu, M.; Liu, X. A Method for Identifying Key Power Transmission Sections Based on Improved Normalized Cut and Safety Risk Indicators. South. Power Syst. Technol. 2025, 19, 20–30. (In Chinese) [Google Scholar] [CrossRef]
  26. Zhao, J.; Jia, R.; Chen, L.; Zhu, T. Research on Rapid Reactive Power and Voltage Partitioning of Power Grids Based on Deep Learning and Improved K-means Clustering Algorithm. Power Syst. Prot. Control 2021, 49, 89–95. (In Chinese) [Google Scholar] [CrossRef]
  27. Zhao, X.; Xiao, C.; Peng, K.; Chen, J.; Zhang, X. Cluster Partition-Based Zonal Voltage Control for Distribution Networks With High Penetrated PVs. Front. Energy Res. 2022, 10, 900824. [Google Scholar] [CrossRef]
  28. Ke, S.; Liu, W.; Lu, Z.; Rao, W.; An, C.; Xia, J. Subarea Partition Based on Correlation Analysis with Edge-Elimination Strategy Using Automatic License Plate Recognition Data. Transp. Res. Rec. 2022, 2676, 641–652. [Google Scholar] [CrossRef]
  29. Li, J.; Huo, Q.; Yin, J. Study on Coordinated Voltage Regulation Strategy of Flexible On-Load Tap Changer and Distributed Generator. Energy Rep. 2022, 8 (Suppl. 13), 601–609. [Google Scholar] [CrossRef]
  30. Xu, X.; Zhao, N.; Wang, L.; Yao, X.; Zhou, L. Research on time-varying dynamic response aggregation model of distributed generator participating in active distribution network. Energy Rep. 2023, 9 (Suppl. 7), 1546–1556. [Google Scholar] [CrossRef]
  31. Sun, J.; Xu, J.; Ke, D. Cluster partition for distributed energy resources in Regional Integrated Energy System. Energy Rep. 2023, 9 (Suppl. 8), 613–619. [Google Scholar] [CrossRef]
  32. Shi, K.; Yan, J.; Yang, J. A Semantic Partition Algorithm Based on Improved K-Means Clustering for Large-Scale Indoor Areas. ISPRS Int. J. Geo-Inf. 2024, 13, 41. [Google Scholar] [CrossRef]
  33. Alazzam, H.; Alhenawi, E.; Al-Sayyed, R. A Hybrid Job Scheduling Algorithm Based on Tabu and Harmony Search Algorithms. J. Supercomput. 2019, 75, 7994–8011. [Google Scholar] [CrossRef]
  34. Wu, X.; Wang, Y.; Fan, N. A New Filled Function Method Based on Adaptive Search Direction and Valley Widening for Global Optimization. Appl. Intell. 2021, 51, 6234–6254. [Google Scholar] [CrossRef]
  35. Li, W.; Liu, Y.; Liang, H. A New Distributed Energy Management Strategy for Smart Grid with Stochastic Wind Power Based on ADMM. IEEE Trans. Ind. Electron. 2021, 68, 1311–1321. [Google Scholar] [CrossRef]
  36. Al-Sharoa, E.M.; Ababneh, B.M.; Alkhassaweneh, M.A. Robust Community Detection in Graphs. IEEE Access 2021, 9, 118757–118770. [Google Scholar] [CrossRef]
Disclaimer/Publisher’s Note: The statements, opinions and data contained in all publications are solely those of the individual author(s) and contributor(s) and not of MDPI and/or the editor(s). MDPI and/or the editor(s) disclaim responsibility for any injury to people or property resulting from any ideas, methods, instructions or products referred to in the content.

Article Metrics

Citations

Article Access Statistics

Multiple requests from the same IP address are counted as one view.