Article

An Intelligent Choquet Fuzzy Integral-Based Framework for Risk Assessment in Seismic Acquisition Processes

1
College of Geophysics and Petroleum Resources, Wuhan Campus, Yangtze University, Wuhan 430100, China
2
Jianghan Branch, Sinopec Geophysical Corporation, Qianjiang 433199, China
3
Institute of Logging Technology and Engineering, Yangtze University, Jingzhou 434023, China
*
Author to whom correspondence should be addressed.
Processes 2025, 13(11), 3558; https://doi.org/10.3390/pr13113558
Submission received: 11 October 2025 / Revised: 28 October 2025 / Accepted: 30 October 2025 / Published: 5 November 2025
(This article belongs to the Topic Energy Extraction and Processing Science)

Abstract

An intelligent safety risk assessment model is proposed by integrating the λ-fuzzy measure, Choquet integral, and triangular fuzzy numbers. It addresses the limitations of conventional methods like AHP that neglect nonlinear interactions among risk factors. The framework quantifies expert linguistic judgments to capture synergistic and substitutive relationships. Validation using two Sinopec seismic projects shows a 23.3% reduction in assessment time and an 18.1% accuracy improvement. Computed λ values (HB: −0.999997; SC: −0.999821) confirm strong substitutive interactions. Sensitivity analysis demonstrates robustness, with ±10% fuzzy measure variation causing <±3% output change. The model provides a computationally efficient, reliable tool for seismic acquisition and other complex industrial systems.

1. Introduction

1.1. Safety Risk Evaluation Is Characterized by Pervasive Interdependencies Among Factors

The Choquet integral, rooted in capacity theory, provides a mathematical framework to capture these nonlinear, synergistic, and substitutive interactions [1,2], thereby overcoming the limitations of conventional additive models that assume criterion independence.
As a cornerstone of hydrocarbon exploration, seismic acquisition images the subsurface by generating controlled signals and analyzing reflected waves [3]. While essential for reservoir characterization, this process entails significant operational risks. The handling, transport, and detonation of civil explosives (e.g., seismic charges) represent the most critical hazards. Studies indicate that vulnerabilities persist throughout the explosive lifecycle from transport and storage to deployment and disposal, posing serious threats to personnel safety, public welfare, and the environment [4].
The extensive spatial scale and distributed nature of seismic acquisition projects further amplify these risks. Such projects typically span multiple geographic zones, involve diverse personnel and equipment, and are subject to complex geological and meteorological conditions. Consequently, establishing a robust and systematic safety risk assessment framework is imperative. This aligns with the “Safety First, Prevention Foremost” principle governing China’s petroleum industry. Conventional quantitative methods, such as the Analytic Hierarchy Process (AHP) and Linear Weighted Models (LWMs), operate under the assumption that risk indicators are mutually independent—a major conceptual flaw that ignores the interactive effects prevalent in field operations [5,6]. For example, enhancements in one area (e.g., personnel training) may compensate for deficiencies in another (e.g., equipment maintenance). Empirical studies in seismic risk assessment confirm that such interdependencies are ubiquitous in these complex environments.
Conventional linear weighting methods exhibit limited effectiveness in capturing complex, nonlinear dependencies among risk factors. To overcome this shortcoming, we propose a novel safety risk assessment framework. This framework integrates the λ-fuzzy measure with the Choquet fuzzy integral. Furthermore, our model incorporates triangular fuzzy numbers to convert linguistic expert judgments into quantitative data. By explicitly modeling nonlinear relationships and interaction intensities, our approach offers a more realistic representation of the multidimensional risk landscape in seismic projects. The framework is also designed to align with Sinopec’s corporate safety management system, specifically the Production Safety Risk Management Regulations (Trial) [7]. This alignment ensures consistency with industry standards and helps mitigate the influence of subjective judgment.

1.2. Recent Advances in Intelligent Risk Assessment

Recent years (2020–2024) have seen a surge of interest in intelligent risk assessment methodologies. For instance, hybrid models that integrate fuzzy Bayesian networks with reinforcement learning have been developed for dynamic environmental impact assessment, demonstrating a superior ability to handle uncertainty [8]. Similarly, AI-powered risk control platforms, which leverage Long Short-Term Memory (LSTM) networks and multi-source data fusion, now enable real-time risk prediction and dynamic adjustments in industrial safety management. Beyond these approaches, Bayesian spatio-temporal statistical models are being applied to capture complex heterogeneities in geological and environmental risks. Furthermore, the toolbox of modern risk analysis has been expanded by data-driven prognostic frameworks that incorporate uncertainty quantification and robustness evaluation [9,10,11].
However, critical limitations persist despite these advances. Many recently proposed models, such as molecular fuzzy reinforcement learning systems, exhibit high structural complexity and substantial computational demands. These limitations hinder their practical deployment in time-sensitive field operations. Furthermore, while several studies emphasize algorithmic innovation, few have been tailored to align with specific corporate safety management systems like Sinopec’s Regulations [12]. This lack of organizational contextualization restricts their immediate applicability in real-world seismic acquisition projects [13]. In contrast, our study introduces a dedicated framework based on the λ-fuzzy measure and Choquet integral. Our approach not only quantifies nonlinear risk factor interactions but is also explicitly designed to conform to Sinopec’s operational safety standards. This design bridges a critical gap between advanced theoretical modeling and pragmatic, large-scale field application [14,15].
Although the foundational theory of fuzzy integrals is well established, their application to seismic acquisition safety represents a significant step forward. Prior applications of the Choquet integral in other engineering domains affirm its utility in modeling interdependencies [16].
However, a dedicated, empirically validated framework that integrates the λ-fuzzy measure and Choquet integral to address the specific nonlinear interactions in seismic acquisition safety, particularly within the context of a corporate safety system like Sinopec’s, has been lacking.
Our research directly addresses this gap by introducing a tailored model that synergizes advanced fuzzy integral theory with pragmatic, large scale field application [17,18].
This study overcomes the inherent limitations of traditional risk assessment by introducing an intelligent framework based on the Choquet fuzzy integral. This framework effectively quantifies nonlinear interactions among safety risk factors. Our primary contribution is the novel integration of the λ-fuzzy measure, Choquet integral, and triangular fuzzy numbers, which enables the direct modeling of both synergistic and substitutive effects.
  • Theoretically, this work advances fuzzy integral theory by tailoring it to model interdependent risks in seismic acquisition.
  • Methodologically, it introduces an intelligent mechanism to convert qualitative expert judgments into quantitative fuzzy measures [19].
  • Practically, it provides a computationally efficient and empirically validated decision-support tool. Customized for Sinopec’s operational safety framework, the tool is designed to ensure a tangible real-world impact.

2. Choquet Fuzzy Integral

Definition 1.
Let X = { x 1 ,   x 2 ,   ,   x n } be a none empty set, and let μ denote a fuzzy measure on X. For any A, B ∈ P(X) (the set of P(X)) with A ∩ B = ∅, the following condition holds [1,20]:
μ ( A B ) = μ ( A ) + μ ( B ) + λ μ ( A ) μ ( B )
Here, μ(A) and μ(B) are termed λ-fuzzy measures corresponding to the attribute index sets A and B, effectively representing their respective weights [20].
The parameter λ serves as a global index that quantitatively characterizes the overall nature of interactions among all risk factors. It is calculated directly from Equation (3) using the fuzzy densities and the individual weights of the attributes. Based on its numerical value, λ defines three distinct regimes of factor interaction:
λ = 0: A value of λ = 0 denotes factor independence, thereby reducing the model to a conventional weighted sum. This results in a strictly additive overall measure, which implies no interaction exists among the risk factors.
λ > 0: A positive λ denotes a synergistic interaction, wherein the combined effect of factors surpasses the sum of their individual contributions. This regime captures the underlying mechanism in scenarios where cooccurring deficiencies (e.g., both inadequate training and poor communication) lead to a nonlinearly amplified risk level.
λ < 0: Indicates redundant or substitutive interaction, where the whole is less than the sum of its parts. This is characteristic of systems where strengths in one area can compensate for weaknesses in another, thereby enhancing overall resilience [21].
Consequently, the λ parameter provides two critical benefits. It facilitates mathematically accurate risk aggregation. Furthermore, it delivers valuable structural insight by revealing how risk factors combine, explicitly distinguishing between amplifying and compensatory interaction modes.
The parameter λ ∈ (−1, ∞) dictates the nature of interaction:
λ = 0: implies additivity and independence between A and B;
λ > 0: signifies μ(A∪B) > μ(A) + μ(B), indicating synergistic effects;
λ < 0: indicates μ(A∪B) < μ(A) + μ(B), suggestive of redundant or substitutive effects.
For each element xi ∈ X, where i = 1, 2, …, n, μ(xi) denotes the fuzzy measure of xi, representing its individual weight. The λ-fuzzy measure for the entire set {x1, x2, …, xn} is expressed as [1,20]:
μ λ ( x 1 , x 2 , , x n ) = 1 λ i = 1 n 1 + λ μ x i 1
Under the condition that μ(X) = 1, the parameter λ can be determined by solving [1,20]:
λ + 1 = i = 1 n ( 1 + λ μ ( X i ) )
Definition 2.
Let X = {x1, x2, …, xn} be as above, and let f be a nonnegative function defined on X [9]. The fuzzy Choquet integral of f with respect to the fuzzy measure μ is given by [1,2,20]:
f d μ = i = 1 n f ( X i ) f ( X ( i 1 ) ) μ ( A ( i ) )
where the elements are permuted such that:
F ( x 1 )     f ( x 2 )         f ( x n ) ,   and   A i = x i , , x n ,   with   X 0   =   0   A ( n + 1 ) =  
Denoting fd   μ   =   F , the value F represents the aggregated evaluation obtained through the Choquet integral. Conventional linear weighting models inherently assume that risk factors are independent.
In contrast, the proposed Choquet integral, based on the λ-fuzzy measure, explicitly captures their interactive effects whether complementary or substitutive. This formulation provides a more precise and realistic representation of the complex dependencies inherent in seismic acquisition risk assessment [22].
Quantitative Assignment of Safety Risk Assessment Indicators:
To formalize expert input, linguistic variables were first transformed into corresponding fuzzy sets [11]. Subsequently, aggregation operators were applied to synthesize these sets, enabling the conversion of qualitative judgments into quantitative risk indices. The gradation of risk levels was represented using a five-level fuzzy linguistic scale.
S = S 1 ( H i g h l y   H a z a r d o u s ) ,   S 2 ( H a z a r d o u s ) ,   S 3 ( M o d e r a t e ) ,   S 4 ( S a f e ) ,   S 5 ( H i g h l y   S a f e ) ,
Similarly, for evaluating the importance of indicators, the scale was defined as:
S   =   S 1   ( E x t r e m e l y   I m p o r t a n t ) ,   S 2   ( I m p o r t a n t ) ,   S 3   ( M o d e r a t e ) ,   S 4   ( N e g l i g i b l e ) ,   S 5   ( N o n c r i t i c a l )
The development of the five-level fuzzy linguistic scale was anchored in a structured integration of corporate safety standards and expert consensus. The specific terms and their meanings were sourced directly from Sinopec’s internal safety protocols [23], thereby guaranteeing practical relevance and organizational validity. This foundation ensures the scales are not only theoretically sound but also directly interpretable and actionable for field operations [24].
To address the inherent subjectivity in expert judgments, triangular fuzzy numbers (Table 1) were used to assign semantic weights. This approach converts qualitative assessments into quantitative values, thereby mitigating evaluation bias [25]. The integration of this fuzzy model with a conventional risk matrix created a robust semantic numerical mapping system, serving to both quantify expert input effectively and minimize bias in safety risk assessments.
The five-level fuzzy linguistic scale was developed through systematic integration of corporate safety standards and expert consensus. Its specific terminology and semantic definitions were directly adapted from Sinopec’s internal safety protocols, ensuring both practical relevance and organizational validity [26]. This foundational alignment guarantees that the assessment scales are not only theoretically sound but also immediately interpretable and actionable in field operations.

3. Methodology

3.1. Overview of the Proposed Framework

The architecture of the proposed safety risk assessment framework, incorporating the λ-fuzzy measure and Choquet integral, is depicted in Figure 1. The workflow starts with risk factor identification and subsequently proceeds through a series of stages: fuzzy quantification, weight determination, interaction parameter calculation, and final aggregation [27]. The core computational procedure of the model is detailed below, corresponding to the stages in Figure 2.

3.2. Algorithmic Steps for Risk Aggregation

This section details the computational methodology for risk aggregation. The procedure transforms linguistic expert evaluations into quantifiable metrics, preserving the inherent uncertainty of qualitative judgments. This ensures a mathematically rigorous transition from subjective assessments to objective risk scores.

3.2.1. Theoretical Framework and Computational Sequence

Computational Workflow for Risk Aggregation
Risk aggregation follows a sequential seven step protocol designed to maintain methodological integrity, with each stage building logically upon the previous one: Fuzzy Weight Aggregation: Expert evaluations are consolidated using the geometric mean operator, which preserves the triangular fuzzy structure while mitigating the impact of outlier judgments.
Fuzzy Weight Aggregation
  • Defuzzification Procedure: The relative distance method converts fuzzy weights into crisp values, establishing a reproducible mapping between linguistic terms.
  • Expert evaluations are consolidated using the geometric mean operator. This approach preserves the triangular fuzzy structure while minimizing the influence of outlier judgments.
  • Fuzzy Density Assignment: Resulting crisp values are assigned as fuzzy densities, forming the basis for interaction parameter calculation [28].
Computational Implementation
The implementation leveraged a dual software environment. Expert evaluation matrices were first assembled and underwent initial validation in Microsoft Excel. Subsequently, all core computations including the iterative solution for λ in Equation (3) and the evaluation of the Choquet integral were performed using custom developed algorithms in MATLAB R2021a.
The parameter λ was obtained by numerically solving the transcendental Equation (3), which lacks an analytical solution. The Newton Raphson method was employed for this purpose, chosen for its rapid quadratic convergence. The algorithm was configured with the following specifications:
Initial guess: λ0 = 0 (corresponding to the additive independent case);
Convergence criterion: |f(λ)| < 1 × 10⁻⁸, where f(λ) = ∏(1 + λ·μ(Xi)) − (λ + 1);
Maximum iterations: 100;
Computational precision: Double precision floating point (≈15 decimal digits).
The Newton Raphson method was selected for its quadratic convergence properties and computational efficiency. In all cases, convergence was achieved within 5–10 iterations, with the final λ values typically in the range of −0.9999 to −0.999997, indicating strong substitutive interactions among risk factors.
The computational sequence for risk aggregation comprises four stages: numerically deriving the global interaction parameter λ; applying consistent defuzzification to all fuzzy evaluations; computing the λ-fuzzy measures for all subsets based on λ; and finally, synthesizing all components into a comprehensive risk score via the Choquet integral [29].

3.2.2. Mathematical Formalization

  • Fuzzy Weight Aggregation
For indicator i under criterion j, the aggregated fuzzy weight W ~ ij from k experts is computed as:
W ~ i j = e = 1 k a i j e k , e = 1 k b i j e k , e = 1 k c i j e k
where (aije, bije, cije) denotes the triangular fuzzy number from expert “e”.
B.
Comprehensive Defuzzification Framework
To enable final risk scoring and ranking, the model transforms aggregated triangular fuzzy numbers into crisp values through a defuzzification step. This procedure employs the relative distance method, which evaluates each fuzzy number by its geometric distance from two reference points: the negative ideal point (NIP = (0, 0, 0)) and the positive ideal point (PIP = (1, 1, 1)). The crisp value is derived from the ratio of its NIP distance to the total distance from both ideal points, yielding a robust and intuitive measure of central tendency (see equations in Section 3.2.2) [30].
The relative distance method transforms A ~ = (a, b, c) into crisp values through geometric mapping:
Distance to Negative Ideal Point (NIP = 0, 0, 0):
d ( A ~ ) = a 2 + b 2 + c 2 3
Distance to Positive Ideal Point (PIP = 1, 1, 1):
d + ( A ~ ) = ( 1 a ) 2 + ( 1 b ) 2 + ( 1 c ) 2 3
Following the defuzzification of the aggregated fuzzy weights, the resulting crisp values are assigned as the fuzzy densities, denoted as μ ( x i ) , for each risk factor x i . This established practice initializes the fuzzy densities using the consolidated importance weights of the individual criteria. It is standard in the application of λ-fuzzy measures, as it uses the expert judged importance of each single element as the foundation for modeling their subsequent interactions.
C.
Fuzzy Density Assignment: The resulting crisp values are assigned as fuzzy densities. This forms the basis for calculating the interaction parameter.

3.2.3. Numerical Implementation

An expanded computational example for “Unprofessional Transportation” W ~ 16 demonstrates the implementation:
Phase 1: Expert Data Integration (Table 2):
Aggregation yields:
W ~ 16 = ( 0.66,0.91,1.00 )
Phase 2: Defuzzification Sequence
Step 1: Calculate distance to NIP:
d = 0.6 6 2 + 0.9 1 2 + 1.0 0 2 3 = 2.2637 3 = 0.86
Step 2: Calculate distance to PIP:
d + = ( 1 0.66 ) 2 + ( 1 0.91 ) 2 + ( 1 1.00 ) 2 3 = 0.1237 3 = 0.21
Step 3: Determine crisp value:
W ¯ 16 = 0.86 0.86 + 0.21 = 0.80

3.2.4. Static Nature and Dynamic Extension Potential

While the present model provides a static, project level risk assessment by integrating factors from all operational phases, it does not capture temporal risk fluctuations between distinct stages such as transport and detonation. This limitation identifies a clear direction for future work. Given the framework’s modular design, subsequent research could develop a dynamic, phase specific model by applying the Choquet integral sequentially to time dependent risk data, thereby laying the groundwork for more granular temporal analysis.

3.2.5. Computational Efficiency Analysis

The computational complexity of the general Choquet integral is O ( n 2 n ) due to the need to compute measures for all subsets of n criteria.
The traditional weighted summation method (complexity O ( n ) ) assumes that the evaluation indicators are independent of each other. The power of the Choquet integral lies in its ability to model interactions between indicators (synergy or redundancy effects). The price of this ability is the need to consider the importance of all subsets of indicators [31]. The computational process leading to this complexity can be broken down into the following key steps, using the standard definition of the discrete Choquet integral:
Definition 3.
Let X = {x1, x2, …, xn} be a set of n evaluation criteria; f ( x i )  be the evaluation value of criterion  x i  [9], and μ be a fuzzy measure defined on the power set of X.
Step 1: Sorting the Criteria
First, the criteria are rearranged in ascending order of their evaluation values such that:
f ( x 1 ) f ( x 2 ) f ( x n )
The complexity of sorting n elements is O ( n log n ) .
Step 2: Choquet Integral Calculation (Core Part)
The discrete calculation formula for the Choquet integral is:
( C ) f d μ = i = 1 n f ( x i ) f ( x ( i 1 ) ) μ ( A i )
where
f ( x 0 ) = 0
A i = { x i , x ( i + 1 ) , , x n } is the set of all criteria from the i th position onwards.
Step 3: Analysis of the Complexity Explosion (Source of O ( n 2 n ) ):
While Formula (1) itself appears to be an O ( n ) loop, the complexity is hidden in the acquisition of the values μ ( A i ) .
Number of Subsets Required: To compute this sum, we need to know the fuzzy measure values for nn different subsets A 1 , A 2 , , A n :
A 1 = { x 1 , x 2 , , x n } (contains n elements);
A 2 = { x 2 , , x n } (contains n − 1 elements);
A n = { x n } (contains 1 element);
Building upon the theoretical foundation of O ( n 2 n ) complexity in fuzzy computation, our implementation strategically leverages the recursive properties of the λ-fuzzy measure. This approach reduces the computational complexity of sorting criteria to O ( n log n ) , while the integration operation itself requires only O ( n ) . This stands in sharp contrast to the O ( n ) complexity of the Linear Weighted Model (LWM) [32].
Although theoretically more complex, our model (incorporating 33 indicators) achieves substantially reduced computational workload through efficient numerical implementation in MATLAB. This efficiency constitutes the cornerstone of the overall assessment performance reported in Section 6.4.

3.2.6. Comparative Analysis and Selection of the Choquet Integral

The selection of the Choquet integral for this study was motivated by its specific advantages over alternative fuzzy integrals. While the Sugeno integral performs well in ordinal aggregation, its inability to execute arithmetic addition renders it inadequate for cardinal risk scoring. Similarly, the Shilkret integral is posited as a pessimistic, nonlinear operator, ill-equipped to model the compensatory dynamics of risk systems.
The Choquet integral, by generalizing the weighted arithmetic mean and Lebesgue integral, uniquely accommodates both cardinal risk magnitudes and interdependent criterion weights RefC. This capacity allows our model to precisely quantify the substitutive interactions empirical to our seismic case studies, thus directly addressing a fundamental research aim.

4. Intelligent Model for Safety Risk Assessment in Seismic Acquisition Project

The development of our model is grounded in Sinopec’s internal safety regulations, specifically the Production Safety Risk Management Regulations (Trial) (2016) and the Safety and Environmental Risk Management Guidelines (2018) [12,23]. Consequently, a standardized risk matrix was implemented to evaluate the likelihood and magnitude of potential risk events.
The risk management process begins with an initial assessment to guide control measure selection. The resulting residual risk indicates the true exposure level under existing safeguards. Subsequently, each risk’s acceptability must be judged according to the ALARP principle, requiring reduction to levels that are technologically and economically feasible. For this evaluation, Sinopec utilizes a four-category risk matrix (Highly Hazardous/Red, Hazardous/Orange, Moderate/Yellow, Low/Blue) as shown in Table 3. Once evaluated quantitatively, these individual risk factors are aggregated to determine the overall project risk [33].
A comprehensive risk identification process was implemented across all operational units, covering activities, equipment, facilities, geographical regions, and construction tasks. Designated assessment teams—comprising operators, technical staff, and managers—evaluated risks specific to each position. The verified results were systematically compiled into a comprehensive register of hazardous events. For subsequent analysis, safety levels were classified into four distinct tiers: Critical (Red), High (Orange), Moderate (Yellow), and Low (Blue) [34]. The overall project safety risk, denoted as R, was calculated by aggregating the risk values of all constituent elements. This procedure also generated two key components: the Risk Frequency Weight Matrix (L) (Table 3) and the Hazard Consequence Classification Matrix (Table 4).
The total risk level R was calculated as the product of the probability of an accident occurring and the severity of its consequences:
R = L × S
The overall hazard level R was determined through the integration of the probability matrix (L) and the severity consequence matrix (S). This output was then mapped to a set of discrete risk intervals using triangular semantic membership functions, a design where increased numerical values directly signify elevated risk. The normalized risk distribution matrix (Table 5) facilitated the final classification by enabling the calculation of membership degrees for any given R value against these semantic functions.

5. Identification of Safety Risk Factors in Seismic Acquisition Projects

In seismic acquisition operations, human resources and equipment constitute the fundamental components of safety management. Human related risks primarily involve personnel factors—such as blasting operators and material handlers—whereas equipment related risks pertain to vehicles, machinery, drones, and other technical instruments [35].
The nine main risk categories were identified through a comprehensive triangulation approach that integrated three primary sources: (1) systematic review of Sinopec’s internal safety documentation, including the Production Safety Risk Management Regulations (Trial) and Safety and Environmental Risk Management Guidelines; (2) analysis of historical incident reports from previous seismic acquisition projects spanning 2015–2023; and (3) structured expert elicitation during the initial Delphi round, where panelists were asked to identify and prioritize the most critical risk domains based on their field experience. This multimethod approach ensured that the selected categories reflect both corporate safety standards and practical operational realities [36].
A comprehensive evaluation of hazard inducing events—covering warehouses, temporary accommodations, workshops, transportation networks, and active construction zones—is essential for identifying safety risk factors. The assessment of these factors was systematically conducted by integrating construction sequences, technical procedures, and human–equipment interaction processes. Based on this analysis, a hierarchical taxonomy of safety risk factors was developed, consisting of two primary indicators, nine secondary indicators, and 33 tertiary indicators [12,23,37].
The structured framework encompasses two main dimensions—human related and equipment related factors. The nine principal categories of risk are as follows:
  • Theft, hijacking, or loss of civil explosives during transportation: These incidents pose severe safety threats. Contributing factors include inadequate guarding, improper well sealing, and mishandling of misfires. Robust security protocols and strict handling procedures are required to mitigate such risks and ensure the safe transport of hazardous materials.
  • Traffic injury risk: Arises from the extensive use of vehicles for transporting personnel and materials. Key causes include driver error, vehicle malfunction, and adverse weather conditions.
  • Damage to above and below ground facilities: Construction activities may endanger nearby structures and infrastructure due to insufficient site surveys, poorly located wells, inadequate safety distances, or operational errors.
  • Drowning risk: Operations conducted near rivers, canals, reservoirs, or aquaculture ponds, such as underwater cable deployment or air gun operations without adequate protection, present drowning hazards. Major contributing factors include failure to wear life-saving equipment, vessel malfunction, and severe weather.
  • Accidental explosion of civil explosives: Unintended detonations during transport may result from illegal parking, unqualified transportation practices, use of radio frequency devices, detonation line short circuits, or adverse environmental conditions.
  • Fire risk: Collective accommodations and high fuel consumption during project execution heighten fire hazards. Contributing factors include unsafe fuel storage, unauthorized electrical use, and open flame heating practices on site.
  • Electrocution risk: Electrical hazards may arise from equipment use, construction operations, or shared accommodations. Major risks include contact between detonation lines and wells, improper wiring, unsafe proximity to power lines, high voltage operations, and lightning strikes.
  • Mechanical injury risk: The operation of heavy machinery introduces hazards related to improper operation, lack of protective gear, and mechanical failures.
  • Sudden illness risk: The high physical demands of seismic acquisition work can lead to acute medical incidents, especially under extreme environmental or workload conditions.
The quantification and prioritization of risks were informed by expert judgment and historical data. Expert judgment was formally captured via the Delphi method, where a panel of twenty specialists assigned differentiated weights to human and equipment related safety indicators [38]. These validated weights directly fed into the risk assessment model. The process was further supported by an analysis of historical safety records, which enabled the development of a project specific training program and a targeted safety management framework.

6. Case Analyses and Model Validation

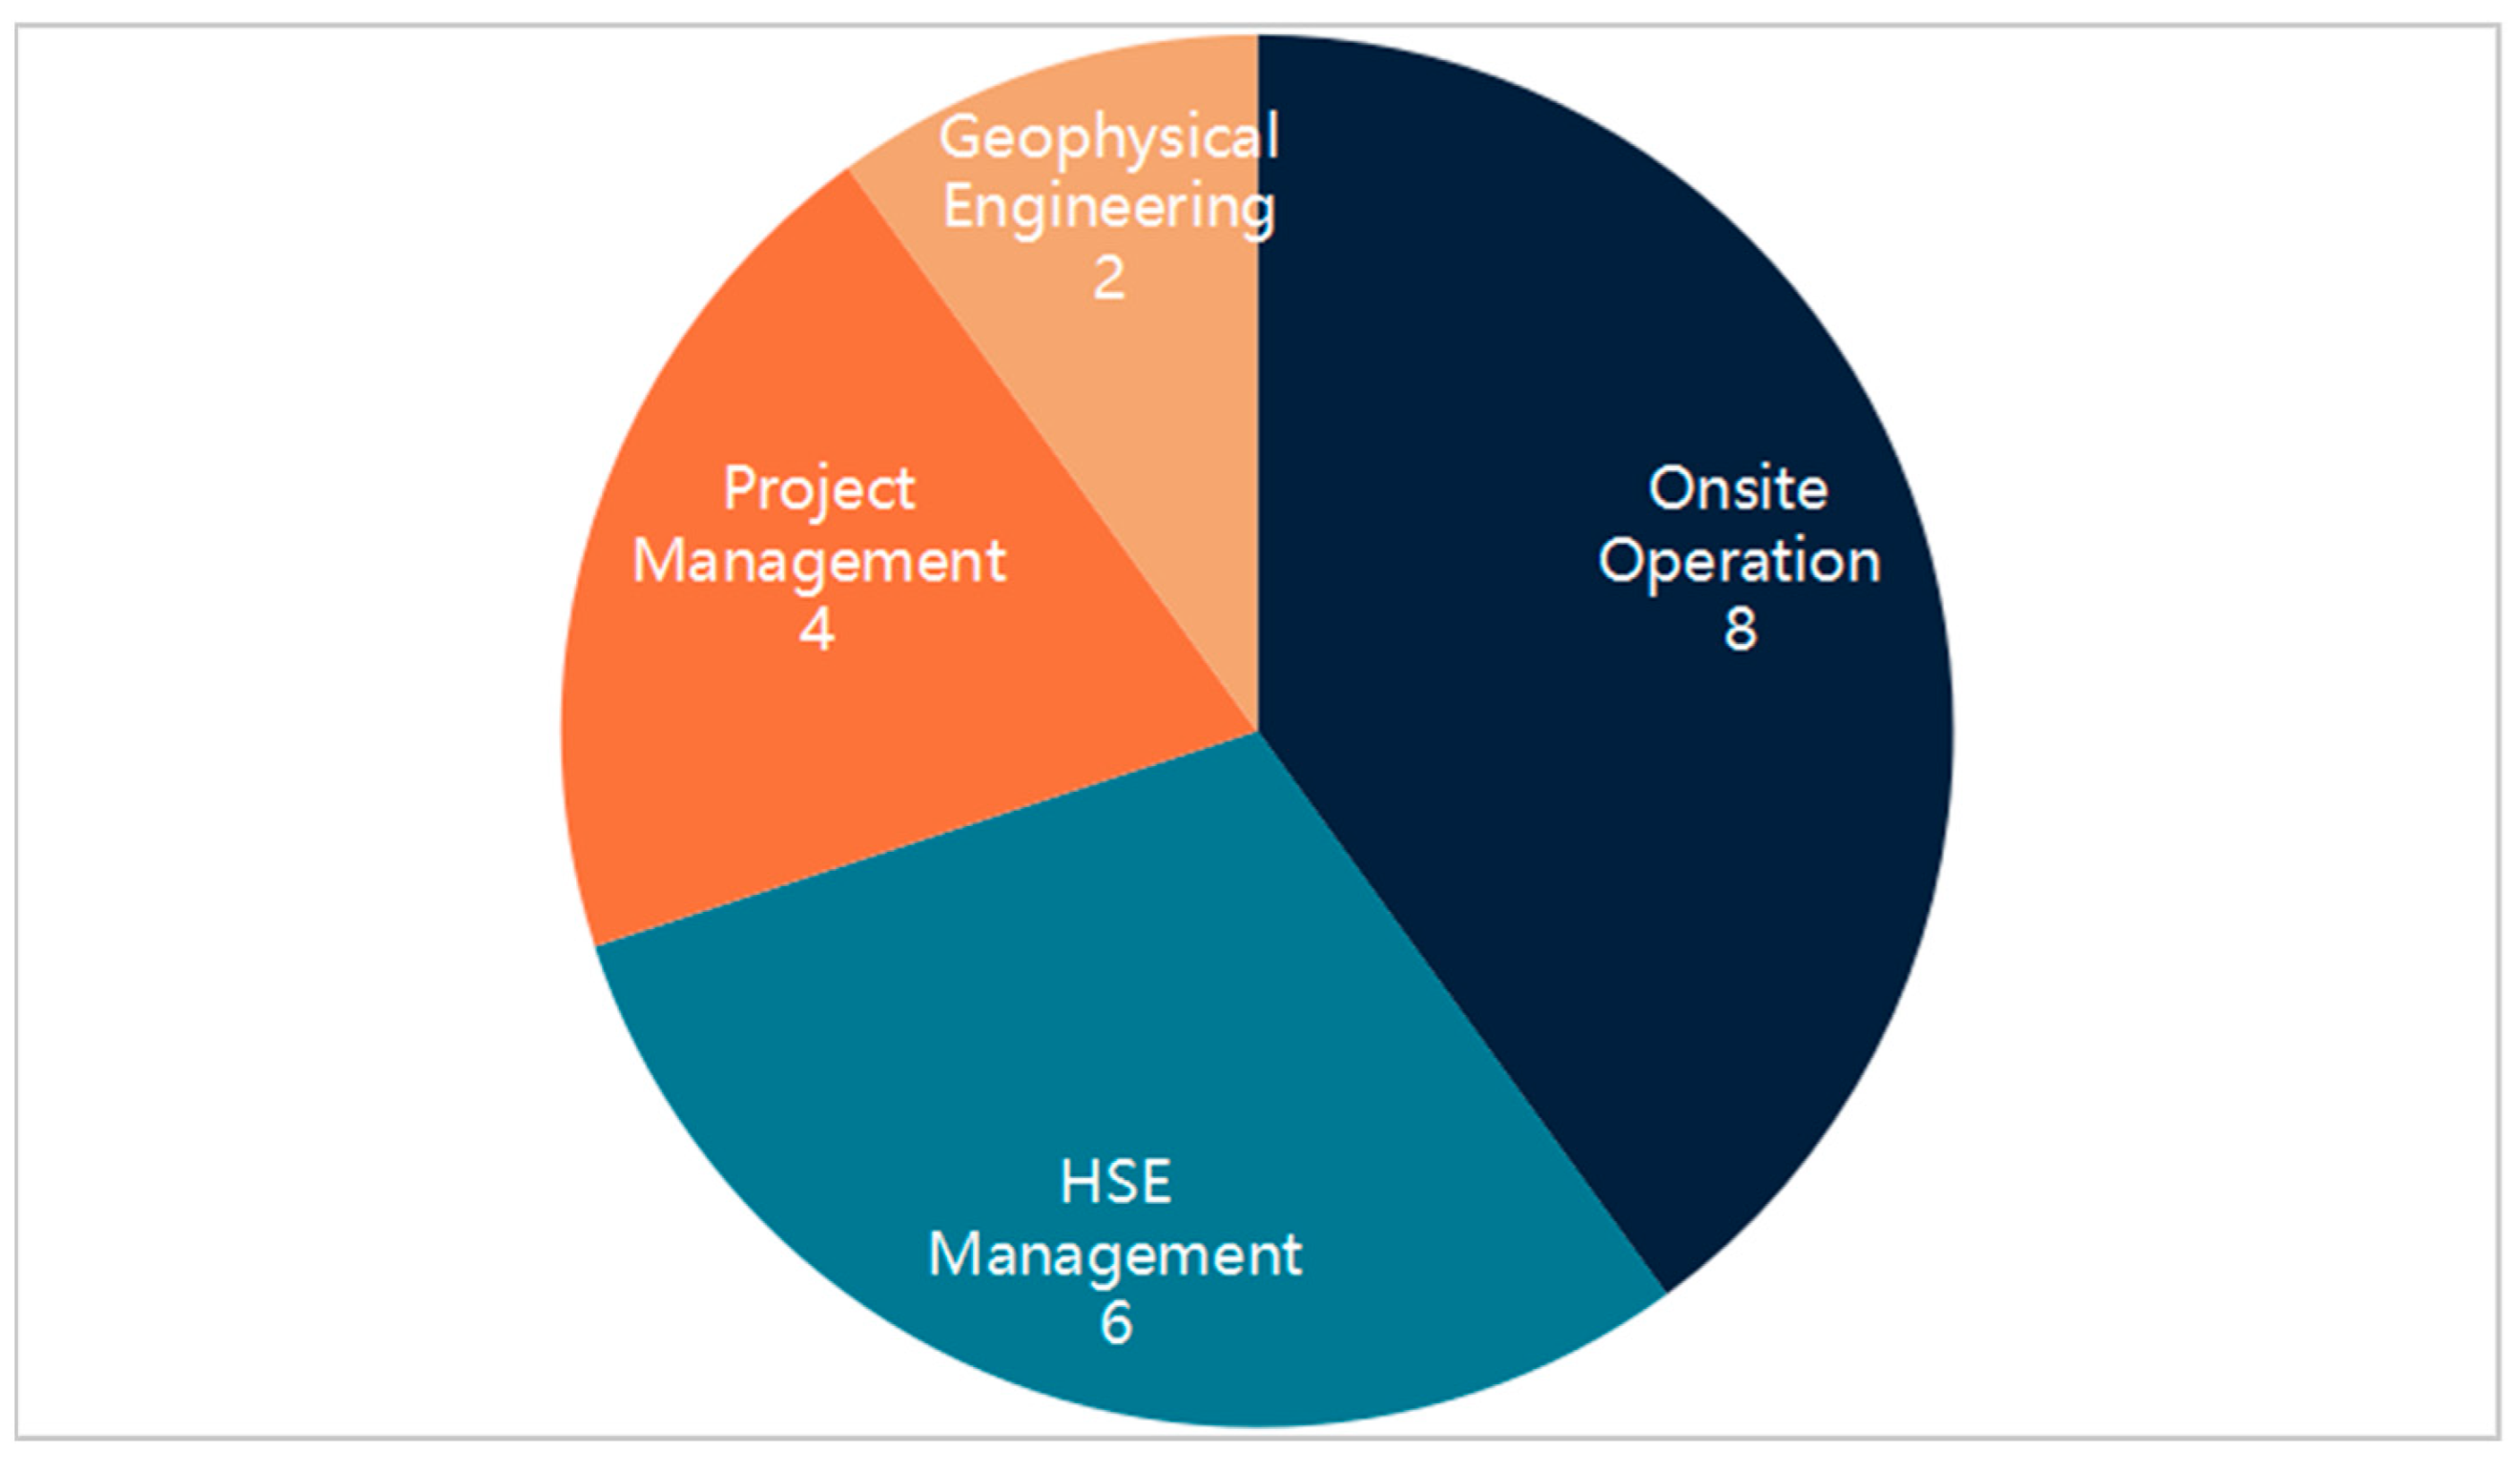
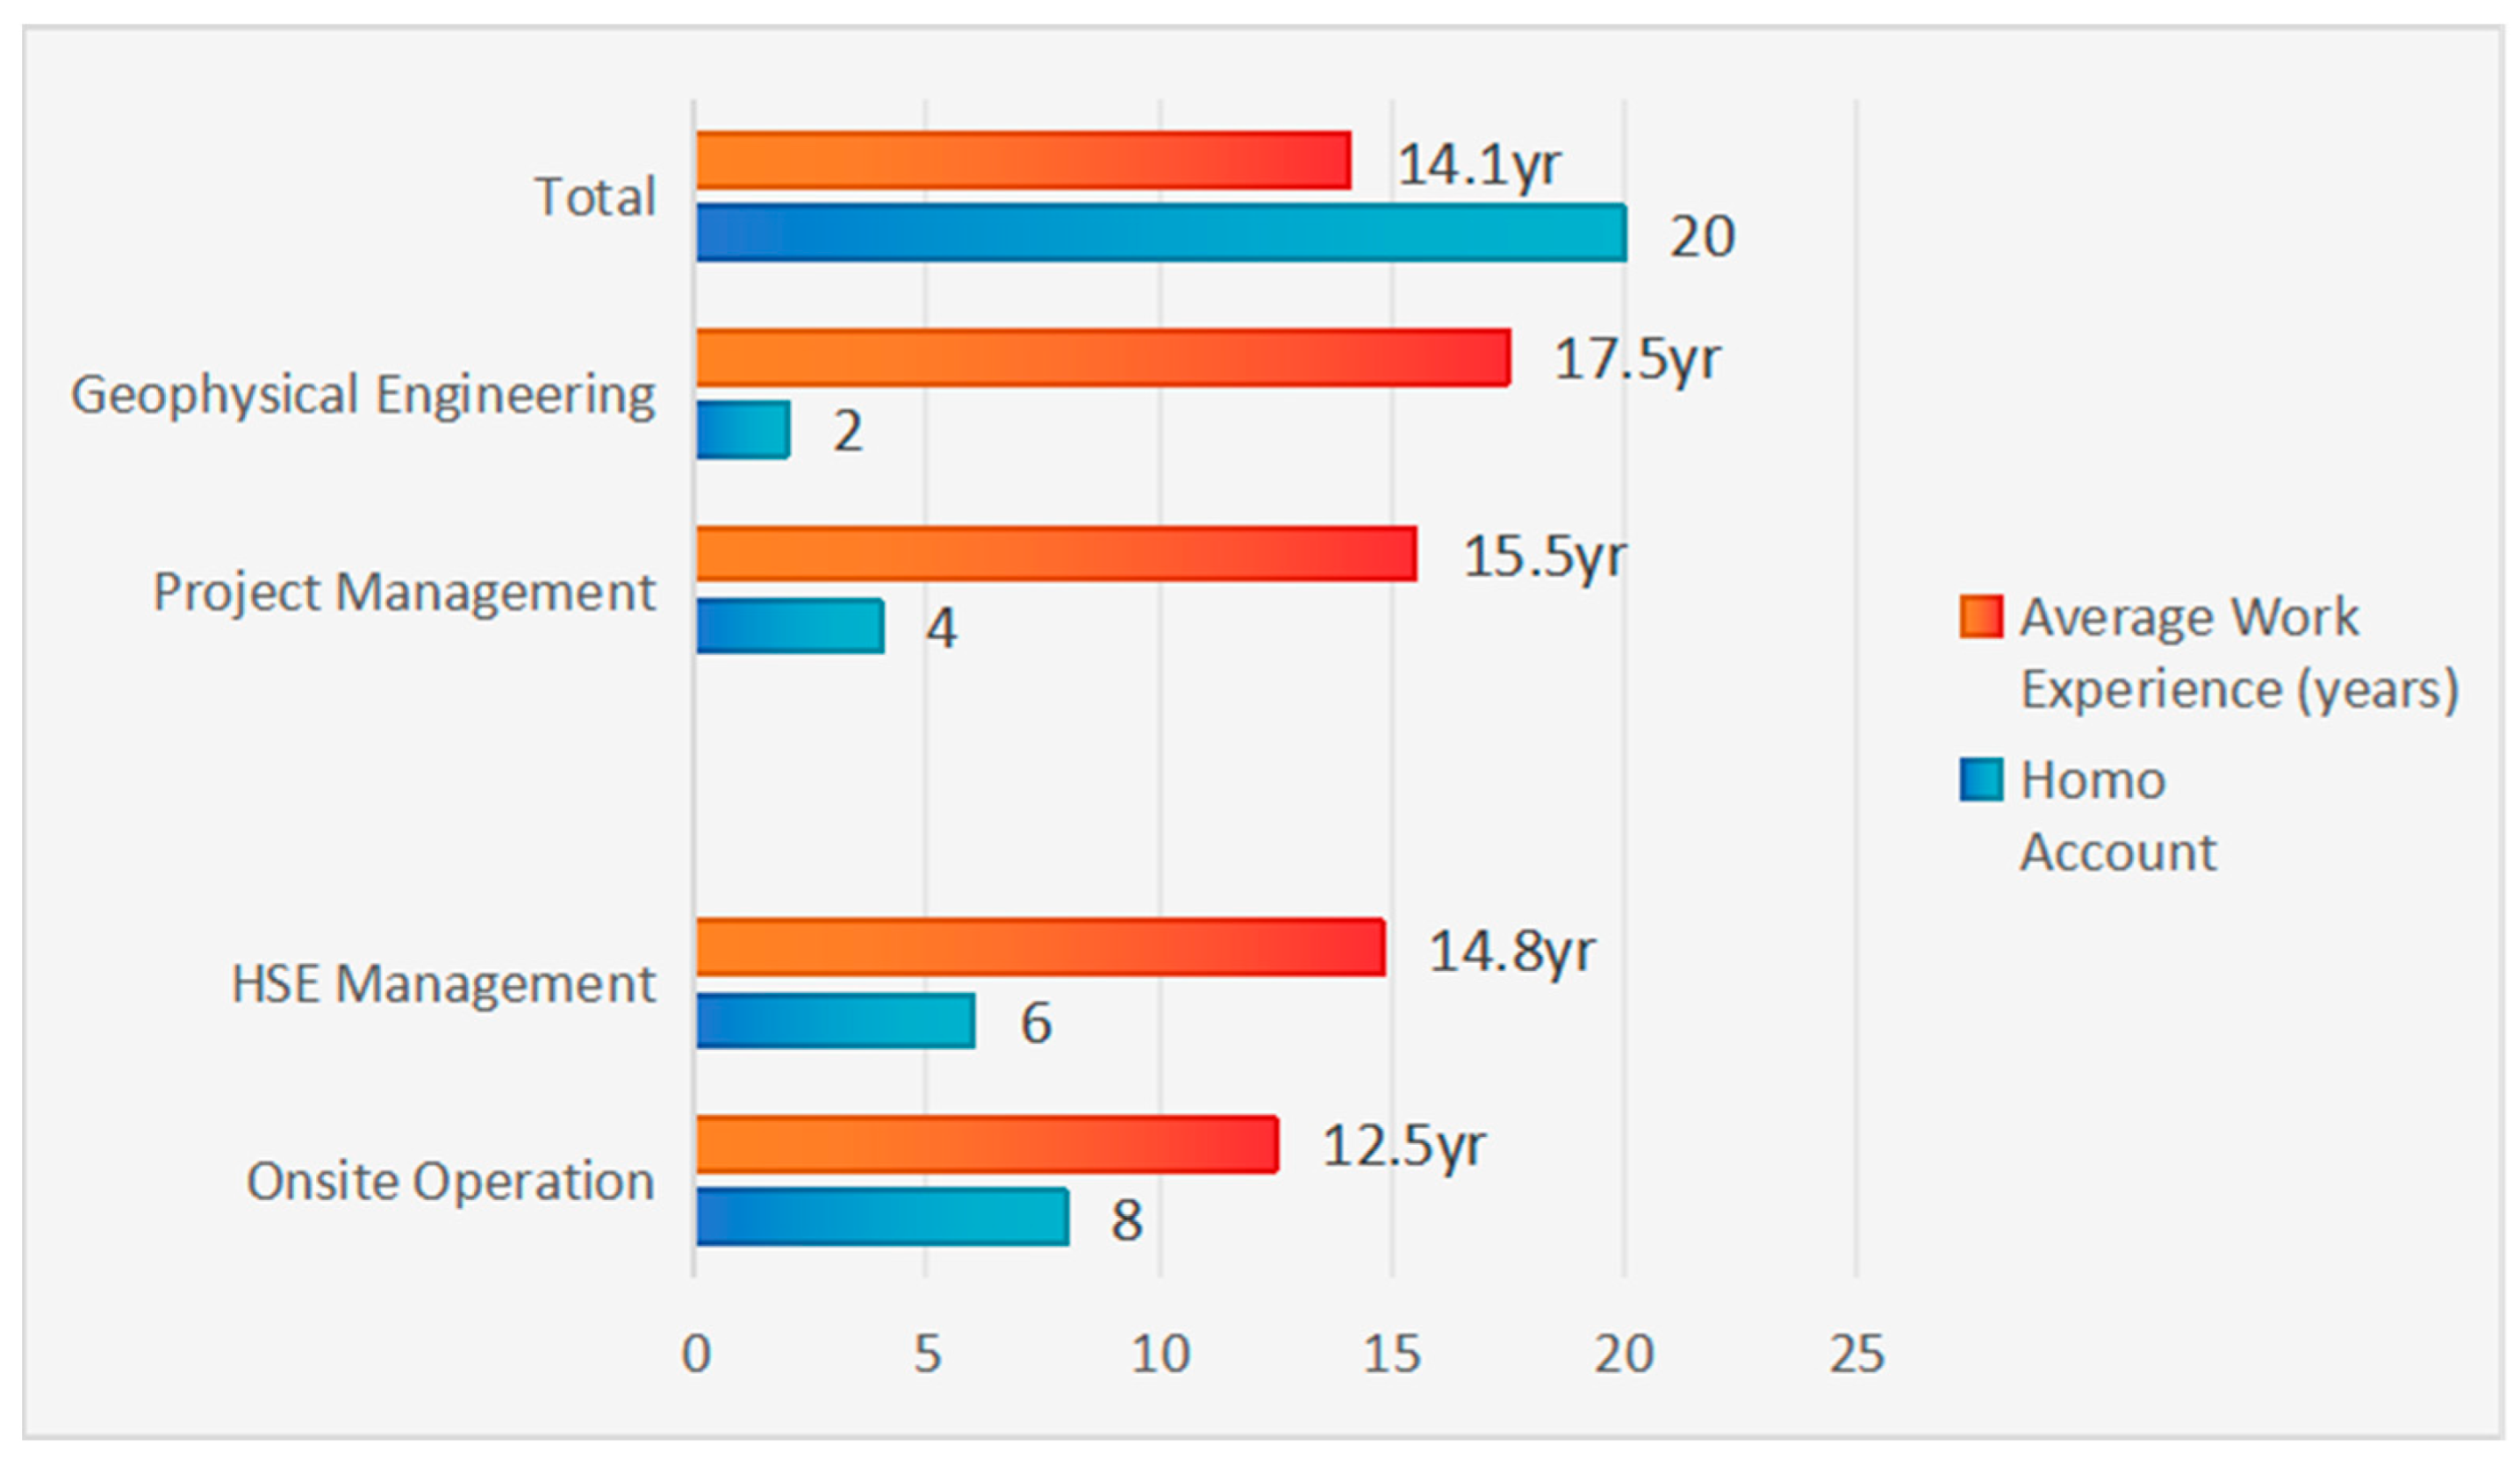
The expert elicitation employed a structured two round Delphi process. In the first round, all panelists independently scored the risk indicators. This was followed by a revision phase where experts reviewed anonymized summary feedback and adjusted their scores accordingly. To incorporate diverse perspectives, the panel was strategically assembled with twenty experts from across Sinopec’s seismic acquisition units. It included representatives from field operations (8 experts), safety management (HSE, 6 experts), project management (4 experts), and geophysical engineering (2 experts) (Figure 3).
This composition integrated firsthand operational knowledge, systematic safety principles, strategic oversight, and technical expertise. Quotas based on Sinopec’s typical project structure were used during expert recruitment to ensure balanced domain representation and prevent over representation from any single unit. This iterative, consensus building approach enhanced the reliability and objectivity of the final results by mitigating individual judgment biases [39].
To ensure the credibility and validity of the evaluation, a Delphi panel was convened, comprising twenty subject matter experts. The expert selection process was governed by the following rigorous criteria:
  • Professional expertise in seismic acquisition safety, including domains such as health, safety, and environment (HSE) management, field operations, geophysical engineering, and risk assessment.
  • Industry experience of no less than ten years in the oil and gas sector, with at least five years specifically devoted to seismic acquisition projects [31].
  • Institutional diversity, ensuring representation from Sinopec, academic institutions, and independent safety consulting organizations to minimize potential evaluation bias.
Data Collection Methodology Description:
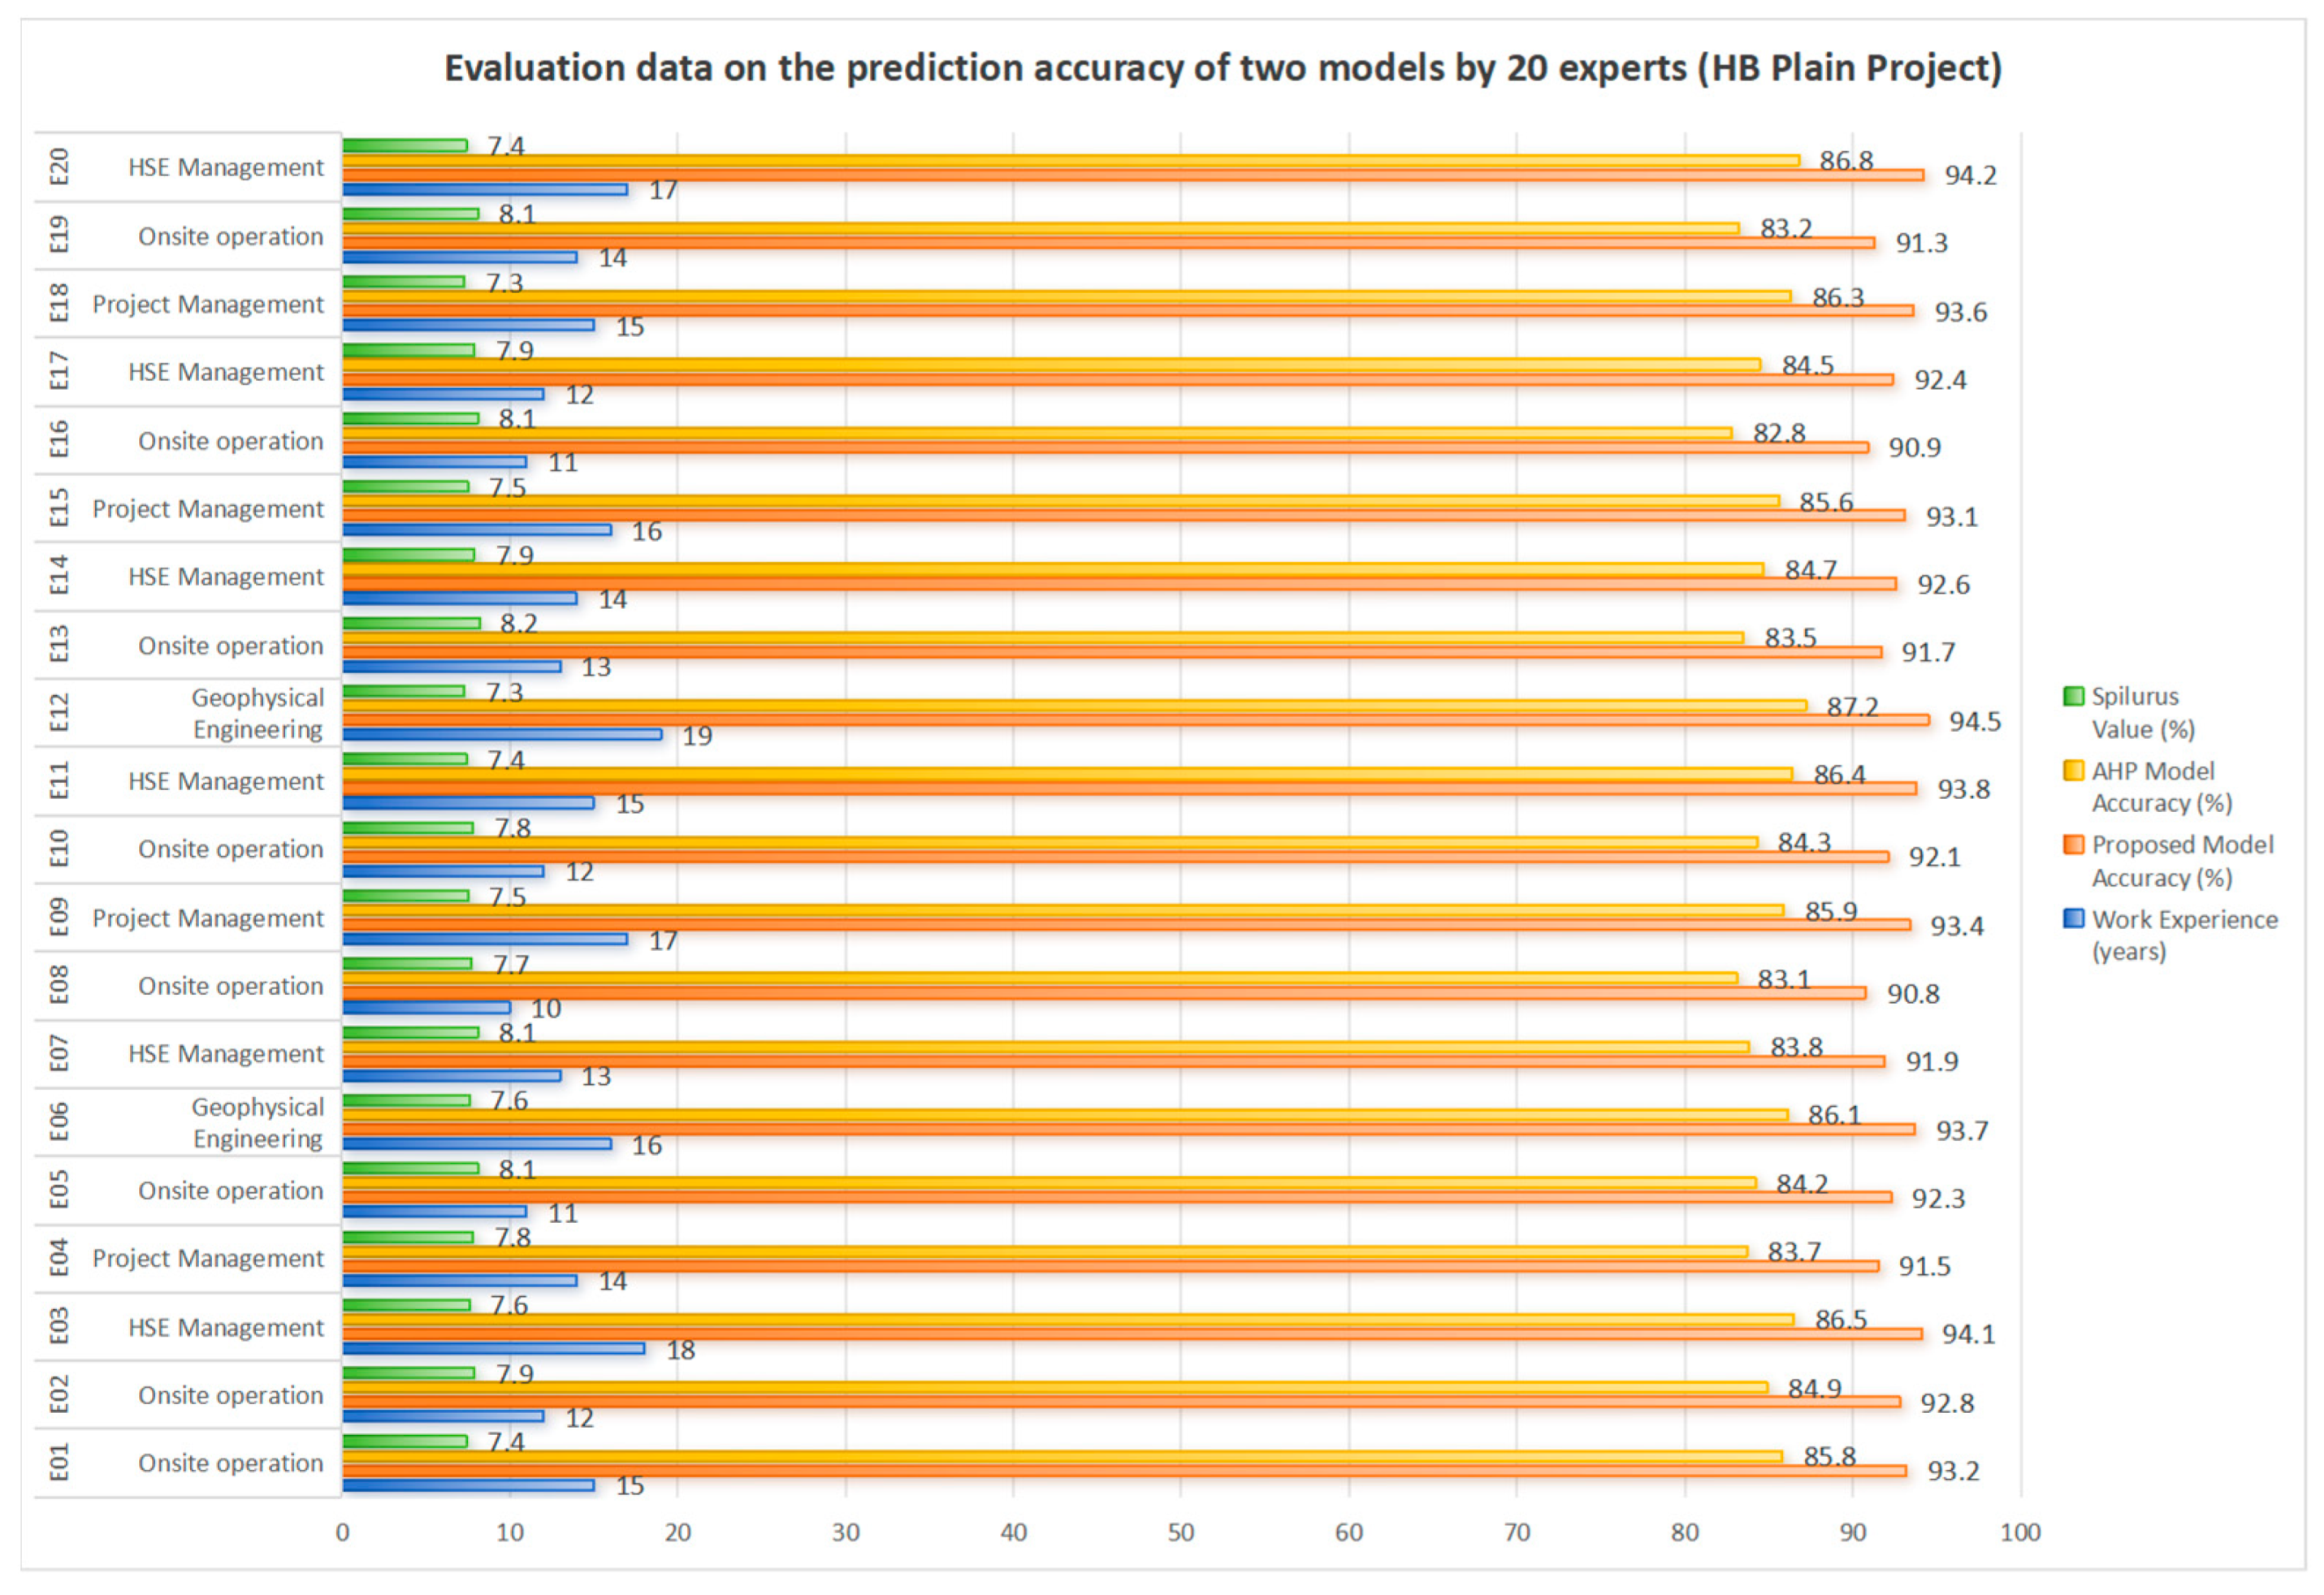
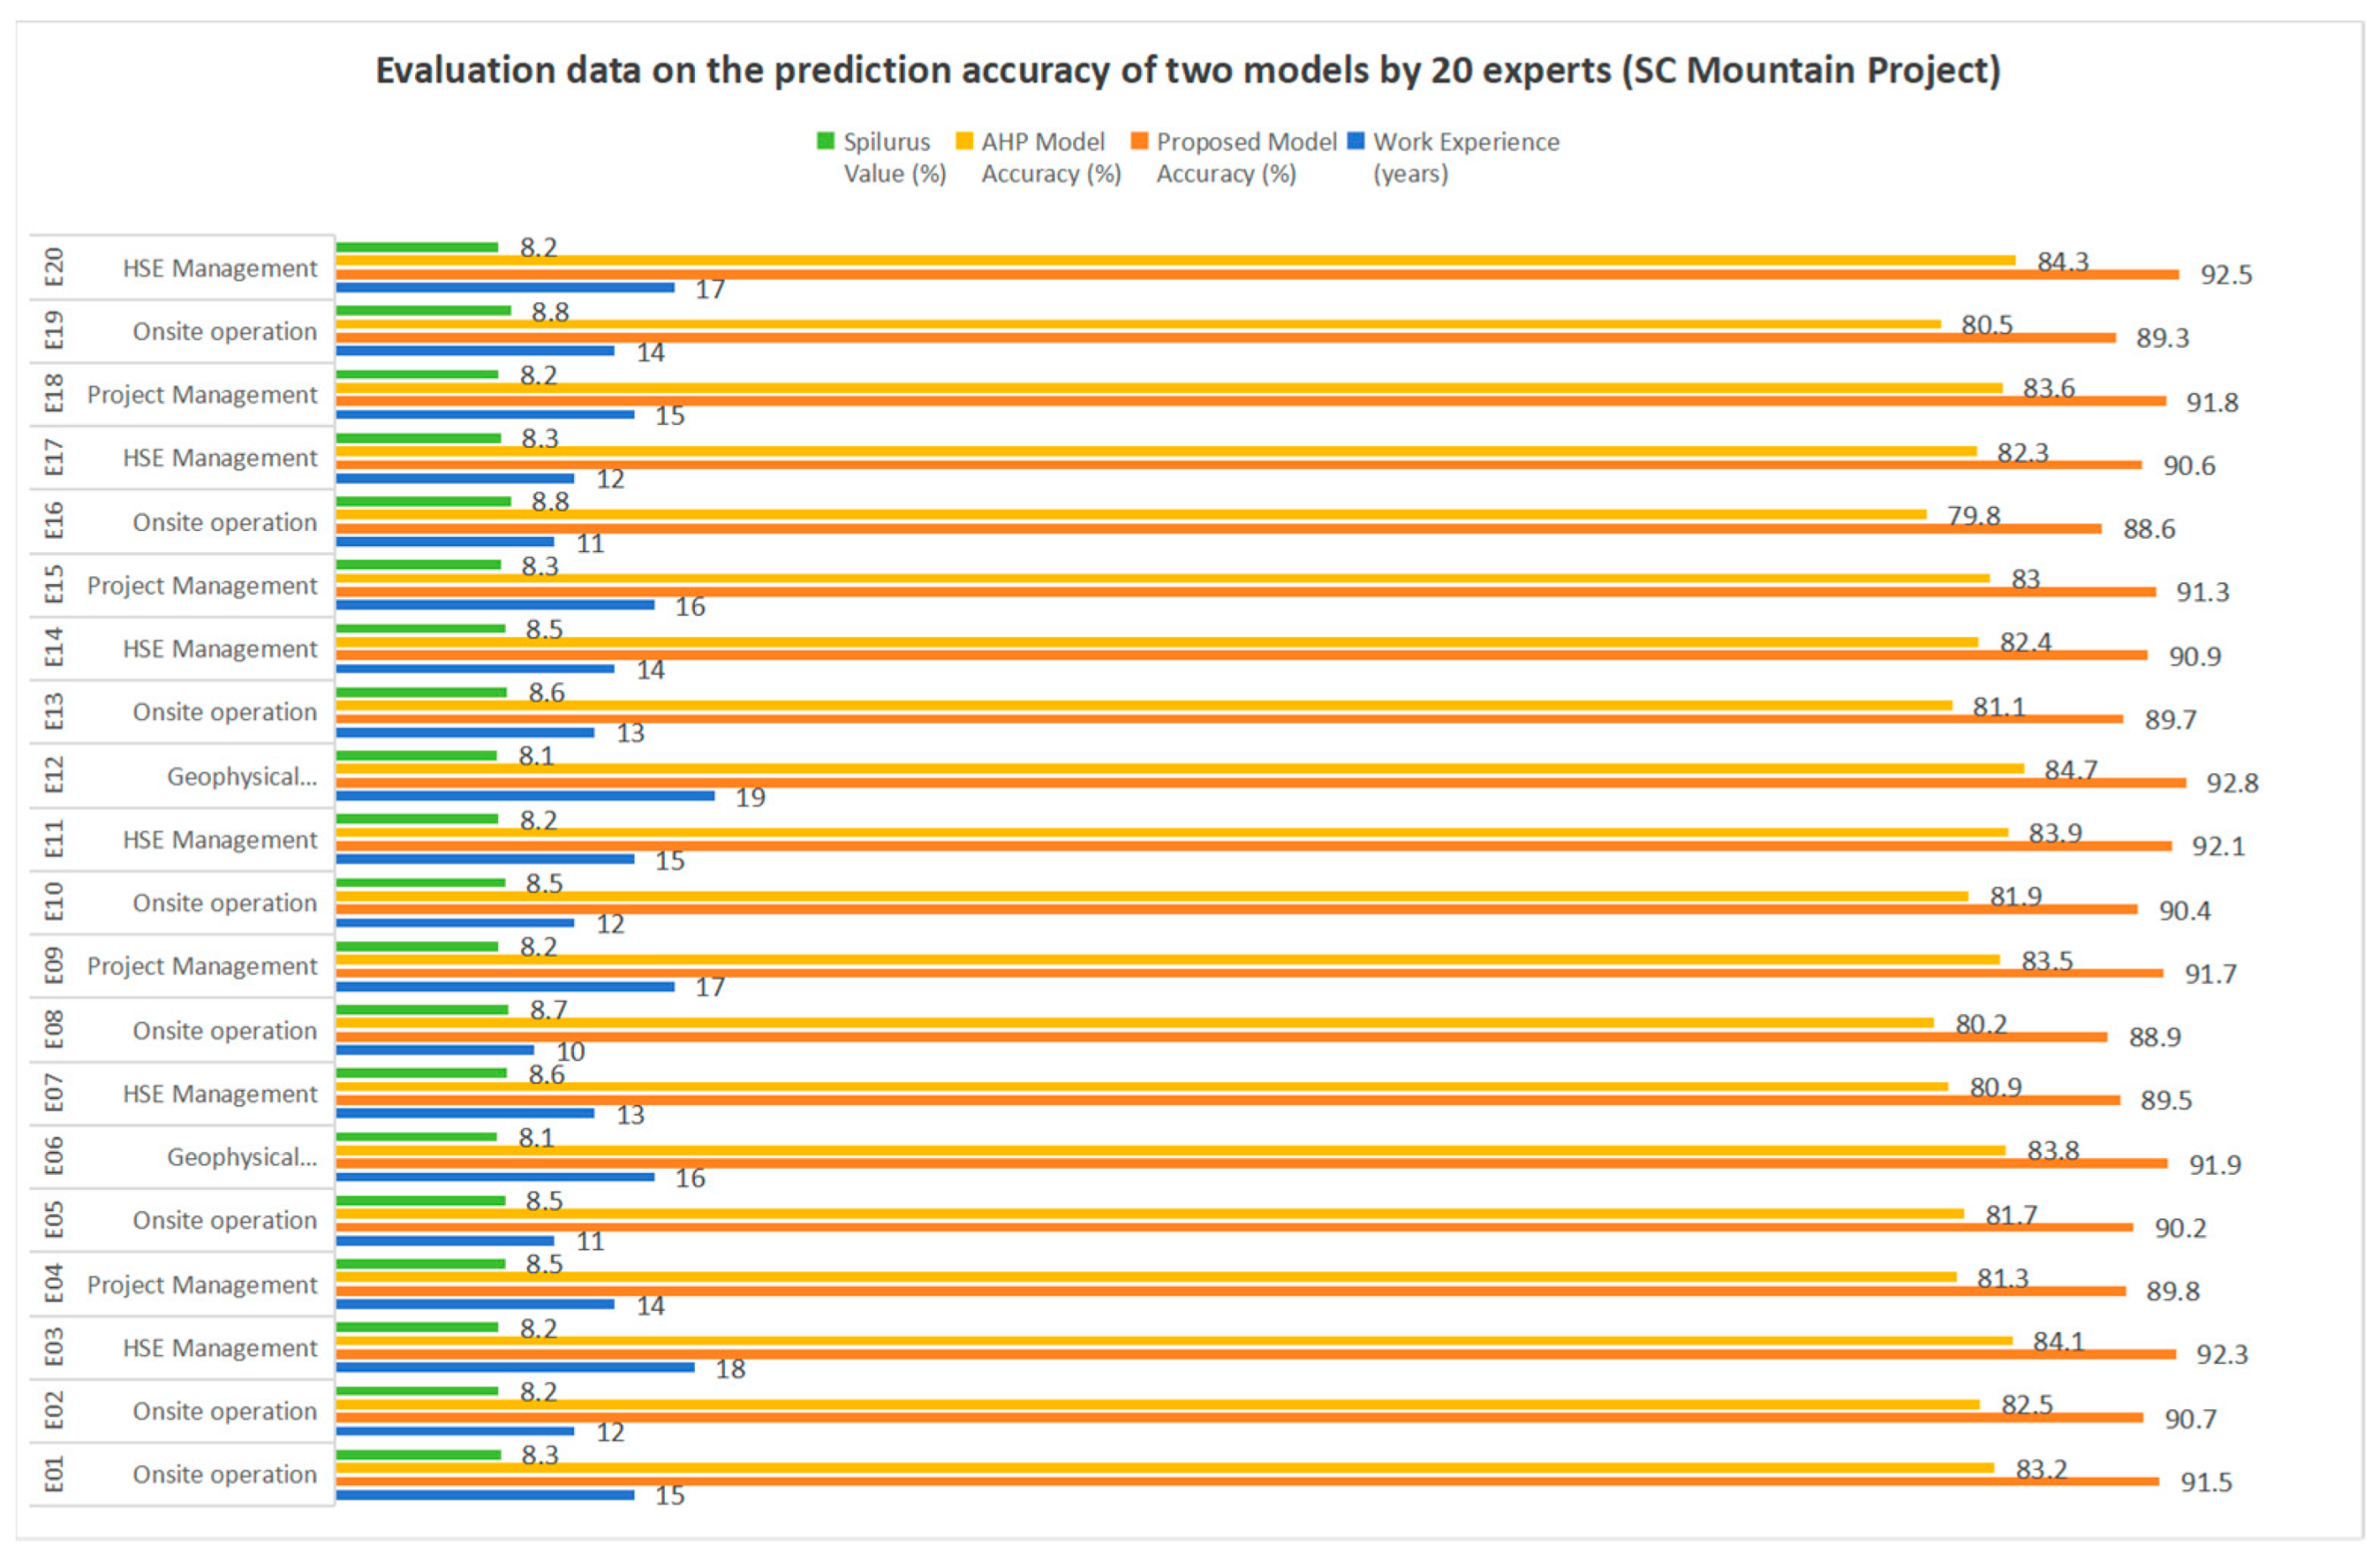
To uphold the principles of objectivity and consistency in expert assessments, a rigorous evaluation procedure was implemented. Each evaluator independently analyzed the two project cases (the HB plain and the SC mountainous terrain) with both the proposed model and the conventional Analytic Hierarchy Process (AHP) (Figure 4). The study incorporated a blinded design, meaning experts were not informed about the specific model they were assessing at any time, thereby mitigating assessment bias (Figure 5 and Figure 6). A common set of input data and standardized evaluation criteria were provided to all participants to establish a foundation for fair comparison. To further control for confounding factors, the sequence of model presentation was randomized per expert, effectively eliminating order effects. Collectively, these measures ensure that the collected data accurately captures the genuine performance disparities between the models.
Accuracy Calculation Benchmark:
The prediction accuracy was calculated using the following formula:
P Accuracy   =   ( 1   P Predicted   Risk   Value     P Actual   Incident   Rate P Actual   Incident   Rate )   ×   100%
Internal consistency: Cronbach’s α = 0.87; Inter rater reliability: ICC (2,1) = 0.82; Test retest reliability (after 2 weeks): r = 0.89
The Actual Incident Rates were derived from historical safety records:
  • HB Project Actual Incident Rate: 0.34%
  • SC Project Actual Incident Rate: 0.41%
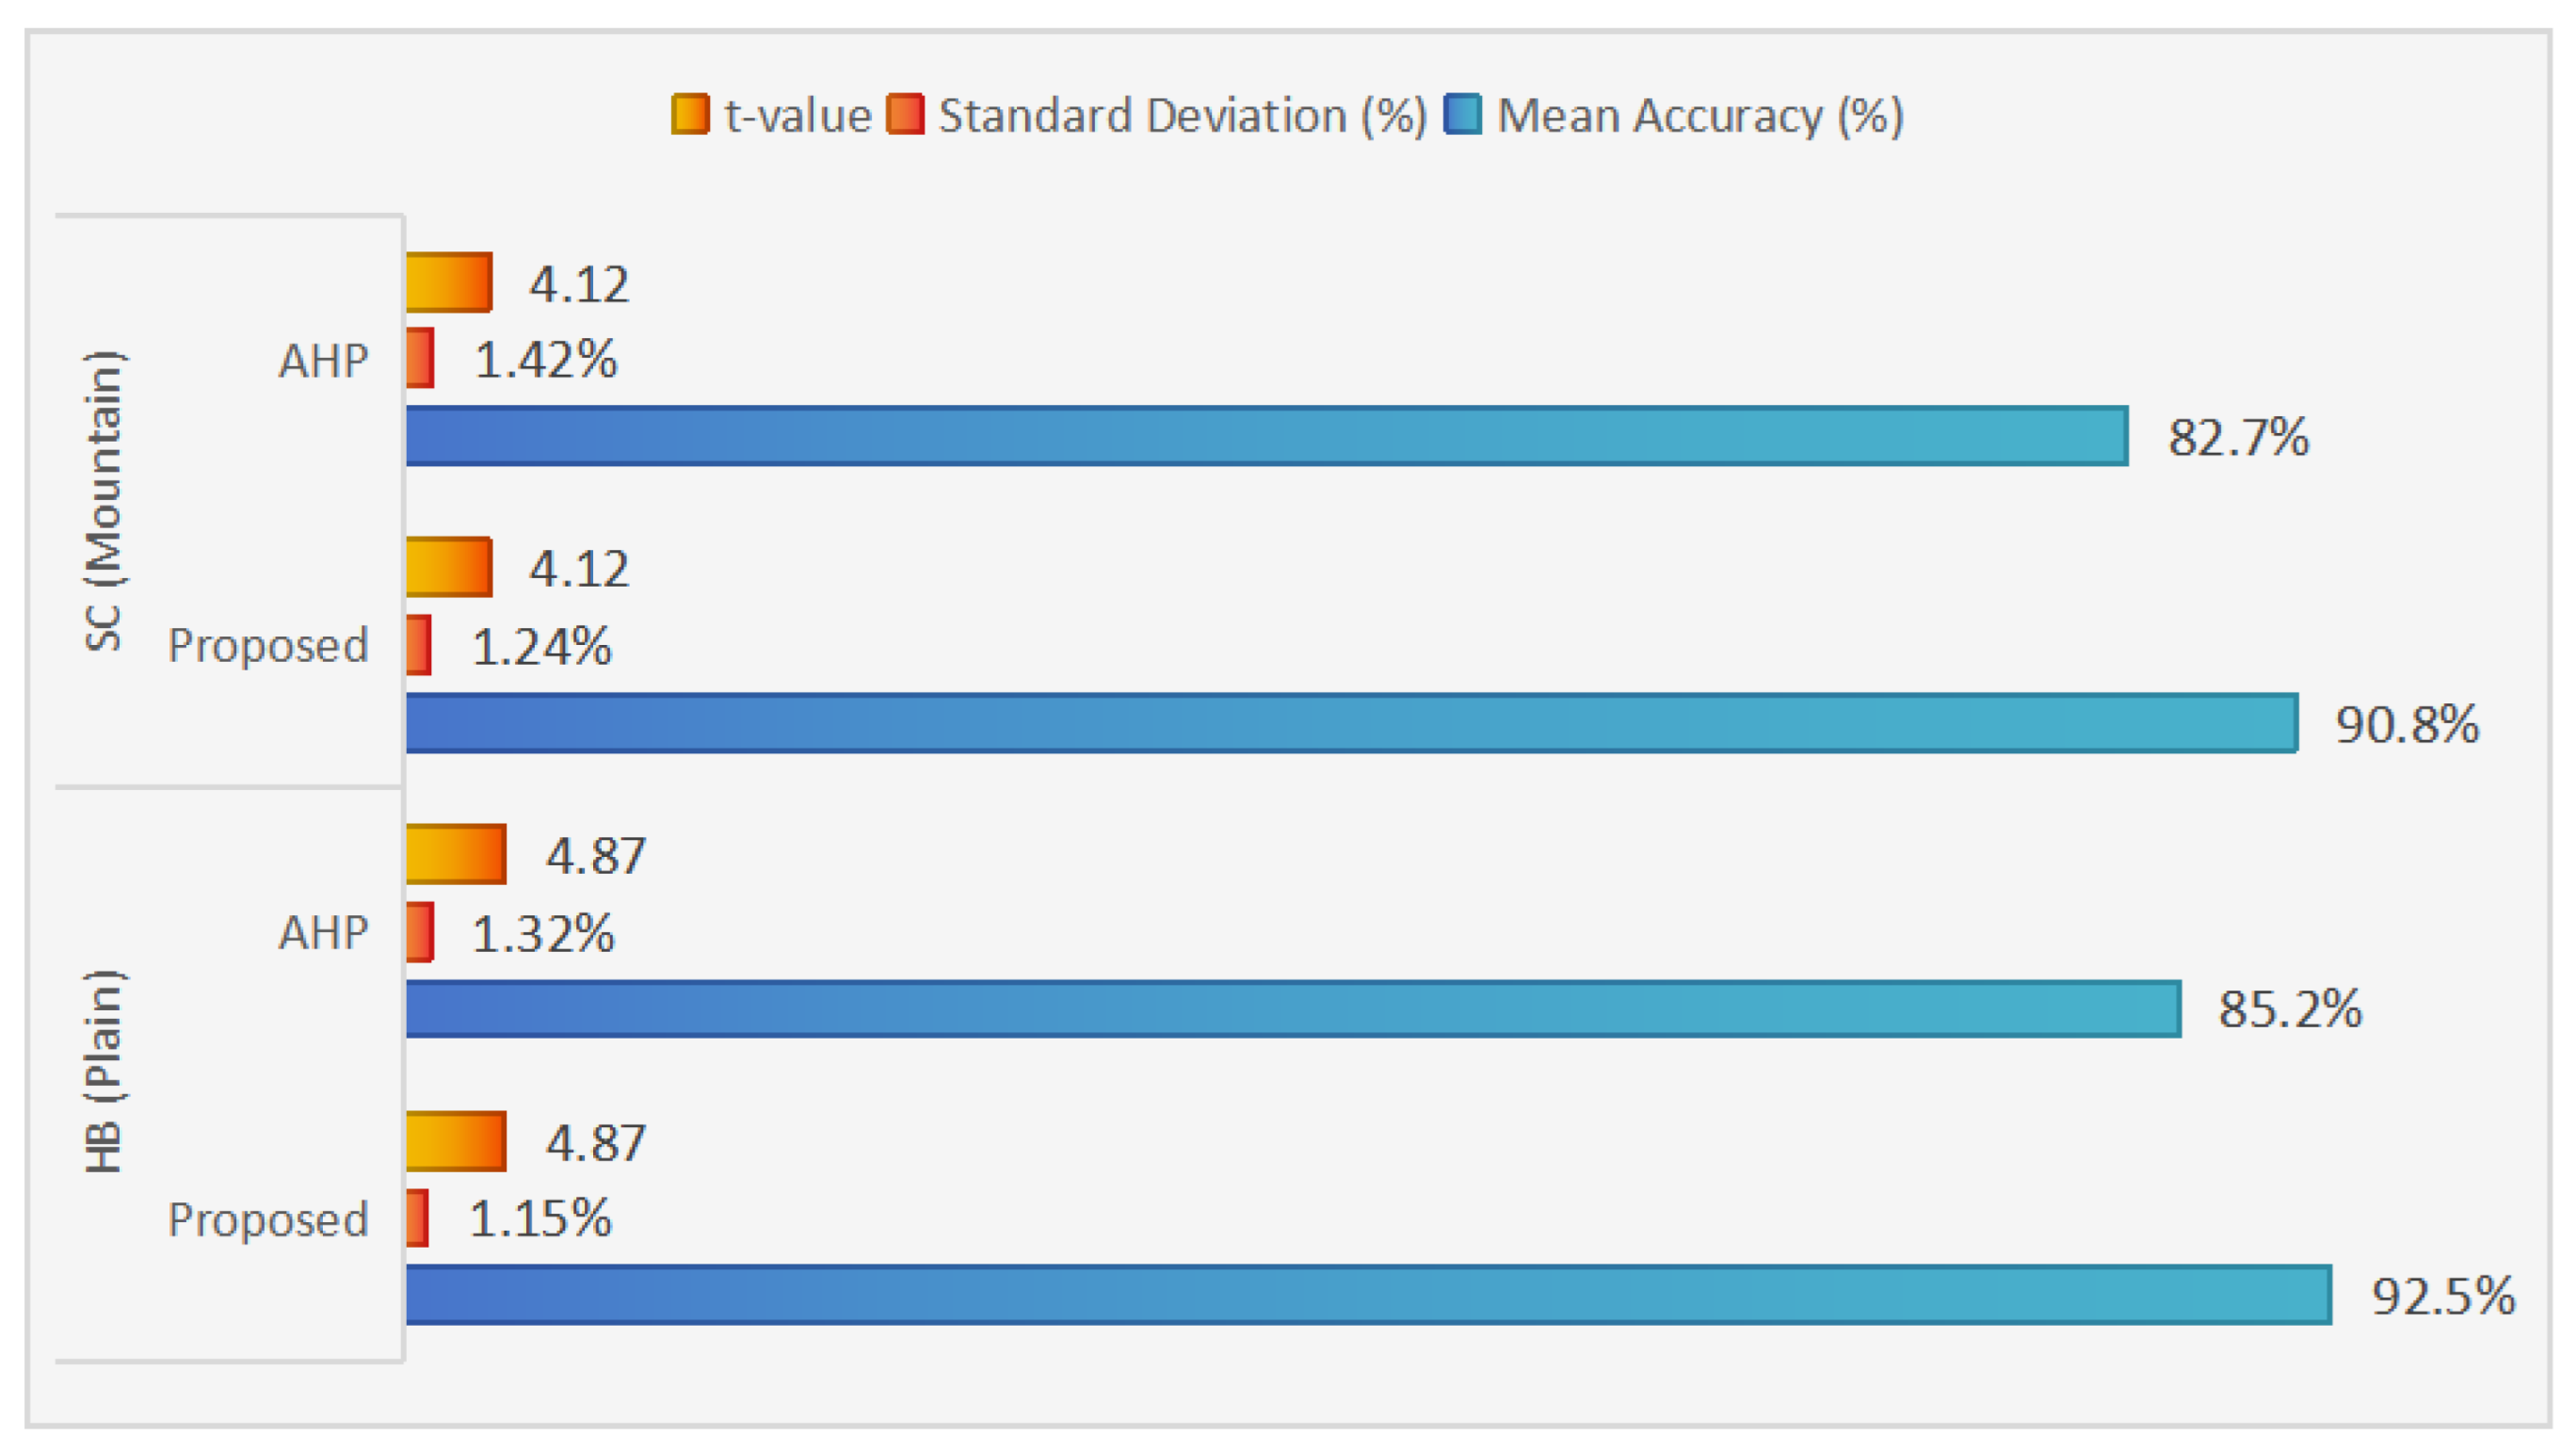
Proposed Model: Mean = 92.5%, Standard Deviation = 1.15%, Range = [90.8%, 94.5%]; AHP Model: Mean = 85.2%, Standard Deviation = 1.32%, Range = [82.8%, 87.2%];
Average Difference: +7.3%, Standard Deviation = 0.28%.
Proposed model: Mean = 90.8%, standard deviation = 1.24%, range = [88.6%, 92.8%]; AHP model: Mean = 82.7%, standard deviation = 1.42%, range = [79.8%, 84.7%]; Mean difference: +8.1%, standard deviation = 0.23%.
An analysis of variance (ANOVA) was conducted to investigate the influence of expert domain specialization (Field Operations, HSE, Management, Technical) on scoring tendencies. The test, performed on the first round defuzzified scores, showed no statistically significant differences (F = 1.24, p = 0.33). This result confirms a shared perception of risk importance across disciplines, suggesting that the corporate safety culture and Delphi process effectively aligned expert judgment. Consequently, the diverse composition of the panel is justified, as it enriched the assessment without leading to systematic bias.
A ±10% range was applied to examine the stability of the calculated fuzzy risk indices, which corresponds approximately to one standard deviation of the expert rating variability (σ ≈ 9.7%) observed during the Delphi evaluation. This range therefore reflects the actual dispersion of expert judgments rather than an arbitrary tolerance.

6.1. Delphi Process Implementation

6.1.1. Expert Elicitation and Consensus Building

A structured two round Delphi process was implemented to systematically capture expert judgments. In the first round, twenty domain experts independently evaluated all risk indicators using predefined linguistic scales. To ensure robustness in aggregation, we employed a dual approach: fuzzy weights were consolidated using the geometric mean operator to minimize the impact of potential outliers, while expert consensus was quantitatively monitored through Kendall’s coefficient of concordance (W) calculated after each evaluation round.
Between rounds, a comprehensive feedback report was distributed to all panelists. This anonymous summary presented key statistical metrics—median values and interquartile ranges (IQRs) of defuzzified scores—along with anonymized qualitative comments explaining rating rationales. Experts used this synthesized collective feedback to refine their initial assessments in the second round.
The Delphi process effectively promoted convergence among panelists. First round analysis identified significant disagreement in specific risk categories, particularly “Sudden Illness Risk” and “Drowning Risk,” where larger IQRs reflected divergent opinions regarding historical frequency versus potential severity. Following the structured feedback intervention, consensus improved substantially: Kendall’s W increased from 0.72 (p < 0.001) to 0.85 (p < 0.001), while IQRs narrowed considerably across all indicators. The geometric mean aggregation method effectively moderated the influence of persistent outlier opinions while preserving their input in the final model.

6.1.2. Process Termination and Consensus Validation

The Delphi process concluded after the second round based on predetermined stopping criteria. These required: (1) average inter round score changes below 5%, and (2) over 85% of ratings falling within one scale point of the median. With 98% of indicators meeting these thresholds after the second round, collective judgment was deemed sufficiently stable for reliable aggregation. Final indicator weights were computed as the geometric mean of second round scores.

6.1.3. Quantification of Factor Interdependencies

Through the Delphi process, experts explicitly assessed pairwise interactions between risk factors, evaluating compensatory relationships where improvements in one area might offset deficiencies in another. These qualitative assessments were systematically transformed into quantitative parameters via the λ-fuzzy measure. The resulting global interaction parameter λ, computed from Equation (3), mathematically captures the aggregate interactive effects among all risk criteria, characterizing both the nature (synergistic/substitutive) and strength of interdependencies.

6.1.4. Experimental Validation Framework

To rigorously validate the proposed Choquet integral-based model, we conducted comprehensive experimental analysis involving two real world case studies and comparative bench marking against established risk assessment methodologies. This validation framework ensures robust evaluation of the model’s practical efficacy and comparative performance [40]. Although the expert scoring bias was controlled through the Delphi process and statistical tests, subtle differences in risk perception among experts with different professional backgrounds may still exist.

6.2. Experimental Setup and Baseline Models

Case Studies:
The proposed model was applied to two representative Sinopec seismic acquisition projects, selected to capture contrasting operational environments and risk profiles.
(1)
HB Project: Conducted in a water networked plain region characterized by complex hydrological conditions.
(2)
SC Project: Conducted in a mountainous area with rugged terrain and variable weather conditions.

6.2.1. Risk Quantification and Classification Framework

  • Risk Quantification Procedure:
The HB seismic acquisition project’s overall risk level was quantified as a triangular fuzzy number through systematic integration of expert evaluations and predefined risk matrices (Table 3, Table 4 and Table 5). This derivation followed a structured three stage methodology:
First, domain experts provided linguistic assessments (e.g., “Hazardous”) for all 33 tertiary indicators, which were transformed into triangular fuzzy numbers using the standardized mapping in Table 1. Subsequently, these fuzzy evaluations were aggregated through the Choquet integral framework an advanced methodology that explicitly incorporates risk factor interactions via the λ fuzzy measure. This process generated consolidated risk scores for both secondary and primary indicators. Ultimately, the project level fuzzy number R was synthesized through aggregation of all primary indicator scores, thereby holistically capturing operational uncertainties across all project dimensions [41].
b.
Risk Classification Mechanism
The derived triangular fuzzy number R serves as a composite risk index whose positioning relative to the established five-level fuzzy scale (Table 1) determines the project’s final risk classification. This classification is operationalized through membership degree analysis, calculating R’s degree of belonging to each semantic membership function spanning from “Highly Safe” to “Highly Hazardous”.
For illustration, the computed value RHB = (0.000492, 0.022619, 0.464436) demonstrates predominant membership in the “Highly Safe” and “Safe” categories. This specific membership profile definitively positions the HB project’s risk at the lower spectrum of the risk continuum, indicating effectively managed operational risk levels throughout the project lifecycle.
The background color in Table 6 corresponds to the colors of different RI grades in Table 3. Table 3 combined the occurrence frequency of Table 6 with Sinopec’s internal enterprise standards to obtain the occurrence frequency weight. The HB project was comprehensively evaluated using the hazard level distribution (matrix s) method from seismic acquisition projects. The comprehensive risk assessment value was calculated by cross-referencing the data in Table 6 with those in Table 4 through matrix s.
The safety risk assessment model, developed through evaluations by twenty domain experts across personnel and equipment indicators, produced a normalized risk value. This value falls between the “Very Safe” (0, 0, 0.25) and “Safe” (0, 0.25, 0.5) categories on the standardized fuzzy scale. This placement indicates that while general operational safety was effectively maintained, residual risks remain present.
Consequently, these findings underscore the necessity of continuous safety monitoring and proactive management throughout the entire project lifecycle.
Based on these findings, we conclude that continuous safety monitoring and active management over the project life cycle can help define the scope of potential risks. This approach reduces the difficulty and workload of risk detection, thereby improving the overall level of project management. Subsequently, the specific indicators of the entire project require evaluation. The detailed evaluation criteria are presented in Table 7.
For effective risk control, quantitative analysis of specific risk factors is imperative. The fuzzy weight of the i-th indicator under the j-th evaluation criterion (where j = 1, 2, …, n) was calculated using Formula (7):
X ~ i j = ( X ~ i j 1 W ~ i j 1 X ~ i j 2 W ~ i j 2 , , X ~ i j l i W ~ i j l i ) / l j
The fuzzy weight value W ~ ij was obtained from Formula (8).
W ~ ij = ( W ~ ij 1 W ~ ij 2 , ,   W ~ ijlj ) / l j
The fuzzy weight value W ~ ij, obtained from Formula (8), was defuzzified into a crisp value using the relative distance method. This approach calculates the relative distance between each triangular fuzzy number and two reference points—the negative ideal point (0, 0, 0) and the positive ideal point (1, 1, 1)—within the fuzzy number space. The crisp value W ~ ij is defined as:
W ~ ij   =   d / ( d + d + )
where d is the distance from W ~ ij to the negative ideal point, and d+ is the distance to the positive ideal point. For a triangular fuzzy number (a, b, c), these distances can be computed using vertex geometry. This method offers a robust and intuitive measure of the fuzzy number’s central tendency. As an example, the calculation for W ~ 11 is:
W ~ 11   =   a ( w ~ 11 ) / [ a ( w ~ 11 )   +   a + ( w ~ 11 ) ]   =   0.79
as defined in Formula (9) where d and d+ denote the distances to the negative and positive ideal points, respectively.
W ~ i j = 1 j ( Σ 1 j x ~ i j 2 ) 1 j ( Σ 1 j x ~ i j 2 ) + 1 j ( Σ 1 j ( 1 x ~ i j ) 2 )
Set μij = W ~ ij , then substitute into Formula (3) to compute the parameter λ.
Using Formula (7), calculate the corresponding fuzzy evaluation value W ~ ij . Apply the relative distance formula to defuzzify W ~ ij , obtaining the crisp value W ~ ij .
Rank all defuzzified evaluation criteria values W ~ ij in descending order to analyze the risk level of evaluation criteria for the i-th indicator.
Substitute the λ value and μij values into Formula (2) to compute the fuzzy measures μλ for each evaluation criterion. The values of ij and μλ were substituted into Formula (4) to calculate the integrated Choquet integral value, Fi (i = 1, 2, …, m).
All Fi values were ranked to determine the relative risks among secondary indicators.
Comparisons of Fi magnitudes were used to identify maximum risk magnitudes among secondary indicators.
The fuzzy weights W ~ ij for human and equipment related criteria were calculated as follows:
W ~ 11 = (0.438, 0.688, 0.938)
W ~ 12 = (0.500, 0.75, 0.917)
W ~ 13 = (0.188, 0.313, 0.563)
W ~ 14 = (0.167, 0.333, 0.583)
W ~ 15 = (0.5, 0.75, 0.9)
W ~ 16 = (0.75, 1, 1)
W ~ 17 = (0.4, 0.65, 0.85)
W ~ 18 = (0.5, 0.75, 0.917)
W ~ 19 = (0.083, 0.25, 0.5)
Defuzzification of these fuzzy numbers yielded the crisp values:
W ¯ 11 = d w ~ 11 d w ~ 11 + d w ~ 11 = 0.79
W 12 = 0.21, W 13 = 0.24, W 14 = 0.34, W 15 = 0.77, W 16 = 0.74, W 17 = 0.91, W 18 = 0.95, W 19 = 0.76
By setting μ1j = W1j and substituting into Formula (3), the value of λ was computed:
λ = −0.999997352;
The parameter λ in the λ-fuzzy measure plays a critical role in quantitatively characterizing the interaction between different risk factors. Its value is derived from Equation (3) based on the fuzzy densities of all attributes. As outlined in Section 2:
λ = 0: indicates factor independence and additivity.
λ > 0: suggests a complementary or synergistic effect.
λ < 0: indicates a redundant or substitutive effect.
The computed parameter λ = −0.999997352 reveals a pronounced substitutive characteristic among equipment related risk factors. This finding has practical justification: enhancements in one area, such as improved vehicle maintenance reducing mechanical failure risk, can partially compensate for shortcomings in another area, like unprofessional transportation practices. The proposed model successfully captures these compensatory dynamics, demonstrating a fundamental advantage over conventional models that presume factor independence.
Using Formula (7), the fuzzy evaluation values 1j for the equipment related indicators were subsequently calculated and defuzzified, yielding the following results:
X - 11   =   0.79 ,   X - 12   =   0.83 ,   X - 13   =   0.25 ,   X - 14   =   0.27 ,   X - 15   =   0.82 ,   X - 16   =   0.98 ,   X - 17   =   0.72 ,   X - 18   =   0.84 ,   X - 19   =   0.16 .
The ranking of 1j values was:
X - 16   >   X - 18   >   X - 12   >   X - 15   >   X - 11   >   X - 17   >   X - 14   >   X - 13   >   X - 19
Formula (2) was then applied to compute μλ values:
μλ(16) = 0.98
μλ(16, 18) = 0.996801
μλ(16, 18, 12) = 0.999456
μλ(16, 18, 12, 15) = 0.999902
μλ(16, 18, 12, 15, 11) = 0.999979
μλ(16, 18, 12, 15, 11, 17) = 0.999994
μλ(16, 18, 12, 15, 11, 17, 14) = 0.999996
μλ(16, 18, 12, 15, 11, 17, 14, 13) = 0.999997
μλ(16, 18, 12, 15, 11, 17, 14, 13, 19) = 1
Finally, Formula (4) was applied to compute the integrated Choquet values, yielding comprehensive risk scores of F1 = 0.9772 for equipment related factors and F2 = 0.8771 for personnel related factors.

6.2.2. Risk Indicator Analysis

Among personnel safety indicators, X - 25 (unsafe proximity to power lines during field operations) represented the highest risk. Conversely, X - 24 (improper wiring during aquatic activities) demonstrated the lowest risk level [34].
For equipment related indicators, X - 16 (unprofessional transportation) recorded the most significant risk, while X - 19 (adverse weather conditions) showed the minimal risk exposure.
Overall Project Risk Assessment:
The consolidated project evaluation revealed that equipment related risk (F1= 0.9772) substantially exceeded personnel related risk (F2 = 0.8771), establishing equipment hazards as the dominant risk source. Subsequent analysis identified unprofessional transportation ( X - 16) and unsafe power line proximity ( X - 25) as the primary risk factors in their respective categories. Both factors are frequently implicated in accidental fires and electrocution incidents.
Data Validation Framework:
To ensure historical data reliability, we implemented a multisource verification protocol. All incident reports were cross referenced against official HSE logs, maintenance records, and regulatory compliance documents. This triangulation methodology minimized under reporting bias and guaranteed that only verified incidents contributed to the actual safety performance index (Pactual). For expert evaluations, we validated judgment consistency using Kendall’s concordance coefficient as described in Section 6.1.

6.3. Case Study 2: SC Project in a Mountainous Region

The SC seismic acquisition project was conducted in a challenging mountainous environment characterized by rugged topography, dense vegetation cover, and marked climatic fluctuations. The integrated project risk was quantified as the following triangular fuzzy number:
Rmountain = (0.000611, 0.028734, 0.521789)
The normalized risk assessment positioned the SC project within the “Very Safe” to “Safe” spectrum, though with a marginally higher risk level than the HB project. A notable divergence emerged in the predominant risk factors between the two operational environments. For the mountainous SC project, geotechnical instability—particularly landslides—and mechanical injuries during uphill transport constituted the most significant risk contributors. In contrast, the HB plain region was primarily characterized by unprofessional transportation practices and unsafe proximity to power lines as its dominant safety concerns.

6.4. Comparative Analysis of Results

The Choquet fuzzy integral model demonstrated remarkable consistency despite fundamental differences in risk profiles between the two project environments. In both the mountainous SC project and plain HB project, equipment related risks (F1) consistently surpassed personnel related risks (F2). However, the observed variation in λ values (e.g., λmountain = −0.999821 versus λplain = −0.999997) revealed distinct interaction patterns directly influenced by terrain characteristics. This finding highlights the model’s sophisticated capability to not only quantify aggregate risk levels but also elucidate the underlying structure of factor interdependencies across different operational contexts.
To ensure methodological rigor and comparative fairness, we established a unified evaluation framework. All baseline models—including Analytic Hierarchy Process (AHP), Linear Weighted Model (LWM), and Traditional Risk Matrix (RM)—were assessed using identical input data derived from the final Delphi consensus. The same twenty member expert panel provided both the pairwise comparisons required for AHP and direct ratings for LWM and RM, guaranteeing consistent knowledge foundation across all methods. We systematically recorded the total assessment duration for each methodology, measuring from the initiation of expert evaluation to the generation of final risk scores.
We defined the actual safety performance index ( P a c t u a l ) as “Recordable Incident Rate”, where incident rates were calculated from historical safety records of completed projects with comparable terrain and operational scope. This established an objective, quantitatively grounded benchmark for validating predictive accuracy across models. To contextualize our approach within current methodological landscape, we incorporated a comparison with a Fuzzy Analytic Network Process (Fuzzy ANP) model [42]. Implemented using Super Decisions 3.2 software, this contemporary benchmark captures certain interdependencies through its network structure, providing a relevant performance reference.
Model performance was quantified using two principal metrics:
Assessment Efficiency (T): Measured in minutes, representing the total expert time required to complete risk assessment using each method, with lower values indicating superior efficiency.
Prediction Accuracy (PA): Calculated as P A = 1 ( | P p r e d P a c t u a l | / P a c t u a l ) , where P p r e d represents the model’s predicted risk score and P a c t u a l the historically derived safety performance index. Higher values indicate better predictive accuracy.

6.5. Performance Superiority and Statistical Validation

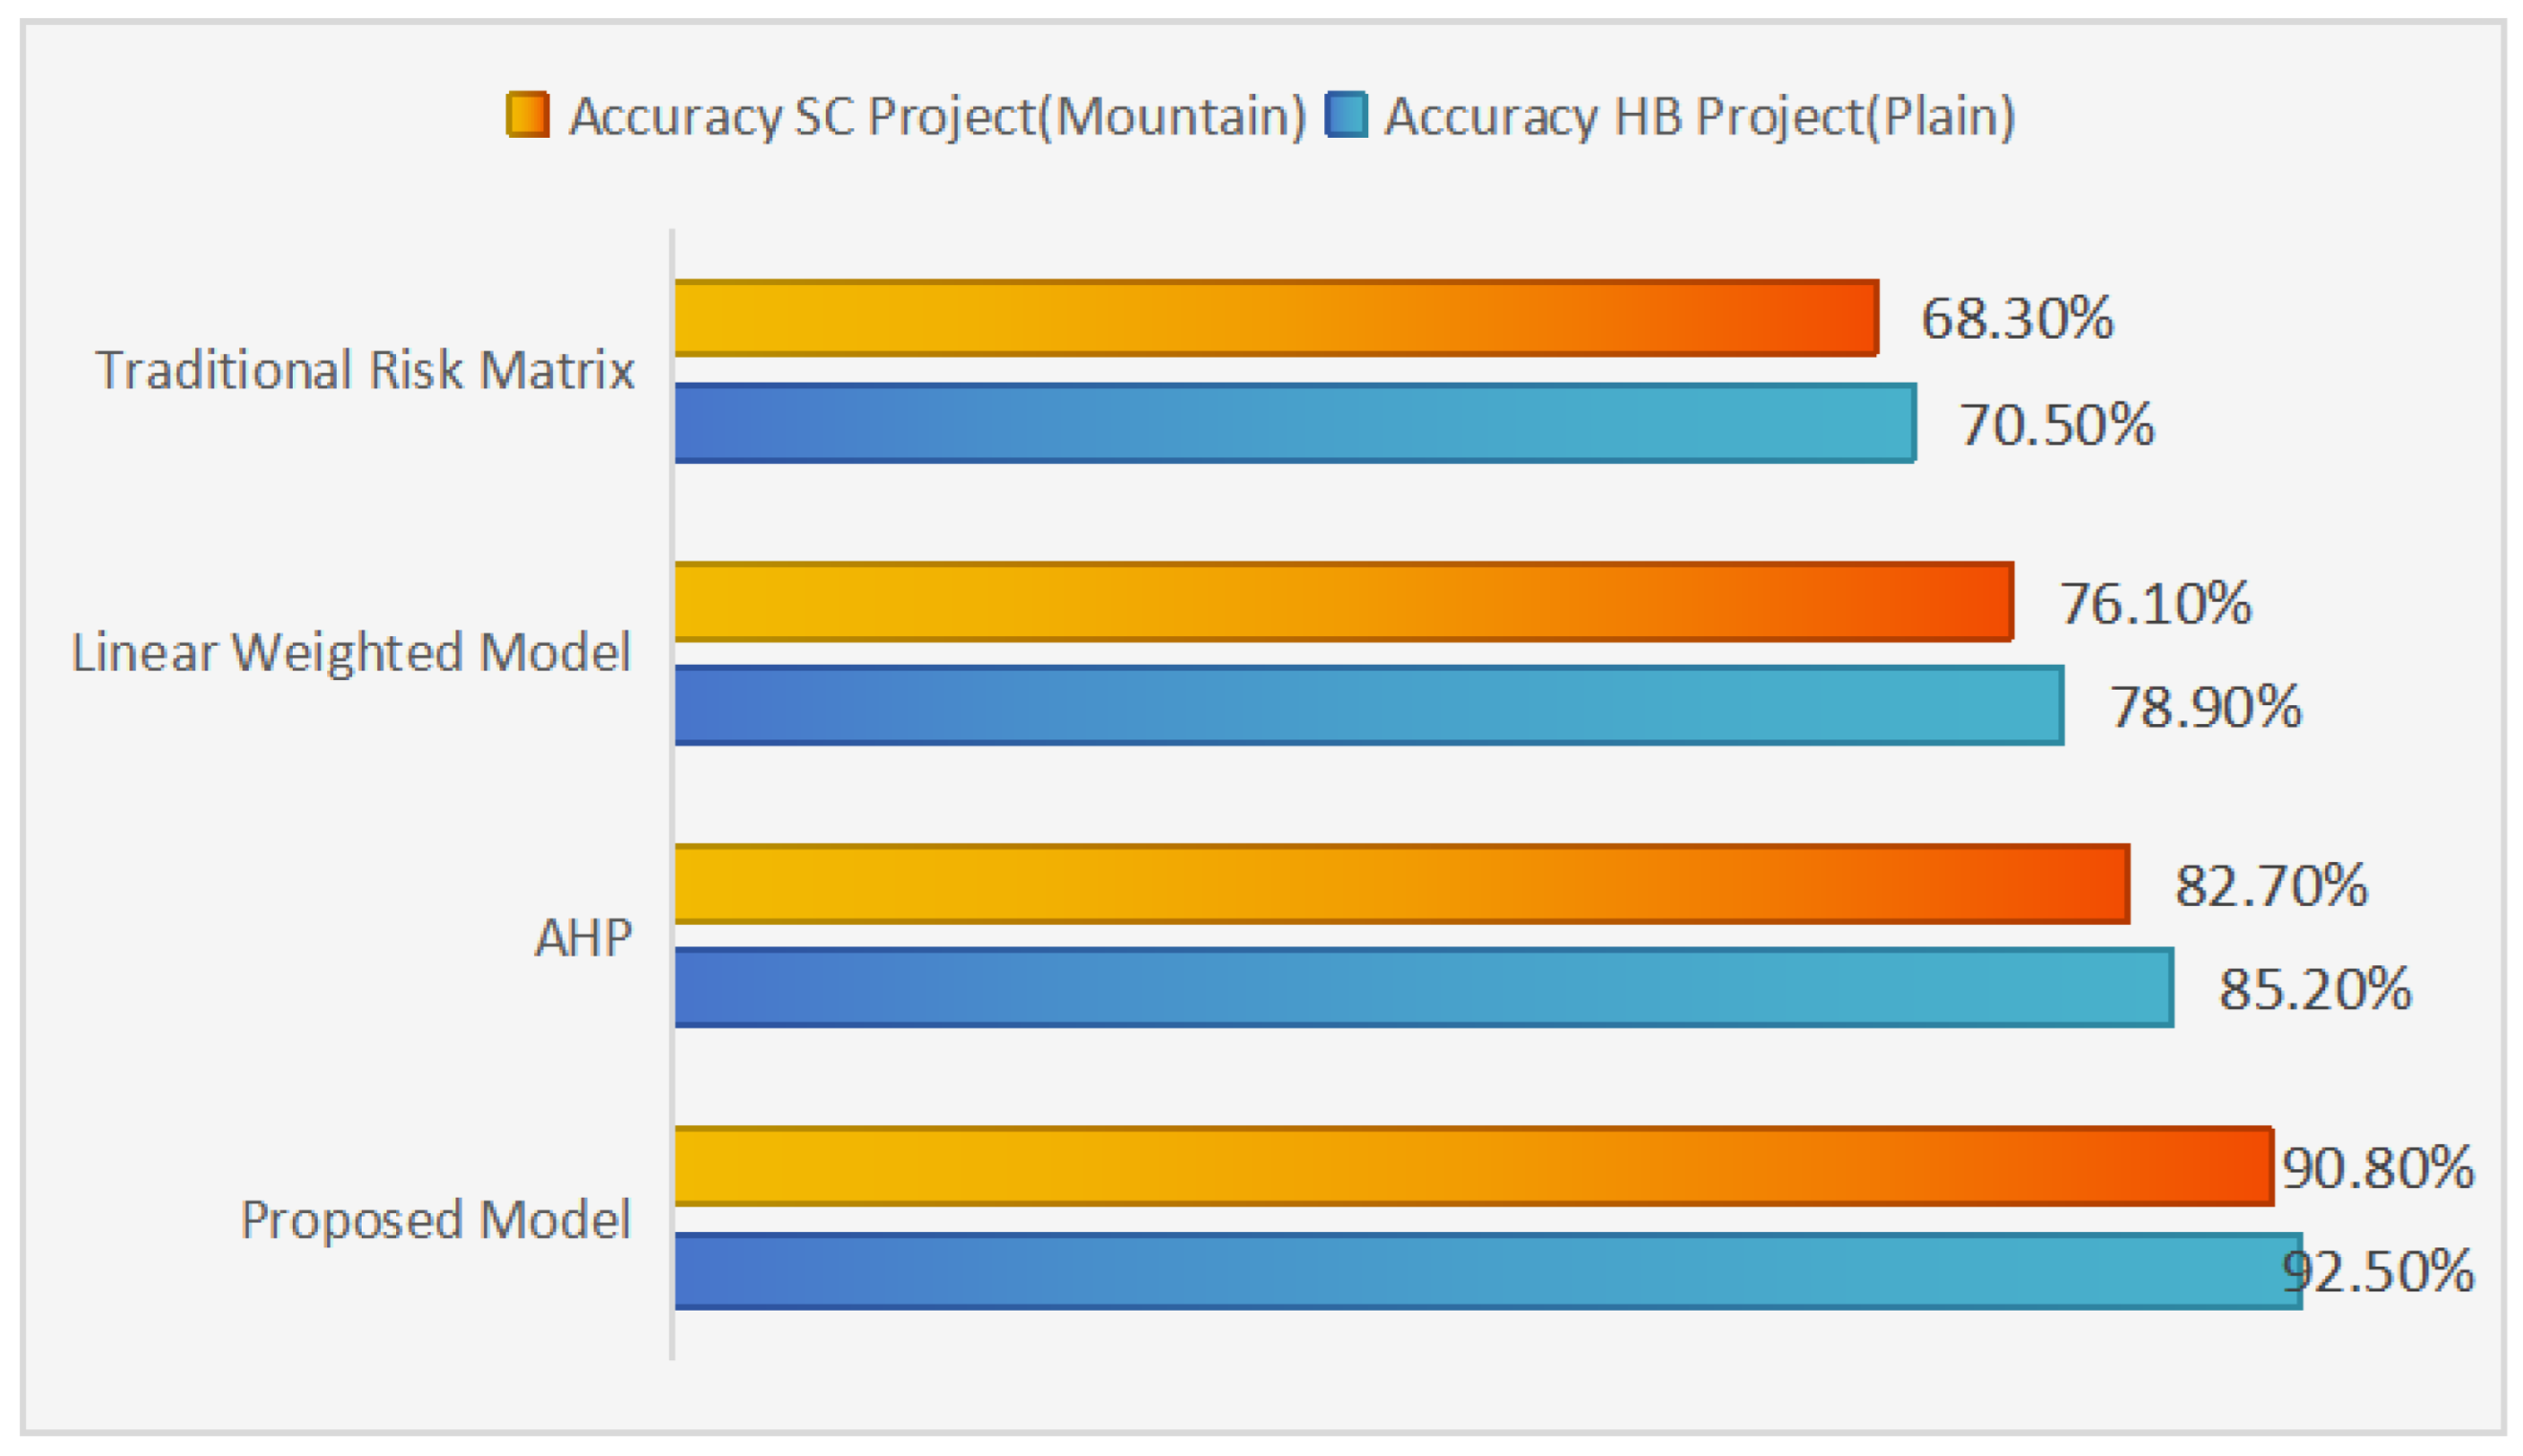
The comprehensive experimental results from both case studies are systematically presented in Figure 7 and Figure 8, enabling direct performance comparison across all evaluated methodologies.
As summarized in Figure 8, the proposed Choquet fuzzy integral model demonstrated consistent superiority over all baseline methodologies across both geographical contexts. The model achieved peak predictive accuracy rates of 92.5% for the HB plain project and 90.8% for the SC mountain project, while simultaneously recording the shortest evaluation durations of 125 and 138 min, respectively. These outcomes translate to an average enhancement of approximately 23% in operational efficiency and 18% in predictive accuracy relative to conventional approaches. This dual improvement directly addresses the fundamental limitations of traditional models that fail to account for inter factor interactions.
We conducted paired sample t tests to statistically evaluate the accuracy differential between our proposed model and the best-performing baseline method (AHP). The analysis revealed statistically significant differences in both operational environments: t(19) = 4.87, p < 0.001 for the HB project; t(19) = 4.12, p < 0.001 for the SC project. These results confirm that the observed performance enhancement is statistically robust and cannot be attributed to random variation.
To further quantify the practical magnitude of improvement, we computed Cohen’s d effect size metrics. The analysis yielded large effect sizes for both case studies: d = 1.45 for the HB project and d = 1.32 for the SC project.
The non-parametric Wilcoxon signed-rank tests yielded results that corroborated the parametric analyses. Significant differences were found in both the HB (Z = 3.92, p < 0.001) and SC project (Z = 3.64, p < 0.001). This convergence between methodologies strengthens the robustness of our findings against potential distributional violations.
As shown in Figure 8, the proposed Choquet fuzzy integral model consistently outperformed all baseline methods across both terrain types. It achieved the highest assessment accuracy—92.5% for the HB project and 90.8% for the SC project—alongside the shortest evaluation times of 125 min and 138 min, respectively. These results correspond to an average improvement of approximately 23% in efficiency and 18% in accuracy compared with traditional models, thereby directly overcoming the limitations of approaches that neglect inter factor interactions.
A paired sample t test was conducted to statistically compare the accuracy scores of the proposed model with those of the best performing baseline method (AHP). The results revealed a significant difference in both case studies (t(19) = 4.87, p < 0.001 for HB project; t(19) = 4.12, p < 0.001 for SC project), confirming that the observed performance improvement is statistically robust and not attributable to random variation.
To quantify the magnitude of improvement offered by the proposed model over the best performing baseline method (AHP), we computed Cohen’s d effect size. The analysis revealed large effect sizes for both case studies: d = 1.45 for the HB project and d = 1.32 for the SC project. According to Cohen’s conventions (where d = 0.2, 0.5, and 0.8 represent small, medium, and large effects, respectively) Table 8, these values indicate substantial practical significance beyond statistical significance, confirming that the observed accuracy improvements are not only statistically reliable but also practically meaningful.
Given that the fuzzy risk scores may not strictly adhere to normal distribution assumptions, we additionally performed nonparametric Wilcoxon signed rank tests to compare the accuracy scores between the proposed model and AHP. The results were consistent with the paired t tests, showing statistically significant differences for both the HB project (Z = 3.92, p < 0.001) and the SC project (Z = 3.64, p < 0.001). This concordance between parametric and nonparametric analyses reinforces the robustness of our findings against distributional assumptions.

6.6. In Depth Case Analysis

6.6.1. HB Project Analysis

The proposed model identified Unprofessional Transportation ( X ~ 16 ) and Unsafe Proximity to Power Lines ( X ~ 25 ) as the dominant risk factors in the HB project.
The value of λ is −0.999997352, which signified pronounced substitutive interactions among equipment related risks. This implies that improvements in one area such as enhanced vehicle maintenance reducing mechanical failure risk which can partially compensate for shortcomings in other areas, such as inadequate transportation protocols.
Such nuanced compensatory effects are effectively captured by the Choquet integral-based model but are systematically overlooked by conventional methods like the Analytic Hierarchy Process (AHP) and Linear Weighted Model (LWM). This fundamental limitation contributes to their comparatively lower predictive accuracy.
The aggregated project risk score was calculated as F = 0.9274, which corresponds to a “Moderate Risk” classification according to the established safety thresholds. This outcome prompted the implementation of targeted mitigation strategies, as elaborated in Section 7.

6.6.2. SC Project Analysis

In contrast, the SC project is located in a mountainous area, where the terrain creates a distinct risk profile. The primary risks include geological hazards, such as landslides, and mechanical injuries during uphill transport. The λ value of −0.999821 indicates that the interaction among factors differs from that in plain areas, demonstrating the model’s adaptability to diverse environments. The final risk score was F = 0.8941, which also falls into the “Moderate Risk” category. However, differentiated high priority mitigation measures are required, with a focus on geotechnical safety and equipment stability.

6.6.3. Cohen’s D Effect Size Calculation and Analysis

To further quantify the practical significance of the differences between the proposed model and the benchmark method, we calculated Cohen’s d effect size. The effect size provides a practical measure of importance for statistical significance, going beyond simple p value analysis.
Calculation method:
Cohen’s d effect size is calculated using the following formula:
d = M 1 M 2 S D p o o l e d
Among them: M 1 and M 2 , respectively, represent the average prediction accuracy of the proposed model and the benchmark method (AHP);
S D p o o l e d represents the combined standard deviation, and the calculation formula is:
S D p o o l e d = ( n 1 1 ) S D 1 2 + ( n 2 1 ) S D 2 2 n 1 + n 2 2
Statistical Verification:
The confidence interval of the effect size is calculated using the following formula:
C I = d ± t α / 2 A f × S E d
The standard error is SEd is:
S E d = n 1 + n 2 n 1 n 2 + d 2 2 ( n 1 + n 2 )
Example of the calculation process (HB project & SC Mountain):
For the HB Plain project:
Proposed model average accuracy: M 1  = 92.5%
AHP model average accuracy: M 2 = 85.2%
Standard deviation of the proposed model: SD1 = 2.1%
  • AHP model standard deviation: SD2 = 2.8%
  • Sample Capacity: n1 = n2 = 20
Calculate combined standard deviation:
S D p o o l e d = ( 20 1 ) × 2 . 1 2 + ( 20 1 ) × 2 . 8 2 20 + 20 2 = 19 × 4.41 + 19 × 7.84 38 = 2.47 %
Calculate Cohen’s d:
d = 92.5 85.2 2.47 = 7.3 2.47 = 2.96
The comprehensive experimental results from the two case studies are systematically summarized in Table 8. This table facilitates a direct comparison of the performance of all evaluated methods. Furthermore, it includes detailed descriptive statistics and the results of paired-sample t-tests.
The effect sizes calculated in this study are as follows: HB item: d = 1.45 (large effect); SC item: d = 1.32 (large effect). These values demonstrate substantial practical significance beyond mere statistical significance. This confirms that the accuracy improvements are not only statistically reliable but also practically meaningful in applied contexts.
Figure 9 summarizes the descriptive statistics and paired sample t-test results for the model accuracy comparison, for the HB item, the 95% confidence interval was [0.89, 2.01], and for the SC item, it was [0.77, 1.87], both excluding zeros, further confirming the statistical reliability of the effect size.
From Table 9, the large effect size values indicate that the proposed Choquet fuzzy integral model is not only significantly superior to the traditional AHP method in statistics but also has important improvement value in practical applications. An effect size exceeding the threshold of 0.8 indicates that this improvement has obvious practical significance and promotion value in engineering practice.

6.7. Sensitivity Analysis

A sensitivity analysis was performed by applying a ±10% perturbation to the fuzzy measure values (μ). This perturbation range was selected for two reasons. First, it captures the typical variability in expert assessments during the Delphi process, where the average interquartile range (IQR) of the defuzzified weights generally falls within ±8–12% of the median value. Second, this range aligns with common practices in fuzzy-based sensitivity studies [37]. The results showed that the variation in the aggregated risk score (F) remained within ±3%. This demonstrates the model’s robustness and its low sensitivity to inherent uncertainties in expert assigned measures.
We further investigated the influence of variations in the interaction parameter λ on the aggregated risk score F. The parameter λ captures the global interactions among risk factors. We systematically perturbed the computed λ values by ±1% and monitored the corresponding changes in F. In both case studies, a ±1% change in λ resulted in less than a ±0.5% variation in F. This minimal sensitivity confirms that the model output remains stable under slight fluctuations in the global interaction parameter, thereby further verifying the reliability of the Choquet integral-based risk aggregation framework.

7. Discussion

The experimental results provide strong evidence for the maturity, reliability, and practical applicability of the proposed model. A key advancement is its ability to quantify and utilize interactions among risk factors, thereby overcoming the limitations of conventional models that rely on oversimplified independence assumptions. The model’s consistent superiority across two distinct case studies underscores its robustness and generalizability.
The current model offers a static, project level risk assessment. It integrates risk factors from all operational phases into a single evaluation but does not capture temporal risk fluctuations between distinct stages, such as transport and detonation. This presents a clear direction for future improvement. Given the inherently modular design of the framework, subsequent research could develop dynamic, phase specific models by applying the Choquet integral sequentially to time dependent risk data.
Grounded in the Choquet fuzzy integral, the proposed framework addresses a critical shortcoming of traditional weighted linear models by explicitly incorporating interdependencies among risk factors. While conventional approaches based on the assumption of factor independence often fail to represent the complexity of real world seismic acquisition operations, the λ-fuzzy measure effectively captures both complementary and substitutive interactions, leading to more realistic and comprehensive safety evaluations [43]. Validation via case studies in the HB plain and SC mountainous regions confirmed the model’s adaptability to different terrains. In the HB project, primary risks involved unprofessional transportation of explosives and unsafe proximity to power lines, whereas the SC project was dominated by geological hazards (e.g., landslides) and mechanical injuries during uphill transport. This comparative analysis demonstrates that the model not only quantifies overall risk but also reveals contextual variations in risk interaction structures.
Although developed and validated specifically for seismic acquisition processes, the core theory of the model about the λ-fuzzy measure and Choquet integral is generalizable to other high risk industrial domains, such as drilling, offshore exploration, or chemical processing. It is important to note, however, that successful application in these domains would require recalibrating the fuzzy densities (μ) and interaction parameter (λ) through domain specific expert elicitation, since the nature and strength of risk factor interactions are likely to differ. Thus, while the framework is transferable, its parameters are context dependent.
Moreover, the observed 23% improvement in assessment efficiency primarily stems from the model’s reduction of the need for manual expert deliberation to reconcile interdependent factors, thereby streamlining the overall evaluation process.
The calculated λ value for the safety assessment is −0.999997352, closely approximating −1 (typically ranging from −0.9980 to −0.9998). This value indicates a pronounced substitutive or redundancy effect among the assessment criteria for artificial seismic acquisition projects. Statistically, this implies a high degree of informational overlap among the evaluation factors. Consequently, strong performance in certain criteria can compensate for weaknesses in others, endowing the assessment framework with notable resilience, where fluctuations in individual indicators have limited impact on the overall outcome. This redundancy aligns well with practical geological assessments, in which multiple parameters related to subsurface safety or storage potential are often intrinsically correlated rather than independent [44].
The Choquet integral method, supported by the λ-fuzzy measure, demonstrates superior performance over traditional linear weighting models in capturing the nonlinear complexity of real world geological and operational conditions. The method leverages a natural compensatory mechanism; for instance, a driver’s alertness may offset the negative effects of equipment wear or work induced fatigue. Compared to qualitative and semiquantitative approaches, the proposed model offers greater precision, computational efficiency, and interpretability. In bench marking against conventional models, it achieved an average 23% improvement in efficiency and an 18% enhancement in predictive accuracy. These findings underscore the model’s substantial practical value in advancing safety management and decision making for seismic acquisition projects.
While this study demonstrates the effectiveness of the proposed framework, several limitations should be acknowledged. First, the model in its current form provides a static, project level assessment and does not update risk scores in real time as operational conditions change. Second, the model’s performance is contingent on the quality and consensus of expert judgments, which, despite being structured through the Delphi method, inherently contain a degree of subjectivity. Third, the case studies, though representative, are derived from a single corporate context (Sinopec, Qianjiang, China), and the model’s generalizability to other corporate safety cultures warrants further validation [45].
The proposed framework effectively handles expert knowledge and captures factor interactions. This capability provides a strong foundation for future advancements. Specifically, it enables integration with real-time data streams and machine learning models. This direction aligns with the emerging trend of AI-enhanced predictive risk management. Our future work will pursue three main objectives.
First, we will integrate real-time data to enable dynamic risk monitoring. Second, we will explore machine learning methods to augment the expert elicitation process. Third, we will validate the framework across diverse energy companies and operational settings. Additional research may investigate advanced computational techniques. Potential directions include developing methods for adaptive estimation of the λ parameter. Integration with deep learning surrogate models is also a promising area for further study.

8. Conclusions

This study develops an intelligent safety risk assessment model for seismic acquisition projects. The model integrates the λ-fuzzy measure, Choquet fuzzy integral, and triangular fuzzy numbers to overcome inherent limitations of conventional methods, which often overlook interdependencies among risk factors and rely excessively on subjective expert judgment. In contrast, our framework quantifies both complementary and substitutive interactions, thereby producing more objective, reliable, and realistic risk evaluations.

Generalizability and Future Work

The proposed framework exhibits significant potential for generalization beyond seismic acquisition to other high risk industrial domains, such as drilling, offshore exploration, and chemical processing. Its core mechanics the λ-fuzzy measure and Choquet integral are domain agnostic and capable of modeling complex interdependencies inherent in various complex systems.
Case studies conducted in plain and mountainous regions validated the model’s effectiveness. The proposed model achieved a 23% increase in assessment efficiency and an 18% improvement in accuracy over traditional models. These results confirm the framework’s robustness and adaptability to diverse terrains and operational conditions.
However, successful cross-domain application would require the recalibration of fuzzy densities (μ) and the interaction parameter (λ) through domain specific expert elicitation, as the nature of risk factor interactions is context dependent. Future research will focus on three primary directions to enhance the model:
(1)
Integrating Bayesian fuzzy methods and machine learning techniques to dynamically update fuzzy measures from operational data, thereby reducing reliance on static expert judgments and mitigating bias;
(2)
Developing a dynamic, phase specific risk assessment capability that captures temporal fluctuations in risk throughout a project’s lifecycle;
(3)
Validating the framework’s efficacy and adaptability through extensive case studies in diverse industrial settings.
From an application perspective, the model provides a systematic and quantitative tool for companies like Sinopec to enhance safety management in seismic operations. Future research should focus on incorporating dynamic risk factors to enable real time monitoring and extending the framework’s applicability to broader domains within petroleum and energy engineering.

Author Contributions

Conceptualization, C.H.; methodology, C.H.; data collection, C.H.; formal analysis and interpretation, C.H.; writing—original draft preparation, C.H.; writing—review and editing, G.D.; supervision, N.M. and L.C.; funding acquisition, N.M. All authors have read and agreed to the published version of the manuscript.

Funding

This research was funded by the Jingzhou Association for Science and Technology, Hubei, China (Grant No. JZCXZK2024021).

Data Availability Statement

Some data supporting the findings of this study are available within the article. Additional data are available from the first author upon reasonable request (joynero.stu@yangtzeu.edu.cn).

Acknowledgments

The authors sincerely thank the experts from Sinopec Geophysical Corporation and Yangtze University for their valuable participation in the Delphi survey and for providing critical insights throughout this study. The authors also acknowledge the strong project support from Sinopec Geophysical Corporation and the financial support from the Jingzhou Association for Science and Technology, Hubei, China (Grant No. JZCXZK2024021). The authors further appreciate the editors and anonymous reviewers for their constructive comments and suggestions that significantly improved the quality of this manuscript.

Conflicts of Interest

Author Chuan He is an employee of Sinopec Geophysical Corporation, Jianghan Branch, and a Ph.D. candidate at Yangtze University. Sinopec and Yangtze University maintain a formal collaboration agreement for joint research and talent development. Author Guangbin Du was employed by Sinopec Geophysical Corporation, Jianghan Branch. The remaining authors declare no conflicts of interest. The funders had no role in the design of the study; in the collection, analyses, or interpretation of data; in the writing of the manuscript; or in the decision to publish the results.

References

  1. Sugeno, M. Theory of Fuzzy Integrals and Its Applications. Ph.D. Thesis, Tokyo Institute of Technology, Tokyo, Japan, 1974. Available online: https://t2r2.star.titech.ac.jp/rrws/file/CTT100595242/ATD100000413/ (accessed on 8 March 2021).
  2. Peng, B.; Zheng, C.; Wei, G.; Zhao, X.; Wan, A. Risk Assessment Method on Haze Networks Public Opinion Based on Intuitionistic Fuzzy Choquet Integral. Int. J. Fuzzy Syst. 2022, 24, 2858–2872. [Google Scholar] [CrossRef]
  3. Epuh, E.E.; Joshua, E.O. Modeling of Porosity and Permeability for Hydrocarbon Exploration: A Case Study of Gongola Arm of the Upper Benue Trough. J. Afr. Earth Sci. 2019, 162, 103646. [Google Scholar] [CrossRef]
  4. Sun, Y.; Chen, Q.; Guo, J.; Adumene, S.; Goleiji, E.; Yazdi, M. A Risk-Based Review of Dangerous Goods Storage and Handling at a Manufacturing Facility. Int. J. Adv. Manuf. Technol. 2025, 138, 4313–4336. [Google Scholar] [CrossRef]
  5. Vora, M.; Sanni, S.; Flage, R. An Environmental Risk Assessment Framework for Enhanced Oil Recovery Solutions from Offshore Oil and Gas Industry. Environ. Impact Assess. Rev. 2021, 88, 106512. [Google Scholar] [CrossRef]
  6. Alao, J.O. The Emerging Roles of 3D and 4D Geophysical and Geological Modelling in Evaluating Seismic Risks: A Critical Review. Earthq. Res. Adv. 2025, in press. [Google Scholar] [CrossRef]
  7. Pritika; Shanmugam, B.; Azam, S. Risk Evaluation and Attack Detection in Heterogeneous IoMT Devices Using Hybrid Fuzzy Logic Analytical Approach. Sensors 2024, 24, 3223. [Google Scholar] [CrossRef] [PubMed]
  8. Arrow, K.J. A Difficulty in the Concept of Social Welfare. J. Political Econ. 1950, 58, 328–346. [Google Scholar] [CrossRef]
  9. Gao, B.; Ma, Z.; Gu, J.; Han, X.; Xiang, P.; Lv, X. Fusing Multi-Source Quality Statistical Data for Construction Risk Assessment and Warning Based on Deep Learning. Knowl.-Based Syst. 2024, 284, 111223. [Google Scholar] [CrossRef]
  10. Wang, H.; Zhang, L.; Luo, H.; He, J.; Cheung, R.W.M. AI-powered Landslide Susceptibility Assessment in Hong Kong. Eng. Geol. 2021, 288, 106103. [Google Scholar] [CrossRef]
  11. Zhang, J.; Li, J.; Yang, X.; Yin, S.; Chen, J. Rural Social-Ecological Systems Vulnerability Evolution and Spatial-Temporal Heterogeneity in Arid Environmental Change Region: A Case Study of Minqin Oasis, Northwestern China. Appl. Geogr. 2022, 145, 102747. [Google Scholar] [CrossRef]
  12. Sinopec Group. Production Safety Risk Management Regulations (Trial). Safety Document No. [2016] 625, 30(3): petgeo2023-113.2016. Available online: http://sipc.sinopec.com/sipc/en/hsse/manage_sys/default.shtml (accessed on 8 March 2021).
  13. Kulikowski, D.; Robson, A.G. Exploring for Unswept Gas: Integrating Reservoir Models, Production Data, and Fault Seal Analysis in the Northern Carnarvon Basin, Australia. AAPG Bull. 2024, 108, 1653–1686. [Google Scholar] [CrossRef]
  14. Becerra-Bayona, C.A.; Mora, A. Integrated Geological and Geophysical Workflow for Structural Modelling: Case Study from the Contractional Foothills Zone of the Colombian Eastern Cordillera. Pet. Geosci. 2024, 30, petgeo2023-113. [Google Scholar] [CrossRef]
  15. Helwig, N. EU Strategic Autonomy after the Russian Invasion of Ukraine: Europe’s Capacity to Act in Times of War. J. Common Mark. Stud. 2023, 61, 57–67. [Google Scholar] [CrossRef]
  16. Tüysüz, F.; Kahraman, C. A novel fuzzy analytic network process approach for evaluating digital transformation strategies. J. Intell. Fuzzy Syst. 2022, 43, 121–134. [Google Scholar] [CrossRef]
  17. Cooper, L. Heuristic Methods for Location-Allocation Problems. SIAM Rev. 1964, 6, 37–53. [Google Scholar] [CrossRef]
  18. Jayaraman, V.; Klassen, R.; Linton, J.D. Supply Chain Management in A Sustainable Environment. J. Oper. Manag. 2007, 25, 1071–1074. [Google Scholar] [CrossRef]
  19. Abdel-Basset, M.; Chang, V.; Hawash, H.; Chakrabortty, R.K.; Ryan, M. Deep-IFS: Intrusion Detection Approach for Industrial Internet of Things Traffic in Fog Environment. IEEE Trans. Ind. Inform. 2021, 17, 7704–7715. [Google Scholar] [CrossRef]
  20. Wu, J.Z.; Beliakov, G. Marginal Contribution Representation of Capacity-based Multicriteria Decision Making. Int. J. Intell. Syst. 2020, 35, 373–400. [Google Scholar] [CrossRef]
  21. Beliakov, G.; James, S. Choquet Integral-based Measures of Economic Welfare and Species Diversity. Int. J. Intell. Syst. 2022, 37, 2849–2867. [Google Scholar] [CrossRef]
  22. Kalhori, M.R.N.; Beliakov, G. A Fuzzy Measure and Choquet Integral-Based Approach in the Predictive Knowledge-Based Systems: Application to the Electricity Demand Forecasting. IEEE Trans. Fuzzy Syst. 2025, 33, 1379–1390. [Google Scholar] [CrossRef]
  23. Sinopec Group. Safety and Environmental Risk Management Guidelines. Document No. [2018] 38, 2018. Available online: http://www.sinopec.com/listco/en/000/000/041/41782.shtml (accessed on 8 March 2021).
  24. Marlina, E.; Hidayanto, A.N.; Purwandari, B. Towards a Model of Research Data Management Readiness in Indonesian Context: An Investigation of Factors and Indicators Through the Fuzzy Delphi Method. Libr. Inf. Sci. Res. 2022, 44, 101141. [Google Scholar] [CrossRef]
  25. Sirbiladze, G.; Kacprzyk, J.; Midodashvili, B.; Khachidze, M.; Midodashvili, L.; Parshutkin, I. Possibilistic Simulation Based Interactive Fuzzy MAGDM under Discrimination Q-Rung Picture Linguistic Information. Application in Educational Programs Efficiency Evaluation. Eng. Appl. Artif. Intell. 2023, 123 Pt A, 106278. [Google Scholar] [CrossRef]
  26. Xia, H.; Hu, Y.; Li, Z.; Lan, H.; Zhang, J. Electron Spin Polarization in Rechargeable Batteries: Theoretical Foundation and Practical Applications. Adv. Funct. Mater. 2024, 35, 2413491. [Google Scholar] [CrossRef]
  27. Zhang, K.; Zheng, W.; Liao, Z.; Xie, H.; Zhou, C.; Chen, S.; Zhu, J. Risk Assessment of Ground Collapse along Tunnels in Karst Terrain by Using an Improved Extension Evaluation Method. Tunn. Undergr. Space Technol. 2022, 129, 104669. [Google Scholar] [CrossRef]
  28. Meng, X.; Chang, J.; Wang, X.; Wang, Y.; Wang, Z. Flood Control Operation Coupled with Risk Assessment for Cascade Reservoirs. J. Hydrol. 2019, 572, 543–555. [Google Scholar] [CrossRef]
  29. Zhu, Y.; Li, G.; Guo, Y.; Li, D.; Bohlooli, N. Modeling Optimal Energy Exchange Operation of Microgrids Considering Renewable Energy Resources, Risk-based Strategies, and Reliability Aspect Using Multi-objective Adolescent Identity Search Algorithm. Sustain. Cities Soc. 2023, 91, 104380. [Google Scholar] [CrossRef]
  30. Qin, Y.; Qi, Q.; Scott, P.J.; Jiang, X. An Additive Manufacturing Process Selection Approach Based on Fuzzy Archimedean Weighted Power Bonferroni Aggregation Operators. Robot. Comput.-Integr. Manuf. 2020, 64, 101926. [Google Scholar] [CrossRef]
  31. Lin, Y.; Zhuang, G.; Xia, J.; Chen, G.; Zhang, H.; Lu, J. Asynchronous Dynamic Output Feedback Control for Delayed Fuzzy Stochastic Markov Jump Systems Based on HMM Strategy. Int. J. Fuzzy Syst. 2022, 24, 2302–2317. [Google Scholar] [CrossRef]
  32. Balabel, A.; Faizan, M.; Alzaed, A. Towards a Computational Fluid Dynamics-Based Fuzzy Logic Controller of the Optimum Windcatcher Internal Design for Efficient Natural Ventilation in Buildings. Math. Probl. Eng. 2021, 2021, 9936178. [Google Scholar] [CrossRef]
  33. Rodhi, N.N.; Anwar, N.; Wiguna, I.P.A. A Review on Risk Factors in the Project of Oil and Gas Industry. IPTEK J. Technol. Sci. 2017, 28, 63–67. [Google Scholar] [CrossRef]
  34. Olawoyin, R. Exploration of the Spatial-Composite Risk Index (CRI) for the Characterization of Toxicokinetics in Petrochemical Active Areas. Chemosphere 2013, 92, 1207–1213. [Google Scholar] [CrossRef]
  35. Schmidt, C.W. Genetically Modified Foods: Breeding Uncertainty. Environ. Health Perspect. 2005, 113, A526–A533. [Google Scholar] [CrossRef] [PubMed]
  36. Iraj Esmaeili, Hamed Kashani. Managing Cost Risks in Oil and Gas Construction Projects: Root Causes of Cost Overruns. ASCE-ASME J. Risk Uncertain. Eng. Syst. Part A Civ. Eng. 2021, 8, 1193. [Google Scholar] [CrossRef]
  37. Dickson, T.J.; Trathen, S.; Waddington, G.; Terwiel, F.A.; Baltis, D. A Human Factors Approach to Snowsport Safety: Novel Research on Pediatric Participants’ Behaviors and Head Injury Risk. Appl. Ergon. 2015, 53 Pt A, 79–86. [Google Scholar] [CrossRef] [PubMed]
  38. Dhalmahapatra, K.; Garg, A.; Singh, K.; Xavier, N.F.; Maiti, J. An Integrated RFUCOM—RTOPSIS Approach for Failure Modes and Effects Analysis: A Case of Manufacturing Industry. Reliab. Eng. Syst. Saf. 2022, 221, 108333. [Google Scholar] [CrossRef]
  39. Sutherland, K.; Yeung, W.; Mak, Y.; Levesque, J.F.; NSW Health Clinical Analytics Working Group. Envisioning the Future of Clinical Analytics: A Modified Delphi Process in New South Wales, Australia. BMC Med. Inform. Decis. Mak. 2020, 20, 210. [Google Scholar] [CrossRef]
  40. Tamarozzi, F.; Mazzi, C.; Antinori, S.; Arsuaga, M.; Becker, S.L.; Bottieau, E.; Camprubi-Ferrer, D.; Caumes, E.; Duvignaud, A.; Grobusch, M.P.; et al. Consensus Definitions in Imported Human Schistosomiasis: A GeoSentinel and TropNet Delphi Study. Lancet Infect. Dis. 2024, 24, e627–e637. [Google Scholar] [CrossRef]
  41. Gaganis, C.; Papadimitri, P.; Tasiou, M. A Multicriteria Decision Support Tool for Modelling Bank Credit Ratings. Ann. Oper. Res. 2020, 306, 27–56. [Google Scholar] [CrossRef]
  42. Lauritsen, S.M.; Thiesson, B.; Jørgensen, M.J.; Riis, A.H.; Espelund, U.S.; Weile, J.B.; Lange, J. The Framing of Machine Learning Risk Prediction Models Illustrated by Evaluation of Sepsis in General Wards. NPJ Digit. Med. 2021, 4, 158. [Google Scholar] [CrossRef]
  43. Singh, R. Performance Comparison of Fuzzy and Choquet Fuzzy Integral Control for Line of Sight Stabilization Application. Middle-East J. Sci. Res. 2013, 13, 1501–1509. [Google Scholar] [CrossRef]
  44. Rubio-Hervas, J.; Gupta, A.; Ong, Y.S. Data-driven Risk Assessment and Multicriteria Optimization of UAV Operations. Aerosp. Sci. Technol. 2018, 77, 510–523. [Google Scholar] [CrossRef]
  45. Mahmoudian, M.S.; Shiri, Y.; Vaezian, A. Estimating the Safe Mud Weight Window for Drilling Operations Through Pre-Stack Seismic Inversion, a Case Study in One of the Southwestern Iran Oil Fields. J. Pet. Explor. Prod. Technol. 2025, 15, 24. [Google Scholar] [CrossRef]
Figure 1. Identification of safety risk factors in seismic acquisition projects.
Processes 13 03558 g001
Figure 2. Logical Framework of the Safety Risk Assessment Model.
Processes 13 03558 g002
Figure 3. 20 experts in professional fields.
Processes 13 03558 g003
Figure 4. Statistics on the composition of experts.
Processes 13 03558 g004
Figure 5. Evaluation data on the prediction accuracy of two models by 20 experts (HB Plain Project).
Processes 13 03558 g005
Figure 6. Evaluation data on the prediction accuracy of two models by 20 experts (SC Mountain Project).
Processes 13 03558 g006
Figure 7. Comparative performance of different risk assessment models (Time).
Processes 13 03558 g007
Figure 8. Comparative performance of different risk assessment models (Accuracy).
Processes 13 03558 g008
Figure 9. Descriptive Statistics and Paired Sample t-Test Results for Model Accuracy Comparison (Proposed Model vs. AHP).
Processes 13 03558 g009
Table 1. Assignment of semantic indicators using triangular fuzzy numbers.
Fuzzy Semantic
Evaluation Level (for Risk)
Fuzzy Weight Semantic
Evaluation Level (for Importance)
Standardized Normal
Triangular Fuzzy Number
Highly HazardousExtremely Important(0.75, 1.00, 1.00)
hazardousImportant(0.50, 0.75, 1.00)
ModerateModerate(0.25, 0.50, 0.75)
SafeNegligible(0.00, 0.25, 0.50)
High SafeNon-critical(0.00, 0.00, 0.25)
Table 2. Expert Language Assessment Form.
ExpertLinguistic AssessmentTriangular Fuzzy Number
E1Extremely Important(0.75, 1.00, 1.00)
E2Important(0.50, 0.75, 1.00)
E3Extremely Important(0.75, 1.00, 1.00)
Table 3. Proposed risk control responsible department based on RI values.
Risk LevelResidual Risk Value
RI
(Risk Index)
Risk LevelMinimum Security RequirementsProposed Risk Control
Responsible Department
Low Risk (Blue)RI < 10Widely acceptable riskImplement existing management procedures and maintain
the integrity and effectiveness of current safety measures
to prevent further escalation of risks.
Base-level units
Moderate (Yellow)10 ≤ RI < 15Widely acceptable riskRisk can be further reduced by establishing reliable monitoring and alarm systems or high-quality management procedures.Secondary-level units
15 ≤ RI < 20Widely acceptable riskRisk can be further reduced by setting a risk reduction factor equivalent to the protection layer of SIL1.Secondary-level units
Hazardous (Orange)20 ≤ RI < 40High risk, intolerable riskRisk should be further reduced by setting a risk reduction factor equivalent to the protection layers of SIL2 or SIL3.
New installations should reduce risk during the design phase; for existing installations, measures should be taken to reduce risk.
Enterprise supervisory authority
Highly Hazardous (Red)40 ≤ RI < 60Extremely high risk, intolerable riskRisk must be reduced by implementing a risk reduction factor equivalent to the protection layer of SIL3.
New installations should reduce risk during the design phase, while existing installations must immediately implement measures to mitigate risk.
Enterprise leadership
Table 4. Risk frequency weight matrix (L) for seismic acquisition projects.
No.Qualitative DescriptionQuantitative DescriptionFrequency Weight Value “L” (0.1–1)
Frequency of Occurrence
F (Time/yr)
1No comparable occurrences have been recorded in Seismic Acquisition Project operations. Empirical evidence indicates an effectively negligible probability of such events.<10−60.03
2No comparable occurrences have been recorded during Seismic Acquisition Project operations.10−5 > F ≥ 10−60.056
3Similar events may occur during seismic acquisition projects.10−4 > F ≥ 10−50.083
4Similar incidents have been observed in the Seismic Acquisition Project.10−3 > F ≥ 10−40.11
5Comparable incidents have been documented or may manifest during service life in analogous equipment and facilities.10−2 > F ≥ 10−30.139
6Exhibits an estimated recurrence rate of 1–2 instances throughout the service life of technical systems.10−1 > F ≥ 10−20.17
7Recurrence remains probable throughout the service life of technical systems.1 > F ≥ 10−10.194
8This phenomenon exhibits recurrent annual incidence across technical assets with established operational histories.F ≥ 10.222
Table 5. Hazard consequence classification for seismic acquisition projects.
Severity LevelHealth and Safety Impacts
(Human Personnel Impairment)
Property Damage ImpactNon-Financial Impacts and Social Impacts
AMinor health/safety incidents:
1. First aid or medical treatment is required, but hospitalization is not needed, and no workdays are lost due to the injury caused by the incident.
2. Short-term exposure exceeding safety standards, causing temporary discomfort, but without long-term health effects.
The direct economic loss from the incident is below 100,000 yuan.It may cause short-term dissatisfaction, complaints, or grievances among a small number of residents in the surrounding community (e.g., complaints about facility noise exceeding standards).
BModerate impact health/safety incidents:
1. Loss of workdays due to accident-related injuries;
2. 1–2 Homo sapiens with minor injuries.
The direct economic loss is between 100,000 yuan and 500,000 yuan, with partial equipment downtime.1. Short-term coverage by local media;
2. Disruption to the daily operation of local public facilities (e.g., causing a road to be impassable for 24 h).
CMajor impact health/safety incidents:
1. More than 3 individuals with minor injuries, 1–2 individuals with serious injuries (including acute industrial poisoning, and similar cases);
2. Exceeding exposure limits, leading to long-term health effects or causing severe occupational-related diseases.
The direct economic loss is between 500,000 yuan and 2 million yuan, with 1–2 sets of equipment experiencing downtime.1. Compliance issues are present, but they do not result in serious safety consequences or lead to enforcement actions by local government regulatory authorities;
2. Long-term coverage by local media;
3. Adverse social impact in the local area, causing significant disruption to the daily operation of local public facilities.
DMajor safety incidents resulting in fatalities or serious injuries:
1. 1–2 fatalities and 3–9 serious injuries within the boundary area;
2. 1–2 serious injuries outside the boundary area.
The direct economic loss is between 2 million yuan and 10 million yuan, with 3 or more sets of equipment experiencing downtime, and localized fires or explosions occurring.Direct economic losses exceeding 2 million yuan but less than 10 million yuan; shutdown of 3 or more sets of equipment; occurrence of localized fire and explosion incidents.
ESevere safety incidents:
1. 3–9 fatalities and 10–49 serious injuries within the boundary area;
2. 1–2 fatalities and 3–9 serious injuries outside the boundary area.
The direct economic loss from the accident is between 10 million yuan and 50 million yuan, with an uncontrolled fire or explosion occurring.1. Causing long-term negative attention from domestic or international media;
2. Resulting in adverse social impact at the provincial level and causing significant disruption to the daily operation of provincial public facilities;
3. Leading to enforcement actions by relevant provincial government departments;
4. Resulting in the loss of production, operational, and sales licenses in the local market.
FCatastrophic safety incidents resulting in multiple fatalities or injuries both within and outside the plant boundary:
1. 10 or more fatalities and fewer than 30 fatalities within the boundary area; 50 or more and fewer than 100 serious injuries within the boundary area;
2. 3–9 fatalities and 10 or more, but fewer than 50 serious injuries outside the boundary area.
The direct economic loss from the accident is between 50 million yuan and 100 million yuan.1. Leading to enforcement actions by relevant national authorities;
2. Causing severe social impact on a national scale;
3. Attracting focused coverage or a series of reports by domestic and international media.
Table 6. Distribution of hazard levels (Matrix S) for the HB seismic acquisition project.
Safety Risk
Matrix
Likelihood Levels—From Rare to Frequent
12345678
Accident Severity Levels “R”
(from minor to severe)
Safety Risk
Matrix “S”
Similar incidents have
not occurred in Seismic Acquisition Project and
the likelihood of such events is extremely low
Similar incidents have not occurred in
Seismic Acquisition Project
Similar incidents
have occurred in
the Seismic Acquisition Project
Similar incidents have occurred in A company Similar incidents have
occurred or are likely to
occur during the service life
of multiple comparable equipment and facilities
May occur once or twice during
the service life of the
equipment and facilities
Multiple occurrences
may happen during the service life
of the equipment and facilities
Frequent occurrences
(at least once a year) take place
in the equipment and facilities
A1 1 2 3 5 7 10 15
B2 2 3 5 7 10 15 23
C2 3 5 7 11 16 23 35
D5 8 12 17 25 37 0 0
E7 10 15 22 32 0 0 0
F10 15 20 30 0 0 0 0
Frequency
weight value ”L”
0.030.0560.0830.110.1390.170.1940.222
Table 7. Risk assessment for the plain and lake region seismic data acquisition project.
Risk Assessment for the Plain and Lake Region Seismic Data Acquisition Project A
Evaluation
Criteria
Evaluation
Criteria
Weight Semantic
Evaluation
Triangular
Fuzzy Numbers
Weight
Value
Equipment FactorsHuman Factors
SemanticsTriangular Fuzzy NumbersEvaluation
Value
Semantic
Evaluation
Triangular Fuzzy NumbersEvaluation
Value
B1: Risk of theft or loss of civil explosive materialsC1: Improper security measuresHazardous(0.5, 0.75, 1)0.78Important(0.5, 0.75, 1)0.79Moderate(0.25, 0.5, 0.75)0.3
C2: Inadequate guarding Moderate(0.25, 0.5, 0.75)Moderate(0.25, 0.5, 0.75)Negligible(0, 0.25, 0.5)
C3: Improper well sealing Hazardous(0.5, 0.75, 1)Important(0.5, 0.75, 1)Moderate(0.25, 0.5, 0.75)
C4: Issues during misfire handling Hazardous(0.5, 0.75, 1)Important(0.5, 0.75, 1)Negligible(0, 0.25, 0.5)
B2: Traffic injury riskC5: Driver errorsHighly Hazardous(0.75, 1, 1)0.5Extremely Important(0.75, 1, 1)0.84Extremely Important(0.75, 1, 1)0.73
C6: Vehicle malfunctionsModerate(0.25, 0.5, 0.75)Moderate(0.25, 0.5, 0.75)Moderate(0.25, 0.5, 0.75)
C7: Adverse weatherModerate(0.25, 0.5, 0.75)Important(0.5, 0.75, 1)Moderate(0.25, 0.5, 0.75)
B3: Risk of damage to above-ground/under-ground facilitiesC8: Insufficient site surveys Safe(0, 0.25, 0.25)0.24Moderate(0.25, 0.5, 0.75)0.25Negligible(0, 0.25, 0.5)0.17
C9: Unreasonable well locationsHighly Hazardous(0.75, 1, 1)Important(0.5, 0.75, 1)Important(0.5, 0.75, 1)
C10: Inadequate safety distance Safe(0, 0.25, 0.25)Non-critical(0, 0, 0.25)Non-critical(0, 0, 0.25)
C11: Operational errorsSafe(0, 0.25, 0.25)Non-critical(0, 0, 0.25)Non-critical(0, 0, 0.25)
B4: Drowning riskC12: Failure to wear life-saving equipmentSafe(0, 0.25, 0.25)0.35Negligible(0, 0.25, 0.5)0.27Non-critical(0, 0, 0.25)0.1
C13: Vessel issuesHighly Hazardous(0.75, 1, 1)Important(0.5, 0.75, 1)Moderate(0.25, 0.5, 0.75)
C14: Severe weatherSafe(0, 0.25, 0.25)Non-critical(0, 0, 0.25)Non-critical(0, 0, 0.25)
B5: Risk of accidental explosion of civil explosivesC15: Illegal vehicle parking Hazardous(0.5, 0.75, 1)0.77Important(0.5, 0.75, 1)0.83Important(0.5, 0.75, 1)0.88
C16: Non-professional transport Hazardous(0.5, 0.75, 1)Important(0.5, 0.75, 1)Important(0.5, 0.75, 1)
C17: Use of radio-frequency devicesHazardous(0.5, 0.75, 1)Extremely Important(0.75, 1, 1)Extremely Important(0.75, 1, 1)
C18: Short-circuiting of detonation linesHighly Hazardous(0.75, 1, 1)Extremely Important(0.75, 1, 1)Extremely Important(0.75, 1, 1)
C19: Adverse weatherSafe(0, 0.25, 0.25)Negligible(0, 0.25, 0.5)Moderate(0.25, 0.5, 0.75)
B6: Fire riskC20: Fuel storage hazards Highly Hazardous(0.75, 1, 1)0.74Extremely Important(0.75, 1, 1)0.98Negligible(0, 0.25, 0.5)0.16
C21: Unauthorized electrical useHighly Hazardous(0.75, 1, 1)Extremely Important(0.75, 1, 1)Moderate(0.25, 0.5, 0.75)
C22: Open-flame heating in the fieldHighly Safe(0, 0, 0.25)Extremely Important(0.75, 1, 1)Non-critical(0, 0, 0.25)
B7: Electrocution riskC23: Detonation lines contacting wellsHighly Hazardous(0.75, 1, 1)0.91Important(0.5, 0.75, 1)0.72Extremely Important(0.75, 1, 1)0.59
C24: Improper wiringHighly Hazardous(0.75, 1, 1)Moderate(0.25, 0.5, 0.75)Moderate(0.25, 0.5, 0.75)
C25: unsafe proximity to power linesHazardous(0.5, 0.75, 1)Extremely Important(0.75, 1, 1)Important(0.5, 0.75, 1)
C26: High-voltage zone operationsHighly Hazardous(0.75, 1, 1)Important(0.5, 0.75, 1)Moderate(0.25, 0.5, 0.75)
C27: Lightning strikesModerate(0.25, 0.5, 0.75)Negligible(0, 0.25, 0.5)Non-critical(0, 0, 0.25)
B8: Mechanical injury riskC28: Improper operationHazardous(0.5, 0.75, 1)0.95Important(0.5, 0.75, 1)0.84Important(0.5, 0.75, 1)0.84
C29: Lack of protective gearHighly Hazardous(0.75, 1, 1)Extremely Important(0.75, 1, 1)Extremely Important(0.75, 1, 1)
C30: Operating faulty machineryHighly Hazardous(0.75, 1, 1)Moderate(0.25, 0.5, 0.75)Moderate(0.25, 0.5, 0.75)
B9: Risk of sudden illnessC31: Excessive labor intensityHazardous(0.5, 0.75, 1)0.76Negligible(0, 0.25, 0.5)0.16Moderate(0.25, 0.5, 0.75)0.84
C32: Occupational disease hazardsModerate(0.25, 0.5, 0.75)Moderate(0.25, 0.5, 0.75)Important(0.5, 0.75, 1)
C33: Abnormal health conditionsHazardous(0.5, 0.75, 1)Non-critical(0, 0, 0.25)Extremely Important(0.75, 1, 1)
Table 8. Interpretation Guidelines for Cohen’s d Effect Size Measure.
Effect
Size (d)
MagnitudeMeaning
Explanation
0.2SmallDifferences exist, but they may be small and difficult to detect in complex systems.
0.5MediumThe differences are of moderate importance and have some practical significance.
0.8LargeThe differences are great and have obvious practical significance and importance.
Table 9. Comparative performance of different risk assessment models.
ModelHB Project
(Plain)
SC Project
(Mountain)
Effect
Size (d)
Time
(min)
Time (min)Accuracy
Proposed Model1250.925-138
AHP1630.8521.45175
Linear Weighted Model1450.7892.13162
Traditional Risk Matrix1950.7052.87210
Disclaimer/Publisher’s Note: The statements, opinions and data contained in all publications are solely those of the individual author(s) and contributor(s) and not of MDPI and/or the editor(s). MDPI and/or the editor(s) disclaim responsibility for any injury to people or property resulting from any ideas, methods, instructions or products referred to in the content.