Abstract
Methane pyrolysis for turquoise hydrogen production faces dual challenges of reactor clogging and carbon contamination, particularly the difficulty in extracting high-purity carbon from molten media. While most existing studies focus on two-phase systems, carbon products are inevitably contaminated by the medium. This work presents a novel dual-layer bubble column reactor (Cu0.45Bi0.55 alloy/NaCl salt) operating at 900–1100 °C. The system achieved continuous operation for over 72 h without clogging. Crucially, the selected NaCl salt offers distinct advantages: its low cost, non-toxicity and high water solubility facilitate effective carbon separation strategies. This configuration reduced metal contamination in carbon from 52.4 wt% to below 4.0 wt%, with post-treatment achieving ultralow metal content below 1.5 wt%. Moreover, the molten salt environment induced valuable structural modifications in the carbon. This work provides an economically viable process for co-producing clean hydrogen and high-value carbon, addressing key technical barriers in molten media reactors.
1. Introduction
In the context of large amounts of greenhouse gases produced by the combustion of fossil fuels, exploring alternative green fuels has become crucial. Hydrogen, with its high calorific value and the advantage of no carbon dioxide emissions during combustion, is of great significance for achieving the strategic goal of “carbon neutrality” and is expected to become the preferred fuel of the future [1,2,3]. Presently, the primary source of global hydrogen production is Steam methane reforming (Equation (1)); however, this method generates over 300 million tons of carbon dioxide every year, leading to substantial environmental pollution [4].
Methane pyrolysis (Equation (2)) offers a promising alternative to Steam methane reforming, providing a means to produce solid carbon byproducts that are easily separable, transportable, and storable, all while minimizing carbon dioxide emissions [5].
However, non-catalytic gas-phase methane pyrolysis demands exceedingly high temperatures (>1200 °C) and exhibits relatively modest hydrogen selectivity and methane % conversion [6]. To overcome these limitations, catalytic approaches have been developed to lower the activation energy and enhance reaction kinetics. Transition metals, such as Ni, Fe, Co, Cu [7,8,9,10], and carbon-based catalysts [11,12,13,14,15], have been widely applied in methane pyrolysis, demonstrating excellent catalytic performance while facing challenges of deactivation due to carbon deposition [16,17]. The adoption of liquid catalysts presents an elegant solution to the issue of catalyst deactivation. In a bubble reactor replete with liquid catalysts, methane is introduced at the reactor’s base, ascending in the form of gas bubbles through the molten medium. During this ascent, low-density carbon byproducts generated during the decomposition process accumulate at the uppermost layer of the molten medium, facilitating separation during continuous operation [18,19]. Previous studies have indicated that the purity of carbon products obtained through molten metal-catalyzed pyrolysis is relatively low, with a significant presence of metals mixed into the carbon products [20]. Rahimi et al. reported the presence of up to 83 wt% metal content in carbon products when employing molten NiBi alloys for pyrolysis [21]. Given the relatively high cost of many metal catalysts, such as Cu, Ni, and Pd, the extent of metal losses proves insufficient to meet the requirements of most commercial applications.
During the ascent of methane bubbles in a molten medium within a bubble column, they not only transport the carbon generated from pyrolysis but also carry molten metal entrained within them. The removal of entrained liquid metal through the utilization of two immiscible liquids has been widely employed [22,23,24,25,26]. Introducing a molten salt layer onto the molten metal surface to mitigate metal contamination and reduce metal losses has been proven to be a viable strategy. Rahimi et al. reported that as the bubbles separate from the metal–salt interface, the metal surface film ruptures, resulting in the formation of small metal droplets that, owing to their higher density, settle back into the metal phase [21].
Efforts to minimize metal contamination in carbon by employing salt also require reducing salt contamination in metal. Baumli et al. proposed a semi-empirical model for the adhesion energy between alkali halide salts and carbon. It was found that the adhesion energy between molten alkali halide salts and graphite carbon increases with the square of the cation radius and inversely with the anion radius of the salt [25]. Based on the established equation, the adhesive energies of NaBr, NaCl, KBr, and KCl with graphite were determined to be 61, 66, 113, and 122 mJ·m−2, respectively. Parkinson et al. observed that carbon purity linearly increases with decreasing internuclear spacing of the salt [27]. Carbon obtained from NaCl exhibited significantly higher purity after washing compared to other halide salts. NaCl proves to be a more cost-effective choice than other alkali halide salts, which exhibit lower adhesion energy with carbon. Additionally, NaCl possesses the smallest internuclear spacing among commonly used alkali halide salts, potentially resulting in minimal salt contamination in the carbon.
Catalytic methane pyrolysis was investigated using a two-phase bubble reactor comprising molten Cu0.45Bi0.55 alloy and NaCl salt. The Cu0.45Bi0.55 alloy functions as an active catalytic medium, whereas NaCl, despite its limited catalytic activity, effectively minimizes carbon adhesion. This reactor configuration was designed to address several critical questions regarding system stability, product purity, and carbon characteristics, namely, whether the liquid metal–molten salt interface remains stable under continuous operation; whether metal contamination in solid carbon can be reduced without compromising methane conversion; whether the produced carbon can be efficiently separated from the salt phase; and how the structural properties of the carbon products are influenced by the dual-phase environment.
2. Experiment
2.1. Description of the Bubble Reactor
The experimental configuration, as depicted in Figure 1, involves methane pyrolysis within a quartz tube boasting an inner diameter of 40 mm and an overall length of 600 mm. Gases are introduced from the reactor’s base, the diameter of the vent pipe is 6 mm, and it passes through a 125-mesh sand core to enter the reactor, while the reactor temperature is measured with a K-type thermocouple. The liquid metal catalyst used in the experiment was Cu0.45Bi0.55, and the selected hydrochloride salt was NaCl (99.99%) (Shanghai McLyn Biochemical Technology Co., Ltd., Shanghai, China).
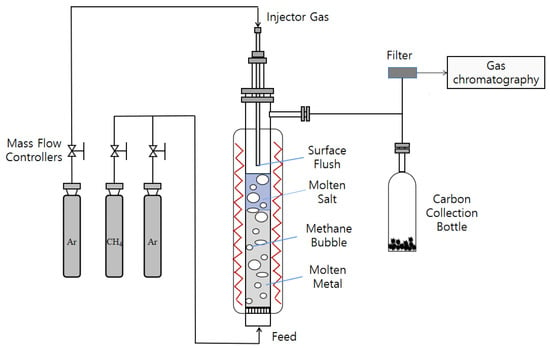
Figure 1.
Experimental setup for a bubble reactor system.
In the experimental setup, CH4(Chengdu Longtai Industrial Gas Co., Ltd., Chengdu, China) is introduced at the bottom of the reactor, and the gas flow is precisely regulated using a calibrated mass flow controller (MFC). The product gas was analyzed using a gas chromatograph (GC9770Plus) to monitor reaction progress. With the gas flow rate controlled at 80 sccm, steady-state operation was confirmed through automated sampling at 1.6-min intervals. The GC was equipped with both a thermal conductivity detector (TCD) for hydrogen quantification and a flame ionization detector (FID) for monitoring methane consumption. Pressure monitoring of the reactor inlet and outlet is carried out to avoid the safety hazard caused by the blockage of the inlet.
Before commencing the experiment, the reactor’s inlet was maintained at a flow rate of 30 mL·min−1 for argon (Ar) (Chengdu Longtai Industrial Gas Co., Ltd., Chengdu, China). The reactor temperature was then gradually increased from room temperature to 1100 °C at a rate of 5 °C·min−1. Initially, pure Ar was introduced into the reactor, serving as a sweep gas to establish an oxygen-free environment, and this continued until the system reached its operational temperature. Following this, the system was held at a constant 1100 °C for 400 min. Once the temperature was both achieved and stabilized, CH4 was introduced into the reactor. The gases exiting the reactor were automatically sampled through a gas chromatograph to calculate methane % conversion.
Since the liquid metal did not completely occupy the entire reactor volume, a heating zone with a certain height above the liquid column remained. As methane ascended into this zone, it continued to undergo thermal decomposition. To address this, we introduced a 1.5 mm inner diameter alumina tube at the top of the reactor, positioned 20 mm above the liquid surface. This tube was used to introduce inert gas, specifically argon (Ar), for purging. Its dual purpose was to cool the reaction gases and minimize the residence time of these gases in the upper thermal region of the reactor. This minimization aimed to mitigate the potential influence of the elevated temperature zone at the top of the reactor on methane % conversion. The alumina tube fulfilled an additional critical function by expeditiously purging any carbon byproducts generated during methane pyrolysis within the reactor. The expelled carbon was collected in a dedicated receptacle, preventing prolonged accumulation within high-temperature reactors, which could potentially alter the properties of carbon.
The catalytic liquid metal bubble reactor model was studied by Lionel J. J. [28]. previously effectively predicted methane conversion in liquid metal bubble column, laying the groundwork for reactor design optimization. Couple the material balance equation of the gas phase in the differential volume composed of height dL (Equation (3)) and the pressure change of the gas passing through the differential volume element (Equation (4)) into a system of differential equations.
where Rc and Rn are, respectively, the catalytic and non-catalytic reaction rates per unit volume of gas (mol·m−3·s−1), α is the gas holdup (m3 gas·m−3 reactor), D is the reactor inner diameter (m), is the inlet mole flow rate (mol·s−1) of methane at the bottom of the reactor, and is the change in methane conversion (dimensionless) occurring in the differential volume. The values of Rc and Rn vary at different temperatures and fall within specific ranges. The range of Rc is 0.008–0.1 mol/m3·s, while the range of Rn is 1.5 × 10⁻⁶–2.0 × 10⁻⁴ mol/m3·s.
We incorporate parameters such as reaction rate, gas holdup, and slurry density into the equation system to obtain the predicted methane conversion rate value. In this study, we utilize this model to predict methane conversion in a two-phase reactor, laying the foundation for optimizing the ratio of liquid metal to molten salt in such reactors.
To study the impact of salt additives on carbon purity and morphology, three distinct reactor configurations were employed within a 600 mm reactor:(1) 200 mm Cu0.45Bi0.55 coupled with 200 mm NaCl (Cu0.45Bi0.55–NaCl (200–200)), (2) 200 mm Cu0.45Bi0.55 combined with 100 mm NaCl (Cu0.45Bi0.55–NaCl (200–100)), and (3) 400 mmCu0.45Bi0.55 (400). Varying methane flow rates were introduced into the reactor, and a comprehensive study was conducted on the carbon expelled during the process.
2.2. Recovery and Processing of Solid Carbon Product
Except for some of the original carbon, the remaining solid carbon will undergo the following treatment: A1: The solid carbon is transferred to a centrifuge tube, deionized water is added, and it is then placed in a centrifuge to initially filter out the metals in the carbon. It is then repeatedly cleaned 10 times in an ultrasonic cleaner and subsequently dried in an oven at 100 °C under normal pressure. A2: The portion of carbon that has undergone A1 treatment is heated in a tube furnace at 1100 °C to facilitate the evaporation of any remaining salts and metals. A3: Another part of the carbon treated with A1 was repeatedly washed with a 1 mol·L−1 hydrochloric acid solution, and the purified carbon was then dried in an oven at 100 °C.
2.3. Characterization of the Carbon Product
X–ray diffraction was used to characterize the crystalline structure of the carbon product using a Panalytical Empyrean powder diffractometer with a monochromatic Cu–Kα source. The diffraction pattern was collected for 2θ = 10–80° with a step size of 0.02°. Raman spectra were obtained using a laser confocal Raman spectrometer equipped with a 532 nm laser. For morphological analysis of the recovered carbon products, high-resolution scanning electron microscopy (SEM) was employed, along with elemental analysis using energy-dispersive X-ray spectroscopy (EDS).
3. Results and Discussion
3.1. Reactor Performance
Methane is introduced into the reactor through a bottom-mounted bubbler, and the temperature-dependent % conversions within bubble tower reactors containing Cu0.45Bi0.55–NaCl (200–-200), Cu0.45Bi0.55–NaCl (200–100), and Cu0.45Bi0.55 (400) are depicted in Figure 2a. To ensure reliability, the methane conversion was measured in triplicate. The results showed good reproducibility, with the average value reported and a maximum deviation of 2%. Within the temperature range of 900–1100 °C, as the temperature rises, the methane conversion rate of Cu0.45Bi0.55–NaCl (200–200) decreases from 19.7% to 62.2%, the methane conversion rate of Cu0.45Bi0.55–NaCl (200–100) decreases from 19.3% to 55.6%, and the methane conversion rate of Cu0.45Bi0.55 (400) increases from 37.8% to 87.2%; methane % conversion exhibits an upward trend with increasing temperature. Notably, Cu0.45Bi0.55 (400) consistently demonstrates significantly higher methane % conversion across the entire temperature range compared to Cu0.45Bi0.55–-NaCl (200–200); it indicates that NaCl has a weaker catalytic effect on methane pyrolysis compared to Cu0.45Bi0.55.
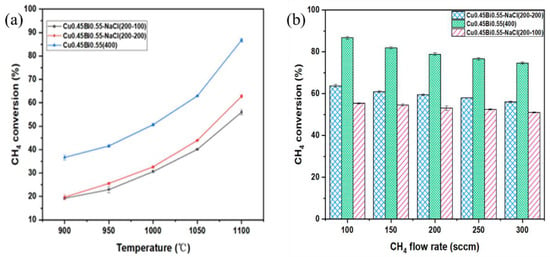
Figure 2.
(a) CH4 conversion versus temperature for a two-phase bubble reactor. Reactant gas = 100 sccm (100 mol% of CH4); sweep gas = 1 L·min−1 100 mol% of Ar). (b) CH4 conversion versus CH4 flow rate for Cu0.45Bi0.55 two-phase bubble reactor at 1100 °C. Reactant gas (100 mol% of CH4); sweep gas = 1 L·min−1 100 mol% of Ar).
Figure 2b shows the pattern of methane % conversion at 1100 °C as a function of flow rate. The flow rate governs both the ascent duration of bubbles and the time during which bubbles grow at the inlet of the reactor where reactants are introduced. Within the flow rate range of 100–300 mL·min−1, the ascent duration of bubbles in the 200 mm liquid metal varies from 0.52 to 0.36 s; as the methane flow increases, the methane conversion rate of Cu0.45Bi0.55–NaCl (200–200) decreases from 62.2% to 57.3%, the methane conversion rate of Cu0.45Bi0.55–NaCl (200–100) decreases from 55.6% to 50.4%, and the methane conversion rate of Cu0.45Bi0.55 (400) decreases from 87.2% to 81.3%, with larger flow rates resulting in shorter bubble ascent times, synonymous with reduced reaction times. Simultaneously, augmenting the flow rate curtails the period for bubble growth and reaction initiation at the reactor inlet. As the flow rate diminishes, the bubble growth time increases, thereby leading to an elevation in % conversion that corresponds to the prolonged bubble growth period [29]. Lower flow rates accentuate the influence of bubble growth time, and the most significant decline in % conversion is observed when increasing the flow rate from 100 mL·min−1 to 150 mL·min−1.
The introduction of Ar purging above the reactor mitigated the impact on % conversion in the reactor’s upper region and promptly expelled the solid carbon generated during pyrolysis, enabling uninterrupted reactor operation for 72 h without clogging. Figure 3 shows the comparison between the catalytic liquid metal bubble reactor model predictions and experimental results from the two-phase reactor (Cu0.45Bi0.55–NaCl (200–100)). The overall trend of the simulation results is consistent with that of the experimental results. As the gas intake volume increases, the conversion rate of methane decreases. This is because a higher intake volume will shorten the reaction time of methane, and as the temperature decreases, the conversion rate of methane also continuously drops. The simulated methane % conversion showed good agreement with experimental data within the 900–1050 °C range. However, a significant deviation emerged at 1100 °C, where the maximum discrepancy was observed at a flow rate of 100 sccm, while deviations under other conditions remained below 17%. As the methane flow rate increased, the experimental results progressively approached the simulated values. This behavior is consistent with mass transfer limitations at the gas–liquid interface under low-flow conditions, which restrict reactant access to catalytic sites. These limitations are alleviated at higher flow rates due to enhanced bubble dynamics and increased interfacial area, leading to improved agreement with the kinetic model.
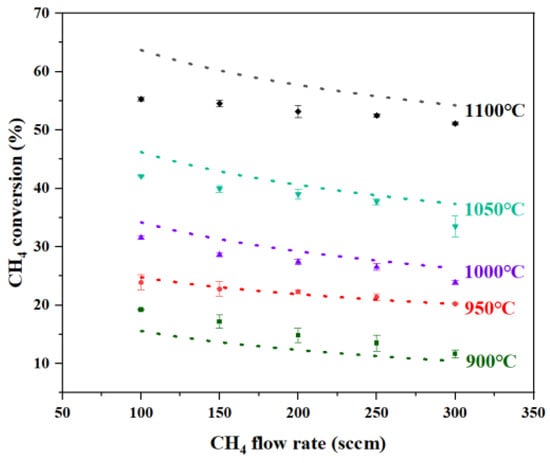
Figure 3.
Comparison of methane conversion between model predictions and experimental results at different temperatures and flow rates in Cu0.45Bi0.55–NaCl (200–100). (Markers represent experimental results, and lines represent model predictions).
3.2. Carbon Analysis
3.2.1. The Content of Carbon Product Elements
To produce sufficient carbon for characterization, continuous CH4 pyrolysis was conducted for 24 h in Cu0.45Bi0.55–NaCl (200–200), Cu0.45Bi0.55–NaCl (200–100) and Cu0.45Bi0.55 (400) at 1000 °C. The carbon blown out by the sweeping gas was collected in the glass bottle, as shown in Figure 4. The carbon obtained using different catalysts was treated in four ways—no treatment, A1, A2, and A3—and the EDS analysis results are shown in Table 1. It was evident that an increase in salt proportion correlated with a reduction in metal contamination within the carbon, highlighting the critical role of elevated salt content in mitigating metal impurities. The heightened salt column extends the residence time of bubbles, facilitating a more substantial return of molten metal carried in the carbon products to the metal layer, driven by the density differential between molten metal and molten salt. Predominantly, the source of metal contamination in the carbon was identified as bismuth (Bi), primarily due to its considerably lower boiling point relative to copper (Cu), rendering it more prone to vaporization.
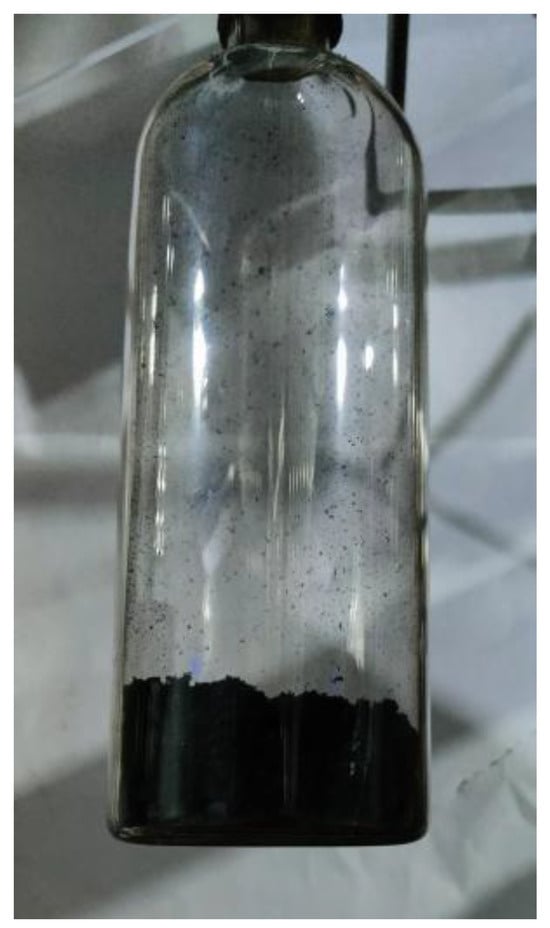
Figure 4.
Carbon produced in the Cu0.45Bi0.55-NaCl (200-100) reactor after methane pyrolysis at 1000 °C.

Table 1.
Average compositions of the carbon produced from methane pyrolysis in the metal/salt two-phase reactors.
A comprehensive water-washing procedure proved effective in purging a significant proportion of salt impurities, resulting in purity enhancements of approximately 34% and 50% for carbon retrieved from salt heights of 100 mm and 200 mm, respectively. Following water washing, subsequent treatments involving acid washing and vacuum heating at 1000 °C yielded carbon purities exceeding 95% in both cases. Remarkably, carbon reclaimed from a salt height of 200 mm, after water washing and vacuum heating, exhibited a carbon purity surpassing 98%; the feasibility of using molten metals and molten salts as composite catalysts is illustrated.
3.2.2. SEM Analysis
The SEM images of carbon obtained from three catalysts, Cu0.45Bi0.55–NaCl (200–200), Cu0.45Bi0.55–NaCl (200–100) and Cu0.45Bi0.55 (400), were captured using a scanning electron microscope (SEM) (Figure 5).
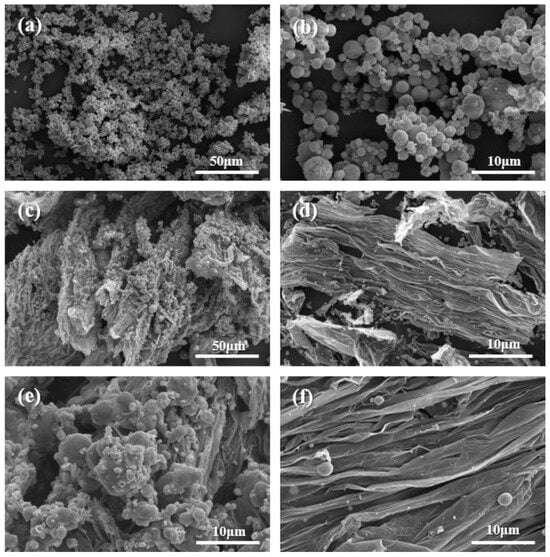
Figure 5.
SEM images of carbon extracted from Cu0.45Bi0.55–NaCl (200–-200) (a,b), Cu0.45Bi0.55–NaCl (200–100) (c,d) and Cu0.45Bi0.55(400) (e,f) reaction mixtures at different magnifications and locations.
Carbon collected from Cu0.45Bi0.55–NaCl (200–200) exhibited a spherical and irregular morphology; these irregular structures may be composed of spherical carbon that has not yet fully formed or has already broken (Figure 5a,b). Conversely, solid carbon recovered from Cu0.45Bi0.55 (400) displayed a sheet-like structure (Figure 5e,f), and through EDS analysis, it can be determined that the spherical structure at the top of the carbon sheet layer is bismuth (Bi) particles (Figure 6). As Figure 5c,d shows, carbon reclaimed from Cu0.45Bi0.55–NaCl (200–100) exhibited an intermediary morphology, incorporating characteristics from both Cu0.45Bi0.55–NaCl (200–-200) and Cu0.45Bi0.55 (400). It showcased a combination of spherical and sheet-like structures. Metal contamination in carbon is mostly mixed into the carbon in the form of particles, but there is a certain wettability between salt and carbon and can be evenly distributed in the carbon. This difference in existence may lead to differences in the morphology of the carbon product.
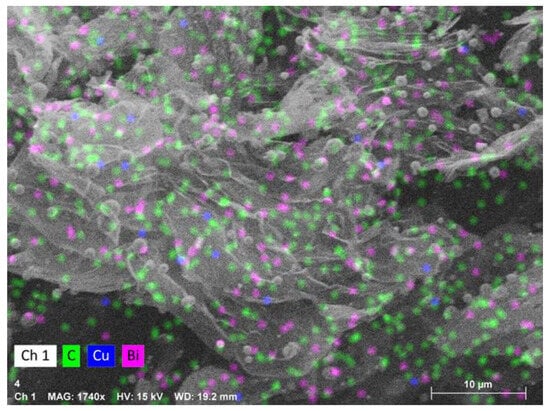
Figure 6.
EDS image of the carbon product obtained from Cu0.45Bi0.55 (400).
3.2.3. XRD and Raman Spectroscopy
To gain deeper insights into the carbon products and their formation mechanisms, we conducted XRD and Raman characterizations.
The XRD data for the carbon produced during pyrolysis in the Cu0.45Bi0.55–NaCl (200–200), Cu0.45Bi0.55–NaCl (200–100), and Cu0.45Bi0.55 (400) reactors are presented in Figure 7. The carbon obtained from the Cu0.45Bi0.55 (400) reactor exhibited substantial metal contamination, as evidenced by strong diffraction peaks corresponding to Cu and Bi. In contrast, in the XRD patterns of carbon obtained from the metallic phase and salt phase reactors, the peaks related to metals decreased, while the peaks related to NaCl were obvious. The XRD pattern of carbon generated in Cu0.45Bi0.55–NaCl (200–200) revealed smaller Cu and Bi peaks. Combined with EDS results, this indicates that increased salt height within the bubble reactor results in reduced metal contamination within the carbon.
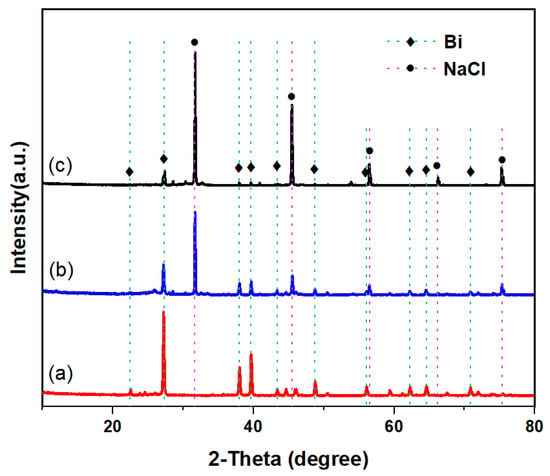
Figure 7.
XRD patterns of carbon extracted from (a) Cu0.45Bi0.55 (400), (b) Cu0.45Bi0.55–NaCl (200–100), and (c) Cu0.45Bi0.55–NaCl (200–200).
To further characterize the carbon, Raman spectroscopy analysis was conducted on the carbon obtained from reactors Cu0.45Bi0.55–NaCl (200–200), Cu0.45Bi0.55–NaCl (200–100), and Cu0.45Bi0.55 (400) (Figure 8). The Raman spectrum of all carbon samples shown in the figure shows clear D and G bands (~1350 cm−1 and 1585 cm−1, respectively). The D band at 1350 cm−1 is attributed to the defects of the crystalline carbon, whereas the G band, at around 1585 cm−1, is assigned to the sp2 carbon networks. The ratio of the peak intensities ID/IG indicates the degree of graphitization of the carbon sample [30]. Typically ideal graphite without defects (0% sp3) has an ID/IG of zero. The ID/IG ratio for Cu0.45Bi0.55–NaCl (200–200), Cu0.45Bi0.55–NaCl (200–100) and Cu0.45Bi0.55 (400) carbon was 1.67, 1.02 and 0.77, respectively. The relatively low ID/IG of the carbon derived from Cu0.45Bi0.55 (400) indicates that the carbon obtained by the catalytic of pure melting Cu0.45Bi0.55 has a highly graphene structure. Carbon obtained from Cu0.45Bi0.55 (400) displayed a strong G’ band around 2700 cm−1, which is characteristic of graphitic carbon, indicating the existence of graphene layers. Conversely, this band was negligible for the carbon products from Cu0.45Bi0.55–NaCl (200–200) and Cu0.45Bi0.55–NaCl (200–100). The degree of graphene of carbon decreases as the ratio of salt in the catalyst increases.
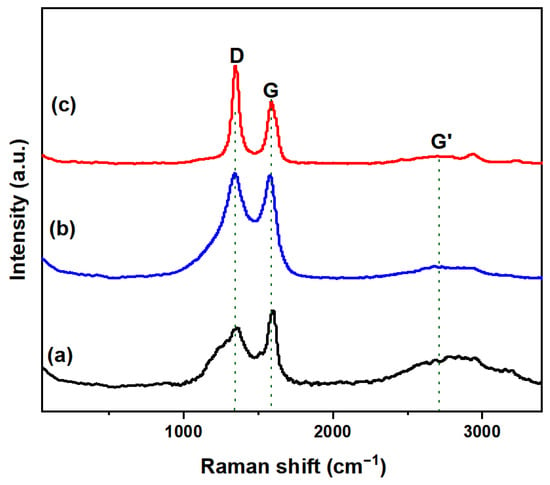
Figure 8.
Raman spectra of carbon extracted from (a) Cu0.45Bi0.55 (400), (b) Cu0.45Bi0.55–NaCl (200–100), and (c) Cu0.45Bi0.55–NaCl (200–200).
3.3. The Impurity Removal Mechanism in a Two-Phase Reactor
The mechanism of carbon formation in the two-phase reactor of molten metal–molten salt is shown in Figure 9. The efficient separation of metal, salt, and carbon, which is crucial for minimizing product contamination and ensuring reactor stability, is fundamentally governed by pronounced differences in density and interfacial properties. The process initiates as low-density carbon produced from methane pyrolysis ascends through the dense molten Cu-Bi alloy, inevitably entraining fine metal droplets. Upon reaching the interface between the molten metal and the overlying NaCl salt, a critical purification step occurs: the significant density contrast provides a strong buoyancy force that drives the entrained metal droplets to settle back into the underlying metal phase. Concurrently, the high interfacial tension between the non-wetting metal and salt phases promotes the rupture of the metal film surrounding the bubbles, thereby efficiently liberating the carbon into the salt layer [21]. Finally, the weak adhesion energy between NaCl and carbon, coupled with the high water solubility of the salt, enables the facile and complete separation of the solid carbon product through simple washing. This synergistic mechanism, leveraging both density-driven forces and interfacial phenomena, underpins the achievement of high-purity carbon with metal contamination below 1.5 wt% and salt residue under 3.1 wt%. Therefore, the ultimate purity of carbon hinges upon the crucial factor of whether salt and carbon can be effectively separated, and this is contingent upon the adhesion energy of carbon by the salt. Baumli et al. [26] reported from semi-empirical consideration that the adhesion energy between the molten alkali halide salts and graphitic carbon increases with the square of the cation radius and the inverse of the anion radius. According to Parkinson et al. [27], the carbon obtained through methane pyrolysis using various molten alkali halide salts exhibits the following carbon purities after washing with water in the order: NaCl > NaBr > KCl > (Na, K)Br > KBr. The carbon purity was found to increase linearly with a decrease in the salt’s internuclear spacing. Overall, NaCl shows low adhesion energy to the carbon and the internuclear spacing is small, so the carbon obtained in the Cu0.45Bi0.55-NaCl reactor can be removed from most of the salt contamination after water washing.
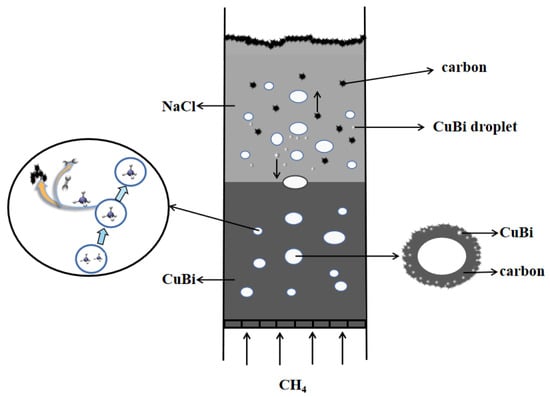
Figure 9.
Mechanism of methane pyrolysis in molten Cu0.45Bi0.55–NaCl.
Adding salts at varying concentrations results in different morphologies of the carbon products. As reported by Parkinson et al. [27], carbon derived from methane pyrolysis within molten NaCl exhibits a cauliflower-like structure characterized by an abundance of spherical particles. Figure 10 shows the EDS mapping of carbon acquired from the Cu0.45Bi0.55–NaCl (200–200) reactor, revealing a distinct metal distribution pattern (metal particles) within the carbon. NaCl demonstrates a homogeneous distribution across the spherical carbon particles, while the initially sheet-like carbon, produced within the liquid Cu0.45Bi0.55 alloy, undergoes a curvature process, forming spherical structures under the influence of the salt.
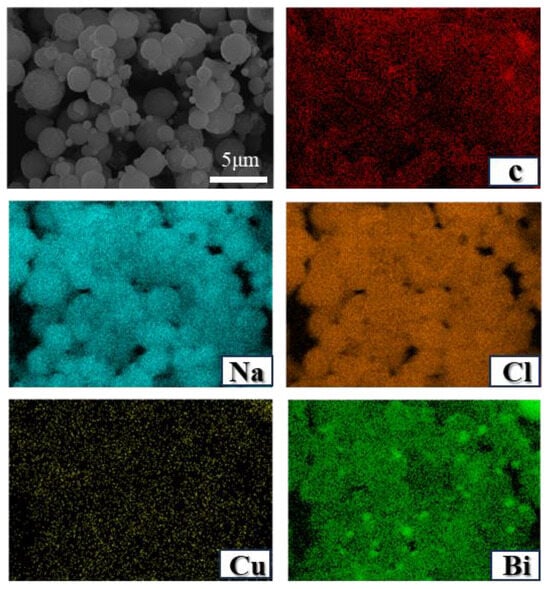
Figure 10.
SEM images and EDS mapping results (chemical compositions) of carbon extracted from Cu0.45Bi0.55–NaCl (200–200).
4. Conclusions
This work advances beyond prior studies on salt-layer filtration by demonstrating a practical and integrated dual-phase system. Unlike previous reports of short-term experiments with high metal contamination (e.g., 83 wt% [21]), the optimized Cu0.45Bi0.55–NaCl reactor achieves exceptional long-term stability (>72 h) and drastically reduces metal content in carbon to 1.5 wt%. By combining a low-cost salt with high carbon purity and effective in situ separation, the carbon byproduct is transformed from a waste into a high-value material, representing a significant step towards industrial application.
The bubble reactor, using Cu0.45Bi0.55 alloy with NaCl salt, ran continuously for 240 h without clogging, thanks to the timely expulsion of solid carbon generated during methane pyrolysis via Ar purging. When carbon produced during the pyrolysis of methane within the molten metal passes through the molten salt layer, the metal contaminants entrapped within the carbon tend to descend to the lower liquid metal layer due to density differences. The carbon extracted from Cu0.45Bi0.55–NaCl (200–200) and Cu0.45Bi0.55–NaCl (200–100) reactors demonstrated impressively low metal content, with values as low as 2.24 wt% and 3.78 wt%, respectively. The impact of salt on the final purity of carbon can be attributed to two key factors: salt’s wetting characteristics on carbon and the interlayer spacing of the salt. Notably, NaCl exhibits relatively limited wetting properties on carbon and possesses the smallest internuclear spacing among alkali halide salts. Following rigorous deionized water washing, the carbon purity from Cu0.45Bi0.55–NaCl (200–200) and Cu0.45Bi0.55–NaCl (200–100) was significantly enhanced to 92.27% and 91.36%, respectively. Subsequent purification via repeated washing with 1M HCl culminated in carbon purities reaching 93.03 wt% and 93.89 wt%, respectively.
SEM analysis revealed that carbon obtained in the pure Cu0.45Bi0.55 reactor exhibited a laminar structure, while carbon obtained in the metal/salt biphasic reactors contained both lamellar and spherical structures. Furthermore, the presence of salt in the reactor led to the formation of substantial spherical carbon structures. It was observed that, as the height of the salt layer increased, the resulting carbon tended to exhibit a more pronounced spherical structure. The interaction between carbon and salt during its passage through the salt layer induced structural changes in carbon. Raman spectroscopy results confirmed a reduction in carbon graphitization upon the introduction of the salt layer.
As proposed in this study, the introduced salts hold promise for mitigating metal contamination in carbon and can be integrated into process design. Additionally, it is imperative to consider the impact of salt on carbon structure and choose the appropriate salt layer height to meet specific carbon market requirements.
Author Contributions
Investigation, X.S.; methodology, J.L. and X.L.; project administration X.L.; resources, F.G.; supervision, J.W.; validation, X.S. and X.O.; writing—original draft, X.S.; writing—review and editing, X.S. and J.W. All authors have read and agreed to the published version of the manuscript.
Funding
This work was supported by the Young Scientists Fund of National Natural Science Foundation of China (No. 11905151).
Data Availability Statement
The original contributions presented in this study are included in the article. Further inquiries can be directed to the corresponding authors.
Conflicts of Interest
All the authors have no conflicts of interest.
References
- Midilli, A.; Ay, M.; Dincer, I.; Rosen, M. On hydrogen and hydrogen energy strategies I: Current status and needs. Renew. Sustain. Energy Rev. 2005, 9, 255–271. [Google Scholar] [CrossRef]
- Midilli, A.; Ay, M.; Dincer, I.; Rosen, M. On hydrogen and hydrogen energy strategies II: Future projections affecting global stability and unrest. Renew. Sustain. Energy Rev. 2005, 9, 273–287. [Google Scholar] [CrossRef]
- Muradov, N.Z.; Veziroglu, T.N. ”Green” path from fossil-based to hydrogen economy: An overview of carbon-neutral technologies. Int. J. Hydrogen Energy 2008, 33, 6804–6839. [Google Scholar] [CrossRef]
- Muradov, N. Low to near-zero CO2 production of hydrogen from fossil fuels: Status and perspectives. Int. J. Hydrogen Energy 2017, 42, 14058–14088. [Google Scholar] [CrossRef]
- Chen, C.-J.; Back, M.H.; Back, R.A. The thermal decomposition of methane. II. Secondary reactions, autocatalysis and carbon formation; non-Arrhenius behaviour in the reaction of CH3 with ethane. Can. J. Chem. 1976, 54, 3175–3184. [Google Scholar] [CrossRef]
- Muradov, N.; Smith, F.; Huang, C.; T-Raissi, A. Autothermal catalytic pyrolysis of methane as a new route to hydrogen production with reduced CO2 emissions. Catal. Today 2006, 116, 281–288. [Google Scholar] [CrossRef]
- Ashik, U.P.M.; Wan Daud, W.A.; Abbas, H.F. Production of greenhouse gas free hydrogen by thermocatalytic decomposition of methane-A review. Renew. Sustain. Energy Rev. 2015, 44, 221–256. [Google Scholar] [CrossRef]
- Pudukudy, M.; Yaakob, Z.; Jia, Q.; Takriff, M.S. Catalytic decomposition of undiluted methane into hydrogen and carbon nanotubes over Pt promoted Ni/CeO2 catalysts. New J. Chem. 2018, 42, 14843–14856. [Google Scholar] [CrossRef]
- Kopp, M.; Coleman, D.; Stiller, C.; Scheffer, K.; Aichinger, J.; Scheppat, B. Energiepark Mainz: Technical and economic analysis of the worldwide largest Power-to-Gas plant with PEM electrolysis. Int. J. Hydrogen Energy 2017, 42, 13311–13320. [Google Scholar] [CrossRef]
- Kutteri, D.A.; Wang, I.-W.; Samanta, A.; Li, L.; Hu, J. Methane decomposition to tip and base grown carbon nanotubes and COx free H2 over mono- and bimetallic 3d transition metal catalysts. Catal. Sci. Technol. 2018, 8, 858–869. [Google Scholar] [CrossRef]
- Dunker, A.; Kumar, S.; Mulawa, P. Production of hydrogen by thermal decomposition of methane in a fluidized-bed reactor-Effects of catalyst, temperature, and residence time. Int. J. Hydrogen Energy 2006, 31, 473–484. [Google Scholar] [CrossRef]
- Patel, S.; Kundu, S.; Halder, P.; Marzbali, M.H.; Chiang, K.; Surapaneni, A.; Shah, K. Production of hydrogen by catalytic methane decomposition using biochar and activated char produced from biosolids pyrolysis. Int. J. Hydrogen Energy 2020, 45, 29978–29992. [Google Scholar] [CrossRef]
- Abbas, H.F.; Daud, W.W. Influence of reactor material and activated carbon on the thermocatalytic decomposition of methane for hydrogen production. Appl. Catal. A Gen. 2010, 388, 232–239. [Google Scholar] [CrossRef]
- Botas, J.; Serrano, D.; Guil-López, R.; Pizarro, P.; Gómez, G. Methane catalytic decomposition over ordered mesoporous carbons: A promising route for hydrogen production. Int. J. Hydrogen Energy 2010, 35, 9788–9794. [Google Scholar] [CrossRef]
- Bai, Z.; Chen, H.; Li, W.; Li, B. Hydrogen production by methane decomposition over coal char. Int. J. Hydrogen Energy 2006, 31, 899–905. [Google Scholar] [CrossRef]
- Abánades, A.; Rubbia, C.; Salmieri, D. Thermal cracking of methane into Hydrogen for a CO2-free utilization of natural gas. Int. J. Hydrogen Energy 2013, 38, 8491–8496. [Google Scholar] [CrossRef]
- Abánades, A.; Rubbia, C.; Salmieri, D. Technological challenges for industrial development of hydrogen production based on methane cracking. Energy 2012, 46, 359–363. [Google Scholar] [CrossRef]
- Steinberg, M. Fossil fuel decarbonization technology for mitigating global warming. Int. J. Hydrogen Energy 1999, 24, 771–777. [Google Scholar] [CrossRef]
- Geißler, T.; Plevan, M.; Abánades, A.; Heinzel, A.; Mehravaran, K.; Rathnam, R.; Rubbia, C.; Salmieri, D.; Stoppel, L.; Stückrad, S.; et al. Experimental investigation and thermo-chemical modeling of methane pyrolysis in a liquid metal bubble column reactor with a packed bed. Int. J. Hydrogen Energy 2015, 40, 14134–14146. [Google Scholar] [CrossRef]
- Upham, D.C.; Agarwal, V.; Khechfe, A.; Snodgrass, Z.R.; Gordon, M.J.; Metiu, H.; McFarland, E.W. Catalytic molten metals for the direct conversion of methane to hydrogen and separable carbon. Science 2017, 358, 917–920. [Google Scholar] [CrossRef]
- Rahimi, N.; Kang, D.; Gelinas, J.; Menon, A.; Gordon, M.J.; Metiu, H.; McFarland, E.W. Solid carbon production and recovery from high temperature methane pyrolysis in bubble columns containing molten metals and molten salts. Carbon 2019, 151, 181–191. [Google Scholar] [CrossRef]
- Song, D.-Y.; Maruoka, N.; Maeyama, T.; Shibata, H.; Kitamura, S.-Y. Influence of Bottom Bubbling Condition on Metal Emulsion Formation in Lead-Salt System. ISIJ Int. 2010, 50, 1539–1545. [Google Scholar] [CrossRef][Green Version]
- Journée, D. Helium Bubbling in a Molten Salt Fast Reactor. Master’s Thesis, Delft University of Technology, Delft, The Netherlands, 2014; pp. 7–12. [Google Scholar][Green Version]
- Lofstrom, G. Solid Salt Fluxing of Molten Aluminum. Master’s Thesis, The Ohio State University, Columbus, OH, USA, 2013. [Google Scholar][Green Version]
- Natsui, S.; Takai, H.; Kumagai, T.; Kikuchi, T.; Suzuki, R.O. Multiphase Particle Simulation of Gas Bubble Passing Through Liquid/Liquid Interfaces. Mater. Trans. 2014, 55, 1707–1715. [Google Scholar] [CrossRef]
- Baumli, P.; Kaptay, G. Wettability of carbon surfaces by pure molten alkali chlorides and their penetration into a porous graphite substrate. Mater. Sci. Eng. A Struct. Mater. Prop. Microstruct. Process. 2008, 495, 192–196. [Google Scholar] [CrossRef]
- Parkinson, B.; Patzschke, C.F.; Nikolis, D.; Raman, S.; Dankworth, D.C.; Hellgardt, K. Methane pyrolysis in monovalent alkali halide salts: Kinetics and pyrolytic carbon properties. Int. J. Hydrogen Energy 2021, 46, 6225–6238. [Google Scholar] [CrossRef]
- Catalan, L.J.; Rezaei, E. Modelling the hydrodynamics and kinetics of methane decomposition in catalytic liquid metal bubble reactors for hydrogen production. Int. J. Hydrogen Energy 2022, 47, 7547–7568. [Google Scholar] [CrossRef]
- Kang, D.; Rahimi, N.; Gordon, M.J.; Metiu, H.; McFarland, E.W. Catalytic methane pyrolysis in molten MnCl2-KCl. Appl. Catal. B Environ. 2019, 254, 659–666. [Google Scholar] [CrossRef]
- Ferrari, A.C.; Robertson, J. Interpretation of Raman spectra of disordered and amorphous carbon. Phys. Rev. B 2000, 61, 14095–14107. [Google Scholar] [CrossRef]
Disclaimer/Publisher’s Note: The statements, opinions and data contained in all publications are solely those of the individual author(s) and contributor(s) and not of MDPI and/or the editor(s). MDPI and/or the editor(s) disclaim responsibility for any injury to people or property resulting from any ideas, methods, instructions or products referred to in the content. |
© 2025 by the authors. Licensee MDPI, Basel, Switzerland. This article is an open access article distributed under the terms and conditions of the Creative Commons Attribution (CC BY) license (https://creativecommons.org/licenses/by/4.0/).