Abstract
Process intensification has gained significant importance during the last few years because of its potential to develop innovative structures with improved energy efficiency and better economics. One approach that has been developed in this field is the transformation of a process flowsheet with a series of conventional units into another one with minimal pieces of equipment. In this work we consider a base process to produce ethyl tert-butyl ether, which consists of a reactor and an isobaric distillation sequence. Given a set of design options provided by the gradual intensification of any processes that contain a dividing wall, reactive distillation, or reactive dividing wall columns, we take those intensified structures and make them subject to a multi-objective optimization task. The formulation consists of the minimization of the combination of economic, environmental, and inherent safety components. Different policies are simulated through weights assigned to each of those components. It is shown that the optimal structure depends on the priorities given to each term of the multi-objective formulation, and that the application of the optimization procedure further improves the economic and environmental potential provided by the base, fully intensified process, with reductions of up to 27.9 and 6.2 percent in those metrics.
1. Introduction
Process synthesis has evolved from its initial objectives, based primarily on economic aspects, to include components such as environmental, safety, and operability considerations. Also, the development of design tools and methods and the availability of more powerful computing resources has influenced the growth of the process systems engineering (PSE) field. One of the aspects that has been addressed with special interest is that of process intensification, which also has evolved from early works, such as those showing energy integration [1,2] and mass and water integration [3,4,5,6] to the design of complex systems in the form of intensified processes. Three technologies stand out as great examples of intensified processes: reactive distillation columns (RDCs), dividing wall columns (DWCs), and reactive dividing wall columns (RDWCs). RDCs are based on the integration of chemical reaction and distillation operations in a single equipment unit. This technology has been shown to offer significant incentives that include reduced capital investment and energy savings, effects aided by outcomes such as overcoming equilibrium limitations and improving separation efficiency [7,8,9,10]. DWCs are based on partitioning walls implemented into a single shell to separate multicomponent mixtures into high-purity products, with lower energy, capital, and space requirements compared to conventional distillation systems [11,12,13]. Lastly, RDWCs make use of the incentives provided by the other two structures by integrating a reactive distillation column within a dividing wall structure, thus enhancing the efficiency of the process. Experimental, modeling, and control studies have been reported as part of the development of this type of technology [14,15].
Works based on mathematical programming of meta-heuristic techniques for the design of intensified systems have been developed. For instance, Tian et al. [16] used multiparametric programming for the synthesis of intensified systems. Behroozsarand and Shafiei [17] used a genetic algorithm within a multi-objective optimization approach to design reactive distillation columns for the transesterification of n-butanol.
Another approach to process intensification that has been developed is the transformation of a conventional chemical process into an intensified unit with one piece of equipment. Garg et al. [18] presented a framework based on the use of phenomena building blocks to generate novel intensified processes, which was applied to a dimethyl ether production process. Demirel et al. [19] used building block concepts within a multi-objective optimization model with an application in the synthesis of an ethylene glycol process. Castillo-Landero et al. [20] developed an intensification methodology based on a gradual reduction in the pieces of equipment of a conventional flowsheet and showed the benefits to economic, energy, and sustainability components for each of the intensified structures. An extension of this approach to include inherent safety aspects was reported by Castillo-Landero et al. [21] and showed that the flowsheet with lowest risk does not necessarily correspond to a fully intensified option. Tusso-Pinzón et al. [22] used these concepts to design several intensified options to produce ethyl lactate. Reviews highlighting developments, challenges, and opportunities for the application of process intensification techniques to design novel process alternatives have been reported [23,24,25].
Gómez-Ochoa and Jiménez-Gutiérrez [26] have recently used the gradual intensification methodology for an ethyl tert-butyl ether (ETBE) production process to develop two partially intensified flowsheets with two units and a fully intensified alternative with one single piece of equipment. The intensified structures were shown to provide economic and environmental benefits with respect to the conventional flowsheet. Their analysis was based on the design of isobaric distillation systems.
In this work, we take the reported flowsheets for ETBE production [26] and make them subject to a multi-objective optimization technique that combines economic, environmental, and inherent safety aspects. Table 1 reports recent efforts in optimization studies applied to several types of ETBE processes in contrast to the flowsheets considered in this work. The objective function is formulated with the use of weights for each component. The optimization is carried out with a non-dominated sorting genetic algorithm, for which each search point towards the optimal structure is aided by the use of the Aspen Plus process simulator. The objective is to further improve the benefits reported for the intensified processes by optimizing operating conditions and key design variables for the flowsheets, such as the individual design pressure for each distillation unit or reactive distillation column. Also, the effect of using different weights on the components of the multi-objective formulation to reflect different priority scenarios is assessed.

Table 1.
Recent research on optimization of the ETBE production process.
2. Ethyl Tert-Butyl Ether (ETBE) Production
ETBE is an important chemical compound, with environmentally friendly characteristics, used as an alternative gasoline additive to methyl tert-butyl ether. Several works have analyzed the production of ETBE from different perspectives. Linan et al. [33] studied the optimal production of ETBE using a catalytic distillation column with an objective function based on economic terms. Bernal et al. [30] developed a model involving two objective functions related to economic and control performances. Babaie and Esfahany [34] used a hybrid technique to perform an economic optimization of ETBE production, for which several process technologies, such as RDC, heat integrated distillation columns, and pervaporation systems were considered. Domingues et al. [27] studied the design of optimal RDCs from an economic viewpoint, considering catalyst deactivation using metaheuristic optimization techniques such as genetic algorithms and particle swarm optimization.
The ETBE process is based on the reaction between ethanol and isobutene over an acid catalyst.
The kinetic equation for this reaction (Equation (2)) was reported by Zhang et al. [35]. The equation was developed using the Langmuir–Hinshelwood/Hougen–Watson model and has been adopted by other authors [36,37].
where ai is the chemical activity, krate is the reaction rate constant given by the Arrhenius equation (Equation (3)), KEtOH is the EtOH adsorption equilibrium constant (Equation (4)), KETBE is the thermodynamic equilibrium constant (Equation (5)) and mcat is the mass of catalyst.
UNIFAC was used as the solution model for non-idealities in the liquid phase and the Soave–Redlich–Kwong (SRK) model was used as the equation of state for the gas phase.
Recker et al. [28] reported a conventional flowsheet with a reactor and three distillation columns. That process was taken as a basis by Gómez-Ochoa and Jiménez-Gutiérrez [26] for the application of an intensification methodology aiming at gradually reducing the number of units. By ignoring the last column of the flowsheet, with 98 trays, which recovered the isobutene raw material, they developed three intensified alternatives for the remaining process with the reactor and two distillation columns. From the gradual intensification methodology, two alternatives partially intensified with two units and another one fully intensified with one unit were developed. The intensified alternatives showed significant economic and energy savings with respect to the base conventional process. Despite their advantages, the intensified alternatives reported in that work were not subjected to optimization efforts. Therefore, each of those flowsheets could be further improved by the application of optimization techniques. This objective is developed in this work through the application of a multi-objective optimization formulation that minimizes economic, environmental, and inherent safety components.
The flowsheets for the conventional base process and the intensified alternatives are shown in Figure 1, Figure 2, Figure 3 and Figure 4. Those flowsheets are identified as follows:
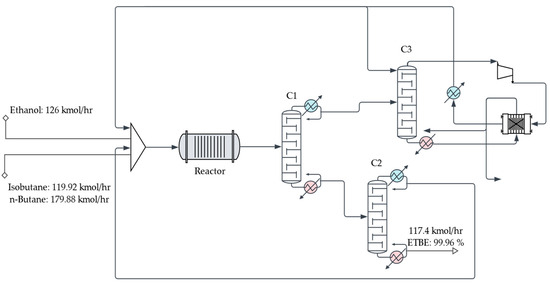
Figure 1.
Conventional ETBE production process.
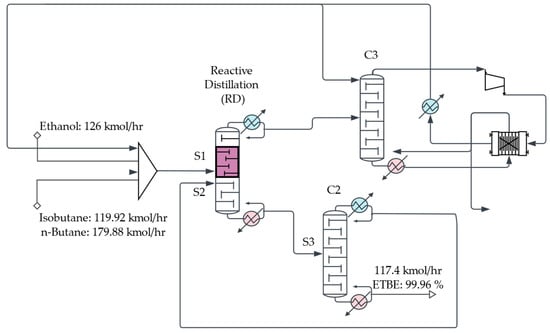
Figure 2.
Partial intensification of the ETBE process with a reactive distillation column (RDC option).
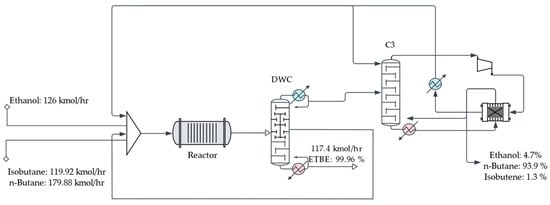
Figure 3.
Partial intensification of the ETBE process with a dividing wall column (DWC option).
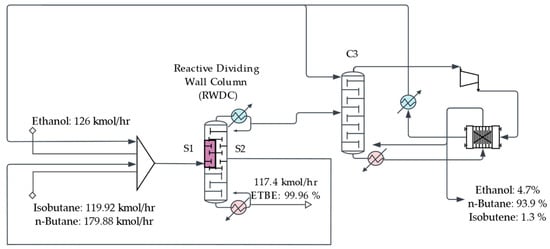
Figure 4.
Full intensification of the ETBE process with a reactive dividing wall column (RDWC option).
- (a)
- The original process with a reactor and three distillation columns. We note that column C3 of the flowsheet was considered not suitable for intensification because of its high number of trays.
- (b)
- The partially intensified process with a reactive distillation unit and a distillation column (RDC).
- (c)
- The partially intensified process with a reactor and a dividing wall column (DWC).
- (d)
- The fully intensified process with a dividing wall reactive distillation column (RDWC).
For the multi-objective optimization task, the design variables included the number of column trays, feed stages, the position of reactive stages and dividing walls, the number of reactive trays, the trays in the dividing wall, the side stream trays, reflux ratios, and vapor flows.
3. Multi-Objective Optimization
The intensified processes were optimized with a non-dominated sorting genetic algorithm (NSGA-II) implemented in the Python (v. 3.11.1) programming environment using the Pymoo package (v. 0.6.1.5) [38]. A connection between Aspen Plus and Python was established through the COM automation interface, which allows external programs to control and execute Aspen simulations. The Python script used the win32com.client library to initialize an Aspen Plus (v.12) session, load a process file, and execute it automatically. The hyperparameters of NSGA-II, the population size, and the number of generations and offspring were optimized using the Optuna (v. 3.6.1) framework [39]. Recombination used a crossover probability 0.9 and distribution index ηcrossover equal to 15; the per-variable crossover probability was left at the default value (≈0.5). The mutation process employed Polynomial Mutation (PM) with a probability of 1.0, ensuring that every offspring produced during the evolutionary process underwent mutation. This configuration helped prevent premature convergence and maintain a baseline level of exploration throughout the search. The intensity of the exploration was also influenced by the distribution index, ηmutation, which was set to 20, a value that concentrates the probability distribution of perturbations around small deviations from the parent solutions. The goal of the settings was to provide an effective convergence toward well-distributed Pareto-optimal fronts. Each objective function of this work was normalized, and the optimal design on the Pareto front was selected based on weighted components. The code used in this work is available at https://github.com/GabrielHeMo/Aspen-Pyhon-NSGA-II (accessed on 28 October 2025). All simulations were performed on a personal workstation with an Intel® Core™ i7-8750H CPU (2.20 GHz) and 32 GB RAM.
3.1. Economic, Environmental, and Safety Evaluation
The economic evaluation was carried out using the total annual cost (TAC) given by Equation (6). Data for the economic analysis were taken from Jing et al. [40], assuming a payback period of three years and 8000 operating hours per year.
The environmental impact is another criterion that has been recently considered as part of the conceptual stage of process design. We use here the total carbon emissions associated with the reboilers, estimated by Equation (7). [41].
where CO2 is given in kg/s, Qfuel is the total heat released from combustion in kW, C% is the percentage of carbon in the fuel, NHV is the net heating value per unit mass of fuel combustion, and α is equal to 3.67, which is the ratio between the molar molecular mass of CO2 and that of C12. Heavy fuel oil’s NHV and C% values are 39,771 kJ/kg and 86.5, respectively.
Inherent safety is the other item considered within the multi-objective optimization framework. Several procedures can be used to assess that component, such as quantitative risk analysis (QRA) techniques [42], which are based on the probability of catastrophic events and consequences, or the use of safety indexes suitable for application during the design stage of the process [43,44]. The latter choice was taken for this work, conveniently using the Fire and Explosion Damage Index (FEDI) as a metric for risk assessment [45]. FEDI measures risk in terms of damage radius in meters. A convenience of this metric is that it can be related to the hazard level of processes. Thus, values between 100 and 200 are considered moderately hazardous, up to 400 are rated as hazardous, up to 500 as highly hazardous, and finally above 500 as extremely hazardous [45]. The index has previously been used for processes with distillation units [21] and it has been tested as a metric for the design of chemical processes under uncertainty [46], in which it showed a stable response with small statistical variances as part of the probability distributions developed in that study.
The calculation involves the use of chemical and physical energies, followed by penalty functions that give rise to a damage potential. Equations (8)–(11) are used to estimate the four energy factors needed as part of the FEDI calculation.
Factor1 uses the combustion enthalpy to relate the energy released during combustion to the amount of mass being processed.
Factor2 accounts for the energy associated with pressure effects.
Factor3 deals with the physical energy related to the pressure of pieces of equipment.
Factor4 incorporates the energy associated with chemical transformations.
In these equations, M is the mass flow rate in kg/s, Hc and Hrxn are the enthalpies of combustion and reaction in kJ/kg, the constant K takes a value of 3.148, T is the temperature in °C, VP is the vapor pressure in kPa, PP is the system pressure in kPa, and Vol is the equipment volume in m3. These equations are combined with penalty factors to estimate damage potential, from which FEDI is calculated as
For the calculation of penalty factors, see Castillo-Landero et al. [21].
3.2. Optimization Variables
The variables used for the optimization task of the flowsheets are defined as follows. For the DWC systems, they are as follows:
- Vflow: Vapor flow rate entering the upper section—bounds min: 1–max: 100 mol/hr
- Lflow: Liquid flow rate entering the lower section—bounds min: 1–max: 300 kmol/hr
- NFS2: Outlet stage of stream S2—bounds min: 2–max: 50 trays
- NIDWC: Tray where DWC begins—bounds min: 2–max: 50 trays
- ReDWC: Reflux ratio of DWC—bounds min: 0.5–max: 5.0
- NTDWC: Total number of stages in the DWC—bounds min: 30–max: 50 trays
- NTPREF: Total number of stages of the prefactionator—bounds min: 10–max: 50 trays
- NFS1: Feed stage of stream S1—bounds min: 2–max: 50 trays
For the RD flowsheet:
- NFS3: Feed stage of the stream S3—bounds min: 2–max: 50 trays
- NFS2: Feed stage of the stream S2—bounds min: 2–max: 50 trays
- NFS1: Feed stage of the stream S1—bounds min: 2–max: 50 trays
- ReC2: Reflux ratio of column C2—bounds min: 0.5–max: 5.0
- ReRDC: Reflux ratio of column RDC—bounds min: 0.5–max: 5.0
- NTC2: Total number of stages in column B2—bounds min: 10–max: 50
- NTRD: Total number of stages—bounds min: 10–max: 50
- NTReactive Stages: Total number of reactive stages—bounds min: 1–max: 50
- NIReaction: Tray where reactive zone begins—bounds min: 1–max: 50
For the fully intensified column, optimization variables were the same as in the DWC case, with the reaction zone set equal to the total number of stages of the prefactionator.
4. Results and Discussion
The conventional flowsheet used as a basis was reported with design pressures of 8 bar for the distillation units and reactive columns, with the results for the base and intensified structures in the economic and environmental components given in Table 2. It should be noted that the economic analysis for the reported design was based on a medium-pressure steam price of 2.2 USD/GJ, which was updated here to reflect a steam cost of 8.22 USD/GJ. As part of this work, an inherent safety assessment through the FEDI metric has been included.
Table 2.
Values of economic, environmental, and inherent safety metrics for the base flowsheet and three intensified structures for ETBE production processes. Designs were not optimized.
One can notice the benefits from intensifying the conventional process. Reductions in TAC reached 26 percent when the process was fully intensified in the form of a reactive dividing wall column. Environmental aspects also benefited from this intensification as it reduced CO2 emissions by 34 percent. On the other hand, the estimations of the FEDI metric conducted in this work showed that the index was increased for the fully intensified design, with the minimum point obtained for this factor being the partially intensified process with a reactive distillation column. This result is consistent with the observations from Castillo-Landero et al. [21], in the sense that a fully intensified structure does not necessarily lower the process risk with respect to partially intensified flowsheets.
We now examine the effect of optimizing the ETBE flowsheets. As part of the optimization task, the design pressure for each unit is taken as a design variable. To set the bounds for the optimization search, a sensitivity analysis was carried out, and Figure 5 shows the effect of the design pressure on the TAC and ETBE molar flowrate. It can be observed that, for an application within the optimization methodology, proper bounds for the design pressure can be set from 4.5 to 8 bar. Higher operating pressures can significantly increase costs, while operating pressures below 4.5 bar can result in low process efficiencies related to reactant conversions and product quality. The operating conditions of the reactor, separation units, and streams for each flowsheet were then subjected to the optimization procedure.
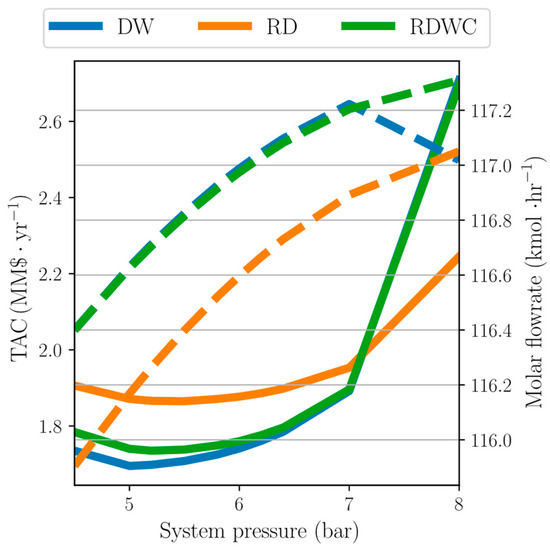
Figure 5.
Sensitivity analysis of the effect of pressure on the process economics and ETBE production. Dashed lines are related to molar flowrate; solid lines are related to total annual cost.
From all the trials performed with the Optuna framework, data points were collected and filtered to find the non-dominated and dominated points for each flowsheet. The results from this procedure are shown in Figure 6 for the DWC (Figure 6a), the RD (Figure 6b), and the RDWC (Figure 6c) structures. See the Supplementary Material for the performance of the optimization method as well as the values used to normalize the objective functions of this work. For the formulation of the multi-objective optimization, weights were used for each component of the objective function, and four scenarios were considered. The first one gives equal weight to the three components, i.e., TAC, CO2 emissions, and inherent safety. The other three consider higher weights to each individual metric to represent policies in which preference would be given to each component. The best solutions for these weighted scenarios are shown in Table 3, which includes the preferred process flowsheet along with details of the operating conditions and the value for each of the economic, environmental, and inherent safety metrics.
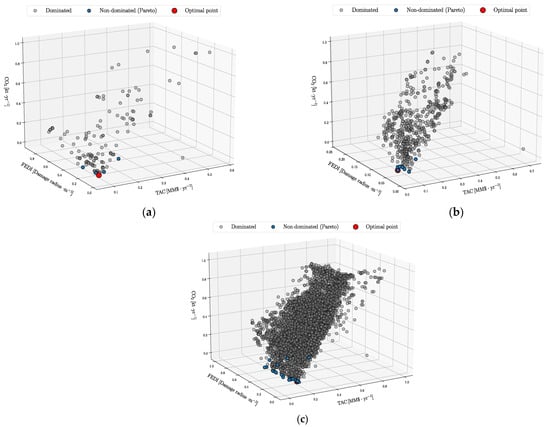
Figure 6.
Optimal solutions found for each system: (a) DWC; (b) RD; (c) RDWC. Blue points correspond to non-dominated points, gray dots represent feasible solutions that are dominated, and red points indicate optimal solutions that balance the three objective functions.
Table 3.
Results from the multi-objective optimization for different weights on the components of the objective function.
For each of the scenarios with different priorities, different solutions were found, some of them different from the fully intensified design. Figure 7 shows how the new composite functions change within the feasible points found for each system. When equal weights were assigned to all metrics, the partially intensified RDC structure provided the best alternative. The column was designed at the lowest allowed design pressure with a low reflux ratio, which provides favorable operating conditions that reduce both capital expenses and energy costs. On the other hand, the optimal solution changed when different weights were assigned to the individual objectives to reflect alternative design priorities. Under economics-driven criteria, the fully intensified RDWC flowsheet became the best alternative with a minimum TAC of 1.45 MM USD/yr, which reduced this component by 4.6 percent with respect to the optimal solution with equal weights. The column’s optimal design pressure increased to 4.95 bar, with a higher reflux ratio of 1.11.
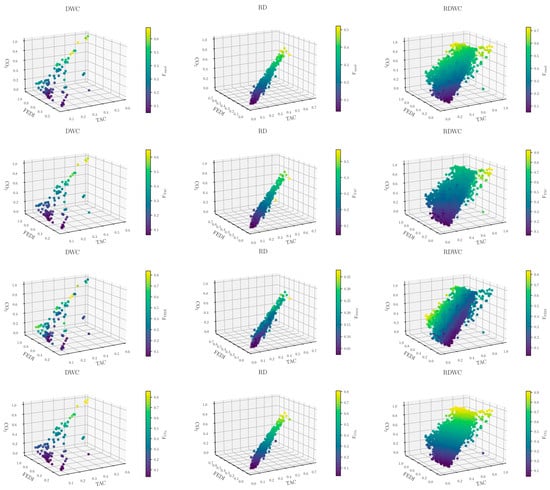
Figure 7.
Feasible solutions found for each system. Each color bar shows how the composite function changes with different hierarchy weights. Fequal assumes the same weights for all objectives, whereas FCO2, FTAC, and FFEDI highlight the objective function with higher importance.
Under the environmental priority, the partially intensified DWC flowsheet provided the best choice, with the lowest CO2 emissions, equivalent to 8.48 kt/yr. Nonetheless, it should be noted that this value provides only a minor reduction with respect to the two alternatives described above. This solution was located at the lower limit imposed for the operating pressure, and it provided a minor decrease in the amount of ETBE produced by the process.
Finally, when safety was taken as the most important factor, the RDC configuration turned out to be the preferred solution, same structure from the case where equal weights were used for each component in the objective function. The design pressure for the column was 5.93 bar, which was the highest of all the optimal designs detected as part of the multi-objective optimization framework. The high pressure favors the ETBE chemical reaction such that less unreacted raw material flows back to the reactor, which seems to be the major item from the FEDI metric evaluation. Nonetheless, the inherent safety component was the one that showed the least variation out of all the optimal structures detected under different weights. One aspect worthy of mention is that the RDC option was the least favorable from environmental considerations, with emissions 27 percent higher than the DWC environmentally friendliest case.
The effects from the optimization of the intensified structures with respect to the designs at fixed design pressures are noticeable. The optimal flowsheet when equal weights were assigned to each component of the objective function, which corresponded to the RDC structure and provided an additional reduction to the TAC of 24.5 percent with respect to the design of the fully intensified RDWC unit without optimization (2.012 MM USD/yr to 1.52 MM USD/yr). When the economic term of the multi-objective formulation was given the highest priority, the RDWC structure gave the best performance by further reducing TAC to 1.45 MM USD/yr, which corresponds to an improvement of 27.9 percent with respect to the same structure obtained without the application of a formal optimization procedure. In terms of CO2 emissions, the comparison between RDWC structures shows an additional reduction of 6.2 percent when the system was optimized (9.06 versus 8.5 kt/yr). On the effect on inherent safety, one can note that the optimized structures improved this item, since FEDI values lowered from 747 to 606 for the RDC structure obtained after the optimization for the lowest risk was carried out, or to 661 for designs with similar RDWC structures.
The results from these tests show the potential to integrate optimization techniques while process intensification methodologies are applied. It also shows the elaborated trade-offs that may exist in process design among major performance factors such as the economic, environmental, and inherent safety components that were considered as part of the multi-objective optimization task in this work. The design framework presented here can provide an appropriate tool to accommodate other factors of interest, as well as different economic and/or design objectives that may arise as part of the dynamic nature of industrial and social trends.
Sensitivity Analysis
Figure 8 shows the partial Spearman correlation between manipulated variables and objective functions. Partial correlation analysis identified the net effect of operational variables on economic performance, process safety, and environmental impact for the three configurations evaluated.
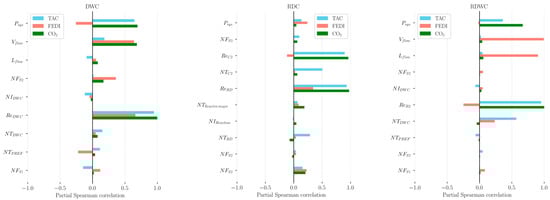
Figure 8.
Partial Spearman’s correlation plots between the manipulated variables and the objective functions for each flowsheet.
In the DWC, the variables with the greatest influence on TAC and FEDI were the reflux in section B2 and the system pressure. An increase in pressure tended to reduce TAC and FEDI, suggesting that operating at higher pressures favors energy efficiency and reduces the potential risk of fire and explosion. Reflux ratio and the total number of trays of the DWC have a positive correlation on the three metrics. Lower reflux ratios imply a smaller diameter. These aspects affect the FEDI indicator, since it considers the volume of the separation unit as well as the quantity of material supplied. Also, the positive correlation between the system pressure and CO2 emissions indicates that high-pressure conditions increase the energy intensity of the system and therefore indirect emissions.
The RDC results showed a major influence of reflux ratios in the reactive and C2 columns on TAC and CO2, with a direct effect on thermal loads and energy consumption. In contrast, FEDI showed lower sensitivity to these variables, suggesting that the risk of fire and explosion in the reactive system is more affected by the overall operating conditions than by local flow adjustments.
In the RDWC structure, the reflux, vapor, and liquid flows interconnected to the prefactionator exhibited significant positive correlations with FEDI and CO2, indicating that increased internal flows favor separation efficiency at the expense of higher process risk. On the other hand, TAC showed moderately negative correlations with pressure and the number of stages in the separation sections.
These results show that system pressure, reflux ratios, and internal flowrates are the most critical design variables that affect the interrelation between safety, economy, and sustainability. While operating at higher pressures reduces costs and risk, it also tends to increase carbon emissions, establishing a clear trade-off between economic and environmental performance. This analysis reinforces the need for multifunctional optimization strategies that simultaneously consider economic, safety, and emissions criteria in the design and operation of intensified distillation systems.
5. Conclusions
A multi-objective optimization procedure has been applied for the design of several intensified flowsheets to produce ethyl tert-butyl ether. Flowsheets that came from a gradual intensification methodology applied to a conventional sequence with a reactor and two distillation units yielded two partially intensified structures and a fully intensified unit. These flowsheets gave rise to complex arrangements in the form of reactive distillation, dividing walls, and reactive dividing wall columns, which showed economic and environmental benefits with respect to the conventional flowsheet. In this work, we took those flowsheets and applied a multi-objective optimization framework that included economic and environmental aspects and added an inherent safety component. The results showed that the best flowsheets depend on the priority given to each item in the multi-objective formulation. Thus, partially intensified structures with dividing wall or reactive distillation columns outperformed the fully intensified option with a reactive dividing wall column in three out of the four weight scenarios considered here. Environmental or inherent safety priorities, as well as the case with equal weight to the three components of the multi-objective optimization task, yielded optimal structures with partial intensifications of the base process. The case in which the fully intensified system provided the best flowsheet was when the process economics were considered the item with the highest priority.
The results also showed the incentives to apply optimization tasks to the gradual intensification of conventional processes. Taking as a basis the economic and environmental benefits reported under isobaric separation sequences, we showed that significant savings can additionally be obtained through the multi-objective optimization formulation used here. Also, it was observed that the process risk does not necessarily improve as the intensification procedure goes to completion towards a single processing unit.
Although the environmental assessment in this study mainly focused on the CO2 emissions associated with the reboilers, the proposed methodology can be readily extended to a more comprehensive sustainability analysis. Future work can incorporate additional environmental impact indicators or be expanded toward a full Life Cycle Assessment (LCA) framework. Such an extension would allow for a more holistic evaluation of the environmental performance of intensified distillation systems and provide a broader perspective on their potential trade-offs between efficiency, safety, and sustainability.
Supplementary Materials
The following supporting information can be downloaded at: https://www.mdpi.com/article/10.3390/pr13113539/s1. Table S1. Computational time for the RDC flowsheet. Table S2. Computational time for the DWC flowsheet. Table S3. Computational time for the RDWC flowsheet. Table S4. Min-Max values of economic, environmental and inherent safety metrics for each flowsheet. Figure S1. Optimization history plot for the RDC flowsheet. Figure S2. Contour plot for the optimized parameter of the NSGA-II (RDC flowsheet). Figure S3. Optimization history plot for the DWC flowsheet. Figure S4. Contour plot for the optimized parameter of the NSGA-II (DWC flowsheet). Figure S5. Optimization history plot for the RDWC flowsheet. Figure S6. Contour plot for the optimized parameter of the NSGA-II (RDWC flowsheet).
Author Contributions
Conceptualization: G.H.-M., M.G.-O., and A.J.-G.; Methodology: G.H.-M., M.G.-O., and E.D.M.-O.; Software: G.H.-M.; E.D.M.-O., and M.G.-O.; Validation: G.H.-M.; Writing—Original Draft Preparation: G.H.-M., E.D.M.-O., and M.G.-O. Writing—Review and Editing: A.J.-G.; Visualization: G.H.-M., and A.J.-G.; and Supervision: A.J.-G. All authors have read and agreed to the published version of the manuscript.
Funding
This research received no external funding.
Data Availability Statement
The original contributions presented in this study are included in the article/Supplementary Material. Further inquiries can be directed to the corresponding author.
Acknowledgments
Financial support provided by SECIHTI (México) is gratefully acknowledged.
Conflicts of Interest
The authors declare no conflicts of interest.
Abbreviations
The following abbreviations are used in this manuscript:
| RDCs | Reactive distillation columns |
| DWCs | Dividing wall columns |
| RDWCs | Reactive dividing wall columns |
| ETBE | Ethyl tert-butyl ether |
| NSGA-II | Non-dominated sorting genetic algorithm II |
| TAC | Total annual cost |
| FEDI | Fire and explosion damage index |
References
- Linnhoff, B.; Flower, J.R. Synthesis of heat exchanger networks: II. Evolutionary generation of networks with various criteria of optimality. AIChE J. 1978, 24, 642–654. [Google Scholar] [CrossRef]
- Yee, T.F.; Grossmann, I.E. Simultaneous optimization model for heat integration—II. Heat exchanger network synthesis. Comput. Chem. Eng. 1990, 14, 1165–1184. [Google Scholar] [CrossRef]
- El-Halwagi, M.M.; Manousiouthakis, V. Synthesis of mass exchange networks. AIChE J. 1989, 35, 1233–1244. [Google Scholar] [CrossRef]
- Karuppiah, R.; Grossmann, I.E. Global optimization for the synthesis of integrated water systems in chemical processes. Comput. Chem. Eng. 2006, 30, 650–673. [Google Scholar] [CrossRef]
- El-Halwagi, M.M. Process Integration; Academic Press: New York, NY, USA, 2006. [Google Scholar]
- Gomes, J.F.S.; Queiroz, E.M.; Pessoa, F.L.P. Design procedure for water/wastewater minimization: Single contaminant. J. Clean. Prod. 2007, 15, 474–485. [Google Scholar] [CrossRef]
- Luyben, W.L.; Yu, C.C. Reactive Distillation Design and Control; John Wiley & Sons: Hoboken, NJ, USA, 2009. [Google Scholar]
- Kiss, A.A.; Jobson, M.; Gao, X. Reactive distillation: Stepping up to the next level of process intensification. Ind. Eng. Chem. Res. 2019, 58, 5909–5918. [Google Scholar] [CrossRef]
- Taylor, R.; Krishna, R. Modelling reactive distillation. Chem. Eng. Sci. 2000, 55, 5183–5229. [Google Scholar] [CrossRef]
- González, D.R.; Bastidas, P.; Rodríguez, G.; Gil, I. Design alternatives and control performance in the pilot scale production of isoamil acetate via reactive distillation. Chem. Eng. Res. Des. 2017, 123, 347–359. [Google Scholar] [CrossRef]
- Dejanović, I.; Matijašević, L.; Olujić, Ž. Dividing wall column—A breakthrough towards sustainable distilling. Chem. Eng. Process. Process Intensif. 2010, 49, 559–580. [Google Scholar] [CrossRef]
- Chu, K.-T.; Cadoret, L.; Yu, C.-C.; Ward, J.D. A new shortcut design method and economic analysis of divided wall columns. Ind. Eng. Res. Des. 2011, 50, 9221–9235. [Google Scholar] [CrossRef]
- Buitimea-Cerón, G.A.; Hahn, J.; Medina-Herrera, N.; Jiménez-Gutiérrez, A.; Loredo-Medrano, J.A.; Tututi-Avila, S. Dividing-wall column design: Analysis of methodologies tailored to process simulators. Processes 2021, 9, 1189. [Google Scholar] [CrossRef]
- Mueller, I.; Kenig, E.Y. Reactive distillation in a dividing wall column: Rate-based modeling and simulation. Ind. Eng. Chem. Res. 2007, 46, 3709–3719. [Google Scholar] [CrossRef]
- Weinfeld, J.A.; Owens, S.A.; Eldridge, R. Reactive dividing wall columns: A comprehensive review. Chem. Eng. Process. Process Intensif. 2018, 123, 20–33. [Google Scholar] [CrossRef]
- Tian, Y.; Pappas, I.; Burnak, B.; Katz, J.; Pistikopoulos, E.N. A systematic framework for the synthesis of operable process intensification systems–reactive separation systems. Comput. Chem. Eng. 2020, 134, 106675. [Google Scholar] [CrossRef]
- Behroozsarand, A.; Shafiei, S. Multiobjective optimization of reactive distillation with thermal coupling using non-dominated sorting genetic algorithm-II. J. Nat. Gas Sci. Eng. 2011, 3, 365–374. [Google Scholar] [CrossRef]
- Garg, N.; Kontogeorgis, G.M.; Gani, R.; Woodley, J.M. A process synthesis intensification method for generation of novel and intensified solutions. Chem. Eng. Process. Process Intensif. 2020, 156, 108103. [Google Scholar] [CrossRef]
- Demirel, S.E.; Li, J.; El-Halwagi, M.; Hasan, M.F. Sustainable process intensification using building blocks. ACS Sustain. Chem. Eng. 2020, 8, 17664–17679. [Google Scholar] [CrossRef]
- Castillo-Landero, A.; Jiménez-Gutiérrez, A.; Gani, R. Intensification methodology to minimize the number of pieces of equipment and its application to a process to produce dioxolane products. Ind. Eng. Chem. Res. 2018, 57, 9810–9820. [Google Scholar] [CrossRef]
- Castillo-Landero, A.; Ortiz-Espinoza, A.P.; Jiménez-Gutiérrez, A. A process intensification methodology including economic, sustainability and safety considerations. Ind. Eng. Chem. Res. 2019, 58, 6080–6092. [Google Scholar] [CrossRef]
- Tusso-Pinzón, R.A.; Castillo-Landero, A.; Matallana-Pérez, L.G.; Jiménez-Gutiérrez, A. Intensified synthesis for ethyl lactate production including economic, sustainability and inherent safety criteria. Chem. Eng. Process. Process Intensif. 2020, 154, 108041. [Google Scholar] [CrossRef]
- Tian, Y.; Demirel, S.E.; Hasan, M.F.; Pistikopoulos, E.N. An overview of process systems engineering approaches for process intensification: State of the art. Chem. Eng. Process. Process Intensif. 2018, 133, 160–210. [Google Scholar] [CrossRef]
- Sitter, S.; Chen, Q.; Grossmann, I.E. An overview of process intensification methods. Curr. Opin. Chem. Eng. 2019, 25, 87–94. [Google Scholar] [CrossRef]
- Tula, A.K.; Eden, M.R.; Gani, R. Computer–aided process intensification: Challenges, trends and opportunities. AIChE J. 2020, 66, e16819. [Google Scholar] [CrossRef]
- Gómez-Ochoa, M.; Jiménez-Gutiérrez, A. Design of intensified chemical processes for the production of ethyl tert-butyl ether. Chem. Eng. Process. Process Intensif. 2024, 196, 109651. [Google Scholar] [CrossRef]
- Domingues, L.; Pinheiro, C.I.; Oliveira, N.M. Optimal design of reactive distillation systems: Application to the production of ethyl tert-butyl ether (ETBE). Comput. Chem. Eng. 2014, 64, 81–94. [Google Scholar] [CrossRef]
- Recker, S.; Skiborowski, M.; Redepenning, C.; Marquardt, W. A unifying framework for optimization-based design of integrated reaction–separation processes. Comput. Chem. Eng. 2015, 81, 260–271. [Google Scholar] [CrossRef]
- Kaur, J.; Sangal, V.K. Optimization of Reactive Dividing-Wall Distillation Column for Ethyl t-Butyl Ether Synthesis. Chem. Eng. Technol. 2018, 41, 1057–1065. [Google Scholar] [CrossRef]
- Bernal, D.E.; Carrillo-Diaz, C.; Gómez, J.M.; Ricardez-Sandoval, L.A. Simultaneous design and control of catalytic distillation columns using comprehensive rigorous dynamic models. Ind. Eng. Chem. Res. 2018, 57, 2587–2608. [Google Scholar] [CrossRef]
- Galán, G.; Martín, M.; Grossmann, I.E. Integrated Renewable Production of ETBE from Switchgrass. ACS Sustain. Chem. Eng. 2019, 7, 8943–8953. [Google Scholar] [CrossRef]
- Babaie, O.; Esfahany, M.N. The hybrid RDWC–pervaporation with series–parallel arrangement and heat integration for ETBE production. Sep. Purif. Technol. 2021, 268, 118695. [Google Scholar] [CrossRef]
- Linan, D.A.; Bernal, D.E.; Gomez, J.M.; Ricardez-Sandoval, L.A. Optimal synthesis and design of catalytic distillation columns: A rate-based modeling approach. Chem. Eng. Sci. 2021, 231, 116294. [Google Scholar] [CrossRef]
- Babaie, O.; Esfahany, M.N. Optimum process configuration for ETBE production based on TAC minimization. Sep. Purif. Technol. 2021, 256, 117744. [Google Scholar] [CrossRef]
- Zhang, T.; Jensen, K.; Kitchaiya, P.; Phillips, C.; Datta, R. Liquid-phase synthesis of ethanol-derived mixed tertiary alkyl ethyl ethers in an isothermal integral packed-bed reactor. Ind. Eng. Chem. Res. 1997, 36, 4586–4594. [Google Scholar] [CrossRef]
- Sneesby, M.G.; Tadé, M.O.; Datta, R.; Smith, T.N. ETBE Synthesis via Reactive Distillation. 1. Steady-State Simulation and Design Aspects. Ind. Eng. Chem. Res. 1997, 36, 1855–1869. [Google Scholar] [CrossRef]
- Khaledi, R.; Young, B.R. Modeling and Model Predictive Control of Composition and Conversion in an ETBE Reactive Distillation Column. Ind. Eng. Chem. Res. 2005, 44, 3134–3145. [Google Scholar] [CrossRef]
- Blank, J.; Deb, K. Pymoo: Multi-objective optimization in python. IEEE Access 2020, 8, 89497–89509. [Google Scholar] [CrossRef]
- Akiba, T.; Sano, S.; Yanase, T.; Ohta, T.; Koyama, M. Optuna: A next generation hyperparameter optimization framework. In Proceedings of the 25th ACM SIGKDD International Conference on Knowledge Discovery & Data Mining, Anchorage, AK, USA, 4–8 August 2019; pp. 2623–2631. [Google Scholar] [CrossRef]
- Jing, C.; Zhu, J.; Dang, L.; Wei, H. Extractive dividing-wall column distillation with a novel control structure integrating pressure swing and pressure compensation. Ind. Eng. Chem. Res. 2021, 60, 1274–1289. [Google Scholar] [CrossRef]
- Gadalla, M.; Olujić, Ž.; Jobson, M.; Smith, R. Estimation and reduction of CO2 emissions from crude oil distillation units. Energy 2006, 31, 2398–2408. [Google Scholar] [CrossRef]
- Medina-Herrera, N.; Grossmann, I.E.; Mannan, M.S.; Jiménez-Gutiérrez, A. An approach for solvent selection in extractive distillation systems including safety considerations. Ind. Eng. Chem. Res. 2014, 53, 12023–12031. [Google Scholar] [CrossRef]
- Ortiz-Espinoza, A.P.; Jiménez-Gutiérrez, A.; El-Halwagi, M.M. Including inherent safety in the design of chemical processes. Ind. Eng. Chem. Res. 2017, 56, 14507–14517. [Google Scholar] [CrossRef]
- Roy, N.; Eljack, F.; Jiménez-Gutiérrez, A.; Zhang, B.; Thiruvenkataswamy, P.; El-Halwagi, M.; Mannan, M.S. A review of safety indices for process design. Curr. Opin. Chem. Eng. 2016, 14, 42–48. [Google Scholar] [CrossRef]
- Khan, F.I.; Abbasi, S.A. Multivariate hazard identification and ranking system. Process Saf. Prog. 1998, 17, 157–170. [Google Scholar] [CrossRef]
- Ortiz-Espinoza, A.P.; Jiménez-Gutiérrez, A.; El-Halwagi, M.M.; Kazantzis, N.K.; Kazantzi, V. Comparison of safety indexes for chemical processes under uncertainty. Process Saf. Environ. Prot. 2021, 148, 225–236. [Google Scholar] [CrossRef]
Disclaimer/Publisher’s Note: The statements, opinions and data contained in all publications are solely those of the individual author(s) and contributor(s) and not of MDPI and/or the editor(s). MDPI and/or the editor(s) disclaim responsibility for any injury to people or property resulting from any ideas, methods, instructions or products referred to in the content. |
© 2025 by the authors. Licensee MDPI, Basel, Switzerland. This article is an open access article distributed under the terms and conditions of the Creative Commons Attribution (CC BY) license (https://creativecommons.org/licenses/by/4.0/).