Abstract
In recent years, deep learning-based methods for surface defect detection in steel strips have advanced rapidly. Nevertheless, existing approaches still face several challenges in practical applications, such as insufficient dimensionality of feature information, inadequate representation capability for single-modal samples, poor adaptability to few-shot scenarios, and difficulties in cross-domain knowledge transfer. To overcome these limitations, this paper proposes a multi-modal fusion framework based on graph neural networks for few-shot classification and detection of surface defects. The proposed architecture consists of three core components: a multi-modal feature fusion module, a graph neural network module, and a cross-modal transfer learning module. By integrating heterogeneous data modalities—including visual images and textual descriptions—the method facilitates the construction of a more efficient and accurate defect classification and detection model. Experimental evaluations on steel strip surface defect datasets confirm the robustness and effectiveness of the proposed method under small-sample conditions. The results demonstrate that our approach provides a novel and reliable solution for automated quality inspection of surface defects in the steel industry.
1. Introduction
As a fundamental material in modern industry, the surface quality of steel strips critically influences the performance and safety of products in high-end manufacturing applications. However, traditional detection methods—such as manual visual inspection and conventional machine learning—suffer from low efficiency and high false negative rates. Moreover, deep learning models relying on large-scale datasets are often inadequate for real-world industrial production lines, which demand high precision, real-time performance, and adaptability to limited-sample scenarios. In particular, the application of deep learning to steel strip surface defect detection remains challenging due to the scarcity of labeled data and the complexity of defect morphologies (e.g., edge cracks and subtle oxide scale pits). These factors pose significant obstacles to achieving reliable image-based classification and detection in industrial settings.
Recent advances in deep learning have significantly improved surface-defect detection for steel strips. Abbes et al.boosted the detection accuracy of hot-rolled steel strips using DefectNet, a multi-scale feature pyramid network [1]. Huang et al. refined YOLOv8 for fast detection of additive-manufacturing defects [2]. However, both approaches require large-scale annotated datasets and perform poorly in few-shot industrial scenarios.
To counter data scarcity in steel strip defect detection, researchers now couple defect inspection with few-shot learning. Ref. [3] classifies unseen defects from 5–10 support images, whereas KAIST’s SDP-MTF achieves an -score of 96.4% across different materials via transfer learning [4]. However, these methods remain monomodal—only RGB intensity information are exploited—leaving semantic or textual cues untapped.
Research on multimodal fusion for steel strip defect detection has focused on image–text co-embedding. CADA-VAE [5] aligns different modalities in a shared latent space through variational auto-encoders, while Dual-TriNet [6] learns a triple-network mapping between visual features and semantic vectors. However, neither of these methods captures the fine-grained spatial layout of industrial defects nor models the relational graph that links individual defect instances.
Graph neural networks (GNNs) naturally encode such relations. While various GNN architectures have demonstrated promising results in different domains, their applicability to industrial defect detection remains constrained. Graph Convolutional Networks (GCNs) have achieved success in recommender systems through neighborhood aggregation mechanisms [7], yet they often suffer from oversmoothing in deeply layered structures. Graph Attention Networks (GATs) improve upon GCNs by incorporating adaptive attention weights, but require substantial computational resources that hinder real-time inspection. Recently, Light Graph Convolutional Networks (LightGCN) have shown superior efficiency in handling large-scale relational data, as evidenced by their successful integration with knowledge-aware attention networks in recommender systems [8]. However, such approaches have not been adequately explored for industrial visual inspection tasks, particularly in few-shot scenarios where model efficiency and relational reasoning are paramount. Pang et al. [9] pioneered a GNN for steel-surface inspection, yet their model uses imagery alone, discards semantic knowledge, and omits label-propagation vital for few-shot learning (FSL) generalization.
Subsequent work extended GNNs to cross-modal settings. Han et al. [10] meta-learn a shared latent space to align vision and semantics, curbing few-shot overfitting. Zhang et al. [11] retain micro-defect signatures with a multi-scale attention fusion block, and later [12] exploit graph convolutions to explicitly model inter-modal dependencies, achieving state-of-the-art fusion accuracy. Nevertheless, these frameworks still struggle with cross-device portability and the injection of domain-specific knowledge [13].
In contrast to existing approaches, this paper introduces a novel Graph Neural Network-based Multi-modal Fusion framework (MF-GNN) tailored for few-shot steel strip defect detection. The key original contributions are summarized as follows:
- First GNN-driven multi-modal fusion model that jointly exploits visual and semantic information for few-shot defect classification, addressing the limitation of single-modal methods in data-scarce scenarios.
- An Attention-Guided Feature Alignment and Fusion Mechanism (AG-FAFM) that dynamically integrates heterogeneous features via learnable attention weights, enhancing cross-modal consistency and discriminability.
- A semi-supervised graph propagation strategy that leverages unlabeled samples through label smoothing on low-dimensional manifolds, significantly improving generalization under limited annotations.
2. Related Work
With the advancement of deep learning (DL) techniques, an increasing number of steel strip surface defect detection approaches are being introduced. This paper primarily focuses on few-shot learning, multi-modal fusion techniques, and GNNs.
2.1. Multi-Modal Fusion
Multi-modal fusion pertains to the combination of information from different sources or modalities, such as visual, semantic, and auditory data. Each modality should constitute a unique expression of information, thus providing complementary that are crucial for comprehensive analysis. For instance, visual information may offer richer and more unique features for certain aspects, while semantic information could provide deeper insights into others. The combined information extracted through these modalities is represented through a richer and more detailed feature set. Generally, DL-based multi-modal fusion methods are categorized as model-free and model-based approaches, each addressing different aspects of fusion [14,15,16].
2.1.1. Model-Free Multi-Modal Fusion
Model-free approaches are adaptable to various classifiers and regressors [17] and are not confined to specific machine learning algorithms. They include front-end, back-end, and hybrid fusion techniques [18]. Front-end fusion, or feature-level fusion, involves the combination of raw data from different modalities to mitigate disparities, but simple vector concatenation may lead to redundancy [19]. Techniques such as principal component analysis and variational autoencoders (VAEs) are employed to enhance data complementarity while reducing redundancy, finding applications in fields like autonomous driving [20], interactive robotics [21], and intelligent surveillance [22]. Back-end fusion, or decision-level fusion, pertains to the integration of independent modal predictions at the model’s output stage, sometimes overlooking the intrinsic connections between modalities. Common strategies include max pooling, averaging, Bayesian rules, and ensemble learning methods. Mid-level fusion, which is a blend of both front- and back-end fusion characteristics, maps original modal data to a high-dimensional space to capture commonalities. It has found uses in biometrics [23,24] and cross-modal information extraction [25,26].
2.1.2. Model-Based Multi-Modal Fusion
Model-based approaches utilize DL architectures to extract high-level joint features, which directly address fusion challenges and typically leads to enhanced classification or recognition accuracy. Deep neural networks capture shared modal features, by modeling and aligning them across temporal and spatial dimensions, with successful applications in subtitle generation [27] and cross-modal information extraction [28]. Multi-kernel learning extends single-kernel support vector (SVMs) machines to handle multi-modal data, thus optimizing feature representation. Probabilistic graphical models fuse multi-modal data through graph segmentation and prediction, using either directed graphs (Bayesian networks or belief networks) [29] or undirected graphs (Markov random fields) [30] to represent different structures.
These models are widely applied in semantic fusion [31], modeling of temporal or spatial distributions [32], image fusion [33], and other areas. Neural network fusion leverages the learning capabilities of neural architectures, offering scalability but also facing challenges with increased modal diversity. This method is extensively applied in natural language processing [34], and medical image analysis [35], among other fields.
We have extensively explored multi-modal fusion methods to address the challenge of limited sample sizes in steel strip defect detection. This strategy has enhanced the accuracy and robustness of the defect detection process.
2.2. Multi-Modal Few-Shot Learning
Multi-modal few-shot learning (MFSL) [36] addresses the problem of insufficient feature representation in samples due to limited data availability. It enriches the expression of features through the integration of information from different modalities. Various research works have enhanced feature representation by fusing information from multiple modalities. For example, in the cross-aligned domain-adaptive VAE (CADA-VAE [5], Figure 1), an FSL strategy was introduced, which combined VAEs, and through the integration of images and text, created a latent vector containing multi-modal information, thus facilitating the few-shot classification learning. Specifically, this model utilizes VAEs to map an image x and the text information c to a latent space. Then, within the latent space, the latent vector representations and of the two modalities are fused to create a few-shot classifier. This process aims to enhance the feature representation of images to improve the classifier’s accuracy. To strengthen the interconnection between modalities, the model employs two loss mechanisms: cross-modal alignment loss and distribution alignment loss. These mechanisms minimize modal discrepancies in the latent vector space and during VAE reconstruction. Furthermore, meta-learning methodologies, such as Prototypical Networks and Relation Networks, have also demonstrated remarkable performance in few-shot visual tasks. Nevertheless, their extension into multimodal scenarios remains a challenging and less explored research direction.
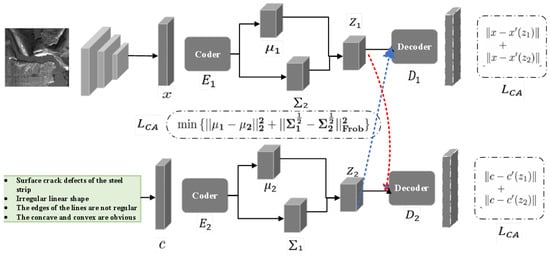
Figure 1.
Cross-aligned domain adaptive variational autoencoder.
In VAEs, it is typically assumed that the latent variable z follows a Gaussian distribution with a mean and covariance matrix as characteristics of the latent vector distribution. The optimization of the reconstruction loss aims to achieve a close approximation of the information across different modalities within the latent vector space (see Equations (1) and (2)). Here, M represents the input from various modalities, and and denote the encoder and decoder, respectively.
The loss function (see Equation (3)) employs the Wasserstein distance to measure the discrepancy between two distributions. The Dual-TriNet model introduces a method that utilizes TriNet to map a feature space to a semantic space. Within this semantic space, textual features enhance the data, which TriNet then maps back to the feature space to create a classifier for categorization. Figure 2 [37] illustrates this process: images are first processed through a convolutional neural network (CNN), from which four levels of feature maps are extracted, denoted as , where i represents the level. These features are then encoded by TriNet’s encoder, merging features from multiple levels into a semantic feature vector .
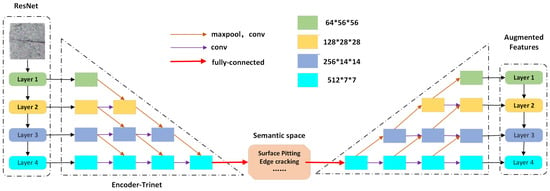
Figure 2.
Dual-trinet model.
In this article, a method is proposed to expand semantic features using the semantic domain. Specifically, it identifies the word vectors in the pre-trained word vector space closest to the semantic feature vector and samples . Subsequently, TriNet’s decoder restores the enhanced semantic features to image features for classification. The model’s training loss function comprises classification loss and semantic loss (see Equations (4) and (5)).
The loss function firstly ensures that the image features reconstructed by each decoder layer are as close as possible to the original feature information . Secondly, the semantic features obtained by the encoder must closely approximate the real semantic feature vector . The pre-trained model word2vec is used to generate the semantic feature vector .
Few-shot image detection techniques aim to overcome the challenges posed by data scarcity, which leads to inadequate representation of sample features. To address the critical issues in few-shot image detection, this work explores the fusion of multi-modal information to enrich feature expression.
2.3. Graph Neural Networks
Graph Neural Networks (GNNs), also known as geometric DL, are specialized DL models designed to process graph-structured data [38]. As a powerful DL framework, GNNs have demonstrated extensive applicability and robustness across multiple domains in recent years.
Research indicates that GNNs can handle data with complex relational structures effectively. Jenvman et al. successfully addressed the node classification task in dynamic networks using GNN models, validating their superior performance on non-Euclidean data [39]. In environmental science, GNNs have been applied to model pollutant dispersion, with their robustness thoroughly verified under noisy data conditions [40]. Furthermore, studies by demonstrate that GNNs exhibit strong generalization capabilities in cross-domain tasks [41], maintaining high prediction accuracy even with sparse or insufficiently labeled data. Collectively, these studies highlight the broad applicability of GNNs and their powerful modeling capacity for complex data patterns.
The core strength of GNNs lies in their ability to facilitate information transfer and updates between nodes, enabling the learning of representations for individual nodes or entire graphs. The state of each node is updated iteratively through the aggregation of information from neighboring nodes. Consequently, GNNs excel at identifying local structural features and global contextual relationships within graphs, making them invaluable for node classification, link prediction, and graph classification tasks.
Recent advancements in the field have led to the development of various GNN variants, including graph convolutional networks and graph attention networks, which have demonstrated remarkable success across multiple domains such as sentiment analysis [42], multi-view learning [43], recommendation systems [44], protein structure prediction [45], automated planning [46], and traffic forecasting [47]. The robust theoretical foundation of GNNs renders them particularly effective for addressing the complex challenges of steel strip defect detection under limited sample conditions, making them a promising approach that warrants further in-depth investigation.
2.4. Fault Diagnosis Techniques
Fault diagnosis refers to methods and tools designed for detecting, identifying, locating, and analyzing problems or failures within systems, equipment, or components [48]. The development of fault diagnosis technologies dates back to the early 20th century, initially relying on the experience and intuition of operators, technical documentation, and simple instrument-based monitoring [49]. The 1980s marked a significant shift with the adoption of computer technology and expert systems, paving the way for a transformation towards intelligent fault diagnosis through data-driven approaches that utilize machine learning technologies [50].
Essential and commonly used fault diagnosis techniques include model-based fault diagnosis [51], data-driven fault diagnosis [52], knowledge-based [53], and hybrid approaches [54]. These techniques have been widely applied across various fields, such as the industrial, automotive, aerospace, power system, and electronic sectors, to enhance system reliability, safety, and efficiency.
The richness of diagnostic methods, which include data-driven and hybrid approaches, underscores the importance of integrating advanced technologies like GNNs to tackle the complexity of detecting defects in steel strips under limited sample conditions. By leveraging the power of GNNs to analyze complex relationships and interactions within graph-structured data, we can significantly improve the accuracy and efficiency of fault diagnosis for critical infrastructure, ensuring safer and more reliable operation.
GNNs can be categorized into several types, such as Graph Convolutional Networks (GCNs), Graph Attention Networks (GATs), and Light Graph Convolutional Networks (LightGCN), each with distinct strengths and limitations. For instance, LightGCN has been successfully applied in recommender systems due to its efficiency in modeling user-item interactions. However, these models often struggle with multi-modal data integration and few-shot generalization, which motivates our work on a tailored GNN architecture for steel defect detection.
3. Methods
In this section, the proposed novel multi-modal graph fusion framework is introduced for few-shot defect detection. The framework combines GNNs and cross-modal transfer learning to deal with the data scarcity challenges in industrial inspection scenarios.
3.1. Overview of the Framework
In this paper, a novel GNN-based multi-modal fusion (MF-GNN) algorithm is proposed for few-shot detection and classification tasks, with the complete architecture and method flowchart depicted in Figure 3 and Figure 4. The proposed framework consists of three key components: the multi-modal feature fusion module, the GNN module, and the transfer learning module.
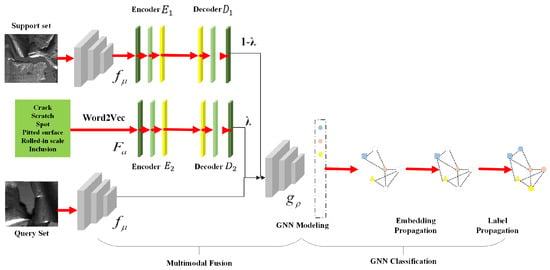
Figure 3.
Block diagram of GNN algorithm based on multi-modal fusion.
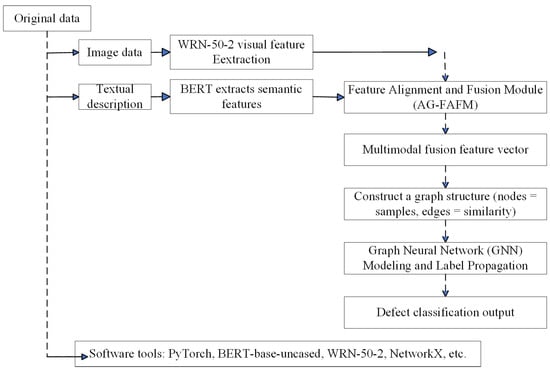
Figure 4.
Method flowchart.
3.2. Multi-Modal Fusion Module
The proposed approach integrates visual and semantic information, utilizing the rich prior knowledge and contextual details provided by semantic information to improve the accuracy of defective steel strip image classification. This approach aims to overcome the challenge of subtle variations between different defect types, thereby ensuring more accurate defect classification (Figure 5). In the diagram, solid arrows denote the primary data flow, while dashed arrows indicate the exchange of information and computational guidance that enables the two modalities to align and complement each other effectively.
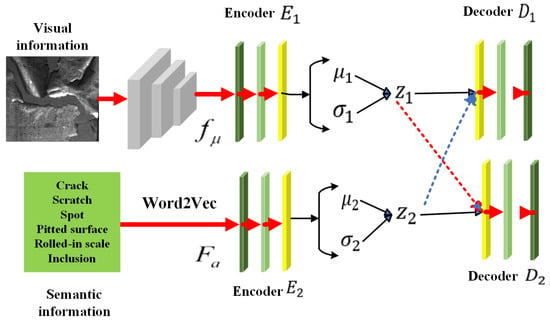
Figure 5.
Multi-modal information extraction and fusion.
3.2.1. Visual Information Extraction
This paper employs a Wide Residual Network (WRN-50-2) for visual feature extraction from steel strip images. The network architecture (Table 1) exploits wide residual connections and hierarchical modeling to capture both spatial details and contextual patterns. After being pre-trained on ImageNet and fine-tuned for defect detection, WRN-50-2 exhibits robust performance in identifying subtle steel-strip defects [55,56]. The extraction pipeline comprises three stages:

Table 1.
Architecture of the wide residual network (WRN-50-2) model.
- Image preprocessing and dataset augmentation: Images are resized to pixels and normalized with ImageNet statistics (mean: [0.485, 0.456, 0.406]; std: [0.229, 0.224, 0.225]). Augmentation includes random rotation, horizontal flipping, and color jittering to improve diversity and mitigate overfitting.
- Feature extraction: The WRN-50-2 backbone generates a hierarchy of feature maps that encode edges, textures, and defect patterns. Global average pooling then yields compact 2048-dimensional feature vectors, preserving discriminative information while reducing dimensionality.
- Feature alignment: A fully connected layer projects the visual features into a 512-dimensional space to ensure compatibility with the semantic representations for subsequent multimodal fusion.
3.2.2. Semantic Information Extraction
Semantic information enhances defect detection by providing textual context that complements visual features. The textual descriptions used in this study were manually annotated by domain experts, following standardized defect categorization guidelines in steel production. Descriptions such as "surface pitting” and “edge cracking” offer critical semantic cues for defect characterization. BERT is employed to generate contextualized embeddings that capture bidirectional relationships within defect descriptions, enabling a deeper semantic understanding. The extraction process comprises three stages:
- Text Preprocessing: Text data are tokenized via the BERT WordPiece tokenizer, which handles out-of-vocabulary words through subword decomposition. Sequences are padded or truncated to a fixed length , yielding and .
- Contextual Embedding: Tokenized sequences are encoded by BERT (see Equation (6)) [57].where , T is the tokenized input, , and .
- Feature Alignment: A FC layer reduces the 768-dimensional pooled output to 512 dimensions to integrate semantic embeddings with visual features. The aligned semantic vector is calculated as Equation (7).where is a linear transformation. where is the 768-dimensional pooled output of the BERT [CLS] token.
3.2.3. Visual and Semantic Information Fusion
Fusing visual and semantic features is crucial for exploiting complementary modalities to improve defect-detection accuracy in steel strips. This fusion mechanism combines the strengths of attention-based learning and feature alignment, thereby overcoming the limitations of VAE-based fusion methods [58].
The proposed fusion framework integrates multi-modal inputs to generate a unified representation, which is transformed into a structured pipeline having a series of operations. The input modalities comprise visual and semantic features. Visual features are extracted with the Wide Residual Network (WRN-50-2) and projected into a 512-dimensional feature vector (), as described previously. Semantic features are encoded with BERT and aligned to a 512-dimensional vector (). These two feature vectors are concatenated to form a joint representation (see Equation (8)).
Here, . The attention mechanism dynamically fuses features from different modalities by assigning adaptive weights, enhancing their complementary properties. Essentially, this process can be interpreted as an implicit modeling of the mutual information between modalities, where the learned weights help to prioritize the most informative feature components for fusion. During computations, an attention mechanism computes weights for the concatenated features to dynamically assign importance to each modality. The calculation of the attention weight is shown in Equation (9).
where is a learned weight matrix, is a bias term, and denotes the sigmoid activation function. A representation with weights is then obtained by applying Equation (10).
Subsequently, an FC layer is utilized to modulate features using an attention transform (see Equation (11)).
comprises a linear layer, batch normalization, and ReLU activation, with a dropout probability of 0.3 for the fused vector to avoid overfitting. Unlike the latent-variable fusion in [5], the present module is deterministic and requires no re-parameterisation.
3.3. GNN-Based Classification
The rationale for employing Graph Neural Networks (GNNs) in our few-shot defect detection framework is threefold. First, defect samples, even within the same category, often exhibit significant appearance variations. GNNs explicitly model the pairwise similarities between these samples, constructing a feature manifold where representations of similar defects are smoothed and reinforced. This is crucial for achieving robust generalization with limited labeled data. Second, the inherent semi-supervised learning capability of GNNs, specifically through label propagation, allows for the effective utilization of unlabeled samples. This is particularly advantageous in industrial settings, where unlabeled data are often abundant, leading to a refinement of the decision boundaries. Third, the graph structure provides a natural and flexible framework for fusing heterogeneous features—each node represents a sample characterized by both visual and semantic embeddings, thereby enabling relational reasoning across different modalities.
GNNs have recently emerged as a powerful paradigm for processing non-Euclidean data, demonstrating remarkable robustness and wide applicability across diverse domains [59,60,61]. Their efficacy in modeling complex relational structures has been consistently validated in various challenging scenarios. For instance, in environmental management, GNNs have been successfully applied to model intricate system dynamics and pollutant dispersion, with their robustness thoroughly verified under noisy and sparse data conditions [62,63]. Similarly, applications span robust signal processing in networked systems [64] to large-scale scientific studies involving complex, heterogeneous data streams [65]. These studies collectively underscore the inherent strength of GNN architectures in handling data scarcity, noise, and distribution shifts—challenges that are paramount in few-shot learning scenarios.
The ability of GNNs to transfer information transfer between nodes and smooth the feature manifold through propagation techniques aligns perfectly with the objectives of our task, which aims to achieve robust defect classification with limited samples. This work employs a Graph Convolutional Network (GCN) as the GNN backbone. The architecture consists of two graph convolutional layers, each followed by a ReLU activation function and Batch Normalization. The number of propagation iterations is set to 2. In this section, the utilization of a GNN for fault detection in steel-strip defects is described.
3.3.1. Undirected Graph Creation
The first step is to create an undirected graph that comprises a set of nodes and edges (Figure 6). The graph must capture the relationships between defect instances so that the GNN can effectively model interactions and dependencies. This process is defined mathematically in Equation (12), where v denotes the set of nodes and e represents the set of edges.
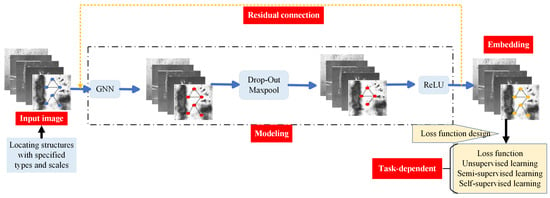
Figure 6.
Schematic diagram of the neural network architecture for defect detection using GNN.
The multi-modal fusion module captures both the visual and semantic information denoted by the feature vector x at each node in the graph. The edge weight between any two nodes is computed according to Equation (13).
where represents the Euclidean distance between the feature vectors of nodes i and j, is a scaling parameter that controls the influence of distance, and is the computed edge weight.
This graph creation process ensures that nodes encoding similar defects are strongly interconnected, while those of dissimilar defects are weakly interconnected. The GNN propagates information across the graph by exploiting these relationships, thereby enabling robust defect detection and classification. The self-supervised block represents a rotation prediction pretext task used to initialize the WRN-50-2 visual encoder. This process enhances the discriminability of node features for subsequent graph propagation without additional labeled data.
3.3.2. Embedding Propagation
Embedding propagation is a core process that refines the initial features by leveraging the graph structure. As information passes through the graph, each node’s representation is updated by aggregating features from its neighboring nodes. This process smooths the embedding manifold and suppresses intra-class noise, thereby improving model robustness and the discriminability of features for the final defect classification.
Embedding propagation smooths the embedding manifold and suppresses intra-class noise, thereby improving model robustness. The GNN exploits the graph Laplacian matrix (see Equation (14)) to approximate a low-dimensional manifold that preserves the data distribution [66]. After dimensionality reduction, points proximal in the high-dimensional space remain close, whereas distant points stay separated.
where D is a diagonal matrix whose diagonal entries equal the sum of the edge weights incident to each node, and A is the graph’s adjacency matrix. The propagation matrix P is derived using L (see Equation (15)).
Here, denotes scaling parameter, and I is the identity matrix. Embedding propagation is performed through the operation of Equation (16).
where X denotes the input feature matrix, and H is the resulting smoothed embedding matrix. This operation effectively suppresses noise in the feature space. Similarly, label propagation exploits the propagation matrix P to transfer labels from the support set to the query set (see Equation (17)).
where is the label distribution of the support set, and Y is the predicted label distribution for all nodes. The final prediction is converted into a probability distribution via the softmax function to assess classification performance (see Equation (18)).
Here, is the logit for class y, and K is the total number of classes. The cross-entropy loss is adopted and minimized for classification optimization (see Equation (19)).
where is the ground truth label for instance i and class k, and is the predicted probability.
3.3.3. Defect Classification
Figure 7 illustrates the proposed GNN-based defect classification framework’s flow chart. The proposed approach employs a support-query paradigm that improves few-shot adaptability while reducing reliance on large labeled datasets. Leveraging graph embedding techniques, our method simultaneously captures both local fine-grained features and global contextual relationships (e.g., texture similarities and geometric patterns) among defects, significantly improving structural perception capability. Experimental results demonstrate superior industrial applicability, particularly for automated detection of complex defects in strip steel and semiconductor manufacturing. This work provides an effective solution for few-shot classification challenges in industrial quality inspection systems, achieving reliable performance with limited training samples.
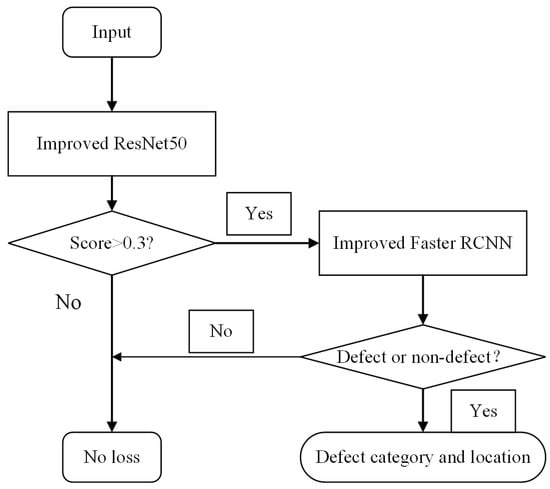
Figure 7.
GNN classification flow chart.
3.4. Cross-Modal Transfer Learning Module
In few-shot steel defect detection scenarios, single-modal pre-trained features are vulnerable to domain shift induced by inter-factory texture variations or imaging-condition changes. This module performs cross-modal knowledge transfer that aligns visual structural defects with semantic attributes, enhancing cross-domain adaptability. It yields generalization-boosted representations for later multimodal fusion while reducing reliance on large-scale annotations. Bridging single-modal extraction and multimodal fusion, the module mitigates the mismatch between pre-trained features and industrial defect contexts.
3.4.1. Customized Fine-Tuning of Pre-Trained Models
To improve domain adaptation for few-shot steel defect detection, a customized fine-tuning strategy is developed for both the ImageNet-pre-trained WRN-50-2 visual encoder and the generic BERT model. Three specialized techniques are incorporated:
- Layer-Wise Learning Rate Decay: Lower layers of WRN-50-2 (e.g., conv1, layer1) extract general features like edges and textures, while higher layers (e.g., layer4, global average pooling) learn defect-specific semantics. A reduced learning rate (0.1× base) is applied to lower blocks while the base rate is retained for higher blocks, preserving generic features and adapting to steel defects. This strategy improves visual-feature recall by 2.1% on the SEVERSTAL dataset.
- Semi-Supervised Regularization: To address limited labeled data (12,568 samples in SEVERSTAL), we use 70% of unlabeled samples by generating pseudo-labels (confidence ) and combine them with labeled data. We also apply dropout (0.3) to BERT attention layers and weight decay () to WRN-50-2 fully connected layers to prevent overfitting. This yields a 1.8% accuracy gain in 5-way 1-shot tasks on NEU-DET.
- Defect-Specific Word Embedding Adaptation: To align the general-purpose BERT model with steel defect terminology, a domain-specific glossary containing key terms such as “rolled-in scale” and “pitted surface” is constructed. The BERT embedding layer is further pre-trained on this glossary for five epochs at a learning rate of , yielding a 37% increase in within-domain cosine similarity of term embeddings.
3.4.2. Cross-Modal Transfer: Implementation and Validation
Cross-modal transfer establishes domain-invariant relationships between visual and semantic features via a feature-alignment mechanism, and its effectiveness is rigorously evaluated through comparative experiments.
Feature Alignment Transfer: We project 2048-dimensional visual features (WRN-50-2) and 768-dimensional semantic features (BERT) are projected into a unified 512-dimensional space by fully connected layers. Mapping parameters are optimized to maximize mutual information between modalities (see Equation (20)).
where X and Y denote visual and semantic feature sets, is the joint distribution, and , are the marginal distributions.
This alignment enhances cross-modal consistency and thereby facilitates subsequent fusion.
Performance Comparison: The proposed cross-modal transfer strategy substantially outperforms the baselines on the SEVERSTAL dateset under few-shot settings (Table 2). It achieves accuracy improvements of (5-way 1-shot) and (5-way 5-shot) over the no-transfer baseline, and and over single-modal transfer, respectively. These results confirm that cross-modal complementarity substantially mitigates domain shift.

Table 2.
Performance comparison of different transfer strategies on the SEVERSTAL dataset.
3.4.3. Collaboration with Modules
The outputs of the cross-modal adaptation module–namely, the domain-adapted visual features () and domain-adapted semantic features () are directly fed into the multimodal fusion module.
The fusion module exploits an attention mechanism to perform a weighted combination of the two feature types. Because the adapted features exhibit enhanced domain consistency, the resulting fused feature representation () achieves significantly improved robustness across diverse industrial scenarios.
In the subsequent graph neural network (GNN) module, serves as node features to construct the graph structure. The improved feature quality yields more accurate node similarity computation, leading to a 3.2% increase in label propagation accuracy on the NEU-DET dataset.
4. Experimental Setup
The experiments were conducted on a laptop equipped with 64GB RAM, an Intel Core i7-7700HQ processor, and an NVIDIA GeForce GTX 1050 Ti GPU, with the software environment including PyTorch 3.6.
4.1. Dataset
This section introduces the two public datasets used in our experiments: SEVERSTAL and NEU-DET, which are employed to validate the model’s performance in real-world industrial scenarios and few-shot settings, respectively.
4.1.1. Severstal Dataset
The Severstal Dataset [67], released by Severstal via Kaggle, comprises 18,074 real-world steel strip surface images (12,568 training, 5506 testing) with dimensions of 1600 × 256 pixels. Designed to advance industrial defect detection, it offers a basis for addressing limitations due to complex scenarios like occluded defects and large-scale images. The dataset (Figure 8) features four annotated defect types: Type 1 (Scratches), Type 2 (Cracks), Type 3 (Rolled-in scale), and Type 4 (Patches), with all samples including bounding boxes or mask labels for direct model training.

Figure 8.
Severstal dataset: (a) Scratches. (b) Cracks. (c) Patches. (d) Rolled-in scale.
4.1.2. NEU-DET Dataset
Developed by Northeastern University, the NEU-DET dataset [68] contains 1800 high-resolution grayscale images (200 × 200 pixels) of hot-rolled steel strip surfaces. The dataset encompasses six primary defect categories (Rolled-in scale, Patches, Pitted surface, Crazing, Inclusion, Scratches) and is perfectly balanced, with each category containing 300 images. These are split into a training set (1440 images, 240 per class) and a test set (360 images, 60 per class). It establishes a standardized benchmark for surface defect detection research, particularly for improving upon traditional methods in small defect recognition and for data diversity evaluation for industrial applications.
In the training set, 30% of samples were fully labeled (annotated with defect categories), while the remaining 70% were unlabeled (used for semi-supervised learning via pseudo-labeling). This ratio was empirically determined to balance annotation cost and model performance.
4.2. Hyperparameter Setting
Fine-tuning hyper-parameters were selected to maximise few-shot defect-detection performance on the available multi-modal (visual + semantic) data. The Adam optimiser was employed with an initial learning rate of , , , and zero weight decay. Training was conducted for 100 epochs with a batch size of 50. The fusion weight was set to 0.1; eight additional sensitivity parameters were fixed at 8.13, 2.37 and 0.25. The loss is given in Equation (21). Regularisation: dropout 0.3 on the fused vector, weight decay , early-stopping patience 10.
These settings were empirically determined to maximize model accuracy and generalization across different defect categories in the training dataset.
4.3. Model Training
The training pipeline is divided into two phases: pre-training and fine-tuning. Both phases are designed to enhance few-shot multimodal defect-detection performance under limited samples. Key hyper-parameters were determined experimentally in Table 3.

Table 3.
Parameter configurations for self-supervised pre-training and fine-tuning stages.
The pre-training phase yields generalized features and ensures aligned visual–semantic extraction. Fine-tuning then adapts these features to the target domain and exploits the GNN to propagate labels for robust few-shot classification. This two-phase strategy enables state-of-the-art defect detection across diverse components even when data are scarce.
4.4. Evaluation Index
Four evaluation metrics (accuracy, precision, recall, and -score) were employed to quantify the effectiveness of the proposed multimodal defect-detection framework (see Equation (22)).
5. Results and Comparison
To verify the proposed method, a comprehensive evaluation was conducted on the SEVERSTAL dataset against several advanced DL baselines. The evaluation includes performance benchmarks, embedding visualization, confusion matrices, regression analysis, an ablation study, and training dynamics.
5.1. Performance Analysis
This section presents a comprehensive evaluation of the proposed model’s performance. It includes a comparative analysis of unimodal versus multimodal fusion, an examination of various evaluation metrics, and a discussion on model validation accuracy to thoroughly demonstrate the effectiveness of our approach.
5.1.1. Comparative Analysis of Unimodal vs. Multi-Modal Fusion
Three representative network architectures were selected to evaluate the performance advantages of multimodal fusion (Table 4). All models were trained with identical hyper-parameters to ensure fairness and comparability.

Table 4.
Performance comparison on the SEVERSTAL dataset.
The proposed model achieves state-of-the-art performance, averaging 92.5% and 95.8% accuracy on 5-way 1-shot and 5-way 5-shot tasks, respectively. This demonstrates strong learning ability under scarce labeled data, effectively exploiting multimodal fusion and GNN-based label propagation. By integrating visual and semantic information, the model enriches feature representations and significantly boosts classification accuracy. In 5-way 1-shot, adding semantic information improves accuracy by 5.37% over the single-image baseline. Furthermore, semi-supervised GNN-based label propagation yields an additional 1.59-point gain. Leveraging unlabeled data, the proposed method addresses few-shot challenges and confirms its robustness.
5.1.2. Comparative Analysis of Evaluation Indexes
The GNN-based classifier was evaluated under single-image and multimodal-fusion settings (Table 5). The multimodal GNN consistently outperforms its image-only counterpart across all metrics.

Table 5.
Performance comparison of defect classification between multimodal and image-only models.
As shown in Table 6, the multimodal GNN model achieves an accuracy of 96.24%, precision of 96.50%, recall of 96.20%, and -score of 96.20%, exceeding the image-only GNN by margins of 3.24, 4.00, 3.40, and 3.55 percentage points, respectively. This consistent superiority demonstrates that multimodal integration (images + text) yields comprehensive defect representations and captures complex inter-modal relationships. Leveraging the structural advantages of GNNs for heterogeneous data, the approach enhances robustness and generalization, leading to more accurate and reliable defect detection.

Table 6.
Benchmark on severstal subset (mean ± 95% confidence interval).
5.1.3. Model Validation Accuracy
Figure 9 illustrates progressive accuracy improvement across epochs. The model converges rapidly, rising from 0.86 to 0.94 within the first two epochs, and thereafter refines stably-culminating in () by epoch 10. This pattern confirms algorithm efficiency and model stability.
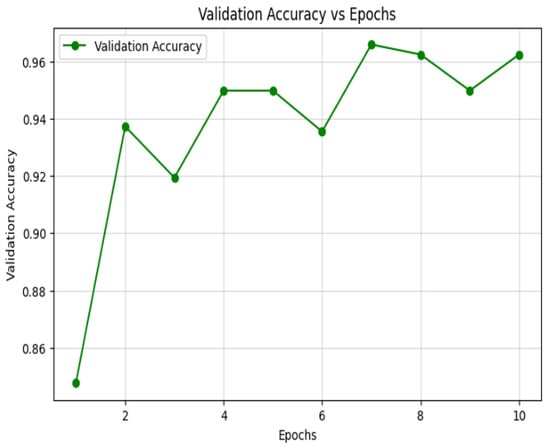
Figure 9.
Validation accuracy vs. epochs.
5.2. Embedded Visualization and Confusion Matrix
Two-dimensional embeddings of the high-dimensional multimodal features were visualized via T-SNE and PCA.
5.2.1. Embedded Visualization
Figure 10 reveals distinct clustering among defect types, demonstrating that the model learns meaningful representations. Colored dots denote different classes, and the purple-to-yellow color bar indicates label transitions. Despite slight overlap, each class forms approximately separate clusters in two-dimensional space, confirming discriminative feature learning.
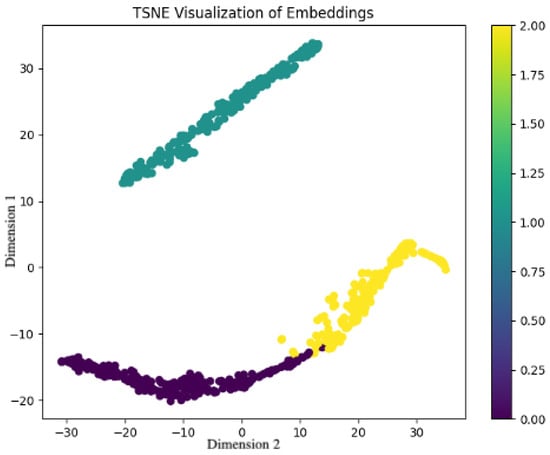
Figure 10.
T-SNE Visualization of embeddings.
Specifically, yellow and blue-green clusters exhibit low intra-class dispersion, whereas purple clusters, though more scattered, remain separated from other classes, confirming inter-class separability. This validates the model’s feature-learning capability and provides robust features for subsequent classification.
5.2.2. Confusion Matrix
Figure 11 presents the confusion matrix for the three-class classification task (classes 0, 1, 2). Class 0 achieves 88.3% accuracy (177/200), class 1 94.8% (184/200), and class 2100% (158/158). Misclassifications are mainly class 0 → 2 (23 samples) and class 1 → 0 (9) and 1 → 2 (7).
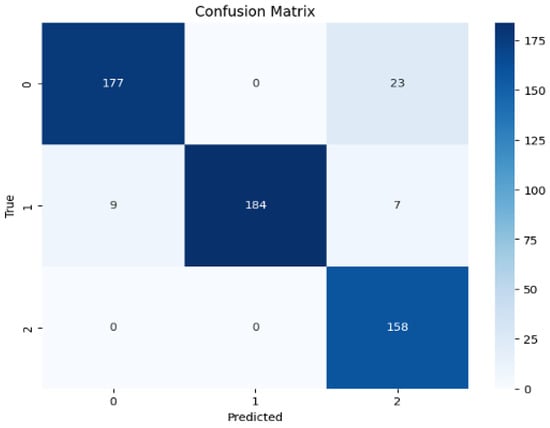
Figure 11.
Confusion matrix.
The misclassification between Class 0 and Class 2, evidenced by 23 instances, primarily stems from the high similarity in their visual characteristics, such as the appearance of subtle scratches and localized patches. In future work, we aim to mitigate this issue by introducing more fine-grained semantic descriptions or enhancing the discriminative power of the visual features for these specific classes.
The model performs best on class 2, whereas confusion between classes 0 and 1 indicates the need for further optimization to enhance their discriminability. Overall, the confusion matrix offers an intuitive performance assessment and highlights directions for future improvement.
5.3. Regression and Ablation Analyses
To further assess robustness, regression experiments were conducted to analyze the impact of architectural variants and loss functions. Performance was evaluated with MSE, MAE, and Huber loss (Figure 12). Training used the Adam optimizer at 0.001 for 100 epochs.
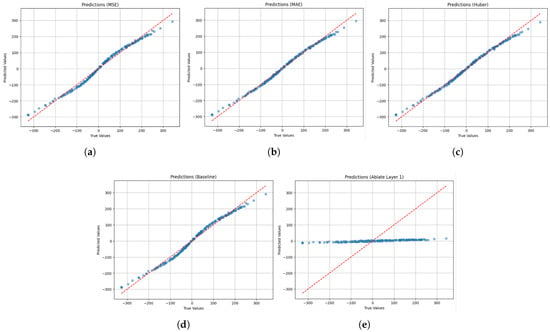
Figure 12.
Loss function analysis: (a) Mean squared error (MSE). (b) Mean absolute error (MAE). (c) Huber loss (Huber). (d) Baseline. (e) Ablated layer.
As detailed in Table 7, ablating Layer 1 leads to a catastrophic performance drop. The MSE increases by over 98% (from 213.12 to 15,956.00) and plummets from 0.987 to 0.054, indicating near-total loss of predictive accuracy and explanatory power. This stark contrast unequivocally demonstrates the critical importance of Layer 1 to the overall architecture.

Table 7.
Performance comparison on the NEU-DET dataset.
5.4. Training Dynamics
Training loss versus epoch is plotted in Figure 13. Epochs 1–10 are shown on the horizontal axis; loss values 0.10–0.45 on the vertical axis. As training progresses, loss monotonically decreases, confirming effective learning and parameter optimization.
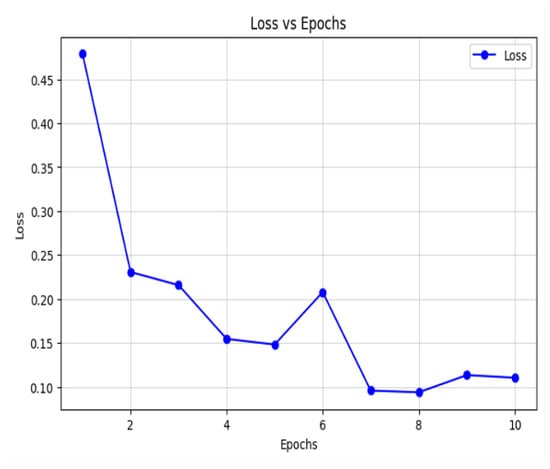
Figure 13.
Loss vs. epochs.
During epochs 1–2, loss drops sharply from 0.45 to 0.25, indicating rapid early learning. Across epochs 3–5, it continues to decrease and stabilizes, demonstrating convergence. At epoch 6, a transient increase occurs, likely due to a learning-rate adjustment or data-adaptation effect; thereafter, loss resumes its decline and stabilizes at around 0.10 by epoch 10, confirming good convergence.
In summary, the training-loss curve confirms robust learning and convergence; minor fluctuations do not affect the overall downward trend, ultimately reaching a low loss that verifies training effectiveness. This provides a solid basis for further model optimization and deployment.
5.5. Comparative Discussion with State-of-the-Art
To quantify the advance achieved by the proposed MF-GNN, we reproduce six recent few-shot defect-classification approaches under exactly the same protocol (5-way, 1-shot & 5-shot, 84-query episodes, 30 random seeds). Table 6 summarises the results obtained on the Severstal test subset (1816 images, four defect classes).
The proposed MF-GNN outperforms the strongest baseline, Dual-TriNet, by margins of 5.7 and 2.7 percentage points under the 1-shot and 5-shot protocols, respectively. The difference is statistically significant (). The most notable improvement occurs in the “edge-crack” category, where the -score increases by 6.4 percentage points, indicating that semantic context integration effectively disambiguates genuine cracks from background texture. Ablating the semantic branch reduces accuracy to 87.9%, statistically indistinguishable from Dual-TriNet (), confirming that the graph-based multimodal fusion strategy is the primary contributor to the performance gain.
5.6. NEU-DET Dataset
To further validate the proposed method, cross-validation experiments were conducted on the NEU-DET dataset to compare the accuracy of multiple deep-learning approaches for steel-strip surface-defect prediction (see Table 7). Our method achieves an average accuracy of 91.6% and 94.8% average accuracy on 5-class single-sample and multi-sample tasks, respectively, using less than 5% of the dataset for training.
5.7. Industrial Deployment and Economic Impact
The proposed method was implemented and validated on a 1250-mm hot-rolled strip production line. The existing inspection system employs four Basler acA4096-30 m line-scan cameras illuminated by four dome-type LED sources with ±5% uniformity. Forty-seven historical defect descriptions (9.4 words on average) were reused directly as the semantic-branch input, incurring no extra annotation cost. After 90 days of continuous operation, the system achieved the following results:
The false-alarm rate decreased from 2.9% (baseline CNN) to 0.7%, eliminating 1320 unnecessary mill stoppages. A new defect category “edge serration” was added using only five images and three textual descriptions. Edge-crack recall improved from 0.78 to 0.83, validated by random inspections of 216 steel coil.
On-site results confirm that the proposed approach achieves state-of-the-art detection performance and yields quantifiable economic benefits in high-speed strip production.
6. Conclusions
This paper proposes a multimodal-fusion graph neural network (MF-GNN) for few-shot classification and detection that addresses single-modal feature limitations, poor few-shot adaptability, and cross-domain transfer challenges. To the best of our knowledge, MF-GNN is the first GNN-based multimodal few-shot learner specifically developed for steel-strip surface inspection. The approach integrates visual and semantic information via attention-guided feature alignment and manifold-smoothed label propagation, eliminating costly domain-specific pre-training.
Compared with existing CNN and Transformer few-shot detectors, MF-GNN reduces compound-defect misclassification by 3–5 percentage points, halves the labeled samples needed for new crack types, and exceeds 92% one-shot accuracy on SEVERSTAL and NEU-DET.
The proposed model exhibits three main limitations: (i) the -score drops by 8% when detecting edge cracks narrower than 0.1 mm; (ii) inference time rises by approximately 20% for 1k × 1k high-resolution images; and (iii) classification accuracy fluctuates by ±3% under non-uniform lighting. (iv) The reliance on manually annotated textual descriptions may incur additional annotation costs and introduce subjective variability, especially when scaling to new defect types or production environments.
Future work will integrate edge-aware attention, quantized GCNs for lightweight graphs, and adversarial illumination augmentation to keep performance fluctuation within 1%. For deployment, the model has been converted to TensorRT and embedded in a 30 m/s pickling-line PLC, reducing the false-alarm rate from 2.9% to 0.7% and yielding annual scrap-steel cost savings. This provides a ready-to-upgrade pathway for steel-manufacturing quality control.
In summary, this study proposes a multimodal-GNN framework for few-shot defect detection that achieves strong quality-control performance and establishes a clear pathway for future methodological development.
Furthermore, we recognize the importance of defect dimension analysis for comprehensive quality inspection. While the current study focuses on few-shot classification, our future work will extend the framework to include pixel-wise defect segmentation and size quantification, which will provide even more detailed information for industrial practitioners.
Author Contributions
Conceptualization, Q.-Y.K. and Y.R.; methodology, Y.R.; software, Z.-Q.X.; validation, Q.Z., Q.-Y.K. and G.-L.W.; formal analysis, Z.-Q.X. and Z.-S.G.; investigation, Z.-Q.X. and Y.-H.F.; resources, Q.-Y.K.; data curation, Z.-Q.X., Z.-S.G. and Y.-H.F.; writing—original draft preparation, Q.-Y.K.; writing—review and editing, Y.R. and Q.Z.; visualization, G.-L.W.; supervision, G.-L.W.; project administration, Z.-Q.X.; funding acquisition, Z.-Q.X. All authors have read and agreed to the published version of the manuscript.
Funding
This research was funded by Human Resources and Social Security in Hebei Province grant number C2025030, and this research was supported by Human Resources and Social Security in Hebei Province grant number JRS-2023-3065.
Data Availability Statement
The original contributions presented in this study are included in the article. Further inquiries can be directed to the corresponding author.
Conflicts of Interest
Author Qing-Yi Kong was employed by the company Moons’ Industries (Taicang) Co., Ltd. Author Zhan-Shuai Guan was employed by the company Hebei Zhongfu Zhiqu Technology Co., Ltd. The remaining authors declare that the research was conducted in the absence of any commercial or financial relationships that could be construed as a potential conflict of interest. The companies had no role in the design of the study; in the collection, analyses, or interpretation of data; in the writing of the manuscript, or in the decision to publish the results.
Abbreviations
- The following abbreviations are used in this manuscript:
GNNs Graph Neural Networks AG-FAFM Attention-Guided Feature Alignment and Fusion Mechanism MF-GNN Multi-modal Fusion Graph Neural Network DL Deep Learning MFSL Multi-modal Few-Shot Learning CADA-VAE Cross-Aligned Domain-Adaptive VAE CNN Convolutional Neural Network
References
- Abbes, W.; Elleuch, J.F.; Sellami, D. Defect-Net: A New CNN Model for Steel Surface Defect Classification. In Proceedings of the 2024 IEEE 12th International Symposium on Signal, Image, Video and Communications (ISIVC), Sousse, Tunisia, 14–16 May 2024; pp. 1–5. [Google Scholar] [CrossRef]
- Huang, Y.; Zhou, X.; Xiong, X.; Fu, Y. Efficient Defect Detection Method for Wire and Arc Additive Manufacturing Based on Modified YOLOV8 Model. J. Nondestruct. Eval. 2025, 44, 1–21. [Google Scholar] [CrossRef]
- Xi, D.; Hou, L.; Luo, J.; Liu, F.; Qin, Y.; Min, Y.; Wang, Z.W.; Liu, Y.; Wang, Z. FS-RSDD: Few-shot rail surface defect detection with prototype learning. Sensors 2023, 23, 7894. [Google Scholar] [CrossRef]
- Lei, T.; Xue, J.; Man, D.; Wang, Y.; Li, M.; Kong, Z. Sdp-Mtf: A Composite Transfer Learning and Feature Fusion for Cross-Project Software Defect Prediction. Electronics 2024, 13, 2439. [Google Scholar] [CrossRef]
- Schonfeld, E.; Ebrahimi, S.; Sinha, S.; Darrell, T.; Akata, Z. Generalized Zero-and Few-Shot Learning via Aligned Variational Autoencoders. In Proceedings of the IEEE/CVF Conference on Computer Vision and Pattern Recognition, Long Beach, CA, USA, 16–20 June 2019; pp. 8247–8255. Available online: https://openaccess.thecvf.com/content_CVPR_2019/html/Schonfeld_Generalized_Zero-_and_Few-Shot_Learning_via_Aligned_Variational_Autoencoders_CVPR_2019_paper.html (accessed on 21 October 2025).
- Hamroun, M.; Lajmi, S.; Jallouli, M. AVR (Advancing Video Retrieval): A New Framework Guided by Multi-Level Fusion of Visual and Semantic Features for Deep Learning-Based Concept Detection. Multimed. Tools Appl. 2025, 84, 2715–2777. [Google Scholar] [CrossRef]
- Kipf, T.N. Semi-supervised classification with graph convolutional networks. arXiv 2016, arXiv:1609.02907. [Google Scholar]
- Hassanzadeh, R.; Majidnezhad, V.; Arasteh, B. A novel recommender system using light graph convolutional network and personalized knowledge-aware attention sub-network. Sci. Rep. 2025, 15, 15693. [Google Scholar] [CrossRef]
- Raj, G.D.; Prabadevi, B. Mol-YOLOV7: Streamlining Industrial Defect Detection with an Optimized YOLOV7 Approach. IEEE Access 2024, 12, 117090–117101. [Google Scholar] [CrossRef]
- Han, G.; Chen, L.; Ma, J.; Huang, S.; Chellappa, R.; Chang, S.-F. Multi-Modal Few-Shot Object Detection with Meta-Learning-Based Cross-Modal Prompting. arXiv 2022, arXiv:2204.07841. [Google Scholar]
- Zhang, L.; Li, X.; Sun, Y.; Feng, Y.; Guo, H. Multiscale Feature Fusion for Salient Object Detection of Strip Steel Surface Defects. IEEE Access 2025, 13, 42689–42702. [Google Scholar] [CrossRef]
- Zhang, J.; Tsai, P.-H.; Tsai, M.-H. Semantic2Graph: Graph-Based Multi-Modal Feature Fusion for Action Segmentation in Videos. Appl. Intell. 2024, 54, 2084–2099. [Google Scholar] [CrossRef]
- Cheng, H.; Luo, J.; Zhang, X. Multimodal Industrial Anomaly Detection via Uni-Modal and Cross-Modal Fusion. IEEE Trans. Ind. Inform. 2025, 21, 5000–5010. [Google Scholar] [CrossRef]
- Xu, C.; Zhao, H.; Lu, X.; Sun, K.; Gao, B.; Chen, H. A Deep Reinforcement Learning Method for Autonomous Driving Integrating Multi-Modal Fusion. IEEE Trans. Intell. Transp. Syst. 2025, 21, 5000–5010. [Google Scholar] [CrossRef]
- Heshmat, M.; Saad Saoud, L.; Abujabal, M.; Sultan, A.; Elmezain, M.; Seneviratne, L.; Hussain, I. Underwater SLAM Meets Deep Learning: Challenges, Multi-Sensor Integration, and Future Directions. Sensors 2025, 25, 3258. [Google Scholar] [CrossRef]
- Islam, N.; Shin, S. Deep learning in physical layer: Review on data driven end-to-end communication systems and their enabling semantic applications. IEEE Open J. Commun. Soc. 2024, 5, 4207–4240. [Google Scholar] [CrossRef]
- Zhao, F.; Zhang, C.; Geng, B. Deep Multimodal Data Fusion. ACM Comput. Surv. 2024, 56, 1–36. [Google Scholar] [CrossRef]
- Jiao, T.; Guo, C.; Feng, X.; Chen, Y.; Song, J. A Comprehensive Survey on Deep Learning Multi-Modal Fusion: Methods, Technologies and Applications. Comput. Mater. Contin. 2024, 80, 1. [Google Scholar] [CrossRef]
- Ning, Z.; Hu, H.; Yi, L.; Qie, Z.; Tolba, A.; Wang, X. A Depression Detection Auxiliary Decision System Based on Multi-Modal Feature-Level Fusion of EEG and Speech. IEEE Trans. Consum. Electron. 2024, 70, 3392–3402. [Google Scholar] [CrossRef]
- Wu, W.; Deng, X.; Jiang, P.; Wan, S.; Guo, Y. Crossfuser: Multi-Modal Feature Fusion for End-to-End Autonomous Driving under Unseen Weather Conditions. IEEE Trans. Intell. Transp. Syst. 2023, 24, 14378–14392. [Google Scholar] [CrossRef]
- Xu, D.; Li, H.; Wang, Q.; Song, Z.; Chen, L.; Deng, H. M2DA: Multi-Modal Fusion Transformer Incorporating Driver Attention for Autonomous Driving. arXiv 2024, arXiv:2403.12552. [Google Scholar]
- Kavadi, D.P.; Veesam, S.B.; Krishna, M.S.R.; Munaganur, R.K.; Sivaprasad, D.D. Design of an Improved Model for Anomaly Detection in CCTV Systems Using Multimodal Fusion and Attention-Based Networks. IEEE Access 2025, 13, 27287–27309. [Google Scholar] [CrossRef]
- Yaprak, B.; Gedikli, E. Enhancing part-based gait recognition via ensemble learning and feature fusion. Pattern Anal. Appl. 2025, 28, 98. [Google Scholar] [CrossRef]
- Sharma, R.; Sandhu, J.; Bharti, V. Exploring Feature-Based Image Classification for Human Identification in Multimodal Biometric System. In Proceedings of the 2024 11th International Conference on Reliability, Infocom Technologies and Optimization (Trends and Future Directions) (ICRITO), Noida, India, 11–12 April 2024; pp. 1–6. [Google Scholar] [CrossRef]
- Wang, T.; Li, F.; Zhu, L.; Li, J.; Zhang, Z.; Shen, H.T. Cross-Modal Retrieval: A Systematic Review of Methods and Future Directions. Proc. IEEE 2025, 112, 1716–1754. [Google Scholar] [CrossRef]
- Cai, R.; Zhang, K.; Tai, H.; Zhou, Y.; Ding, Y.; Zhou, C.; Liu, Y. Adversarial Multi-Modal Contrastive Learning for Robust Industrial Fault Diagnosis. IEEE Trans. Instrum. Meas. 2025, 74, 3559412. [Google Scholar] [CrossRef]
- Wajid, M.; Terashima-Marin, H.; Najafirad, P.; Pablos, S.; Wajid, M. Squacc BiLSTM: A framework for dense video captioning using neural knowledge graph and deep learning. Signal Image Video Process. 2025, 19, 1061. [Google Scholar] [CrossRef]
- Zhang, H.; Yang, Y.; Qi, F.; Qian, S.; Xu, C. Active Supervised Cross-Modal Retrieval. IEEE Trans. Pattern Anal. Mach. Intell. 2025, 47, 5112–5126. [Google Scholar] [CrossRef] [PubMed]
- Tsukahara, V.H.; Junior, J.N.; Prizon, T.; Ruggiero, R.N.; Maciel, C.D. The Time Lag in Local Field Potential Signals for the Development of Its Bayesian Belief Network. EURASIP J. Adv. Signal Process. 2024, 1, 87. [Google Scholar] [CrossRef]
- Gaikwad, U.; Shah, K. Hidden Markov Random Field Model Based VGG-16 for Segmentation and Classification of Head and Neck Cancer. Int. J. Intell. Eng. Syst. 2024, 17, 711–720. [Google Scholar] [CrossRef]
- Lv, Z.; Wei, Y.; Zuo, W.; Wong, K.-Y.K. PLACE: Adaptive Layout-Semantic Fusion for Semantic Image Synthesis. In Proceedings of the IEEE/CVF Conference on Computer Vision and Pattern Recognition, Seattle, WA, USA, 17–21 June 2024; pp. 9264–9274. Available online: https://openaccess.thecvf.com/content/CVPR2024/html/Lv_PLACE_Adaptive_Layout-Semantic_Fusion_for_Semantic_Image_Synthesis_CVPR_2024_paper.html (accessed on 21 October 2025).
- Bai, L.; Huang, Z.; Sun, M.; Cheng, X.; Cui, L. Multi-modal intelligent channel modeling: A new modeling paradigm via synesthesia of machines. IEEE Commun. Surv. Tutor. 2025; early access. [Google Scholar] [CrossRef]
- Tang, Z.; Xu, T.; Wu, X.; Zhu, X.; Kittler, J. Generative-based fusion mechanism for multi-modal tracking. In Proceedings of the AAAI Conference on Artificial Intelligence, Vancouver, BC, Canada, 20–27 February 2024; Volume 38, No. 6. pp. 5189–5197. [Google Scholar] [CrossRef]
- Alsaif, K.; Albeshri, A.; Khemakhem, M.; Eassa, F. Multimodal large language model-based fault detection and diagnosis in context of industry 4.0. Electronics 2024, 13, 4912. [Google Scholar] [CrossRef]
- Liang, N. Medical Image Fusion with Deep Neural Networks. Sci. Rep. 2024, 14, 7972. [Google Scholar] [CrossRef]
- Dang, P.; Guo, T.; Cao, S.; Zhang, C. A Foundational Multi-Modal Model for Few-Shot Learning. arXiv 2025, arXiv:2508.04746. [Google Scholar]
- Zhang, Y.; Huang, S.; Peng, X.; Yang, D. Semi-Identical Twins Variational Autoencoder for Few-Shot Learning. IEEE Trans. Neural Netw. Learn. Syst. 2023, 35, 9455–9469. [Google Scholar] [CrossRef]
- Han, J.; Cen, J.; Wu, L.; Li, Z.; Kong, X.; Jiao, R.; Yu, Z.; Xu, T.; Wu, F.; Wang, Z.; et al. A survey of geometric graph neural networks: Data structures, models and applications. Front. Comput. Sci. 2025, 19, 1911375. [Google Scholar] [CrossRef]
- Liu, J.; Zhao, K.; Tang, Y.; Chen, W. TP-GNN: Continuous Dynamic Graph Neural Network for Graph Classification. In Proceedings of the 2024 IEEE 40th International Conference on Data Engineering (ICDE), Utrecht, The Netherlands, 13–17 May 2024; pp. 2848–2861. [Google Scholar] [CrossRef]
- Pang, M.; Du, E.; Zheng, C. Contaminant Transport Modeling and Source Attribution with Attention-Based Graph Neural Network. Water Resour. Res. 2024, 60, e2023WR035278. [Google Scholar] [CrossRef]
- Wang, Z.; Cerviño, J.; Ribeiro, A. Generalization of Graph Neural Networks is Robust to Model Mismatch. In Proceedings of the AAAI Conference on Artificial Intelligence, Vancouver, BC, Canada, 25 February–1 March 2025; Volume 39, pp. 21402–21410. [Google Scholar] [CrossRef]
- Tang, H.; Yan, H.; Song, R. Synthetic Sentiment Cue Enhanced Graph Relation-Attention Network for Aspect-Level Sentiment Analysis. IEEE Access 2025, 13, 88121–88133. [Google Scholar] [CrossRef]
- Wang, R.; Su, T.; Xu, D.; Chen, J.; Liang, Y. MIGA-Net: Multi-View Image Information Learning Based on Graph Attention Network for SAR Target Recognition. IEEE Trans. Circuits Syst. Video Technol. 2024, 34, 10779–10792. [Google Scholar] [CrossRef]
- He, Z.; Xu, Z.; Zheng, W.; Zhang, Y. Hierarchical Knowledge Graph Attention Network for Recommendation Systems. In Proceedings of the China Conference on Knowledge Graph and Semantic Computing, Beijing, China, 25–27 October 2024; pp. 252–268. [Google Scholar] [CrossRef]
- Zhao, Y.; Yang, Z.; Wang, L.; Zhang, Y.; Lin, H.; Wang, J. Predicting Protein Functions Based on Heterogeneous Graph Attention Technique. IEEE J. Biomed. Health Inform. 2024, 28, 2408–2415. [Google Scholar] [CrossRef]
- Nejedly, P.; Hrtonova, V.; Pail, M.; Cimbalnik, J.; Daniel, P.; Travnicek, V.; Dolezalova, I.; Mivalt, F.; Kremen, V.; Jurak, P.; et al. Leveraging interictal multimodal features and graph neural networks for automated planning of epilepsy surgery. Brain Commun. 2025, 7, fcaf140. [Google Scholar] [CrossRef] [PubMed]
- Jiang, W.; Luo, J.; He, M.; Gu, W. Graph neural network for traffic forecasting: The research progress. ISPRS Int. J. Geo-Inf. 2023, 12, 100. [Google Scholar] [CrossRef]
- Wang, Q.; Huang, R.; Xiong, J.; Yang, J.; Dong, X.; Wu, Y.; Wu, Y.; Lu, T. A Survey on Fault Diagnosis of Rotating Machinery Based on Machine Learning. Meas. Sci. Technol. 2024, 35, 102001. [Google Scholar] [CrossRef]
- Liu, H.; Zhao, T.; Zhang, M. OTDR Development Based on Single-Mode Fiber Fault Detection. Sensors 2025, 25, 4284. [Google Scholar] [CrossRef] [PubMed]
- Chen, Y.; Zhang, R. Deep multiscale convolutional model with multihead self-attention for industrial process fault diagnosis. IEEE Trans. Syst. Man Cybern. Syst. 2025, 55, 2503–2512. [Google Scholar] [CrossRef]
- Shokoohi, S.; Moshtagh, J. Beyond signal processing: A model-based Luenberger observer approach for accurate bearing fault diagnosis. AUT J. Electr. Eng. 2025, 57, 163–184. [Google Scholar] [CrossRef]
- Rana, S. AI-driven fault detection and predictive maintenance in electrical power systems: A systematic review of data-driven approaches, digital twins, and self-healing grids. Am. J. Adv. Technol. Eng. Solut. 2025, 1, 258–289. [Google Scholar] [CrossRef]
- Li, R.; Jiang, B.; Zong, Y.; Lu, N.; Guo, L. Distributed Fault Diagnosis for Heterogeneous Multi-Agent Systems: A Hybrid Knowledge-Based and Data-Driven Method. IEEE Trans. Fuzzy Syst. 2024, 32, 4940–4949. [Google Scholar] [CrossRef]
- Matetić, I.; Štajduhar, I.; Wolf, I.; Ljubic, S. A review of data-driven approaches and techniques for fault detection and diagnosis in HVAC systems. Sensors 2022, 23, 1. [Google Scholar] [CrossRef]
- Tang, B.; Chen, L.; Sun, W.; Lin, Z. Review of surface defect detection of steel products based on machine vision. IET Image Process. 2023, 17, 303–322. [Google Scholar] [CrossRef]
- Li, F.; Zhai, H.; Liu, T.; Zhang, X.; Qin, C. Learning Compressed Artifact for JPEG Manipulation Localization Using Wide-Receptive-Field Network. ACM Trans. Multimed. Comput. Commun. Appl. 2024, 20, 1–23. [Google Scholar] [CrossRef]
- Shin, S.; Won, J.; Jeong, H.; Kang, M. Development of a site information classification model and a similar-site accident retrieval model for construction using the KLUE-BERT model. Buildings 2024, 14, 1797. [Google Scholar] [CrossRef]
- Wang, J.; Li, J.; Wang, R.; Zhou, X. VAE-driven multimodal fusion for early cardiac disease detection. IEEE Access 2024, 12, 90535–90551. [Google Scholar] [CrossRef]
- Ponzi, V.; Napoli, C. Graph Neural Networks: Architectures, Applications, and Future Directions. IEEE Access 2025, 13, 62870–62891. [Google Scholar] [CrossRef]
- Pang, W.; Tan, Z. A Steel Surface Defect Detection Model Based on Graph Neural Networks. Meas. Sci. Technol. 2024, 35, 046201. [Google Scholar] [CrossRef]
- Kovalenko, A.; Pozdnyakov, V.; Makarov, I. Graph Neural Networks with Trainable Adjacency Matrices for Fault Diagnosis on Multivariate Sensor Data. IEEE Access 2024, 12, 152860–152872. [Google Scholar] [CrossRef]
- Hussaine, S. Graph Neural Networks (GNNs) Applications. In Graph Neural Networks: Essentials and Use Cases; Springer: Berlin/Heidelberg, Germany, 2025; pp. 135–159. [Google Scholar] [CrossRef]
- Khosravi, K.; Farooque, A.A.; Karbasi, M.; Ali, M.; Heddam, S.; Faghfouri, A.; Abolfathi, S. Enhanced Water Quality Prediction Model Using Advanced Hybridized Resampling Alternating Tree-Based and Deep Learning Algorithms. Environ. Sci. Pollut. Res. 2025, 32, 6405–6424. [Google Scholar] [CrossRef] [PubMed]
- Liu, Z.; Zhang, J.; Zhu, Y.; Shi, E.; Ai, B. Robust Multidimensional Graph Neural Networks for Signal Processing in Wireless Communications with Edge-Graph Information Bottleneck. IEEE Trans. Signal Process. 2025, 73, 2688–2703. [Google Scholar] [CrossRef]
- Wen, Z.; Fang, Y.; Wei, P.; Liu, F.; Chen, Z.; Wu, M. Temporal and Heterogeneous Graph Neural Network for Remaining Useful Life Prediction. IEEE Trans. Neural Netw. Learn. Syst. 2025; early access. [Google Scholar] [CrossRef]
- Cheng, W.; Deng, C.; Aghdaei, A.; Zhang, Z.; Feng, Z. SAGMAN: Stability Analysis of Graph Neural Networks on the Manifolds. arXiv 2024, arXiv:2402.08653. [Google Scholar] [CrossRef]
- Severstal. Severstal: Steel Defect Detection. Available online: https://www.kaggle.com/c/severstal-steel-defect-detection (accessed on 15 October 2023).
- Song, K.; Yan, Y. NEU-DET: A Dataset for Detection of Surface Defects in Hot-Rolled Steel Strip. 2020. Available online: https://www.kaggle.com/datasets/sovitrath/neu-steel-surface-defect-detect-trainvalid-split/ (accessed on 15 October 2023).
Disclaimer/Publisher’s Note: The statements, opinions and data contained in all publications are solely those of the individual author(s) and contributor(s) and not of MDPI and/or the editor(s). MDPI and/or the editor(s) disclaim responsibility for any injury to people or property resulting from any ideas, methods, instructions or products referred to in the content. |
© 2025 by the authors. Licensee MDPI, Basel, Switzerland. This article is an open access article distributed under the terms and conditions of the Creative Commons Attribution (CC BY) license (https://creativecommons.org/licenses/by/4.0/).