Article

The Pollutants and Carbon Emissions Reduction Pathway in Gansu Province Based on Power Supply and Demand Scenario Analysis

1
Big Data Center of State Grid Corporation of China, Beijing 100052, China
2
Institute of Atmospheric Physics, Chinese Academy of Sciences, Beijing 100029, China
*
Authors to whom correspondence should be addressed.
Processes 2025, 13(11), 3521; https://doi.org/10.3390/pr13113521
Submission received: 19 August 2025 / Revised: 9 October 2025 / Accepted: 28 October 2025 / Published: 3 November 2025

Abstract

Gansu Province, as a core region for the development of renewables in China, has significant research value in the synergistic pathway of its power supply–demand structure and pollution and carbon emission reduction goals. This study focuses on the pollution and carbon reduction challenges faced by Gansu Province and the current situation of power supply and demand. Based on scenario-setting methods, it couples the GCAM-China model with the DPEC model to construct a pathway for pollution reduction and carbon emission reduction in Gansu’s power system and predicts the future change in pollution and carbon emission reduction. It provides important support for the sustainable development of Gansu Province. Research indicates that by significantly increasing the share of renewable energy in the short term (2025–2040)—with installed capacity growing by 1–2 times and electricity generation reaching 148.6 billion kWh—the power sector can achieve carbon neutrality and near-zero pollution emissions by 2060. And the provincial carbon emissions will be 92.8% lower than in 2020, SO2 emissions will be 93.9% lower, and NOx emissions will be 92.3% lower, thus the synergistic benefits of pollution reduction and carbon reduction will be significantly enhanced. Additionally, the lower costs of production, energy dispatch, and renewable energy storage will increase industrial electrification rates by about 40% between 2020 and 2040. Gansu Province should vigorously promote the transformation of its energy structure while improving the flexibility of the power system to facilitate the integration and absorption of renewable energy. Promoting the development of clean and low-carbon technologies from both supply and demand sides, facilitating the substitution of traditional fossil fuels, and providing clean, reliable, and economical power assurance for the sustainable development of Gansu Province.

1. Introduction

In the context of the global response to climate change, the realization of the “dual carbon” goal requires a deep transformation of the energy system. As an important renewable energy base in Northwest China, Gansu Province has become the forefront of low-carbon transformation of the power system due to its unique geographical location and resource endowment, and it is a benchmark province for the transformation of the national energy structure. As of December 2024, the cumulative installed capacity of renewables in Gansu Province have reached 64.1 million kW, accounting for 64.1% of the total installed capacity. The proportion of installed capacity of renewables and the proportion of power generation of renewables rank second in China, showing the strong development momentum of Gansu Province in the field of renewables [1]. However, there are still multiple challenges to coordinate the power supply and demand structure with the goal of reducing pollution and carbon emissions. Studies have shown that direct carbon emissions from the electricity production stage account for the largest share (45.42%) of carbon emissions throughout the power life cycle [2]. The carbon emission intensity of the electricity production stage in Gansu Province in 2020 was 0.57 kg CO2/kWh [3]. In 2022, the intensity was reduced to 0.42 kg CO2/kWh [4], reflecting the contribution of the expansion of renewables installations to carbon emission reduction [5,6]. However, every 1% increase in the share of clean energy will only reduce emissions by 0.26%, and the effect is limited [3]. And according to the calculation of this study, the direct carbon emissions of the power system will still account for 46.1% of the total emissions of the province in 2023. On the other hand, the bottleneck of renewable absorption technology and the immaturity of dispatching technology affect the timely access of renewables to the power grid and efficient absorption [7]. About 20% of the power generation is wasted due to insufficient transmission capacity of the grid [8]. As a result, rising electricity consumption and inter-provincial electricity trade will drive up carbon emissions [2]. In this context, it is of great theoretical and practical significance to explore the synergistic path of power supply and demand optimization, pollution reduction, and carbon reduction to achieve the “dual carbon” goal.
Scholars at home and abroad have made remarkable progress in the field of low-carbon transformation of the power system. First, the optimization of the power structure is the key to achieving a low-carbon transition. Ma et al. [9] used the Model Predictive Control (MPC) framework to optimize China’s power supply structure, and found that increasing the proportion of wind power and photovoltaic installed capacity to 50% can lead to a peak of carbon emissions in the power sector ahead of schedule. Low-carbon power systems can also further drive carbon reductions in transport, industry, and buildings through electrification [10,11,12]. Increasing the share of non-fossil energy consumption is the most important way for Gansu Province to achieve its carbon neutrality goal [13]. Moreover, the synergistic effect of power structure optimization on pollution reduction and carbon reduction is significant. Jiang, P. et al. have shown that structural measures can achieve overall co-benefits, and technical measures are effective in reducing air pollution, but the operation of air pollution control devices requires additional electricity and increases CO2 emissions [14,15,16]. A case study in Jiangsu Province shows that accelerating the phase-out of coal power and increasing the proportion of renewable energy can synergistically reduce CO2 and pollutant emissions, with SO2 emissions reduced by up to 30% in the low-emission scenario [17]. The improvement of energy efficiency and the optimization of energy structure are important ways to achieve synergies in pollution reduction and carbon reduction [18]. In the pilot regions, CO2 emissions and PM2.5 concentrations decreased by 13.3% and 3.1%, respectively, raising the overall pollution reduction and carbon reduction level by 0.237 units. These research findings provide valuable insights for studying pollution and carbon emission reduction pathways based on the low-carbon transformation of the power system in Gansu Province.
Regarding research methodologies, scenario analysis methods and dynamic programming (DP) show high efficiency in power system optimization [19]. The Problem-Driven Scenario Reduction (PDSR) framework proposed by Zhuang et al. significantly improves the decision-making adaptability of the stochastic economic scheduling model [20]. The proactive countermeasures in the scenario analysis are helpful to promote the peak time of carbon emissions and reduce the peak carbon emissions, and attention should be paid to formulating differentiated carbon emission reduction policies according to regional characteristics [21]. However, most of the existing studies focus on the economically developed areas in the east, and there is still a gap in the regional path design for the renewables-rich areas in Northwest China. In particular, the multi-energy complementarity and inter-provincial consumption mechanism is complex and requires model simulation [22]. Model-based methods for forecasting energy and emissions changes are gaining traction across various sectors [23]. The Global Change Assessment Model (GCAM) has advantages in the coupled simulation of regional energy–economy–environment; Peng et al. quantified the contribution of the global power transition to the Sustainable Development Goals (SDGs) through this model, confirming its effectiveness in multi-system interaction analysis [24]. Research on pollution and carbon emission reduction pathways for provincial power system transformation can utilize the China-specific nested version of the GCAM, GCAM-China, to analyze Gansu Province’s socio-economic development, energy supply–demand dynamics, and emission trajectories under climate change scenarios. The power sector within GCAM-China achieves annual supply–demand equilibrium by iteratively determining supply prices that align with evolving demand from the building, industrial, and transportation sectors [25]. Subsequently, the scenario projections from GCAM-China are input into the DPEC (Dynamic Projection model for Emissions in China), which generates high-resolution future emission characteristics for Gansu Province. This approach will fill the research gap in energy allocation strategies and carbon emission reduction policies for renewable energy-rich regions in Northwest China, exemplified by Gansu Province.
Therefore, this study establishes an analytical and predictive framework for pollution reduction and carbon mitigation in Gansu’s power system by coupling GCAM-China and DPEC based on scenario-setting methodologies. Based on the energy characteristics and current emission status of Gansu Province, this study sets the high-emission scenario as the baseline scenario, the medium-emission scenario as the enhanced policy scenario, and the low-emission scenario as the acceleration transition scenario, focusing on the development space of supply-side structural optimization, demand-side power management (including renewable energy absorption capacity management), and the corresponding potential for pollution reduction and carbon reduction. It provides a theoretical basis for formulating scientific and feasible emission reduction strategies.

2. Materials and Methods

2.1. Preparation of Gansu Province Emission Inventory

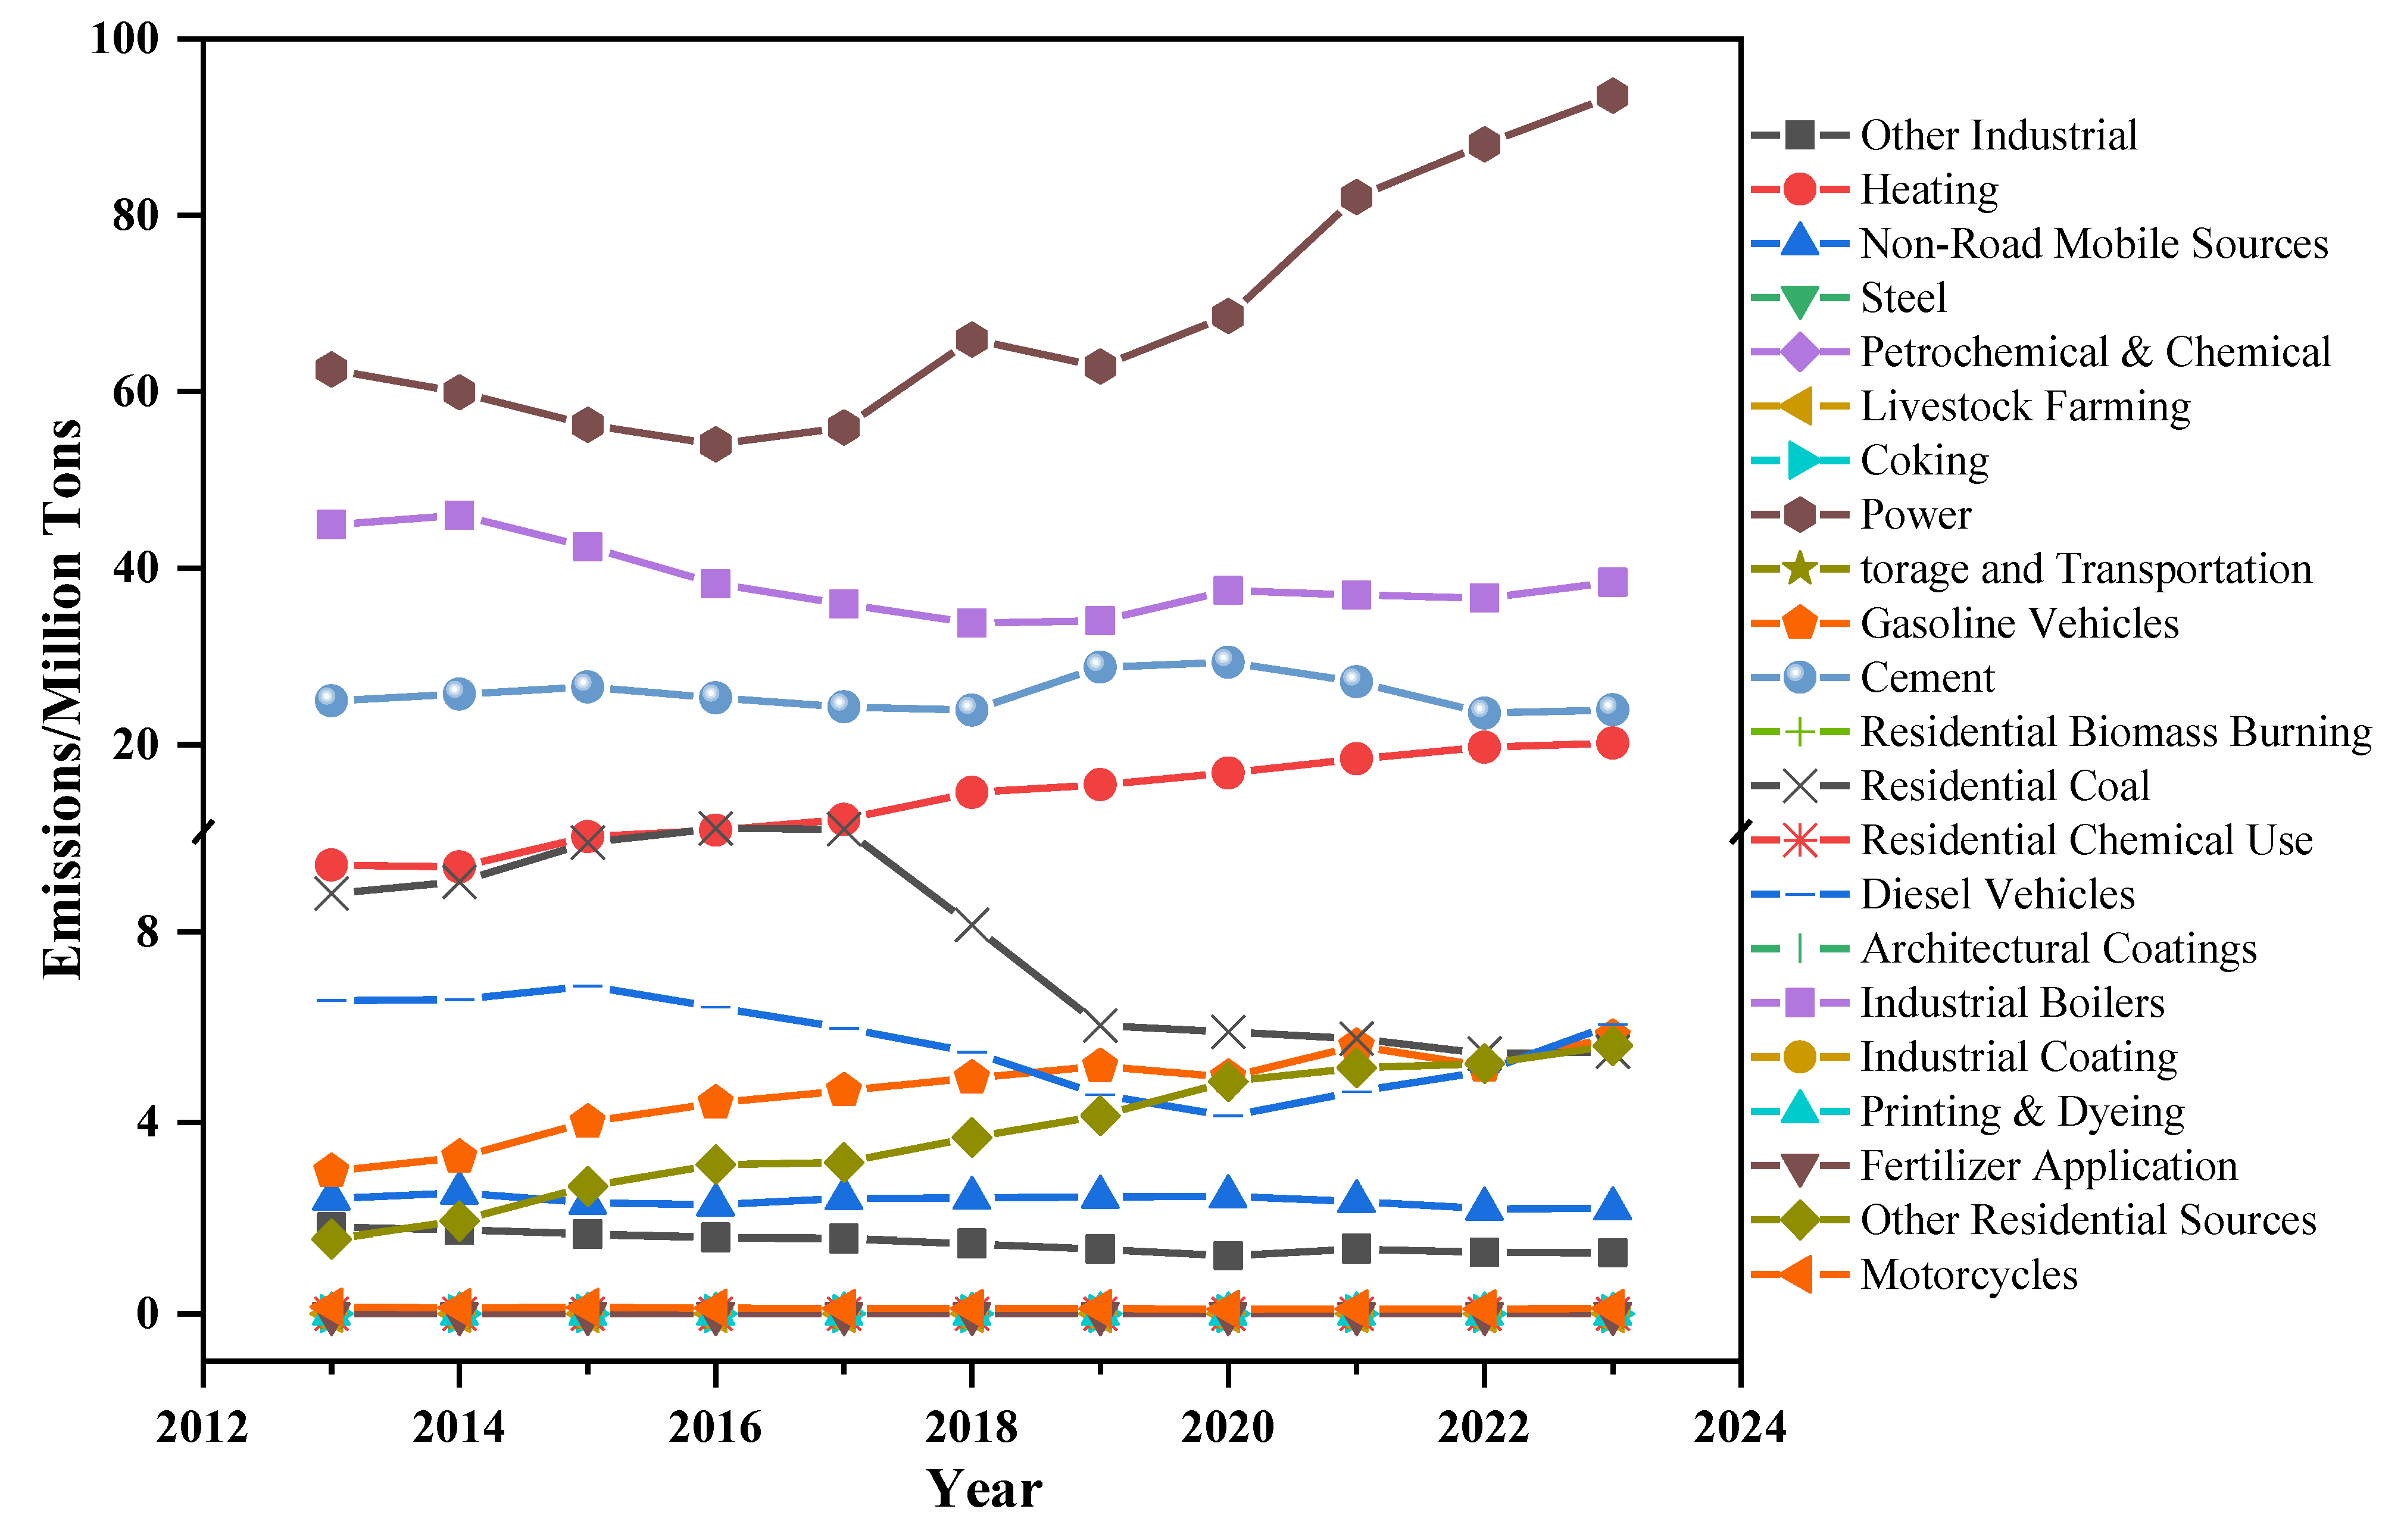
This study compiled an integrated emissions inventory for Gansu Province in accordance with the Technical Guidelines for the Compilation of Integrated Emissions Inventories of Air Pollutants and Greenhouse Gases (Trial Version) [26] issued by the Office of the Ministry of Ecology and Environment. The inventory includes five major air pollutants—SO2, NOx, PM2.5, VOCs, and NH3—as well as CO2. It was used to analyze the overall emission trends from 2013 to 2023. The inventory uses 2013 as the base year. The study scope covers 14 prefecture-level administrative units in Gansu Province. Anthropogenic sources include heating, non-road mobile sources, steel, petrochemical and chemical, livestock farming, coking, power, storage and transportation, gasoline vehicles, cement, residential biomass burning, residential coal, residential chemical use, diesel vehicles, architectural coatings, industrial boilers, industrial coatings, printing and dyeing, fertilizer application, other residential sources, motorcycles, and other industrial sources, totaling 22 subsectors. Data on industrial source activity levels were derived from the environmental statistical data of Gansu Province. Activity levels of mobile sources (such as vehicle emissions) were referenced from monitoring and management data of the Ministry of Transport. Activity level data on diffuse sources (such as construction dust) were sourced from relevant research findings of the Ministry of Housing and Urban-Rural Development.

2.2. Power Data Collection and Analysis

The power generation data, installed power generation capacity data, power consumption data, and inter-provincial power output data from 2013 to 2024, used for power supply and demand status analysis, were sourced from the Statistical Yearbook of the Gansu Provincial Bureau of Statistics and the National Bureau of Statistics. Some missing data were supplemented by searching for publicly available data online.
Thermal power generation depends directly on the amount of coal/gas, and fossil fuel combustion is the main source of CO2 and atmospheric pollutants (SO2, NOx). There is a natural correlation between the change in thermal power generation and the trend of air pollutants and carbon emission in the power industry. In the process of analysis, the change trend of thermal power data in Gansu Province shall be paid attention to.

2.3. Future Energy and Emission Projections

In this study, the GCAM-China and DPEC scenario setting methods are used to construct the pollutant and carbon emissions reduction pathway of the power system and predict future air pollutants and greenhouse gas emissions. The methodology framework for future energy and emissions forecasting is shown in Figure 1.
GCAM-China is a Chinese nested version of the GCAM developed by Pacific Northwest National Laboratory (PNNL) in collaboration with a Chinese team. The Global Change Analysis Model (GCAM) is a comprehensive assessment framework covering 32 global regions, capable of providing detailed descriptions of various technologies. GCAM describes the behavior and complex relationships between five systems (the socio-economic system, energy system, water resource system, agricultural and land use system, and climate system) and is widely used in global and regional scale climate reduction scenario analysis, which can generate complex system transformation pathways under various scenario assumptions.
As a dynamic recursive model, GCAM reads external scenario settings of key driving factors, such as population growth, economic activities, technological innovations, and policy adjustments, and solves the supply and demand relationships of energy and resources that satisfy market equilibrium. Specifically, the regional energy sectors are the representative entities in GCAM, which make resource allocation decisions based on price signals and other relevant information, clearly indicating their expected supply and demand quantities in the market, while GCAM iteratively solves for optimal prices to ultimately achieve supply and demand balance. GCAM-China has the ability to analyze socio-economic, energy supply and demand, and emission pathways in the context of climate change at the provincial scale in China [27]. GCAM-China decomposes the energy economy system of China into thirty-one provincial sub-regions and six power grid regions, Gansu Province can predict energy supply, energy consumption, product output, and technology evolution under different socio-economic pathways and climate targets, so as to construct future energy supply and demand and emission pathways. This study uses the open-source release version of GCAM-China-v6.
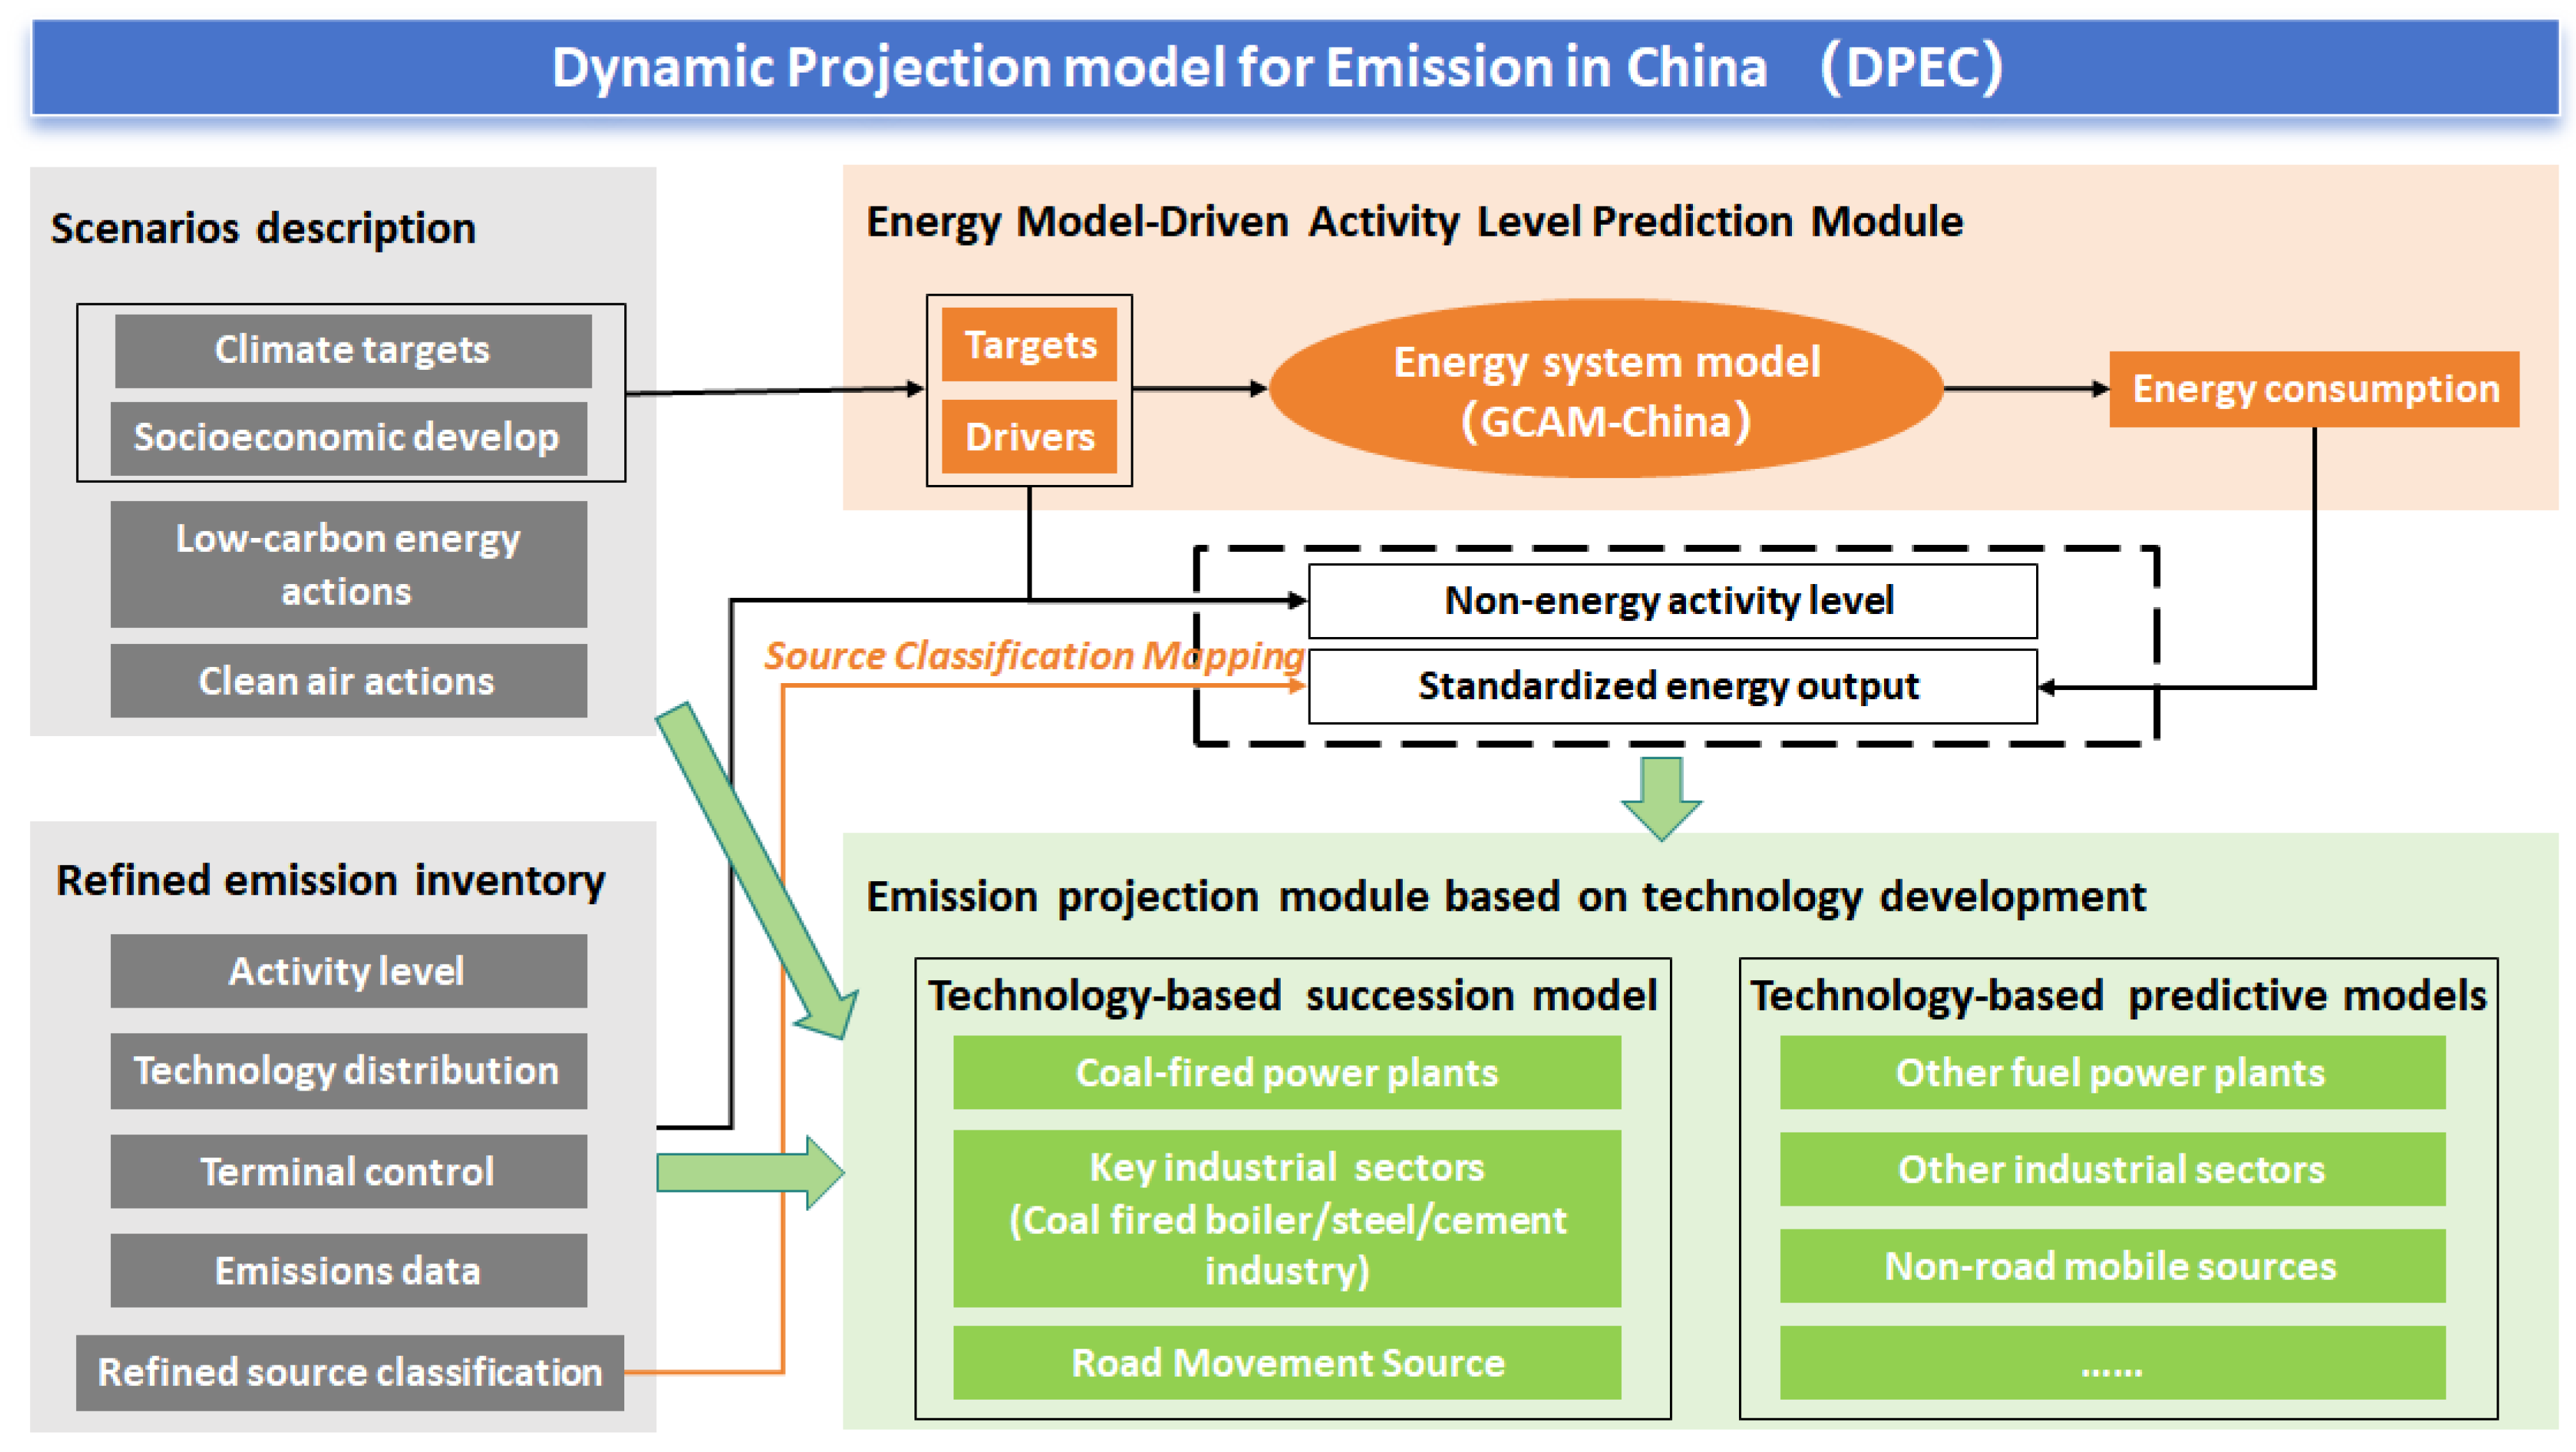
DPEC (Dynamic Projection model for Emissions in China) is a dynamic assessment model for future emissions of China developed by Tsinghua University. Its methodology is shown in Figure 2. The core function of the model is to dynamically simulate future emission changes based on technology succession. DPEC seamlessly connects the nested version of China’s global integrated assessment model, GCAM-China, mapping the future energy demand and supply scenarios constructed by GCAM-China and the technological succession of various pollution sources one by one, to realize fine simulation of future atmospheric emission changes under different socio-economic scenarios and climate targets. The process of GCAM-China output input to DPEC needs to be realized through systematic data interface and downscaling mapping, and the specific steps are as follows:
Step 1: GCAM-China output preparation and reference calibration. GCAM-China, as a nested version of the integrated assessment model for China provinces, needs to be calibrated for base-year parameters first to correct regional deviations in global energy scenarios. After calibration, the model output covers four types of core data: energy production data, i.e., the supply of primary energy; energy conversion data, i.e., the output of secondary energy sectors such as electricity, heat, and oil refining; terminal energy consumption data, i.e., the provincial energy consumption and industrial product output of industrial, construction, and transportation sectors; and socio-economic parameters, i.e., population, GDP, urbanization rate, and other driving factors. These outputs are generated based on different climate targets (e.g., carbon peaking and carbon neutralization constraints) and socio-economic scenarios (SSP) and provide the basis for subsequent dynamic projections. Step 2: Data interface development and dynamic mapping. The outputs of GCAM-China are mapped to the activity level prediction module of DPEC item by item by constructing a model data interface. Step 3: Department level matching and downscaling. The DPEC model contains 227 basic emission sources, and the coarse-grained output of GCAM-China needs to be downscaled to match. Step 4: Fine disassembly of fuel types. GCAM-China’s fuel classification needs to be further disassembled to match DPEC’s 1701 refined emission sources. Step 5: Dynamic integration of emission prediction modules. Upon completion of the activity level inputs, the emission projection module of the DPEC is processed through two types of sub-models. One type is a technology succession model, aiming at point sources such as coal-fired power plants and cement plants, taking the activity level provided by GCAM-China (such as power generation) as input, combining the service time of equipment and retirement policy, and dynamically predicting technology renewal and emission change. The other category is technology prediction models, which predict technology distribution and emissions under phase-out policy constraints based on provincial-scale activity level inputs for missing sectors (e.g., power generation from other fuels).
The core interaction between GCAM-China and DPEC lies in sector mapping and fuel decomposition. Sector mapping ensures energy flows are accurately directed from GCAM-China’s macro sectors (e.g., industrial final consumption) to DPEC’s micro emission sources (e.g., cement kilns). Fuel decomposition converts coarse-grained energy data into detailed emission sources through baseline year proportions. This process enables DPEC to generate high-resolution emission profiles based on GCAM-China’s macro scenarios, supporting research on synergistic pollution and carbon reduction governance.
The reference data used for future emission predictions of atmospheric pollutants and CO2 from 2020 to 2060 are from the DPEC v1.2 database [28,29,30]. Combined with emission inventory data from Gansu Province for 2020 (baseline year) to 2023 and future energy forecast results, the DPEC v1.2 data for Gansu Province were corrected and applied.
In this study, the GCAM was calibrated using renewable energy generation and CO2 emissions. Based on the emissions and power generation structure of Gansu Province in 2020, the future low-carbon power transition path was deduced (the last table of the paper).

3. Results and Discussion

3.1. Analysis of Overall Emission Trends

SO2 and NOx are the two pollutants with the highest contribution synergy with CO2 emission, so SO2 and NOx are taken as representatives to analyze the change trend of anthropogenic emissions in Gansu Province. As shown in Figure 3, the study takes 2013 as the baseline, demonstrating the relative changes in atmospheric pollutant and CO2 emissions across the province over the subsequent decade. From 2013 to 2022, the emissions of SO2 and NOx in Gansu Province continuously decreased, with reductions of 69.9% and 40.9%, respectively, and they are also the two types of air pollutants with the largest declines. However, the decline rate has been slow since 2020, with even a slight rebound in 2023, where SO2 and NOx rebounded by 0.6% and 2.5%, respectively. CO2 emissions have been continuously increasing since 2017. The highest increase was 22.0% in 2023. The total CO2 emission of Gansu Province reached 202.7 million tons in that year.
Gansu Province has a substantial carbon emissions volume, urgently requiring a reversal of the upward trend in carbon emissions; simultaneously, the task of synergistic carbon and pollutant emission reduction is arduous.
This study analyzed the changes in carbon emissions of sub-sectors in Gansu Province from 2013 to 2023 (Figure 4). The analysis results revealed that electric power, industrial boilers, cement, heating, and residential coal combustion are the five sectors with the highest carbon emissions. Among them, electricity carbon emissions contribute the most, which is consistent with the trend of carbon emissions in the province. Figure 5 further analyzes the changes in CO2, NOx, and SO2 emissions across the five sectors from 2013 to 2023. The power industry and industrial boilers have the largest overall pollutant emission reduction. However, as the sector with the largest increase in overall carbon emissions, the power industry has seen pollutant emissions not decrease but rather increase after 2020. In 2023, the carbon emission of the power industry reached 93.5 million tons, accounting for 46.1% of the carbon emission of the whole province. The changes in air pollutants and CO2 emissions in the power sector dominate the overall emission trend of Gansu Province.
The cross-elasticity analysis method evaluates the synergistic effect of reducing greenhouse gas and atmospheric pollutant emission rates through the ratio of their reduction rates [31,32,33].
E l s g / p = E C g / E g E C p / E p
E C g = E g E g
E C p = E p E p
where E l s g / p is the cross-elasticity value of the co-control, which reflects the degree of synergy in controlling the air pollutant p while reducing the greenhouse gas g emissions;
ECg/Eg is the rate of change in greenhouse gas g emissions;
ECp/Ep is the rate of change in emissions of air pollutants p;
Ep′ is the emission of air pollutants after the implementation of a pollution reduction pathway/measure (t);
Ep is the emission of air pollutants before the implementation of a pathway/measure (t);
ECp is the change (t) of air pollutant emissions before and after the implementation of a path/measure;
Eg′ is the greenhouse gas emissions (t) after the implementation of a pathway/measure;
Eg is the greenhouse gas emissions (t) before the implementation of a pathway/measure;
ECg is the change (t) in greenhouse gas emissions before and after the implementation of a pathway/measure.
When using E l s g / p to assess the level of synergistic emission reduction across industries/sources, a negative calculation result indicates a “non-synergy” phenomenon in the industry’s changes in greenhouse gas and air pollutant emissions, where one increases while the other decreases. Both ECp and ECg being greater than zero indicates a “negative synergy” phenomenon, where both greenhouse gases and air pollutants increase. Through cross-elasticity analysis, the changes in the cross-elasticity values for the synergistic reduction in pollution and carbon emissions in Gansu Province’s power, industrial boiler, and cement sectors from 2014 to 2023, using 2013 as the base year, are shown in Table 1. Compared to other sectors, the “non-synergy” effect between CO2 and NOx is most pronounced in the power sector, and its positive synergistic benefits have been deteriorating over the past decade. The synergistic emission reduction effect between CO2 and SO2 is also the poorest in the power sector. Furthermore, as shown in Figure 5, after 2020, emissions of CO2, NOx, and SO2 in the power sector have increased instead of decreasing (ECg = 25.0 million tons, ECNOx = 14.8 thousand tons, ECSO2 = 6.4 thousand tons), indicating a significant “negative synergy” effect. Therefore, implementing measures for synergistic pollution reduction and carbon mitigation in this sector will yield significantly higher co-benefits compared to all other sectors. The primary factor influencing the synergistic benefits is CO2 emission reduction. The preferred pathway to improve the synergistic benefits of pollution reduction and carbon mitigation in Gansu Province is to enhance the synergistic level within the power sector.

3.2. Current Situation of Power Supply and Demand

Gansu Province is endowed with abundant energy resources, and its installed power generation capacity has been steadily increasing. As shown in Figure 6, by the end of December 2024, Gansu Province’s total installed power generation capacity reached 99.9 million kW, representing a year-on-year increase of 11.5%. Among these, thermal power generation capacity stood at 26.2 million kW, accounting for 26.2% and renewable energy capacity reached 73.8 million kW, accounting for 73.8%. From a trend perspective, thermal power generation capacity has only seen a slight increase in recent years, with overall changes remaining minimal. Hydropower generation capacity has also remained virtually unchanged. Wind power and solar power generation capacities have increased exponentially, with renewables generation capacity accounting for 64.1% of the total by the end of 2024, reflecting the positive trend toward a cleaner and lower-carbon energy structure in Gansu Province.
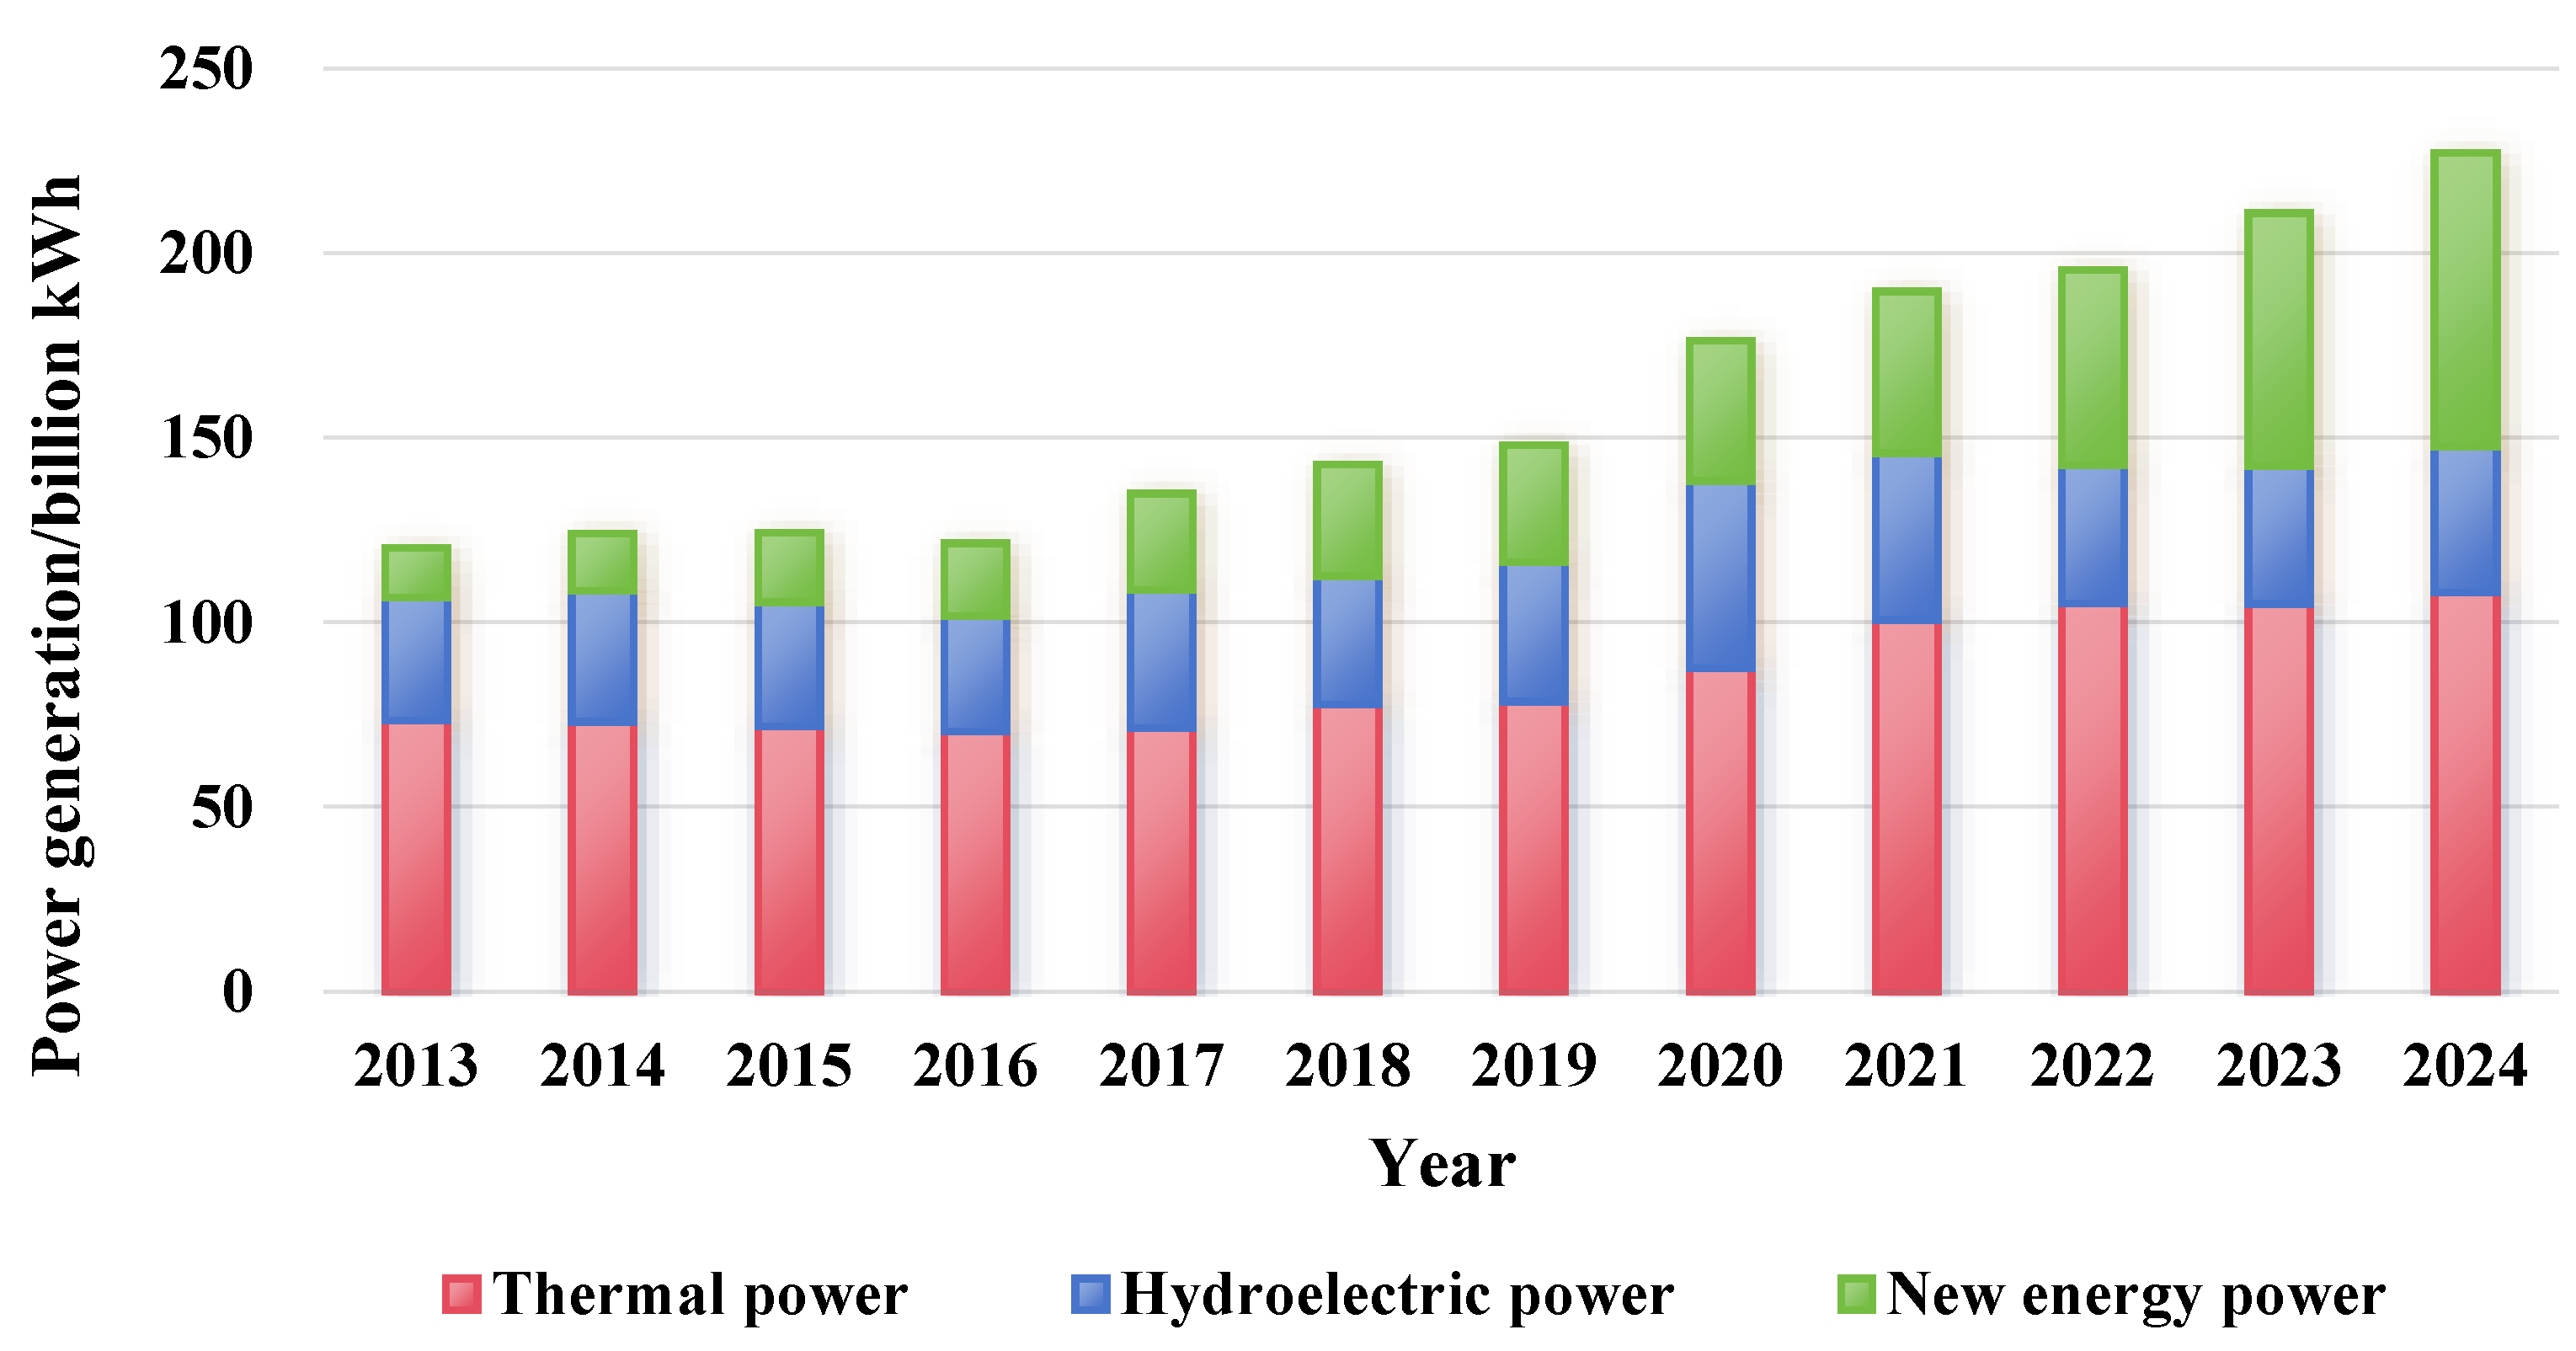
As shown in Figure 7, the cumulative electricity generation in Gansu Province for 2024 is 227.2 billion kWh. The share of wind and solar power generation reached 35.0%, showing a significant increase in renewables generation. However, the installed capacity of renewable sources has already reached 64.1%, with a mismatch between installation and output efficiency. On one hand, this is due to the significant impact of weather conditions on the output of renewables sources (wind and photovoltaic), resulting in notable fluctuations; on the other hand, it is attributed to the lack of system flexibility resources (such as energy storage and inter-regional transmission), leading to high curtailment rates. Through the strategic deployment of energy storage systems and the expansion of transmission corridors, the phenomenon of power curtailment in China has been gradually reduced. By 2024, China’s wind and solar utilization rates reached a record high of 95.9% and 96.8%, respectively [34,35]. However, affected by the surge of installed capacity and the limitation of renewable energy absorption capacity in Gansu Province, the utilization rate of wind power and photovoltaic power generation in Gansu Province in 2024 was 94.0% and 91.3%, respectively [35], and the average value from January to May in 2025 decreased to 91.6% and 88.9%, respectively [36]. The capacity for integrating renewable energy needs improvement. Gansu Province should establish an efficient mechanism for the economic utilization of wind, solar, and photovoltaic (PV) energy: 1. Promote the continuous reduction in costs for wind, solar, and PV energy. 2. Enhance the local integration capacity for wind, solar, and PV energy. Promote the decarbonization of industrial energy consumption, accelerate the electrification of fossil energy, and improve the electrification level. 3. Increase the flexibility of the power system. Accelerate the implementation of flexibility retrofits for existing thermal power units across the province, tap into the peak-shaving potential of thermal power units, and encourage coal-fired units to increase efficient energy storage facilities. Establish a priority dispatching system adapted to the characteristics of wind and solar power. Promote further cost reductions and diversified applications of energy storage, including integrated generation-storage-consumption applications such as wind storage, solar storage, and large-grid storage. Strengthen demand-side management, actively promote energy-efficient power plants, demand response, and energy substitution, and explore the auxiliary role of production and living charging and discharging facilities for electric vehicles in peak shaving [37]. Over the past four years, the installed capacity of hydropower in Gansu Province has remained stable at approximately 9.7 million kW, while the share of hydropower generation has decreased from 28.8% in 2020 to 17.4% in 2024. The proportion of green electricity generation in Gansu Province gradually increases, exceeding 50% since 2023, mainly due to the rapid increase in renewables generation.
The power generation from thermal power plants in Gansu Province for 2024 reached 108.1 billion kWh, still accounting for 47.6% of total power generation, serving as the primary source of electricity production in Gansu Province. In contrast, the installed capacity of thermal power plants accounted for only 26.2%, indicating that the peak-shaving role of thermal power remains a stable support for the power system. Thermal power generation decreased year by year until 2016 and has increased year by year since 2017. Thermal power generation is the main source of atmospheric pollutants and carbon emissions in the power industry. Pollutant emissions from the power industry continued to decline until 2018 and have been increasing slowly since 2019; carbon emissions declined slowly until 2017 and have shown a significant growth trend since 2017 (Figure 5). During the period of “Air Pollution Prevention and Control Action Plan” [38], i.e., 2013–2017, emission reduction in the power industry in Gansu Province benefited from ultra-low emission transformation of coal-fired power plants and elimination of coal-fired units [39]. The technical measures achieved remarkable results during this period. During the “Three-Year Action Plan to Win the Blue Sky Defense War” [40], i.e., 2018–2020, the emission rebound of the power industry is mainly due to the annual growth of thermal power units and thermal power generation. The development of technical measures in this period entered a bottleneck period, and more powerful energy structure reform measures are needed to continue to improve the pollution and carbon reduction effect of the power industry.
The current situation of power supply and demand in Gansu Province presents certain characteristics. As shown in Figure 8 from 2013 to 2024, Gansu Province’s power generation, power consumption, and power exports all showed an upward trend, increasing from 120.2, 107.3, and 12.8 billion kWh to 227.2, 174.6, and 55.9 billion kWh, respectively. In terms of supply and demand structure, there has been a long-term surplus of supply over demand, with a large scale of power exports, indicating that the Gansu Province power system exhibits a surplus in power supply.
From the perspective of power utilization, Gansu Province faces certain challenges in the renewable energy absorption. Figure 8 shows the proportion of annually exported power to total power generation in Gansu Province with a green dashed line. Since 2020, the proportion of exported power has shown a declining trend, indicating that there are difficulties in integrating and absorption of renewable energy in Gansu Province. The wind curtailment rate and solar curtailment rate reached 10% and 15%, respectively [41]. However, power consumption within the province continues to rise, continuously pushing for an increase in power generation.
Overall, the power supply and demand situation in Gansu Province exhibits the following characteristics: First, power generation capacity continues to grow, particularly with rapid growth in renewable energy capacity. Second, the proportion of thermal power generation continues to decline, but thermal power generation is still increasing year by year, it is the main reason for the increase in pollutants and carbon emissions in the power industry in Gansu Province. Third, power exports are significant, making Gansu a key power-exporting province nationwide. Fourth, the integration of renewable energy is facing challenges, and the problem of curtailment of wind and solar power is serious. These characteristics have a significant impact on Gansu Province’s efforts to reduce pollution and carbon emissions and serve as an important basis for formulating the province’s pollution reduction and carbon emission reduction strategies.

3.3. Pollutant and Carbon Emissions Reduction Pathways

The results of overall emission trend analysis in Gansu Province show that the carbon emission of electric power sector in Gansu Province is huge, which is the main source of carbon emission in Gansu Province and the key field for Gansu Province to achieve the goals of carbon peak and carbon neutralization. The main source of carbon emissions is thermal power generation, and with the increasing proportion of renewable energy, the carbon emission intensity in the power sector shows a declining trend. The export of electricity has a significant impact on carbon emissions, and the growth in the export of renewable power contributes to reducing the carbon emission intensity of the province’s power system. However, the difficulties in integrating and absorption of renewables weaken the carbon emission reduction capacity of Gansu’s power system.
The environmental impact of Gansu Province’s power sector is also reflected in the emission of air pollutants. As Gansu Province’s power structure transitions toward a cleaner and lower-carbon direction, the environmental impact of the power sector is decreasing. However, thermal power generation remains dominant, and the task of reducing pollution and carbon emissions in the power sector remains arduous. Therefore, optimizing the power supply and demand structure and increasing the proportion of renewable energy are important measures to reduce the environmental impact of Gansu Province’s power sector.
This study references the DPEC scenario-setting method [29] and documents such as the “Gansu Province 14th Five-Year Energy Development Plan” [37], the “Gansu Province Pollution Reduction and Carbon Emission Reduction Synergistic Efficiency Implementation Plan” [42], and the “Gansu Province 14th Five-Year Comprehensive Energy Conservation and Emission Reduction Work Plan” [43], and based on the analysis of the aforementioned pollution reduction and carbon emission reduction measures, three future emission scenarios were constructed: high-emission scenario, medium-emission scenario, and low-emission scenario. The scenario descriptions are shown in Table 2.
Furthermore, a more detailed policy timeline can provide clear guidance for the power industry. The low-carbon transition strategies and core policy objectives involved among the scenarios are shown in Table 3.
Moreover, to evaluate the uncertainty in energy transformation in Gansu Province more comprehensively, we perturbed a series of parameters such as renewable energy cost and thermal power control time and set up eight supplementary scenarios (Table 4). In the medium- and low-emission scenarios, renewable energy cost reductions are gradually reduced from 6% to 4%, and thermal power control progress is postponed to 2030 to capture uncertainties in both measures.
This study calibrates the GCAM-China by comparing and validating historical data with predicted data on renewable energy generation and CO2 emissions, confirming the accuracy of the model prediction results. The calibration results are shown in Table 5. The power generation data used for calibration are from the Statistical Yearbook of Gansu Province. We have adjusted the renewable energy cost data in the GCAM-China system to adapt to the preference weights of different power generation technologies in the power sector in the future to ensure that the proportion of other energy sources and statistical data remain relatively stable. The calibration accuracy of CO2 emission was verified by comparing the model results with emission inventory data of Gansu Province.
Using the GCAM-China, we predict the energy supply behavior of Gansu Province under different scenarios, as shown in Figure 9 and Figure 10. To achieve the 2030 carbon peak target or the 2025 early carbon peak target, the installed capacity of thermal power generation in Gansu Province will continue to decrease between 2025 and 2040. The reduction in the low-emission scenario remains the largest, decreasing to 18.7 million kW by 2040. Hydropower installed capacity will significantly decrease between 2025 and 2030. After 2030, due to the improvement of battery energy storage and pumped storage capacity, problems such as hydropower generation efficiency, power stability, and system flexibility will be solved to a certain extent. As a result, the installed capacity of hydropower will gradually recover after 2030 to support strengthened low-carbon transition policies. Gansu Province ranks among the top in China in terms of wind and solar energy resources, offering unique advantages for the development of wind and solar power generation. This is an important pathway for Gansu Province to enhance its carbon reduction and pollution control levels. Between 2025 and 2040, Gansu Province’s renewables installed capacity will continue to rise significantly. By 2040, wind power installed capacity will increase to more than double its current level, and solar power installed capacity will increase to more than triple its current level, far exceeding thermal power generation.
Between 2025 and 2040, the predicted power generation structure under various emission scenarios in Gansu Province are shown in Figure 10. The low-emission scenario has the largest decrease in thermal power generation and the largest increase in renewables power generation, corresponding to the installed capacity prediction results. In the low-emission scenario, Gansu Province has the largest power generation capacity, with power generation reaching 372.5 billion kWh in 2040.
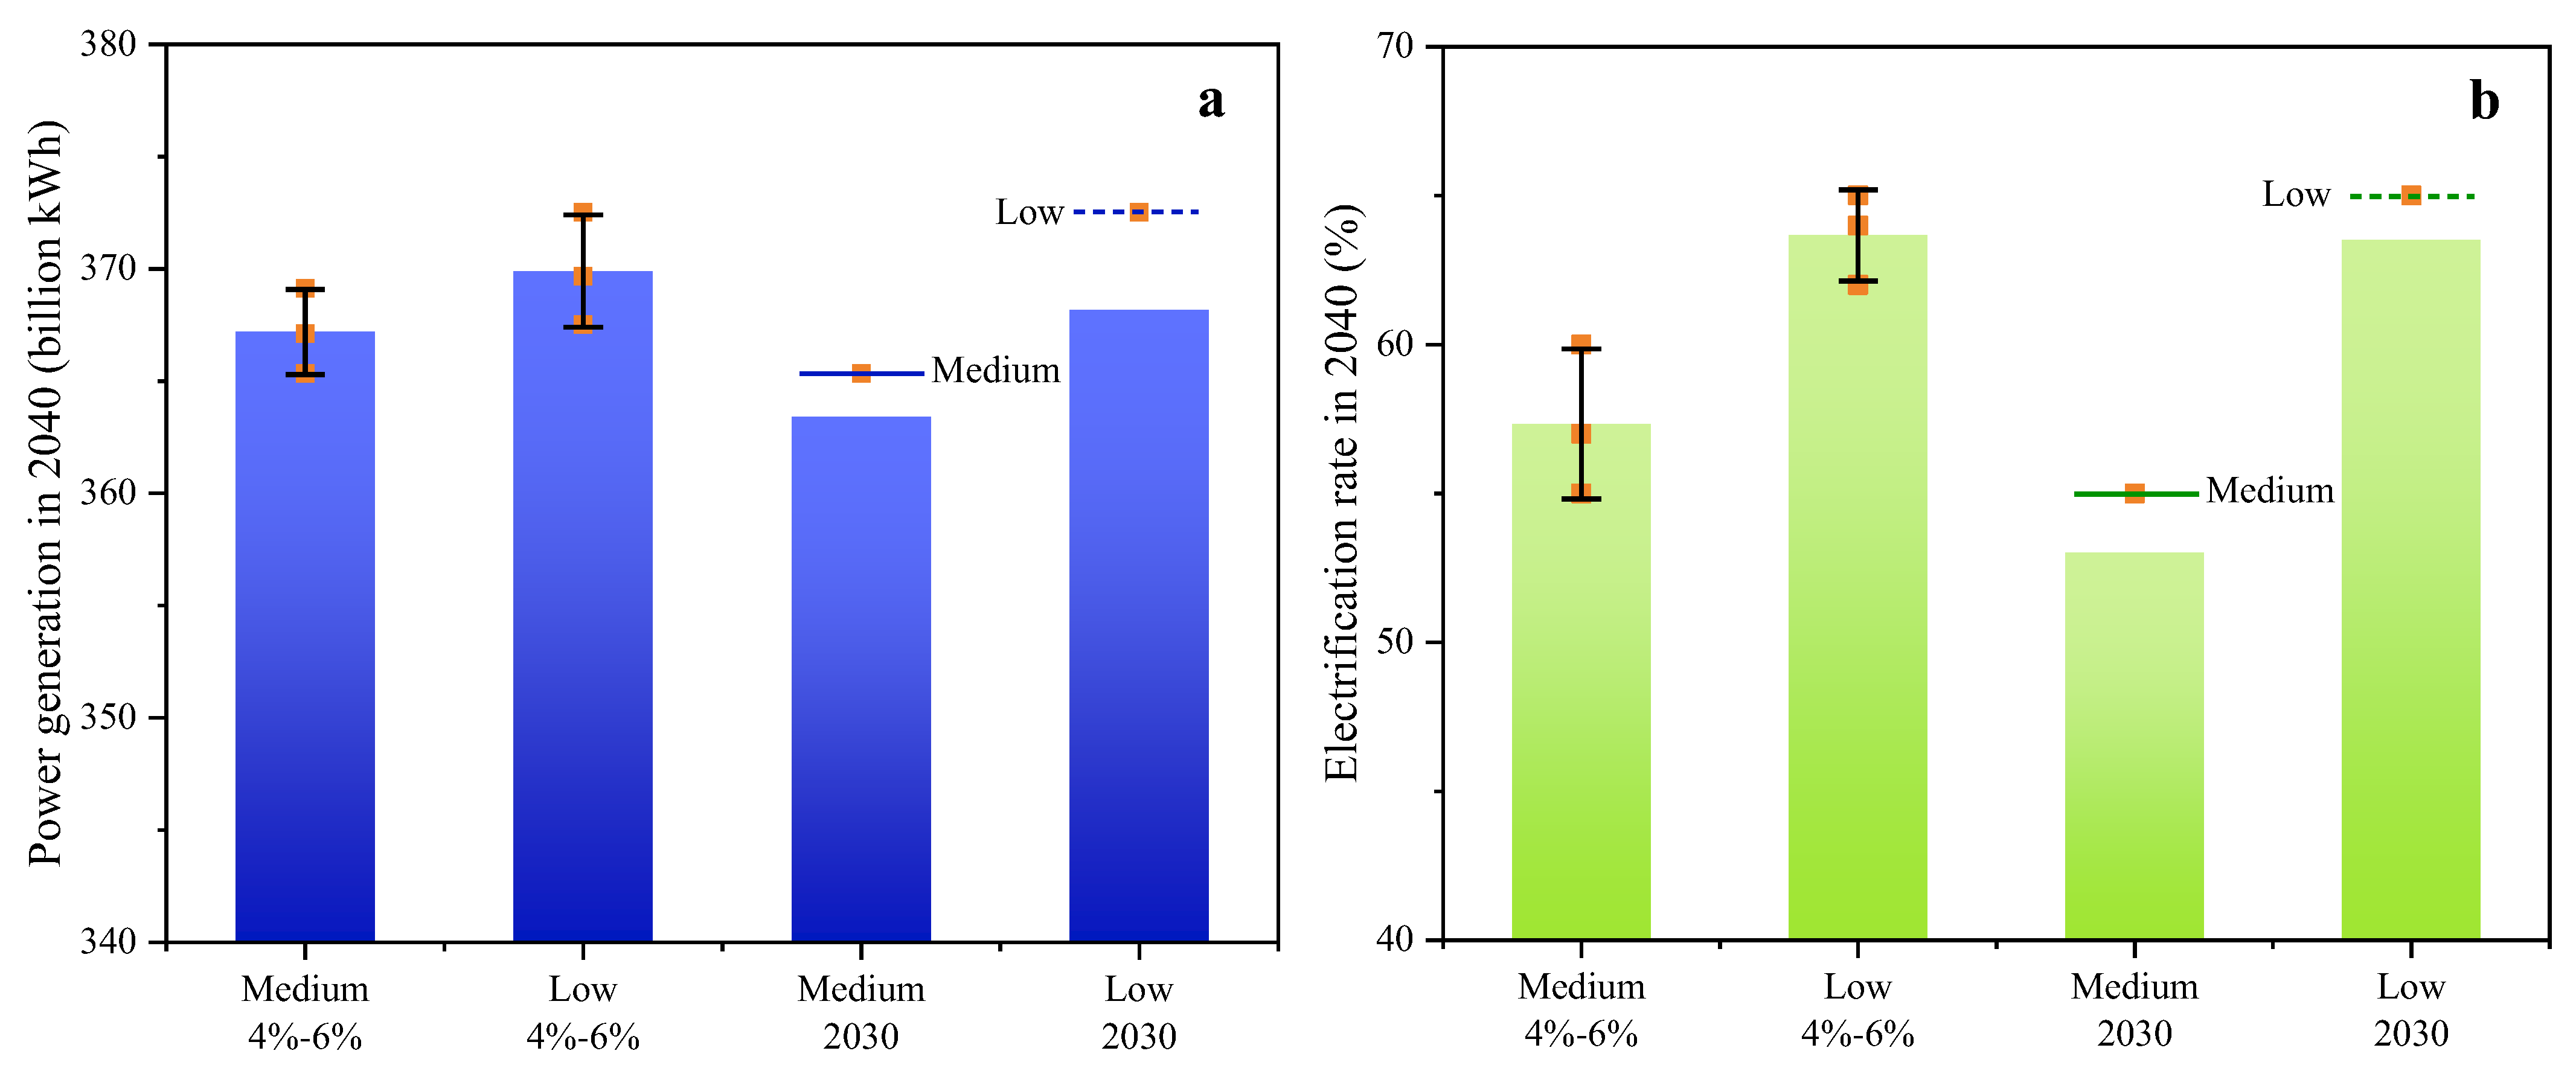
The uncertainty analysis results of energy transformation in Gansu Province are shown in Figure 11. In the medium- and low-emission scenarios, renewable energy cost reductions are gradually reduced from 6% to 4%, and thermal power control is postponed to 2030. Uncertainty analysis shows that there is a risk of declining electricity production by 2040, whether by reducing renewable energy supply or delaying the coal ban. If the cost reduction in renewable energy decreases from 6% to 4%, the electrification rate will decrease by 3–5%. Delaying the control time of thermal power to 2030 will postpone the electrification process to 2040.
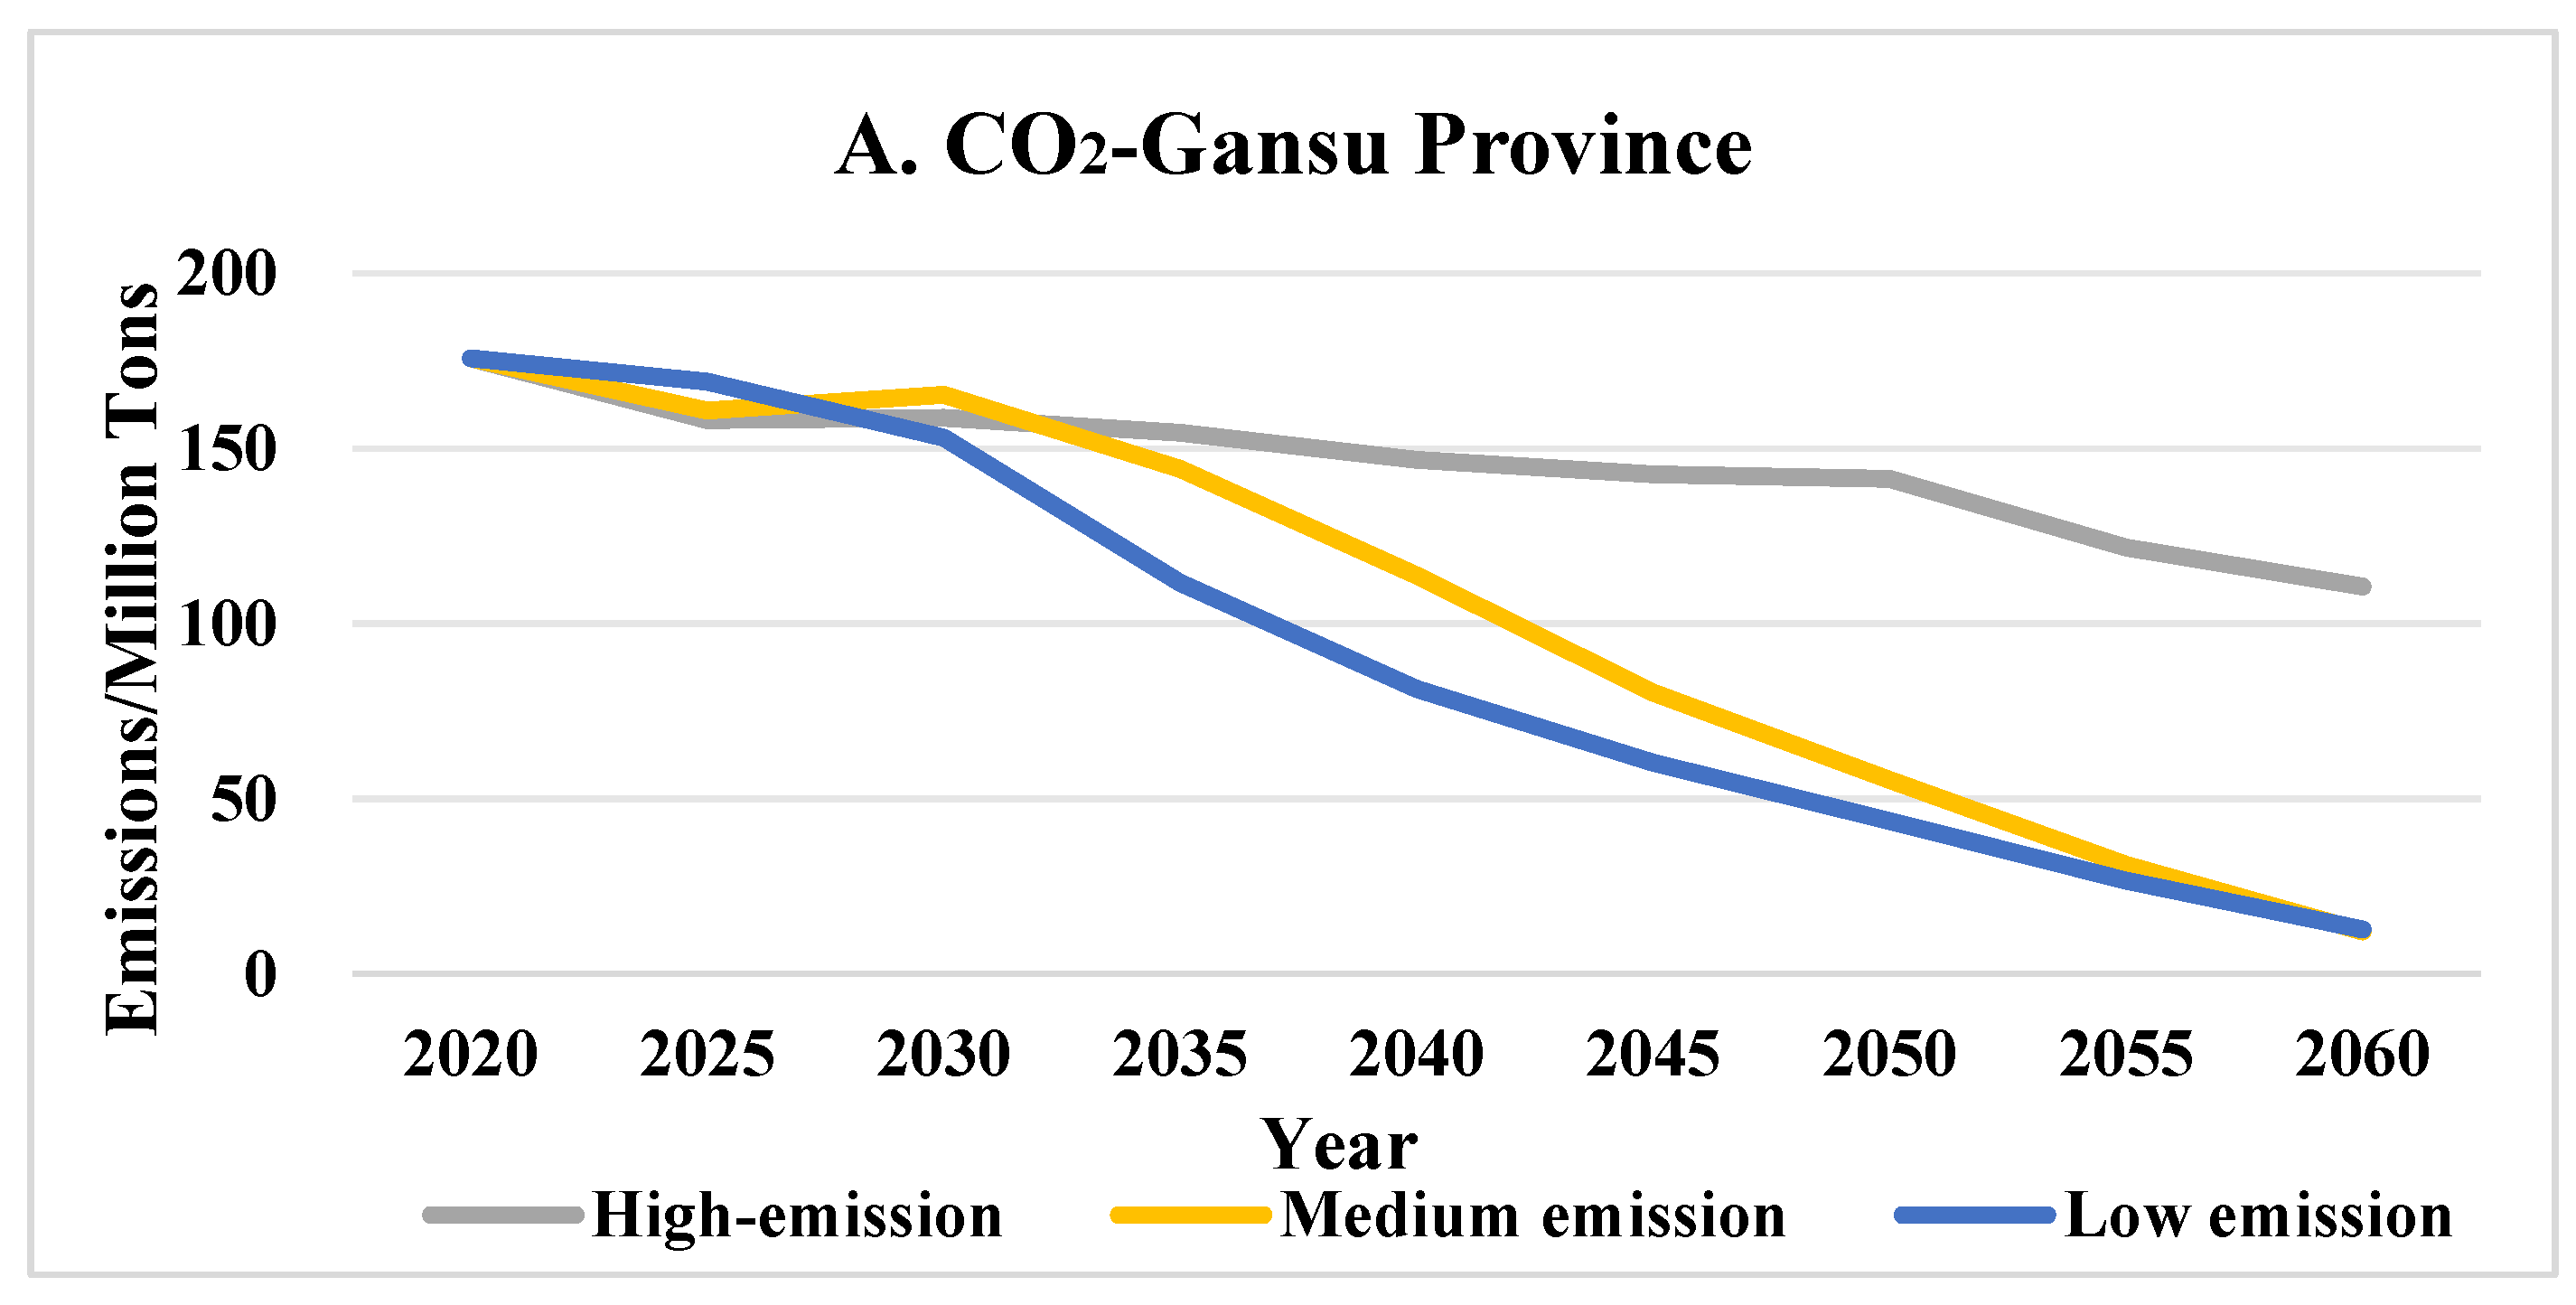
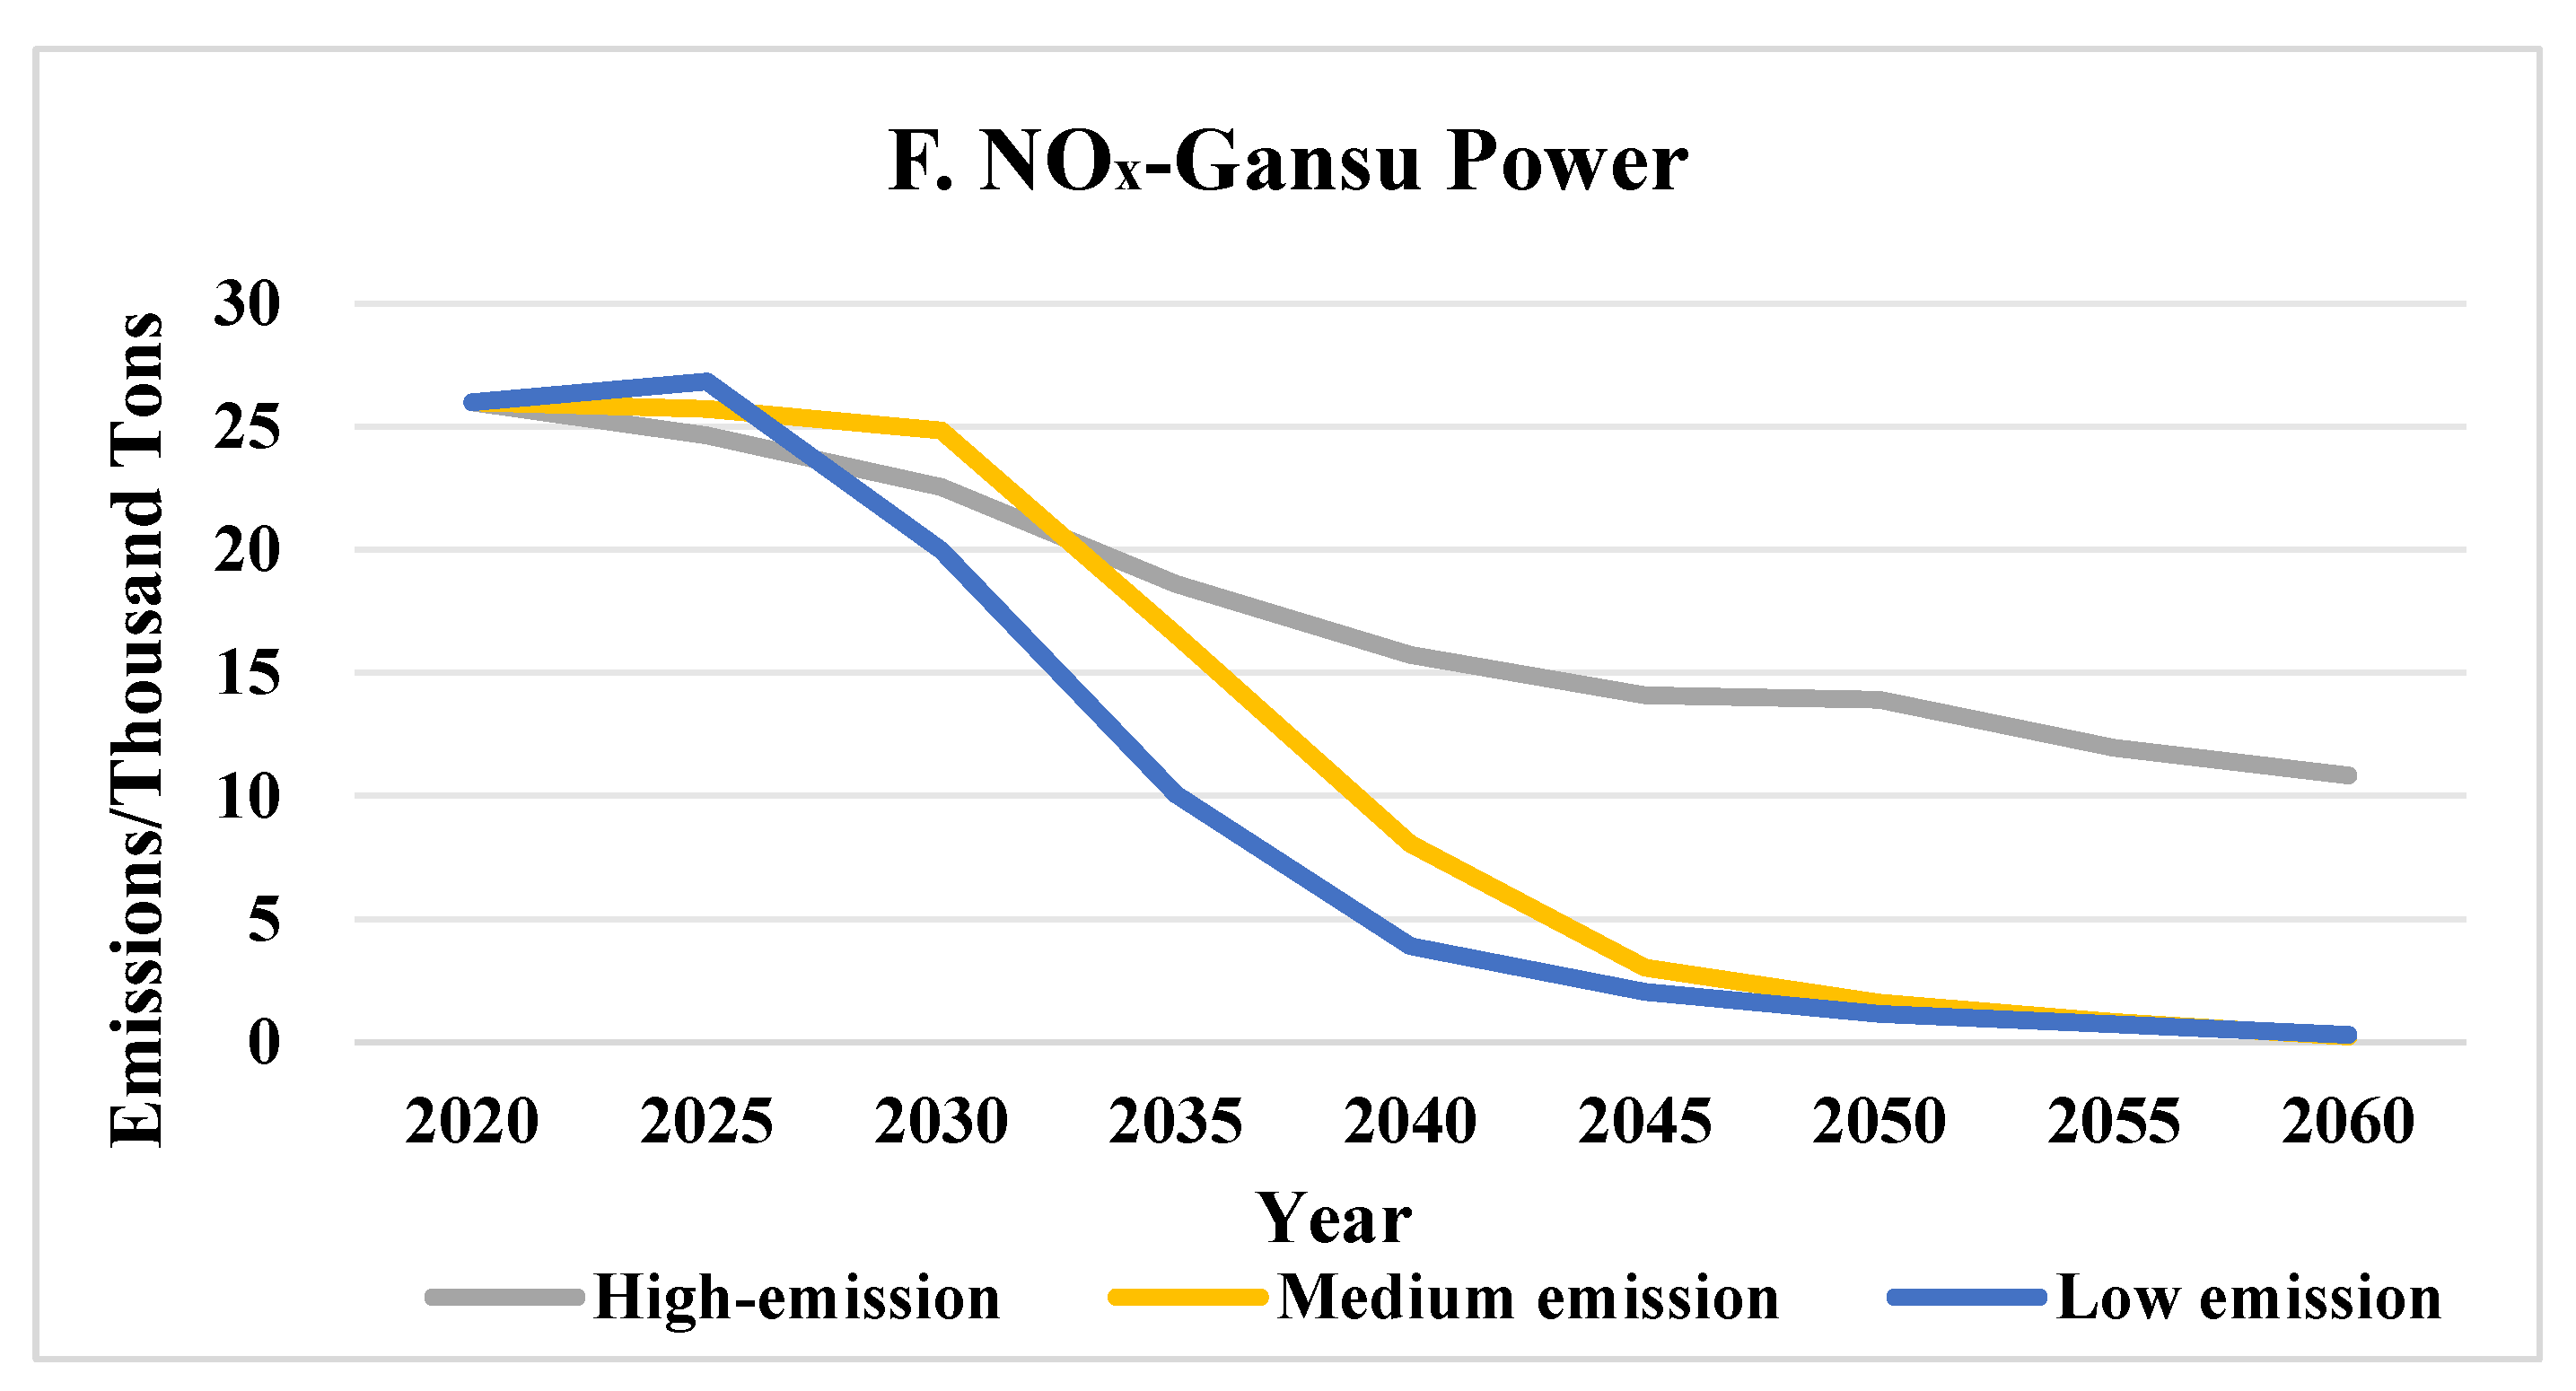
Based on DPEC v1.2 emission data, the future emission trends under various emission scenarios in Gansu Province and the changes in emissions from the power sector in Gansu Province are analyzed and predicted, as shown in Figure 12. All three scenarios implement optimal end-of-pipe pollution control measures between 2020 and 2060. However, the high-emission scenario does not have additional climate targets after 2030 to promote the low-carbon transition. After 2035, the pollutant reduction in the high-emission scenario is far lower than the other two scenarios, and it consistently fails to achieve carbon neutrality goals. This is because long-term and medium-term pollution control must be implemented in conjunction with energy conservation, carbon reduction, and clean energy initiatives, highlighting the necessity of synergistic pollution reduction and carbon reduction governance [44,45,46,47].
The low-emission scenario aims to achieve carbon peaking around 2025 and will vigorously implement carbon reduction measures in the short term. However, due to the mismatch in carbon reduction capabilities between upstream and downstream industries in the industrial chain (e.g., the high energy consumption of photovoltaic panel manufacturing cannot be resolved in the short term), the final carbon reduction effect of the measures may be less than ideal, and short-term carbon reduction may temporarily fall below that of the high-emission scenario and medium-emission scenario. However, the medium-term and long-term effects of pollution reduction and carbon emission reduction in the low-emission scenario are significantly better than those in the medium-emission scenario: the carbon neutrality goal and the near-zero pollutant emission goal of the power sector can be achieved earlier, before 2060; by 2060, the provincial carbon emissions will be 92.8% lower than in 2020, SO2 emissions will be 93.9% lower, and NOx emissions will be 92.3% lower.
In the low-emission scenario, from 2025 to 2040, the province’s carbon emissions will decrease by 51.9%, power sector carbon emissions will decrease by 68.6%, provincial SO2 emissions will decrease by 64.9%, power sector SO2 emissions will decrease by 87.7%, provincial NOx emissions will decrease by 60.2%, and power sector NOx emissions will decrease by 85.5%. According to Duan W. et al., under the coal power retirement scenario, the carbon emissions of the Inner Mongolia power industry in 2050 will decrease by 66.7% compared with 2026 (peak year). Inner Mongolia’s CO2 emissions will peak in 2033, and by 2050 carbon emissions will fall by only 4.6% from peak levels. Under the carbon pricing scenario, although Inner Mongolia Autonomous Region has achieved the carbon peak target by 2030, the power generation fluctuates violently. Compared with 2019, the total power generation in Inner Mongolia will drop by 28.5% in 2028, hitting a record low, which is not conducive to the stable economic development of Inner Mongolia and even China [48]. It shows that the huge potential of carbon emission reduction in Inner Mongolia comes from the huge traditional thermal power installed capacity. Gansu Province, on the other hand, can leverage its inherent energy advantages to develop renewable energy on a large scale, while also laying a solid foundation for the electrification of industrial sectors and the introduction of carbon pricing mechanisms.
Compared with the high-emission scenario, the carbon emission reduction measures based on increasing the proportion of renewable energy in the medium- and low-emission scenarios are better than those in Gansu Province in terms of pollution reduction and carbon reduction in the power industry. It shows that the role of power demand-side management in optimizing the balance between power supply and demand and reducing environmental impact cannot be ignored. In the future emission scenario, Gansu Province will improve the flexibility of the power system and promote the consumption of renewable energy by developing energy storage technology, optimizing grid dispatching, and strengthening inter-provincial mutual assistance, continuously promoting the electrification of terminal energy use. Compared with the medium-emission scenario, the lower renewable energy production cost, energy dispatching cost, and energy storage cost in the low-emission scenario are more conducive to the replacement of electricity from the end energy source, especially for the increase in electrification rate in the industrial sector. Under both scenarios, the share of electricity in industrial energy use will rise from 26% in 2020 to 55% and 65% in 2040, respectively. As shown in Figure 12, in the low-emission scenario, the reduction rates of CO2 and atmospheric pollutants across Gansu Province are higher than those in the medium-emission scenario, with the application of clean technologies on both the supply and demand sides significantly promoting the substitution of traditional fossil fuels.

4. Conclusions

This study reveals severe challenges facing Gansu Province’s power sector: pollutant and carbon emissions continued to rise from 2022 to 2023, with CO2 emissions surging by 22.0% compared to a decade ago. The core issue lies in the counterintuitive increase in thermal power generation—the dominant source of electricity (and primary contributor to pollution and carbon emissions). Despite renewable energy capacity reaching nearly 64.1% (by 2024), establishing a solid foundation for low-carbon transition, its inherent intermittency has led to high curtailment rates and mismatched output efficiency. This forces thermal power to shoulder critical peak-shaving responsibilities, becoming the primary driver of emissions growth. The study constructs a low-emission scenario projection: by significantly increasing the share of renewable energy in the short term (2025–2040)—doubling or tripling installed capacity to generate 148.6 billion kWh—Gansu Province can achieve carbon neutrality and near-zero pollution emissions in the power sector by 2060. Under this scenario, by 2040, provincial carbon emissions would decrease by 51.9% and pollutant emissions by over 60.2%. The power sector’s carbon emissions would drop by 68.6% and pollutant emissions by over 85.5%, significantly enhancing synergistic pollution reduction and carbon mitigation benefits. Concurrently, lower renewable energy costs would propel industrial electrification rates from 26% in 2020 to 65% by 2040.
This study provides the first in-depth analysis and quantification of the evolution of “non-synergistic and negative synergistic” effects in pollution reduction and carbon emission reduction within Gansu Province’s power sector over the past decade, along with their driving role in overall emission growth. It offers a key mechanism explanation for regional challenges in achieving both pollution reduction and carbon emission reduction. The high-resolution, actionable “low-emission scenario” constructed proposes a concrete, quantifiable, and time-bound (2025–2040) pathway for low-emission transformation. It clearly outlines the scale of new energy installations, power generation targets, and the resulting substantial emission reduction potential (a 92.8% decrease in provincial carbon emissions by 2060) and enhanced synergistic benefits (a 93.9% reduction in SO2 emissions and a 92.3% reduction in NOx emissions). This provides robust scientific evidence and a clear target orientation for policy formulation. Positioning enhanced power system flexibility (energy storage, dispatch, mutual support) as the core solution to overcome renewable energy integration bottlenecks and unlock emission reduction potential, the study quantitatively forecasts the positive impact of reduced renewable energy production, dispatch, and storage costs under the low-emission scenario on boosting industrial electrification rates (to 65%).
To accelerate the achievement of low-emission scenario targets, Gansu Province should implement the following phased, targeted policy measures: Short-term (2025–2030): Remove consumption bottlenecks and solidify the foundation for transformation. Mandate that new renewable energy projects include energy storage facilities and pumped-storage hydropower plants with capacities of at least 15–20% of the installed capacity. Introduce policies such as widening peak-off-peak electricity price differentials and capacity compensation payments to incentivize flexibility upgrades for thermal power units, reducing their minimum output to below 30%. Fully advance the construction and expansion of ultra-high-voltage direct current (UHV DC) transmission lines to enhance power export capacity. Improve cross-provincial and cross-regional ancillary service market mechanisms to optimize the allocation of peak-shaving resources across broader areas. Mid-term (2030–2040): Deepen structural transformation and unlock synergistic benefits. Continuously expand wind and solar power bases while ensuring grid integration capacity, prioritizing distributed photovoltaic and decentralized wind power development. Research and introduce a “coal-fired power phase-out timeline” as appropriate, systematically decommissioning inefficient, high-emission small thermal units based on unit lifespan and flexible retrofitting outcomes, while strictly controlling new coal-fired power additions. Develop specialized subsidies and tax incentives for electrification upgrades in high-energy-consuming industries. Explore linkage mechanisms between green power trading and carbon markets to reduce enterprises’ green power usage costs. Long-term (2040–2060): Advance towards net-zero emissions and strengthen system resilience. Achieve the orderly phase-out or transformation of coal-fired power generation. Establish a power supply system dominated by renewable energy, supplemented by cross-regional mutual support, and fully develop a new power system featuring highly integrated “Source–Grid–Load–Storage”. Fully apply artificial intelligence and digital twin technologies across the entire power system planning, operation, and maintenance chain to achieve self-healing, adaptive, and high-efficiency management. Establish a real-time carbon footprint monitoring and traceability platform covering the entire society. Deeply integrate into the national energy internet construction, promote user-side resource aggregation models such as “virtual power plants” and “demand-side response,” and maximize system flexibility.
Future Outlook: Gansu Province should seize the strategic opportunities presented by the “dual carbon” goals, using the “non-synergy and negative synergy” issues revealed in this study and the proposed low-emission pathways as core action guidelines. By implementing the aforementioned policy mix, the province can focus on resolving the challenge of new energy integration, accelerating the deep transformation of its energy structure and significantly enhancing system flexibility and intelligence. This approach will not only effectively reverse the current trend of rising emissions, achieve synergistic pollution reduction and carbon mitigation across the power sector and the entire province. Moreover, it will provide valuable “Gansu experience” for exploring deep decarbonization pathways under high-penetration renewable energy systems nationwide, contribute crucial momentum to the national carbon neutrality goal, and lay a solid foundation of clean, reliable, and economical power for sustainable economic and social development.

Author Contributions

Conceptualization, Y.B. and P.J.; methodology, R.Z. and Y.B.; software, R.Z.; validation, R.Z. and H.B.; formal analysis, H.B. and C.X.; investigation, S.L.; resources, P.J. and Y.B.; data curation, R.Z.; writing—original draft preparation P.J. and R.Z.; writing—review and editing, H.B. and Y.B.; visualization, S.L. and C.X.; supervision, Y.B.; project administration, P.J.; funding acquisition, P.J. All authors have read and agreed to the published version of the manuscript.

Funding

This research was funded by the Science and Technology Project of the Big Data Center of State Grid Corporation of China, “Research on the Benefits of ‘Electricity–Energy–Carbon–Pollution’ Synergistic Governance Based on the Integration of Multi-source Data” (Contract No. SGSJ0000NYJS2400048).

Institutional Review Board Statement

Not applicable.

Informed Consent Statement

Not applicable.

Data Availability Statement

The sources of the data used for this research are provided in Section 2.

Conflicts of Interest

Authors Peng Jiang, Haotian Bai and Shanshan Liu were employed by the company Big Data Center of State Grid Corporation of China. The remaining authors declare that the research was conducted in the absence of any commercial or financial relationships that could be construed as a potential conflict of interest.

References

  1. The Total Installed Capacity of New Energy in Gansu Exceeded 64 Million Kilowatts. Available online: https://www.gs.gov.cn/gsszf/c100002/c100006/c100007/202501/174056246.shtml (accessed on 1 April 2025).
  2. Shi, W.; Tang, W.W.; Qiao, F.W.; Sha, Z.Q.; Wang, C.Y.; Zhao, S.X. How to Reduce Carbon Dioxide Emissions from Power Systems in Gansu Province-Analyze from the Life Cycle Perspective. Energies 2022, 15, 3560. [Google Scholar] [CrossRef]
  3. Qiao, F.W.; Yang, Q.Z.; Shi, W.; Yang, X.D.; Ouyang, G.W.; Zhao, L.L. Research on driving mechanism and prediction of electric power carbon emission in Gansu Province under dual-carbon target. Sci. Rep. 2024, 14, 6103. [Google Scholar] [CrossRef] [PubMed]
  4. Tang, W.; Ren, K. Analysis of carbon emission status in Gansu Province and suggestions on electric power transformation under the goal of “dual carbon”. E3S Web Conf. 2023, 466, 5. [Google Scholar] [CrossRef]
  5. Li, X.J.; Qian, J.X.; Yang, C.H.; Chen, B.Y.; Wang, X.; Jiang, Z.N.; Bak, C.L. New Power System Planning and Evolution Path with Multi-Flexibility Resource Coordination. Energies 2024, 17, 273. [Google Scholar] [CrossRef]
  6. Wang, K.Y.; Wang, X.Y.; Jia, R.; Dang, J.; Liang, Y.; Du, H.D. Research on Coupled Cooperative Operation of Medium- and Long-Term and Spot Electricity Transaction for Multi-Energy System: A Case Study in China. Sustainability 2022, 14, 10473. [Google Scholar] [CrossRef]
  7. Chen, X.H.; Tang, R.C.; Hu, D.B.; Xu, X.S.; Tang, X.B.; Yi, G.D.; Zhang, W.W. Path and strategy of pollution and carbon reduction by digitization in electric power enterprises. Bull. Chin. Acad. Sci. 2024, 39, 298–310. [Google Scholar] [CrossRef]
  8. Jia, L.P.; Zhang, G.Y.; Chai, Y.E.; Han, J.L. Analysis and Development Plan of the Current Situation of Gansu’s New Energy Industry Based on the “Dual Carbon” Goal. J. Green Sci. Technol. 2024, 26, 219–224+233. [Google Scholar] [CrossRef]
  9. Ma, Y.; Chu, X.D. Optimizing Low-Carbon Pathway of China’s Power Supply Structure Using Model Predictive Control. Energies 2022, 15, 4450. [Google Scholar] [CrossRef]
  10. Zhang, S.; Chen, W.; Zhang, Q.; Krey, V.; Byers, E.; Rafaj, P.; Nguyen, B.; Awais, M.; Riahi, K. Targeting net-zero emissions while advancing other sustainable development goals in China. Nat. Sustain. 2024, 7, 1107–1119. [Google Scholar] [CrossRef]
  11. Bistline, J.E.T. Roadmaps to net-zero emissions systems: Emerging insights and modeling challenges. Joule 2021, 5, 2551–2563. [Google Scholar] [CrossRef]
  12. Pye, S.; Li, F.G.N.; Price, J.; Fais, B. Achieving net-zero emissions through the reframing of UK national targets in the post-Paris Agreement era. Nat. Energy 2017, 2, 17024. [Google Scholar] [CrossRef]
  13. Duan, M.; Duan, Y. Prediction of Energy Consumption and Carbon Dioxide Emissions in Gansu Province of China under the Background of “Double Carbon”. Energies 2024, 17, 4842. [Google Scholar] [CrossRef]
  14. Jiang, P.; Khishgee, S.; Alimujiang, A.; Dong, H. Cost-effective Approaches for Reducing Carbon and Air Pollution Emissions in the Power Industry in China. J. Environ. Manag. 2020, 264, 110452. [Google Scholar] [CrossRef] [PubMed]
  15. Zhao, H.; Ma, W.; Dong, H.; Jiang, P. Analysis of Co-Effects on Air Pollutants and CO2 Emissions Generated by End-of-Pipe Measures of Pollution Control in China’s Coal-Fired Power Plants. Sustainability 2017, 9, 499. [Google Scholar] [CrossRef]
  16. Jiang, P.; Alimujiang, A.; Dong, H.; Yan, X. Detecting and Understanding Synergies and Co-Benefits of Low Carbon Development in the Electric Power Industry in China. Sustainability 2020, 12, 297. [Google Scholar] [CrossRef]
  17. Xing, X.W.; Huang, L.; Hu, J.L. Synergistic Emission Reduction of Carbon Dioxide and Atmospheric Pollutants Under Different Low-carbon Development Scenarios of the Power Industry in Jiangsu Province. Environ. Sci. 2024, 45, 6326–6335. [Google Scholar] [CrossRef]
  18. Wu, X.P.; Qiu, W.H. Analysis of the Synergistic Effects of Energy Consumption Permit Trading Scheme on Pollution Reduction and Carbon Abatement. Environ. Sci. 2024, 45, 4627–4635. [Google Scholar] [CrossRef]
  19. Ali, B.; Gamil, A. Scenario-Based Optimization towards Sustainable Power Generation in Sudan. Sustainability 2023, 15, 14954. [Google Scholar] [CrossRef]
  20. Zhuang, Y.; Cheng, L.; Qi, N.; Almassalkhi, M.R.; Liu, F. Problem-Driven Scenario Reduction Framework for Power System Stochastic Operation. IEEE Trans. Power Syst. 2024, 40, 3232–3246. [Google Scholar] [CrossRef]
  21. Wang, W.; Tang, Q.; Gao, B. Exploration of CO2 emission reduction pathways: Identification of influencing factors of CO2 emission and CO2 emission reduction potential of power industry. Clean Technol. Environ. Policy 2023, 25, 1589–1603. [Google Scholar] [CrossRef]
  22. Yang, J.W.; Zhang, N.; Wang, Y.; Kang, C.Q. Multi-energy System Towards Renewable Energy Accommodation: Review and Prospect. Autom. Electr. Power Syst. 2018, 42, 11–24. [Google Scholar] [CrossRef]
  23. Wang, Z.; Mae, M.; Nishimura, S.; Matsuhashi, R. Vehicular Fuel Consumption and CO2 Emission Estimation Model Integrating Novel Driving Behavior Data Using Machine Learning. Energies 2024, 17, 1410. [Google Scholar] [CrossRef]
  24. Peng, K.; Feng, K.; Chen, B.; Shan, Y.; Zhang, N.; Wang, P.; Fang, K.; Bai, Y.; Zou, X.; Wei, W.; et al. The global power sector’s low-carbon transition may enhance sustainable development goal achievement. Nat. Commun. 2023, 14, 3144. [Google Scholar] [CrossRef]
  25. Binsted, M.; Suchyta, H.; Zhang, Y.; Vimmerstedt, L.; Mowers, M.; Ledna, C.; Muratori, M.; Harris, C. Renewable Energy and Efficiency Technologies in Scenarios of U.S. Decarbonization in Two Types of Models: Comparison of GCAM Modeling and Sector-Specific Modeling; Technical Report; Pacific Northwest National Laboratory: Richland, WA, USA, 2022. [Google Scholar]
  26. Notice on the Issuance of the Technical Guidelines for the Compilation of Integrated Emission Inventories of Air Pollutants and Greenhouse Gases (Trial Version). Available online: https://www.mee.gov.cn/xxgk2018/xxgk/xxgk06/202401/t20240130_1065242.html (accessed on 12 April 2025).
  27. GCAM-China. Available online: https://umd-cgs.github.io/metarepo_gcam-china/index.html (accessed on 15 April 2025).
  28. MEIC Model. Available online: http://meicmodel.org.cn/#firstPage (accessed on 16 April 2025).
  29. Cheng, J.; Tong, D.; Zhang, Q.; Liu, Y.; Lei, Y.; Yan, G.; Yan, L.; Yu, S.; Cui, R.Y.; Clarke, L.; et al. Pathways of China’s PM2.5 air quality 2015-2060 in the context of carbon neutrality. Natl. Sci. Rev. 2021, 8, nwab078. [Google Scholar] [CrossRef] [PubMed]
  30. Cheng, J.; Tong, D.; Liu, Y.; Geng, G.N.; Davis, S.J.; He, K.B.; Zhang, Q. A synergistic approach to air pollution control and carbon neutrality in China can avoid millions of premature deaths annually by 2060. One Earth 2023, 6, 978–989. [Google Scholar] [CrossRef]
  31. Shi, X.H.; Huang, Z.N.; Dai, Y.T.; Du, W.Y.; Cheng, J.P. Evaluating emission reduction potential and co-benefits of CO2 and air pollutants from mobile sources: A case study in Shanghai, China. Resour. Conserv. Recycl. 2024, 202, 107347. [Google Scholar] [CrossRef]
  32. Jiang, J.J.; Ye, B.; Shao, S.; Zhou, N.; Wang, D.S.; Zeng, Z.Z.; Liu, J.G. Two-Tier Synergic Governance of Greenhouse Gas Emissions and Air Pollution in China’s Megacity, Shenzhen: Impact Evaluation and Policy Implication. Environ. Sci. Technol. 2021, 55, 7225–7236. [Google Scholar] [CrossRef]
  33. Jia, W.L.; Li, L.; Zhu, L.; Lei, Y.L.; Wu, S.M.; Dong, Z.Y. The synergistic effects of PM2.5 and CO2 from China’s energy consumption. Sci. Total Environ. 2024, 908, 168121. [Google Scholar] [CrossRef]
  34. NEA. 2024 Renewable Energy Grid Integration and Operation Report. Available online: https://www.nea.gov.cn/20250221/e10f363cabe3458aaf78ba4558970054/c.html (accessed on 10 July 2025).
  35. National Renewable Energy Grid Connection and Utilization Situation in 2024. Available online: https://mp.weixin.qq.com/s/2SJA4s8afIDoe0g3AWSuNw (accessed on 17 July 2025).
  36. National Renewable Energy Grid Connection and Utilization Situation in May 2025. Available online: https://mp.weixin.qq.com/s/4zuSwT2V7TM1NCZSTpbkig (accessed on 17 July 2025).
  37. Gansu Provincial People’s Government General Office on the Issuance of Gansu Province “14th Five-Year” Energy Development Plan Notice. Available online: https://www.gansu.gov.cn/gsszf/c100055/202201/1947911.shtml (accessed on 21 April 2025).
  38. Notice of the State Council on Issuing the Action Plan for Air Pollution Prevention and Control. Available online: https://www.gov.cn/zwgk/2013-09/12/content_2486773.htm (accessed on 5 May 2025).
  39. Sun, S.D.; Zhang, G.G.; Sun, L.N.; Xu, C.X.; Guo, M.J.; Cui, Z.Q.; He, X.J.; Li, F.B.; Song, Z.Q.; Bo, Y. Synergistic Benefits of Pollution and Carbon Reduction from Air Pollution Control in Hebei Province from 2013 to 2020. Environ. Sci. 2023, 44, 5431–5442. [Google Scholar] [CrossRef]
  40. Notice of the State Council on Issuing the Three-Year Action Plan for Winning the Blue Sky Protection Battle. Available online: https://www.gov.cn/zhengce/content/2018-07/03/content_5303158.htm (accessed on 5 May 2025).
  41. Energy Resources-Resource Merchants Mapping. Available online: https://swt.gansu.gov.cn/swt/c118502/202405/173923871.shtml (accessed on 3 April 2025).
  42. Notice on the Issuance of the Implementation Program of Gansu Province on Pollution Reduction, Carbon Reduction and Synergies. Available online: https://sthj.gansu.gov.cn/sthj/c113012/202306/173768035.shtml (accessed on 18 April 2025).
  43. Gansu Provincial People’s Government on the Issuance of Gansu Province “14th Five-Year” Energy Saving and Emission Reduction Comprehensive Work Program Notice. Available online: https://mail.bypc.gov.cn/sjhj/fdzdgknr/lzyj/zcfg/art/2023/art_94fb9dfec5fe4f5d9fea953dccd75c21.html (accessed on 18 April 2025).
  44. Zhao, X.N.; Guo, L.; Gao, Z.Y.; Hao, Y. Estimation and Analysis of Carbon Emission Efficiency in Chinese Industry and Its Influencing Factors-Evidence from the Micro Level. Energies 2024, 17, 917. [Google Scholar] [CrossRef]
  45. Yang, X.Y.; Lin, H.X.; Yang, X.H.; Cai, Z.Y.; Jiang, P. Analyzing synergies and efficiency of reducing CO2 and air pollutants in the case of China’s three-year action plan to fight air pollution. Environ. Res. Lett. 2023, 18, acfd44. [Google Scholar] [CrossRef]
  46. Sharma, A. Current Trends and Future Directions in Renewable Energy Systems. Int. J. Res. Publ. Semin. 2024, 15, 186–198. [Google Scholar] [CrossRef]
  47. Li, H.; Zhou, M.; Shi, X. The Study on the impact of clean energy development on green economy. Highlights Bus. Econ. Manag. 2023, 5, 515–521. [Google Scholar] [CrossRef]
  48. Duan, W.; Lin, G.; Xu, D. Can Inner Mongolia Learn from Zhejiang’s Low-Carbon Policy?—Comparative Analysis Based on the EPS Model. Atmosphere 2023, 14, 169. [Google Scholar] [CrossRef]
Figure 1. Methodology framework for future energy and emissions forecasting.
Processes 13 03521 g001
Figure 2. Dynamic Projection model for Emission in China (DPEC).
Processes 13 03521 g002
Figure 3. Changes in anthropogenic emissions in Gansu Province from 2013 to 2023.
Processes 13 03521 g003
Figure 4. CO2 emissions in Gansu Province by sector from 2013 to 2023.
Processes 13 03521 g004
Figure 5. Air pollutants and CO2 emissions from major emission sectors in Gansu Province from 2013 to 2023.
Processes 13 03521 g005
Figure 6. Installed power generation capacity in Gansu Province from 2018 to 2024.
Processes 13 03521 g006
Figure 7. Power generation proportions in Gansu Province from 2013 to 2024.
Processes 13 03521 g007
Figure 8. Electricity supply and demand in Gansu Province from 2013 to 2024.
Processes 13 03521 g008
Figure 9. Forecast of future installed power generation capacity in Gansu Province under different scenarios.
Processes 13 03521 g009
Figure 10. Forecast of future power generation in Gansu Province under different scenarios.
Processes 13 03521 g010
Figure 11. Uncertainty analysis results based on renewable energy cost changes (4–6%) and thermal power control time (postponed to 2030). (a) presents the total power generation in 2040, (b) represents the electrification rate under different influences. Error bars and shaded areas on the histogram represent 95% confidence intervals.
Processes 13 03521 g011
Figure 12. Future emission trends of Gansu Province and power systems under different scenarios.
Processes 13 03521 g012aProcesses 13 03521 g012bProcesses 13 03521 g012c
Table 1. Synergistic cross-elasticity values of main emission industries in Gansu Province from 2014 to 2023.
Year E l s g / N O x E l s g / S O 2
Electric PowerCementIndustrial
Boilers
Electric PowerCementIndustrial Boilers
20140.121.20−1.370.28−0.20−0.26
20150.20−0.411.100.25−0.410.37
20160.24−0.031.470.24−0.030.58
20170.180.060.990.150.060.29
2018−0.090.080.82−0.070.090.29
2019−0.01−0.310.62−0.01−0.330.27
2020−0.16−0.360.38−0.12−0.380.18
2021−0.56−0.160.36−0.42−0.160.19
2022−0.770.090.32−0.570.090.20
2023−0.990.060.27−0.710.070.17
Table 2. Description of future emission scenarios.
ScenariosScenarios Description
High-emission scenarioAssuming the continuation of current policies, carbon peaking is projected to be achieved around 2030, but there are no additional climate targets post-2030 to promote the low-carbon transition; the costs of renewable energy decline is appropriately in line with historical trends; the best end-of-pipe pollution control measures are implemented between 2020 and 2060.
Medium-emission scenarioContinue implementing current policies to achieve carbon peaking around 2030; after 2030, adopt enhanced low-carbon transition policies to achieve carbon neutrality by 2060; the cost of renewable energy will appropriately decline according to historical trends, and thermal power generation units failing to meet energy efficiency standards will be phased out gradually starting from 2025; implement optimal end-of-pipe pollution control measures between 2020 and 2060.
Low-emission scenarioIncrease the intensity of recent climate mitigation policies by 20–50%, achieving carbon peak around 2025; the carbon neutrality scenario is consistent with the medium-emission scenario, sharing the same carbon pricing mechanism; while considering the rapid decline in renewable energy costs and the gradual phasing out of fossil fuel power generation units that do not meet energy efficiency standards starting from 2025; implement optimal end-of-pipe pollution control measures between 2020–2060.
Table 3. Major low-carbon transition strategies and core objectives between scenarios.
Scenario TransformationMajor Low-Carbon Transition
Strategies
Core Policy Objectives
High-emission scenario

Medium-emission scenario
Introduction of carbon pricing mechanism (The carbon pricing level is about 30 USD/t CO2 in 2030, mainly due to the expansion of existing emission reduction technologies and technological adaptation; subsequently, as CO2 emissions are substantially and rapidly reduced, it will surge to 100 USD/t CO2 by 2040) + gradual phasing out of non-compliant thermal power unitsBy 2025:
The entire province has achieved ultra-low emissions for coal-fired boilers with a capacity of 65 steam tons per hour or higher (including power generation), and coal-fired units have been retrofitted to serve as emergency backup power sources. Technical approaches include biomass co-firing (over 10%), green ammonia co-firing (over 10%), and the application of carbon capture and storage technologies
The installed capacity of renewable energy generation accounts for over 65% of the total power generation capacity, non-fossil energy constitutes 30% of the total energy consumption, and the generation volume of renewable energy reaches approximately 60% of the total social electricity consumption.
To complete the target tasks of achieving a renewable energy power consumption responsibility weight of over 50% and a non-hydro renewable energy power consumption responsibility weight of 23%
Industrial energy efficiency continues to improve, with energy consumption per unit of value-added in large-scale industries decreasing by 13.5%.
By 2027:
Carbon emissions per kilowatt-hour of coal-fired power will be reduced by 50% compared to 2023, approaching the level of gas-fired units. Key measures: further promoting low-carbon transition technologies for coal-fired units, such as biomass co-firing and ammonia co-firing.
By 2030:
National renewable energy consumption reached 1.5 billion tons of standard coal equivalent. Key measures: promote the construction of large-scale photovoltaic bases; accelerate the integration process of renewable energy with industrial, transportation, and building sectors.
Medium-emission scenario

Low-emission scenario
Low-cost renewable energy integration (Cost reduction is due to continuous innovation and improvement of technology, economies of scale and increased industry demand) + accelerating the construction of a new power system (developing large-scale, high-proportion renewable energy transmission technologies, smart grid dispatch technologies, and renewables storage technologies, etc.)
High-emission scenario

Low-emission scenario
Introduction of carbon pricing mechanism + gradual phasing out of non-compliant thermal power units + low-cost renewable energy integration + accelerating the construction of a new power system
Table 4. Assumptions for uncertainty analysis.
Sources of
Uncertainty
Scenarios CoveredScenario
Number
Description
Renewable energy costMedium-emission scenario, Low-emission scenario6Renewable energy costs are falling from 6% to 4%
Thermal power control progress2The implementation of thermal power control policy is postponed from 2025 to 2030
Table 5. Model prediction results calibration.
UnitStatistical DataModel Results Before CalibrationCalibration Results
202020202020
Hydroelectric PowerBillion kWh50.748.744.3
Wind + Solar GenerationBillion kWh38.023.626.2
CO2-provinceMillion Tons175.9160.3175.9
CO2-powerMillion Tons68.658.468.6
Disclaimer/Publisher’s Note: The statements, opinions and data contained in all publications are solely those of the individual author(s) and contributor(s) and not of MDPI and/or the editor(s). MDPI and/or the editor(s) disclaim responsibility for any injury to people or property resulting from any ideas, methods, instructions or products referred to in the content.