Abstract
The fracturing and driving oil technology used in shale oil provides a new approach for the development of offshore low-permeability reservoirs. However, the main control role of technical parameters is unclear, resulting in unsatisfactory accuracy and effectiveness of the enhanced oil recovery plan. For this reason, this study is based on the production and process data of five wells in the WZ oilfield. Fuzzy analytic hierarchical process analysis method (FAHP) was used to evaluate the parameter weights. Combined with numerical simulation technology, the evaluation results were verified by geological-engineering integration. The results show that in offshore low-permeability oilfields, the reservoir pressure coefficient has the greatest influence on the fracturing and oil repelling effect. The comprehensive weight reaches 0.450 compared to not adopting hydraulic fracturing oil displacement technology. This improves the recovery rate by 10.19% in 5 years. The surfactant concentration and the residual oil saturation of the reservoir rank are second, with a comprehensive weight of 0.219. Finally is the effective thickness of the reservoir, with a comprehensive weight of 0.113. In this study, the key parameters of fracturing and oil repelling in offshore low-permeability reservoirs are clarified. It provides theoretical basis and practical support for improving the success rate of well selection, layer selection and recovery capacity.
1. Introduction
Offshore low-permeability reservoirs with development potential have permeabilities ranging from 5 to 50 mD. This type of reservoir has complex pore connectivity, low water flooding recovery rate, and difficulty in extracting crude oil [1,2]. It is restricted by the offshore production well network. Relying solely on hydraulic fracturing technology cannot solve the problem of rapid short-term decline in production [3]. The same problem exists in the process of shale oil extraction. Integrated fracturing and driving oil technology has been proposed. It is considered an important way to achieve economies of scale in the development of low-permeability and ultra-low-permeability oil resources [4,5,6]. It has been proved through experiments that the use of surfactants as oil repellents is effective. It can effectively reduce the reservoir seepage resistance, improving reservoir water absorption capacity and oil recovery efficiency [5]. The surfactant fracturing fluid system does not contain polymer macromolecules. Good oil displacement effect can effectively reduce the consumption of water resources [7,8].
Pressure drive technology changes the permeability of reservoirs by forming cracks. However, it is difficult to determine the fracture properties of low-permeability reservoirs. It will cause significant differences in the permeability of oil reservoirs through pressure flooding transformation [9]. The impact of reservoir heterogeneity on oil production has been clarified by constructing heterogeneous permeability parameters of the reservoir [10] based on discrete fracture model and black oil numerical model. A study on the influence of different water injection and discharge volumes on the fracture extension pattern was carried out [11] according to the theory of seepage and the law of crack extension. A pressure driven model was established. Real-time coupling of fracture propagation process and reservoir seepage process has been achieved [12]. Targeted research has been conducted on the critical pressure of crack propagation using pressure flooding technology. By combining visualization methods, the evolution law of pressure-driven fractures was studied [13].
Offshore fracking for oil recovery is based on a single well to achieve injection and extraction, firstly using fracturing fluid to create multiple fractures in the formation. This improves the crude oil flow capacity. Then, the oil repellent enters the formation driven by the fracturing fluid. The crude oil is separated in larger fractures and pores using altered rock wettability. It enters microcracks and small pores through the percolation of capillary force, displacing the crude oil. Finally, oil is extracted from the formation through suction or formation backflow. At the same time, the fracturing fluid continues to play the role of seepage-absorption and drainage after completing the fracturing work. This ensures that the fracturing energy is maximized [14,15]. Therefore, the effect of increasing production directly affects the ability of fracturing fluid and oil displacement agent to return from the formation. The return ability of fracturing fluid and oil displacement agent is poor, and the working time needs to be extended, resulting in poor production increase and inability to achieve sustained improvement in oil production efficiency. A large amount of practice has proven that fracturing and oil displacement process parameters are important factors in improving oil recovery efficiency [14].
Optimization of fracturing and oil recovery parameters is also crucial for the production of low-permeability reservoirs in offshore areas. The parameters for fracturing and oil displacement in low-permeability reservoirs are not clear. The fracturing oil displacement process is complex, and there is a nonlinear relationship between parameters, resulting in poor recovery efficiency. Parameters involve both quantitative indicators (such as oil increase and cost) and qualitative indicators (such as safety). With the development of artificial intelligence technology, the agents can use additional global state information to guide training in a centralized way and make their own decisions only based on decentralized local policies [16]. In recent years, big data analytics based on algorithms has achieved significant progress in the field of petroleum engineering. AI-driven modeling integrates multi-source data, addressing the issues of low efficiency and strong subjectivity in traditional reservoir modeling [17,18]. Artificial intelligence models (such as ANN and SVM) are used for production forecasting, equipment fault diagnosis, and dynamic production adjustment, achieving cost reduction and efficiency improvement [19,20]. Machine learning methods optimize drilling parameters through real-time data analysis, predict drilling risks, and enhance drilling safety and efficiency [21]. By combining IoT and real-time data, Monte Carlo simulation and Bayesian networks are applied in risk analysis to achieve dynamic adjustment of exploration strategies and uncertainty analysis, improving exploration success rates [22,23]. Meanwhile, artificial intelligence technology is widely applied in petroleum data management, enhancing data security, real-time decision making, and automation levels [24]. FAHP, as a mature multi-criteria decision-making method, has unique advantages in parameter weight allocation and uncertainty handling. It can build a more robust and interpretable intelligent decision-making system. The mainstream artificial intelligence methods in current petroleum engineering are concentrated in fields such as machine learning and deep learning. FAHP, as an auxiliary decision-making tool, has complementary value in complex multi-criteria decision-making scenarios. Especially when dealing with unstructured and fuzzy data, it can enhance the interpretability and reliability of artificial intelligence systems. FAHP has significant advantages in such issues. FAHP is able to weigh and compare these different types and dimensions of indicators within the same framework. By using expert scoring to process it uniformly, a comprehensive evaluation result is ultimately obtained. It can provide a transparent, structured, and repeatable decision-making process. All judgment criteria and weight allocations are recorded. The final recommended parameter combination is more convincing.
This study is based on the process and production data of five fracturing and driving oil wells in WZ oilfield. Fuzzy analytic hierarchical process analysis method (FAHP) was adopted. By calculating the weights of parameters, the evaluation of key parameters is completed. Combined with the numerical simulation method, the results were verified by geological-engineering integration. This study provides a rapid evaluation method for the complex parameters of offshore fracturing and oil driving technology. It improves the efficiency and success probability of selecting wells and layers for fracturing and driving oil.
2. Methods
2.1. Fuzzy Analytic Hierarchy Process
Fuzzy Analytic Hierarchy Process is a decision-making tool that combines fuzzy mathematics and hierarchical analysis. It is suitable for scenarios where there is uncertain information or fuzzy evaluation criteria. It helps decision makers to make more reasonable choices in complex environments by transforming qualitative problems into quantitative analyses. FAHP takes into account the ambiguity of human beings in expressing their judgement in comparing results. This study refers to the case of fuzzy mathematics in complex engineering [25].
1. Establishment of hierarchical structure and fuzzy judgement matrix. Decompose the problem into several levels. Layer 1 is the general objective layer. The middle layer can be divided into the objective layer (criterion layer), sector layer (sub-criterion layer), etc., according to the nature of the problem. The bottom layer is the programme layer.
According to the classification of each layer, we compare and construct a fuzzy judgment matrix, , which is shown in Equation (1).
, represents the lower limit, median, upper limit of the fuzzy number in the fuzzy hierarchical analysis method, respectively, which needs to satisfy = 1, = 1, = 1; matrix order n is the number of elements of the current target layer.
2. Calculate the weighting factors. Find the weight factor on the same level from the higher level to the lower level. Suppose the factors on the current level are , , …, . The associated upper level factor is . Then all the factors , , …, for the upper level factor are compared. The relative importance of is obtained. The definition and explanation are shown in Table 1.

Table 1.
Relative importance numerical significance.
Calculate the weight coefficients. Calculate the fuzzy judgement matrix and probability matrix based on Equations (2)–(4) [26].
The judgement matrix and its complementary fuzzy judgement matrix are calculated, respectively.
If the matrix passes the consistency test, then proceed to the next step. If it does not pass, then readjust to achieve a satisfactory consistency. Calculate the synthesis matrix from Equations (7) and (8).
denotes the weight coefficient of each expert. Let . denotes the number of experts.
belongs to the standardized vector ; the weights give the order of importance of the factors , , …, with respect to the upper factor . The weight can be calculated by Equation (9).
; this paper takes .
3. Consistency test. If the matrix passes the consistency test, the fuzzy judgement matrix is also considered to meet the consistency. Consistency test steps with hierarchical analysis method (AHP). Calculate the consistency ratio according to Equation (10), when n = 2 and 3 in Equation (10); the stochastic consistency indexes are 0 and 0.58. When < 0.1, it is considered that has passed the consistency test.
2.2. Reservoir Numerical Simulation
Based on geological and production data of WZ oilfield fracturing and driving oil, the basic parameters of WZ oilfield model are shown in Table 2. Using the black oil model, establish a numerical model of the reservoir (Figure 1). The black oil model is one of the most commonly used and classic models in reservoir numerical simulation. It is a mathematical model of fluid flow in a two-phase or three-phase porous medium. The black oil model ignores the complex compositional changes within hydrocarbon systems. Focus on studying the phase changes and flow between oil, gas, and water. During the fracturing process, the linear flow dominated by fractures can be clearly captured by the black oil model, simulating oil seepage into cracks in the matrix [27]. Carry out the analysis of fracturing drive production capacity. Parameter settings are shown in Table 3. The fracturing simulation was completed using the Kinetix fracturing module.
Table 2.
Ideal model and fracturing oil drive process parameters.
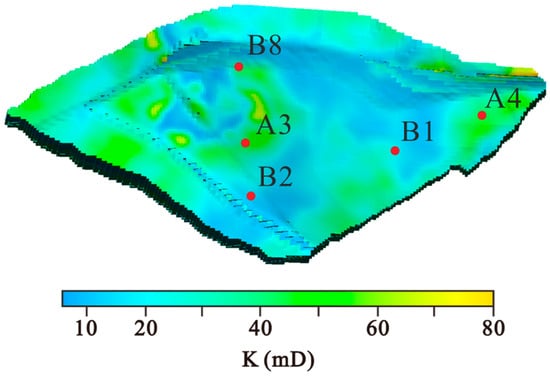
Figure 1.
Fracturing oil drive model (permeability model) for WZ oilfield. A3, A4, B1, B2, B8 are the well locations for fracking and oil recovery in WZ oilfield.
Table 3.
Fracturing fluid parameter settings.
3. Results
3.1. Parameter Evaluation Results
Fuzzy Analytic Hierarchy Process is used to construct a three-level structural hierarchy of “target layer-criteria layer-indicator layer” (Table 4), combined with the practice of fracturing and oil removal in offshore low-permeability oilfields. The target layer is the key parameter of fracturing and oil removal in offshore low-permeability oilfields; the criterion layer includes the efficiency of fracturing, construction feasibility and economic cost; the indicator layer includes all the parameters of the evaluation, including the pressure coefficient (I1), the surfactant concentration (I2), the residual oil saturation (I3) and the effective thickness (I4). A detailed description is provided in Table 4. It is important to note that the oil drive efficiency (S1) contains all the parameters; the construction feasibility (S2) corresponds to the pressure coefficient (I1), and the economic cost (S3) corresponds to the surfactant concentration (I2). That is, the pressure coefficient (I1) and surfactant concentration (I2) are repeated evaluation parameters.
Table 4.
Hierarchical structure of fracturing and oil drive in offshore oilfield.
Based on the fracturing and driving oil technology and production data of five wells, compare elements at different levels by scoring with seven development engineers with over 15 years of experience. Construct fuzzy judgement matrix. To balance the participation of each engineer, the consensus development conference method was used in this study to score each parameter, based on Table 1 “Definition of Relative Importance” in the reference document (0.1 = absolutely important, 0.5 = equally important, 0.9 = absolutely minor).
The fuzzy judgement matrix XT-S for the target layer (T) criteria layer (S) was used to obtain the importance judgements for S1 (efficiency of fracturing), S2 (construction feasibility), and S3 (economic cost) (Table 5). The matrix element is . S1 is more important than S2 (0.7, 0.8, 0.9), and S1 is more important than S3 (0.8, 0.9, 1.0). Match the principle of prioritizing oil recovery efficiency in offshore oilfield development.
Table 5.
Fuzzy judgement matrix of target layer (T) to criterion layer (S).
Fuzzy judgement matrix XS1-I for the criteria layer S1—indicator layer (I1–I4). It can be seen that the residual oil saturation I3 is the most critical under the driving efficiency. The specific pressure coefficient I1 is equally important (0.4, 0.5, 0.6). Specific effective thickness I4 is absolutely important (0.8, 0.9, 1.0) (Table 6). Surfactant concentration I2 is next to the pressure coefficient and superior to effective thickness. S2 corresponds to I1, and the matrix is of order 1; XS2-I = (0.5, 0.5, 0.5), and weights are taken directly as 1. S3 corresponds to I2, and the matrix is of order 1; XS3-I = (0.5, 0.5, 0.5), and weights are taken directly as 1. S3 corresponds to I2, and the matrix is of order 1; XS3-I = (0.5, 0.5, 0.5), and weights are taken directly as 1.
Table 6.
Fuzzy judgement matrix of criterion layer (S1) to indicator layer (I).
Weight coefficient calculation and consistency test. We take XS1-I as an example. According to Equations (2)–(4), obtain AS1-I and KS1-I (Table 7). The judgement matrices and are calculated according to Equations (5) and (6). Obtain GS1-I (Table 8).
Table 7.
XS1-I judgement matrix.
Table 8.
GS1-I judgement matrix.
According to Equations (7)–(9), the weights of the criterion and indicator layers are obtained. Since the fracking oil drive parameters I1 and I2 correspond to two guideline layers, we use the comprehensive weight as the final weight ranking of the parameters. In this case, the comprehensive weight is the product of the criterion layer weight and indicator layer weight. Each parameter is summed to the comprehensive weight to cover all the indicators. And the parameters are ranked in terms of importance (Table 9). The preferred ranking of all parameters is pressure coefficient (0.450) > surfactant concentration (0.219) = residual oil saturation (0.219) > effective thickness (0.113).
Table 9.
Comprehensive weight of fracturing oil drive parameters.
3.2. Numerical Simulation Results
The pressure coefficient has the highest comprehensive weight and is a key parameter for measuring the driving force of crude oil production. This significantly reduces interfacial tension and displaces the remaining oil [28]. Due to the issue of high prices, the reasonable range of surfactant concentration is 0.1–0.5%. In this range, the higher the concentration, the better the replacement effect [29]. In order to verify the calculation results, we took WZ-3 well as an example to analyze the parameters by numerical simulation. The WZ-3 well started to produce oil from June 2015. By January 2021 production was stopped due to insufficient production. The recovery rate is 17%. We used the same process and parameters. The surfactant concentration is 0.3% [30]. Under different reservoir conditions, the analysis of fracturing oil repellent effect was carried out.
Under the same reservoir thickness, the higher the pressure coefficient, the larger the fracture length formed (Figure 2). Reservoir permeability below 10 mD has a greater effect on the fracture length. As the permeability increases, the crack length increases. Reservoir permeability greater than 10 mD has an effect on the crack length. But the degree of influence becomes lower. As the permeability increases, the crack length becomes larger (Figure 3). This also shows that in reservoirs with permeability less than 10 mD, fracturing to drive oil has a high potential to increase oil production.
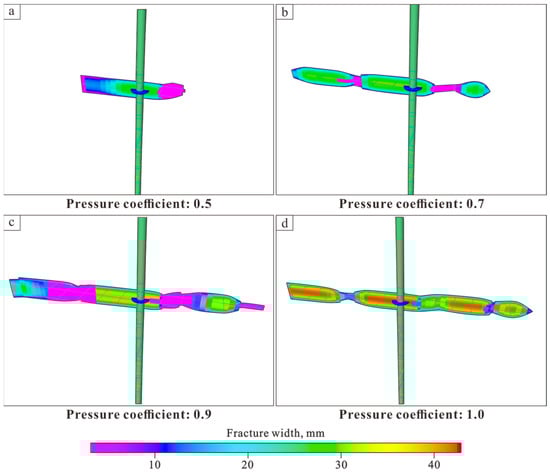
Figure 2.
Change of fracture with different permeability under different pressure coefficients.
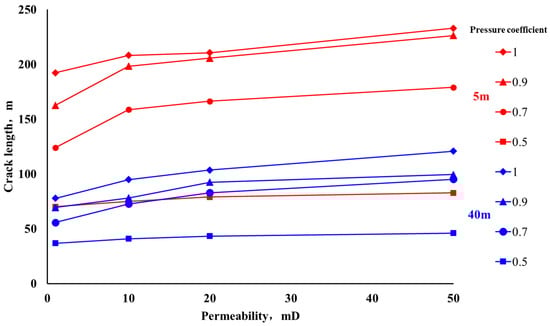
Figure 3.
Characteristics of pressure-driven fracture length under different pressure coefficients, permeability and effective thickness conditions (red: effective thickness of formation is 5 m; blue: effective thickness of formation is 40 m).
But the larger the effective thickness of the reservoir, the shorter the fracture length (Figure 3). This is due to the fact that the amount of replacement fluid for fracturing and driving oil is certain. As the thickness of the reservoir increases, the cracks formed expand vertically, reducing the lateral extension ability of cracks. Therefore, its ability to influence oil and gas production is relatively low. It is consistent with the calculation results of the influence weight.
There are significant differences in the effect of increasing production capacity under different pressure coefficients. The higher the pressure coefficient, the higher the recovery rate (Figure 4). But the increase in recovery rate gradually decreases. Under the condition of pressure coefficient of 1, the highest production rate was achieved after 5 years of the implementation of the fracturing and oil driving process. The recovery rate is 4.86% higher than the reservoir with a pressure coefficient of 0.5, relative to no fracturing and driving oil process. It takes 5 years to improve the recovery rate of 10.19%.
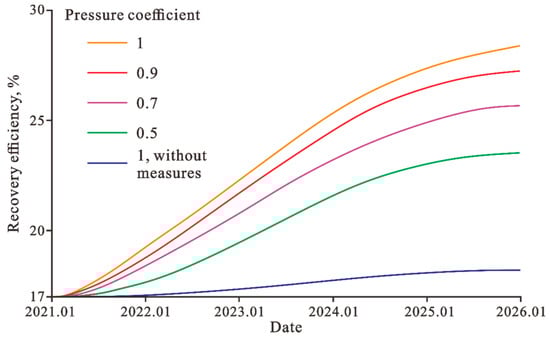
Figure 4.
Simulation results of fracturing and driving oil under different pressure coefficients.
Under the same process, the pressure coefficient is 1, and the effective thickness of the formation is 5 m. With the increase in oil saturation, the earlier the oil is produced, the higher the final recovery rate (Figure 5). Five years after the implementation of the fracturing and driving oil process, 80% oil saturation has a 2.17% higher recovery rate than 50% oil saturation (Figure 6).
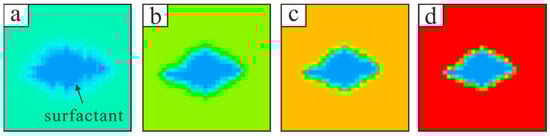
Figure 5.
Simulation results of fracturing and oil driving with different permeability ((a): 50% oil saturation; (b): 60% oil saturation; (c): 70% oil saturation; (d): 80% oil saturation).
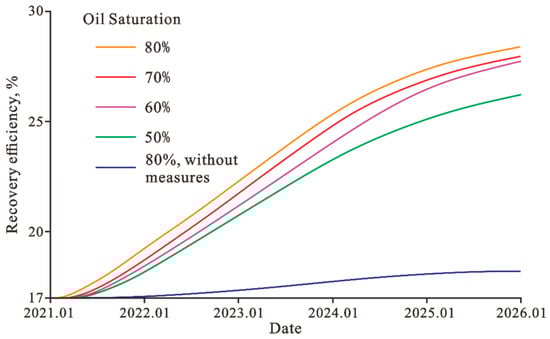
Figure 6.
Simulation results of fracturing and oil driving under different oil saturation conditions.
4. Discussion
In this study, the fuzzy hierarchy analysis method (FAHP) is combined with numerical simulation. The relative importance of several key parameters of fracturing and oil driving effect in offshore low-permeability reservoirs is ranked as follows: reservoir pressure coefficient, surfactant concentration, residual oil saturation, and effective reservoir thickness. The results of this ranking clarified the differential control role of geological and engineering parameters in the fracturing and driving process.
The reservoir pressure coefficient was identified as the most weighted factor. On the one hand, low formation pressure can lead to insufficient energy, reducing capacity and affecting efficiency [31,32]. On the other hand, according to the results of our numerical simulation, a low pressure coefficient will increase the leakage of fracturing fluid. This leads to a corresponding decrease in the basic parameters of the fracture obtained by fracturing. In formations with higher permeability, the fracture formed by the fracturing fluid will be larger. The greater the effective thickness, the longer the fracture length.
Residual oil saturation and reservoir effective thickness are used as geological parameters. Our study quantifies their influence weights. Residual oil saturation is the material basis of pressure drive technology. However, its effectiveness strongly depends on the power and conditions provided by the pressure coefficient and surface activator. And the effective thickness weight is relatively low. It means that in offshore low-permeability reservoirs, the vertical reservoir size is certainly important. However, whether the formation fracture can effectively communicate the reservoir is more critical. This is consistent with the understanding of previous studies. For low-permeability reservoirs, the fracture length is the most important influencing factor [33]. Due to the lack of other wells in the WZ oilfield that utilize fracturing and oil recovery technology, to verify the effectiveness of this research method, we conducted an evaluation of the fracturing oil displacement effect in the adjacent area of WZ oilfield (Table 10). We have selected five wells. The fracturing and oil recovery parameters of each well are the same as the actual ones. We completed a 5-year production forecast. Consistent with the actual production effect, the average error is 12.5%.
Table 10.
Application effect of FAHP+numerical simulation method in new wells of WZ oilfield.
This study systematically applied FAHP + numerical simulation to evaluate fracturing and oil recovery parameters in offshore low-permeability reservoirs, combining multi criteria decision making with geological and engineering validation. Complete the evaluation of key parameters. The results of this study have clear engineering guidance value. The established key parameters and their weighting system can enrich the field decision making. The parameter weighting awareness helps to make a quick economic benefit pre-assessment. For wells with small effective thicknesses but high pressure coefficients, they may still have implementation value. Misjudgement based on a single reservoir parameter is avoided. Although this study employs FAHP and numerical simulation, future work could integrate machine learning algorithms to further capture non-linear relationships between parameters and optimize fracturing designs in a data-driven manner. This study also has some limitations. First, the study is based on data from five wells in the WZ oilfield. The sample size is limited. The universality of its conclusions needs to be tested and corrected in more offshore oilfields and application practices. Secondly, although the FAHP method can effectively deal with complex decision-making problems, it relies to a certain extent on the experience of experts. In the future, it can be combined with more machine learning algorithms to use big data to further explore the nonlinear relationship between parameters.
5. Conclusions
(1) In this study, the weighting order of the four parameters affecting the fracturing and oil driving effect in offshore low-permeability reservoirs was clarified. That is, reservoir pressure coefficient (comprehensive weight 0.450), surfactant concentration (comprehensive weight 0.219), residual oil saturation (comprehensive weight 0.219), and reservoir effective thickness (comprehensive weight 0.113). Under the condition of pressure coefficient of 1, the highest production rate was achieved after 5 years of the implementation of the fracturing and oil driving process. The recovery rate is 4.86% higher than the reservoir with a pressure coefficient of 0.5. The intrinsic energy of the formation is the decisive factor in determining the effect of enhanced recovery. And the chemical drive efficiency is an important factor that can be optimized.
(2) The fracturing and driving oil technology can effectively improve the recovery rate of offshore low-permeability reservoirs. The research has developed a rapid evaluation method of key parameters based on Fuzzy Analytic Hierarchy Process (FAHP) and numerical simulation validation. It can provide quantitative decision-making basis for the selection of wells and layers and optimization of construction parameters in offshore low-permeability reservoirs. Within 5 years, the recovery rate of WZ oilfield can be increased by 10.19%.It is of great significance for improving the success rate and economic benefits of fracturing and oil driving technology in this type of reservoir.
Author Contributions
Conceptualization, D.W.; Methodology, H.Z.; Validation, Y.G.; Formal Analysis, L.L.; Resources, Y.G.; Data Curation, Y.Z. and H.Z.; Writing—Original Draft, D.W.; Writing—Review and Editing, D.W. and Z.L.; Visualization, L.L.; Project Administration, Z.L.; Funding Acquisition, Z.L. All authors have read and agreed to the published version of the manuscript.
Funding
This research was funded by the Hainan province major science and technology project (ZDKJ2021025), the Natural Science Foundation of Hainan Province (521MS0793), the Guiding Innovation Fund of Northeast Petroleum University (2023YDL-02), Daqing Guiding Science and Technology Plan Project (zd-2024-16).
Data Availability Statement
The original contributions presented in this study are included in the article. Further inquiries can be directed to the corresponding author.
Conflicts of Interest
Authors Yan Ge and Lingtong Liu were employed by the EnerTech-Drilling & Production Co., Ltd., CNOOC Energy Technology & Services Ltd. The remaining authors declare that the research was conducted in the absence of any commercial or financial relationships that could be construed as a potential conflict of interest.
References
- Zhao, M.W.; Song, X.G.; Zhou, D.; Lv, W.; Dai, C.; Yang, Q.; Li, Y.; Zhang, B.; Zhao, Y.; Wu, Y. Study onthe reducing injection pressure regulation of hydrophobic carbon nanoparticles. Langmuir 2020, 36, 3989–3996. [Google Scholar] [CrossRef]
- Su, H.; Lei, Z.D.; Li, J.C.; Gong, B.; Zhao, W.; Ju, B.; Zhang, D.; Qin, H. An effective numerical simulation model of multi-scale fractures in reservoir. Acta Pet. Sin. 2019, 40, 587–593. [Google Scholar] [CrossRef]
- Bai, X.; Qi, Y.; He, S.; Zhu, X.; Hou, Z.; Zhang, Y. Integrated re-stimulating technology of fracturing-replenishment-displacement ofhorizontal wells in tight reservoirs. Fault-Block Oil Gas Field 2021, 28, 63–67. [Google Scholar] [CrossRef]
- Zhao, L.Q.; Chen, Y.X.; Du, J.; Liu, P.; Li, N.; Luo, Z.; Zhang, C.; Huang, F. Experimental study on a new type of self-propping fracturing technology. Energy 2019, 183, 249–261. [Google Scholar] [CrossRef]
- Liu, Y.K.; Wang, F.J.; Wang, Y.M.; Li, B.; Zhang, D.; Yang, G.; Zhi, J.; Sun, S.; Wang, X.; Deng, Q.; et al. The mechanism of hydraulic fracturing assisted oil displacement to enhanceoil recovery in low and medium permeability reservoirs. Pet. Explor. Dev. 2022, 49, 864–873. [Google Scholar] [CrossRef]
- Ma, Y.X.; Zhang, Q.L.; Lu, R.B.; Yu, C.C.; Ruan, H.J.; Tang, X.; Wu, S.; Sun, S. Progress and development direction of development technology for low-permeability oil field in complex fault blocks in the western South China Sea. China Pet. Explor. 2024, 29, 1–9. [Google Scholar] [CrossRef]
- Huang, Z.G.; Mao, J.C.; Cun, M.; Yang, X.; Lin, C.; Zhang, Y.; Zhang, H.; Mao, J.; Wang, Q.; Zhang, Q.; et al. Polyhydroxy cationic viscoelastic surfactant for clean fracturing fluids: Study on the salt tolerance and the effect of salt on the high temperature stability of wormlike micelles. J. Mol. Liq. 2022, 366, 120354. [Google Scholar] [CrossRef]
- Zhao, M.W.; Dai, C.L.; Liu, P. Characteristics and efficient imbibitionoil displacement mechanism of gemini surlactant slickwater for integrated fracturing flooding technology. Acta Pet. Sin. 2024, 45, 1409–1421. [Google Scholar] [CrossRef]
- Cui, C.Z.; Wang, J.K.; Wu, Z.W.; Li, J.; Li, J.; Qian, Y. Analysis of unsteady pressure characteristics of fracturingllooding water injection wells in low permeability heterogeneous reservoirs. Acta Pet. Sin. 2025, 46, 938–952. [Google Scholar] [CrossRef]
- Zhang, M.L.; Zhang, T.Y.; Fan, J.Y. Calculation and Analysis of Fracture Extension Parameters Based on PKN Model. Sci. Technol. Eng. 2019, 19, 116–123. [Google Scholar]
- Wu, X.Y.; Liu, X.W.; Liu, F.F. Mechanism of pressure flooding development technology in deep ultra-low permeability reservoir and its application research. Lnner Mong. Petro-Chem. Ind. 2021, 47, 66–69. [Google Scholar]
- Cui, C.Z.; Wang, J.K.; Wu, Z.W.; Sui, Y.F.; Li, J.; Lu, S.Q.S. Establishment and Application of Pressure Drive Dynamic Fracture Model for Tight Oil Reservoirs. Spec. Oil Gas Reserv. 2023, 30, 87–95. [Google Scholar] [CrossRef]
- Cao, H.; Zhang, G.Q.; Li, S.Y. A hydraulic fracture extension model for fracturing and enhanced oil recovery considering the influence of the fracture process zone and its application. Rock Soil Mech. 2025, 46, 798–810. [Google Scholar] [CrossRef]
- Guo, J.C.; Ma, L.; Lu, C. Progress and development directions of fracturing flooding technology for tight reservoirs in China. Acta Pet. Sin. 2022, 43, 1788–1797. [Google Scholar] [CrossRef]
- Ouyang, W.P.; Zhang, M.; Sun, H.; Zhang, Y.; Chi, X. Numerical simulation of oil displacement by fracturing imbibition in horizontal shale oil wells. Pet. Drill. Tech. 2021, 49, 143–149. [Google Scholar] [CrossRef]
- Zhou, Y.H.; Liu, S.Y.; Qing, Y.P.; Zheng, T.Y.; Chen, K.X.; Song, J.; Song, M.L. CADP: Towards Better Centralized Learning for Decentralized Execution in MARL. In Proceedings of the 34th International Joint Conference on Artificial Intelligence, Montreal, QC, Canada, 16–22 August 2025; pp. 2838–2840. [Google Scholar]
- Chen, H.; Tang, H.; Wu, T.; Liu, T.Y.; Du, Y.J. Big data technology and its application in fine reservoir description. Pet. Geol. Recovery 2022, 29, 11–20. [Google Scholar] [CrossRef]
- Ji, B.; Zhang, W.; He, G.; Duan, T.Z.; Liu, H. Connotation and development trend of integrated reservoir geological modeling and numerical simulation. Chin. J. Pet. 2024, 45, 1152–1162. [Google Scholar]
- Sircar, A.; Yadav, K.; Rayavarapu, K.; Bist, N.; Oza, H. Application of machine learning and artificial intelligence in oil and gas industry. Pet. Res. 2021, 6, 379–391. [Google Scholar] [CrossRef]
- Al-Fattah, S.M.; Startzman, R.A. Predicting natural gas production using artificial neural network. In Proceedings of the SPE Hydrocarbon Economics and Evaluation Symposium, Dallas, TX, USA, 2–3 April 2001; Society of Petroleum Engineers. 2001; pp. 1–10. [Google Scholar]
- Noshi, C.I.; Schubert, J.J. The role of machine learning in drilling operations; a review. In Proceedings of the SPE/AAPG Eastern Regional Meeting, Pittsburgh, PA, USA, 7–11 October 2018; Society of Petroleum Engineers. 2018. [Google Scholar]
- Sheng, X.; Jin, Z.; Xu, Z.; Jiang, H. Uncertainty analysis in geological risk assessment. Pet. Exp. Geol. 2014, 36, 633–641. [Google Scholar] [CrossRef]
- Yang, P.; Zhan, S.; Li, M.; Li, L.; Guo, R.; Shang, M.Q.; Tao, C.F. Research and practice of artificial intelligence earthquake interpretation model based on dream cloud. China Pet. Explor. 2020, 25, 89–96. [Google Scholar] [CrossRef]
- Lu, H.; Huang, K.; Azimi, M.; Guo, L. Blockchain technology in the oil and gas industry: A review of applications, opportunities, challenges, and risks. IEEE Access 2019, 7, 41426–41444. [Google Scholar] [CrossRef]
- Liang, Y.F.; Wu, B.; Wang, J.J.; Li, C.H.; Suo, X.; Zhang, K. Optimization of recharge parameters for foundation pit engineering based on orthogonal test and fuzzy analytical hierarchy process-value engineering method. Tunn. Constr. 2021, 41, 1492. [Google Scholar]
- Saaty, T.; Kearns, K. Analytic Hierarchy Process. Anal. Plan. 1985, 63–86. [Google Scholar] [CrossRef]
- Jie, Y.; Yang, J.; Zhou, D.; Wang, H.; Zou, Y.; Liu, Y.; Zhang, Y. Study on the Optimal Volume Fracturing Design for Horizontal Wells in Tight Oil Reservoirs. Sustainability 2022, 14, 15531. [Google Scholar] [CrossRef]
- Yu, H.Y.; Du, X.L.; Li, Y.; Qin, S.Q.; Wang, J.F.; Li, Y.F.; Ma, B. Application and mechanism analysis of surfactants in enhanced oil recovery of low permeability reservoirs. Chem. Bioeng. 2025, 42, 41–45. [Google Scholar] [CrossRef]
- Gao, F.; Song, Z.Z. Mechanism of surfactant flooding in low-permeability oilfields. J. China Univ. Pet. 2012, 36, 160–165. [Google Scholar] [CrossRef]
- Liu, J.X.; Li, Z.; He, X.; Lu, X.G.; Chen, C.; Liu, Y.G.; Lan, X.T.; Zhang, L.P.; Ju, J.C.; Hong, X.J.; et al. Effect Evaluation and Process Parameter Optimization of Synergistic Pressure Flooding in Low Permeability Reservoir of Bohai B Oilfield. Oilfield Chem. 2025, 42, 244–253. [Google Scholar] [CrossRef]
- Liu, B.; Zhang, W.; Bie, M.J.; Yang, Z.C.; Zhai, Z.Z. Study on the strategy of restoring formation pressure and field application in offshore L oilfield. Xinjiang Oil Gas 2020, 16, 78–82. [Google Scholar]
- Zhu, Z.; Dang, H.L.; Cui, P.X.; Dang, K.Y.; Bai, P.; Zhao, Y.N. Numerical simulation of the pressure law of energy charging and permeability enhancement in low permeability reservoirs. Xinjiang Oil Gas 2023, 19, 56–62. [Google Scholar] [CrossRef]
- Lin, H.; Zhang, S.C.; Wang, F.; Pan, Z.; Zhang, Y.; Chen, Y. Optimization of hydraulic fracture parameters for low-permeability condensate reservoir in Jilin Oilfield. J. Xi’Shiyou Univ. (Nat. Sci. Ed.) 2016, 31, 62–67. [Google Scholar] [CrossRef]


Disclaimer/Publisher’s Note: The statements, opinions and data contained in all publications are solely those of the individual author(s) and contributor(s) and not of MDPI and/or the editor(s). MDPI and/or the editor(s) disclaim responsibility for any injury to people or property resulting from any ideas, methods, instructions or products referred to in the content. |
© 2025 by the authors. Licensee MDPI, Basel, Switzerland. This article is an open access article distributed under the terms and conditions of the Creative Commons Attribution (CC BY) license (https://creativecommons.org/licenses/by/4.0/).