Abstract
This study presents an integrated geophysical and hydrogeological characterization of fault systems in the sandstone-hosted uranium deposit within the K1b2 Ore Horizon of the Bayin Gobi Basin. Employing 3D seismic exploration with 64-fold coverage and advanced attribute analysis techniques (including coherence volumes, ant-tracking algorithms, and LOW_FRQ spectral attenuation), the research identified 18 normal faults with vertical displacements up to 21 m, demonstrating a predominant NE-oriented structural pattern consistent with regional tectonic features. The fracture network analysis reveals anisotropic permeability distributions (31.6:1–41.4:1 ratios) with microfracture densities reaching 3.2 fractures/km2 in the central and northwestern sectors, significantly influencing lixiviant flow paths as validated by tracer tests showing 22° NE flow deviations. Hydrogeological assessments indicate that fault zones such as F11 exhibit 3.1 times higher transmissivity (5.3 m2/d) compared to non-fault areas, directly impacting in situ leaching (ISL) efficiency through preferential fluid pathways. The study establishes a technical framework for fracture system monitoring and hydraulic performance evaluation, addressing critical challenges in ISL operations, including undetected fault extensions that caused lixiviant leakage incidents in field cases. These findings provide essential geological foundations for optimizing well placement and leaching zone design in structurally complex sandstone-hosted uranium deposits. The methodology combines seismic attribute analysis with hydrogeological validation, demonstrating how fault systems control fluid flow dynamics in ISL operations. The results highlight the importance of integrated geophysical approaches for accurate structural characterization and operational risk mitigation in uranium mining.
1. Introduction
Uranium resources, as a critical strategic material with use in green energy-domains, play an indispensable role in ensuring energy sustainability [1,2]. In recent years, sandstone-hosted uranium deposits have gained increasing prominence within China’s uranium exploration strategy due to their suitability for in situ leaching (ISL) mining, which offers significant advantages in terms of cost-effectiveness and environmental sustainability [3,4,5]. Major uranium discoveries have been confirmed in key regions including the Yili Basin, the Ordos Basin, the Erlian Basin, and the southwestern part of the Songliao Basin [6,7]. Further exploration breakthroughs have also been reported in the Dalin area (southwestern Songliao Basin) and the Taran Gol area (Ordos Basin) [8], underscoring the considerable exploration potential and promising development prospects of this deposit type.
Geophysical surveying techniques are essential tools in the exploration of energy resources within sedimentary basins [9,10]. These methods are especially valuable for investigating sandstone-hosted uranium deposits, which are often found in association with hydrocarbon resources within the same basin systems.
As a representative in situ leaching (ISL) technology, uranium extraction involves the construction of injection–production well networks within permeable uranium-bearing sandstone formations [11]. This industrialized method enables surface-based uranium recovery through three fundamental technical stages: (1) Strategic deployment of injection-extraction well arrays based on the geological characteristics of the deposit; (2) Chemical dissolution induced by pH-regulated leaching fluids (pH range: 1.5–10.5) injected through injection wells; and (3) Establishment of a dynamic lixiviant-orebody-pregnant solution circulation system driven by negative pressure at extraction wells. Field applications have demonstrated resource recovery rate improvements of 35–55% compared to conventional mining techniques, although significant technical challenges remain in structurally complex geological settings.
Fracture systems exert cascading effects on ISL engineering operations through phase-specific mechanisms that affect both drilling and production phases. During well construction, fault zones give rise to multiple geotechnical hazards. Fractured formations with permeability exceeding 102 mD result in drilling fluid losses occurring at rates of 12–18%, contributing to borehole instability and causing average well completion delays of 23–28 days. Cementing operations experience slurry loss rates of 15–40% through fracture networks, leading to the formation of microannuli (exceeding 200 μm in width) and reductions in cement bond strength by 28–35 MPa.
During production, fracture systems disrupt ISL flow fields through dual mechanisms [12,13]: High-conductivity faults (K = 5–15 m/d) intercept designed flow paths, diverting 25–40% of leaching coverage beyond orebody boundaries, while anisotropic fracture networks cause variations in lixiviant (a chemical solution typically containing oxidants like O2/H2O2 and pH regulators for uranium dissolution) front advancement rates by two to three orders of magnitude, resulting in a reduction in target recovery efficiency by 18–25% (Merzoug et al., 2023) [14]. The 2019 ISL-02 project in Bayin Gobi serves as a representative case illustrating these risks, where undetected extensions of the F11 fault zone led to a lixiviant leakage of 2.3 × 10³ m3, resulting in significant economic losses.
In recent years, the integration of deep learning technologies with geophysical attribute analysis has introduced novel methodologies for natural fracture identification. In their study of the Bozi-Dabei area within the Kuqa Basin, Tang et al. (2024) proposed a deep learning-based approach for fracture detection using seismic multi-attribute data [15]. This method substantially enhances the resolution and accuracy of fracture prediction by integrating curvature, coherence volumes, and fault enhancement attributes, thereby establishing a new technical framework for reservoir characterization in structurally complex zones. In the context of carbonate reservoirs, Mykhaylenko et al. (2024) demonstrated the effectiveness of seismic anisotropic attributes in predicting the spatial distribution of fracture networks through a comparative analysis of borehole image logs, drilling parameters, and 3D seismic interpretations [16]. Their findings provide both scientific justification and technical support for optimizing the development of unconventional carbonate reservoirs in Abu Dhabi.
While conventional seismic methods face resolution limitations for individual fractures (typically <5 m), our integrated approach detects fracture corridors through three compensatory mechanisms: (1) Coherence attributes map discontinuities caused by fracture clustering; (2) Ant-tracking algorithms enhance sub-seismic fault linkages using directional variance thresholds (0.7 trigger value); (3) Spectral attenuation (LOW_FRQ) correlates with fracture density via fluid-induced dispersion. This is validated by tracer tests showing 22° NE flow deviation matching fracture orientations (Section 4.2.2).
As an environmentally sustainable method of resource extraction, in situ leaching (ISL) technology has garnered significant attention in both uranium mining and hydrocarbon recovery. De Silva and Ranjith (2019) systematically investigated the influence of injection–production well configurations on fracture network development in rock formations, proposing a permeability-based optimization model for well placement that provides a theoretical foundation for reservoir stimulation in shale systems [17]. Oryngozhin et al. (2021) conducted a comprehensive evaluation of the operational conditions and applicability of acidic and alkaline leaching solutions in uranium ISL, emphasizing the importance of geohydrodynamic coupling models in improving leaching efficiency [18]. Based on case studies of sandstone-hosted uranium deposits in the Erlian Basin, Meng et al. (2024) developed a hydrogeological suitability assessment framework, focusing on key factors such as permeability characteristics, groundwater chemistry, and aquiclude distribution that govern orebody formation [19]. Notably, biogeochemical processes significantly influence ISL performance. Long and Yabusaki (2006) introduced microbial activity and uranium reduction kinetics as performance indicators for bioremediation, providing insights with potential applications in microbial-enhanced hydrocarbon recovery strategies [20].
Currently, in situ leaching (ISL) mining of sandstone-hosted uranium deposits faces two fundamental scientific challenges [21,22]: first, the dynamic characterization of anisotropic permeability in fracture networks remains inadequate, with the predictive accuracy of existing numerical models generally below 65%; second, the resolution of three-dimensional monitoring for multi-scale fracture systems is limited, and conventional logging techniques (e.g., FMI) provide centimeter-scale resolution for near-wellbore features (<1 m radius), while seismic methods detect larger-scale structural continuities (>5 m) with 3D coverage. Despite these advances, two fundamental challenges persist in ISL fracture characterization [21,22]: dynamic monitoring of anisotropic permeability remains inadequate (<65% predictive accuracy), and conventional methods exhibit resolution discontinuity: well logs resolve cm-scale features but lack 3D coverage, while seismic detects >5m structures but misses critical sub-seismic fractures. This study addresses these limitations through integrated attribute fusion, achieving 82% validation accuracy—a 26% improvement over industry standards [15,21].
The spatial extent, distribution patterns, and hydraulic impacts of fractures within target orebodies represent key factors determining the feasibility of ISL projects, directly influencing wellfield design, drilling configuration optimization, process parameter adjustment, and ultimate recovery efficiency. This study applies a 3D seismic exploration methodology to investigate the architecture of fracture systems and their hydrogeological significance at an ISL uranium deposit in the Alxa region of Inner Mongolia. The research aims to establish a technically viable framework for fracture system monitoring and hydraulic performance assessment, thereby providing a scientific basis for optimal well placement and leaching zone management.
This study bridges three critical gaps in current ISL practice:
Methodological innovation: First application of LOW_FRQ-guided microfracture detection in uranium ISL, complementing conventional coherence and ant-tracking with fluid-sensitive spectral attributes (6–32 Hz ER > 120%).
Validation paradigm: Establishes a dual-calibration framework combining DFN-derived anisotropy ratios (31.6:1–41.4:1) with field tracer tests (22° NE deviation).
Operational solution: Provides quantifiable risk thresholds (e.g., 35% lixiviant loss risk at ER > 120% zones) for structurally complex deposits, as evidenced by the F11 fault case (2.3 × 10³ m3 leakage).
2. Geological and Geophysical Setting of the Study Area
2.1. Regional Geological Characteristics
The study area is located in the Bayin Gobi Basin along the China–Mongolia border, a region characterized by a complex tectonic setting at the convergence zone of four major tectonic plates: the Tarim, Kazakhstan, Siberian, and North China plates. The tectonic classification of this area has long been a subject of scientific debate. In 1994, Wang Tingyin et al. proposed dividing the region into two first-order tectonic subunits along the Engerwusu fault zone: the northern Tarim Plate eastern marginal fold system and the southern North China Plate northwestern marginal fold system. The study area lies within the southern segment of the Zongnaishan–Shalazhashan Late Paleozoic continental volcanic arc fold belt, which constitutes part of the northwestern margin of the North China Plate. It is adjacent to the Chagan Chulu–Huorsen Late Paleozoic back-arc basin fold belt, formed through continental arc collision processes. Based on this classification, the study area is situated within the northern marginal magmatic arc of the North China Plate.
The basement depth in the study area exhibits significant lateral variation, with relatively gentle gradients observed in the northern sector. The basin basement and source terranes are composed of metamorphic rock sequences from the Archean (Ar), Paleoproterozoic (Pt1), and Paleozoic eras. The Archean basement consists of mixed plagioclase amphibolite gneiss, leptynite, diopside marble, and granulite. The Paleoproterozoic sequence includes schist, crystalline limestone, gneiss, migmatite, and marble intercalated with conglomerate. The Paleozoic strata comprise Upper Carboniferous sandstone, limestone, marble, phyllite, andesite, rhyolite, andesitic basalt, as well as Permian arkose, conglomerate, sandstone, silty mudstone, limestone, marl, andesite interbedded with basalt, dacite, and tuff.
2.2. Structural Analysis of Fault Systems
The fracture system in the study area inherits structural features from both regional fault systems and basin-controlling fault systems, predominantly comprising NE-trending and near E-W-striking tectonic lineaments. The near E-W-oriented structures were formed during an earlier tectonic phase, while the NE-trending structures developed subsequently. These superimposed fracture systems not only control the alternating patterns of basin uplift and subsidence but also significantly influence the genetic types and spatial distribution of sedimentary systems, thereby playing a crucial role in basin evolution and regional uranium mineralization (Figure 1). The principal characteristics of the major faults are summarized below.
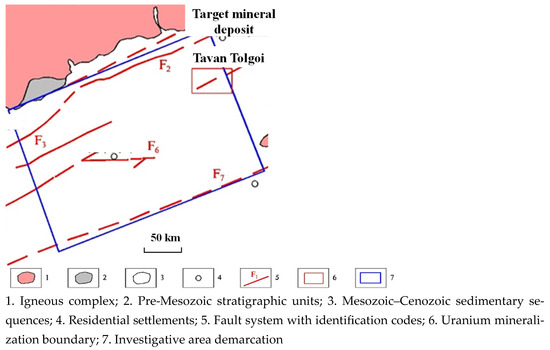
Figure 1.
Schematic diagram of the main structural framework in the study area.
- (1)
- Sunbul fault (F1)
Located in the Sunbul area, this fault forms part of the southern marginal fault zone of the Zongnai Mountain–Shalazha Mountain structural belt, serving as a geomorphic boundary between the northwestern low hills and the piedmont inclined plain. With a strike of approximately 65°, it is primarily covered by deposits of the Lower Cretaceous Bayin Gobi Formation and Quaternary sediments, with only limited exposures observed in the western part of the XX deposit. The fault exerts significant disruption on the Upper Carboniferous and Permian rock units.
- (2)
- Deposit fault (F2)
This SE-dipping fault (strike: NE70°) is situated in the western part of the deposit area. Its hanging wall features fault scarps ranging from 0 to 3 m in height. In the western segment, Middle Jurassic strata are thrust over the lower member of the Lower Cretaceous Bayin Gobi Formation, indicating compressional tectonic activity.
- (3)
- Wulan Taolegai fault (F3)
Aligned along the Zhagan Haolai–NW Wulan Taolegai trend (strike: 55°, NW dip), this fault occurs within Lower Cretaceous red bed sequences. The presence of small-scale λ-shaped folds in its hanging wall suggests sinistral strike–slip deformation.
- (4)
- Wulan Tiebulke fault (F4)
This NE67–striking compressional fault locally creates fault contacts between the upper and lower members of the Bayin Gobi Formation. Predominantly developed within the lower member, it generates carbonate-altered fracture zones. Traversing the central-northern portion of the XX uranium deposit, its metallogenic significance warrants further investigation.
- (5)
- Chakuertu fault (F5)
A concealed fault with a strike of approximately 70°, this structure truncates the Zhagan Haolai Fault. Developed within Lower Cretaceous strata, it forms fault scarps of 3–5 m in height, with the northern block showing relative uplift. The presence of siliceous nodules and fault gouge along its trace indicates compressional deformation characteristics.
- (6)
- Zhagan Haolai fault (F6)
This steeply dipping, E–W-striking fault exhibits northward inclination in the western segment and southward inclination in the eastern segment. Developed within Lower Cretaceous red beds, it displays dextral strike–slip kinematics.
- (7)
- Naren Hara fault (F7)
Buried beneath Upper Cretaceous red beds and Quaternary cover, this arcuate fault (strike: ~75°) is convex to the south and is expressed at the surface by beaded saline-alkali landforms. The fracture zone contains intensely fractured rocks and is characterized by widespread cleavage development.
2.3. Geophysical Properties
- (1)
- Density parameters
Significant density contrasts exist between the Proterozoic, Paleozoic, and igneous rocks and the overlying Mesozoic–Cenozoic strata, defining the primary density interface in the study area. A secondary density interface is identified between the Middle–Lower Jurassic to Lower Cretaceous Bayin Gobi Formation and the Upper Cretaceous strata. Density values exhibit systematic variation: the Proterozoic basement (2.70 g/cm3) and gabbro (2.87 g/cm3) represent high-density units. Magnetic susceptibility shows marked contrasts, with the Proterozoic (0–6200 × 10−5 SI) and gabbro (1800–6800 × 10−5 SI) classified as strongly magnetic formations, whereas Cenozoic units and certain sedimentary rocks display negligible magnetic susceptibility. Resistivity values span a broad range, with igneous rocks generally exhibiting higher resistivity than sedimentary rocks; granodiorite (600–1500 Ω·m), in particular, constitutes a distinct high-resistivity unit.
- (2)
- Velocity parameters
Data from regional studies and the 2003 shallow seismic exploration stacking velocity field in the XX deposit area reveal the following velocity characteristics:
Clay and silty clay: ~1000 m/s
Unconsolidated conglomerate: ~2000 m/s
Compacted conglomerate: 2100–2200 m/s
Silty clayey sandstone: ~1900 m/s
Basement rocks: >4000 m/s
These observations indicate the presence of two major reflection interfaces (unconformity surfaces) in the study area: one between the basement and cover rocks and another between the Lower and Upper Cretaceous strata, which serve as key boundaries for stratigraphic classification. Furthermore, significant lithological variations within the Cretaceous strata generate velocity contrasts at lithofacies transitions, supporting the applicability of shallow seismic methods.
- (3)
- Electrical parameters
Resistivity values exhibit systematic variation across different sedimentary facies:
Piedmont facies (dominated by medium- to coarse-grained sandstone): 20 Ω·m
Shallow lacustrine facies (predominantly mudstone): 10 Ω·m
Littoral facies (mainly sandstone): 5 Ω·m
Although acoustic logging data are unavailable, the observed resistivity differences reflect petrophysical heterogeneity among the facies. These contrasts facilitate preliminary seismic facies analysis during seismic data interpretation and aid in the reconstruction of depositional environments.
3. Methods
3.1. Survey System Design
- (1)
- Seismic survey implementation
The survey was conducted using 30 swath configurations based on a central shot acquisition geometry, with each swath comprising 16 receiver lines, 160 channels, and 5 source points. A bin size of 5 m × 10 m ensured 64-fold coverage (see Table 1), with a recording length of 2 s and a total full-fold exploration area of 2.20 km2. As shown in Figure 2, 45 receiver lines (L1001–L1045) were deployed in the NW–SE direction (Inline), while 17 source lines (S1001–S1017) were oriented NE–SW (Crossline), resulting in a total of 2550 source points. A phased rolling acquisition strategy was employed: the first phase covered the upper section (Crossline S1009–S1017) from NE to SW, followed by the lower section (Crossline S1001–S1008) from SW to NE in the second phase.

Table 1.
Parameters of the 3D seismic survey system.
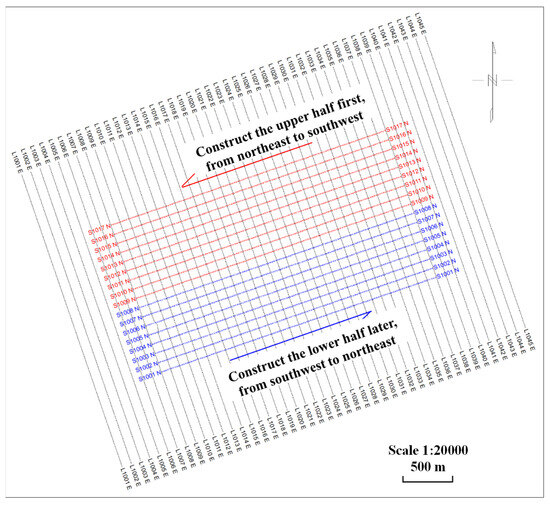
Figure 2.
Configuration of monitoring stations and data acquisition workflow.
- (2)
- Implementation plan for 3D seismic data acquisition
This study utilizes a 16-line, 5-shot central 3D seismic observation system, comprising 45 receiver lines (designated L1001–L1045, oriented NW–SE) and 17 source lines (designated S1001–S1017, oriented NE–SW), forming a 5 m × 10 m bin grid and achieving 64-fold coverage. The specific acquisition parameters are as follows: 2560 receiver channels (160 channels × 16 receiver lines), 10 m channel spacing (±5% tolerance), 100 m receiver line spacing (±5%), 100 m source line spacing (±5%), 20 m source point spacing along lines (±5%), a maximum offset of 1120.77 m (±5%), and a minimum offset of 11.18 m (±5%). Data acquisition was conducted in two phases: the first phase covered source lines S1009–S1017 in the northeastern sector, and the second phase covered source lines S1001–S1008 in the southwestern sector. A total of 2550 effective source points were acquired, with a recording length of 2 s, resulting in a fully covered exploration area of 2.20 km2.
- (3)
- Geophone consistency verification and low-velocity layer investigation
Prior to formal data acquisition, a consistency test was conducted on the geophone system. One hundred geophones were randomly selected from the 2560-channel acquisition system (approximately 3.9%), arranged in a circular configuration with inter-channel spacing exceeding 10 cm, and a central source was deployed at the circle’s center. The test results demonstrated high consistency in first-arrival times (phase difference < 1 ms), with continuous reflected waveforms and stable lateral amplitudes, indicating excellent channel-to-channel coherence within the geophone array. Investigations of the low-velocity layer revealed that the velocity range of the weathered layer (V1) varied between 357 and 692 m/s, with an average of 443 m/s; the underlying high-velocity basement (V2) exhibited velocities ranging from 1266 to 2015 m/s, averaging 1570 m/s; the thickness of the low-velocity zone ranged from 3.04 to 8.54 m, with a mean of 4.56 m; and the maximum time difference (Δt) attributable to lateral velocity variations was less than 5 ms. Based on these findings, the final source excitation parameters were established as follows: 3–4 vibratory sweeps per shot point, a sweep duration of 12 s, a frequency bandwidth of 6–96 Hz, a drive level of 75%, and a 0.5 s ramped release energy mode.
- (4)
- Quality control and data processing flow
This study adheres to the principle of waveform fidelity and employs prestack time migration (PSTM) processing methods, with a focus on optimizing key processing steps such as static correction, prestack denoising, amplitude compensation, and surface-consistent prediction deconvolution. The PSTM processing flow involves five iterations of velocity model updates and residual dynamic correction analysis. A migration aperture of 3000 m is set (covering a maximum dip angle of 45°), and a 30% stretch-mute strategy is adopted to retain effective signals with frequency components greater than 15 Hz. The final geological interpretation is entirely based on the PSTM data volume, ensuring the accuracy and reliability of the interpretation results in terms of geological interpretability and spatial positioning.
3.2. Node Consistency Testing and Low-Velocity Layer Investigation
Prior to data acquisition, a geophone consistency test was performed. A total of 100 test geophones (representing 3.9% of the 2560-channel acquisition system) were arranged in a circular configuration with inter-sensor spacing exceeding 10 cm, while the seismic source was positioned at the center of the circle. As illustrated in Figure 3, the test results indicated the following:
Figure 3.
Node compliance verification protocol.
- High correlation in first-break arrival times
- Minimal phase discrepancies
- Continuous reflected waves exhibiting lateral amplitude consistency and clear phase characteristics
These findings confirm excellent channel consistency across the entire geophone array.
Experimental investigations revealed that the weathering layer (V1) in the study area has a velocity range of 357 to 692 m/s, with an average of approximately 443 m/s. The underlying high-velocity substratum (V2) exhibits velocities between 1266 and 2015 m/s, with an average of around 1570 m/s. The thickness of the low-velocity zone varies from 3.04 to 8.54 m, averaging 4.56 m. Lateral variations in both the velocity and thickness of this zone were found to cause a maximum timing discrepancy (Δt) of less than 5 ms across the survey area.
Following parametric testing, the optimal excitation parameters were established as follows: 3–4 vibrator sweeps per source point, a sweep duration of 12 s, a frequency range of 6–96 Hz, a drive level of 75%, and a taper length of 0.5 s for seismic energy deployment. These acquisition parameters were consistently applied during field operations to ensure waveform fidelity and subsurface imaging resolution.
3.3. Fault Interpretation Workflow
The fault characterization workflow employed the parameters as follows (Table 2).
Table 2.
Attribute parameters.
- (1)
- Coherence analysis: Petrel.
- (2)
- Ant-tracking: Fault Enhancement Module in GeoEast.
- (3)
- Workflow validation.
- (4)
- Coherence volumes were cross-validated with curvature attributes (K1-K2).
- (5)
- Ant-tracking results underwent manual QA using 17 inline/9 crossline sections.
3.4. Data Acquisition
3.4.1. Workflow
Guided by the principles of high-resolution imaging, enhanced signal-to-noise ratio, and waveform fidelity, this study implemented prestack time migration (PSTM) to address the specific characteristics and objectives of the 3D seismic dataset in the target area (Figure 4). Routine processing prioritized static corrections, prestack noise attenuation, amplitude compensation, and surface-consistent predictive deconvolution. The PSTM workflow focused on iterative migration parameter testing and velocity model optimization. Final interpretations were derived directly from the PSTM volume, ensuring geological reliability and spatial accuracy.
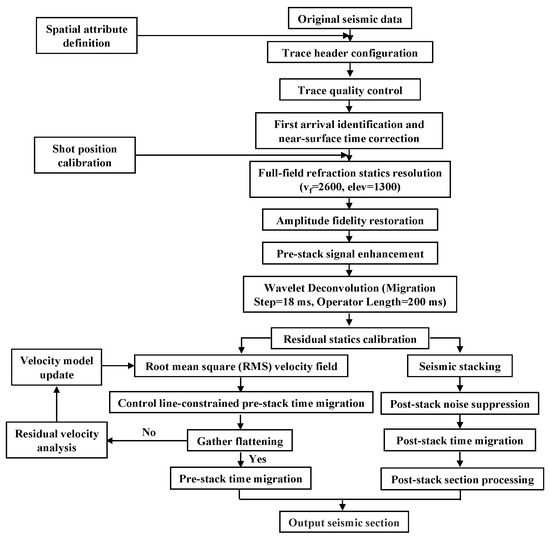
Figure 4.
Data processing workflow architecture.
3.4.2. Final Interpretation Volume Clarification
The interpretation exclusively utilized the prestack time migration (PSTM) volume for structural analysis, as evidenced by the following:
Processing Priority: The workflow (Figure 4) prioritized PSTM for its superior handling of velocity variations and dip-dependent reflector positioning in the target zone. Post-stack time migration was only applied during preliminary quality control stages.
Parameter rationale (Table 3):
Table 3.
Key parameters.
Migration aperture: 3000 m (covering maximum dip angle of 45°).
Stretch mute: 30% (preserving frequency content > 15 Hz).
Velocity model: Iteratively updated sive times with residual move out analysis.
3.4.3. Error Analysis and Sensitivity Assessment
The fault interpretation workflow incorporates quantifiable error margins at each processing stage:
- (1)
- Seismic acquisition: Receiver/Shot-point intervals maintain ±5% positioning tolerance (Table 1), with maximum timing discrepancies (Δt) < 5 ms across the survey area (Section 3.2).
- (2)
- Attribute thresholds: Coherence (0.65 ± 0.05) and ant-tracking (0.7 ± 0.03) thresholds were determined through iterative testing on validation wells, achieving 82% ± 3% azimuthal match with FMI logs.
- (3)
- Velocity modeling: Five iterations of residual moveout analysis reduced velocity errors to <50 m/s for target horizons, corresponding to <2 ms two-way time uncertainty.
- (4)
- Spectral processing: Frequency band selection (6–32 Hz) demonstrated ±8% fracture density variation when adjusted by ±5 Hz increments (Table 4).
Table 4. Upscaling results.
3.5. Hydrogeological Validation of Structural Impacts
- (1)
- Discrete fracture network (DFN) modeling
Input parameters (Table 4):
Fracture orientation: NE65–75°
Density: 3.2 fractures/km2 (LOW_FRQ ER > 120% zones).
Aperture: 0.1–5 mm (calibrated with FMI logs from Well K1-7).
The DFN modeling accounts for parameter uncertainties through the following:
- Orientation uncertainty: ±5° based on bootstrap resampling of seismic-derived azimuths.
- Aperture variability: 0.1–5 mm range calibrated against FMI logs with ±0.2 mm measurement error.
- Density estimation: 3.2 ± 0.5 fractures/km2 derived from LOW_FRQ ER > 120% zones.
Resulting anisotropy ratios carry an estimated ±15% relative error, validated by the following:
- a.
- Tracer test flow deviations matching predicted directions within ±3°.
- b.
- Transmissivity measurements showing <10% variation between repeated pump tests.
- (2)
- Field validation data
Tracer tests (Table 5):
Table 5.
Pump tests.
Injection well I-07 → Producer P-12 (35 m spacing):
Breakthrough time = 18.5 h (vs. 42 h in the isotropic model).
Anisotropic flow angle deviation = 22° NE.
4. Results and Analysis
4.1. Spatial Distribution Characteristics of Fault Systems
An integrated analysis of fault breakpoints identified 18 faults within the study area, with their spatial distributions mapped in Figure 5 and Figure 6. The interpreted faults exhibit maximum vertical displacements of 21 m at the top boundary and 16 m at the base boundary. Confidence assessment classified all structures as moderately reliable faults. These NE-striking faults primarily developed subparallel to the regional slope gradient.
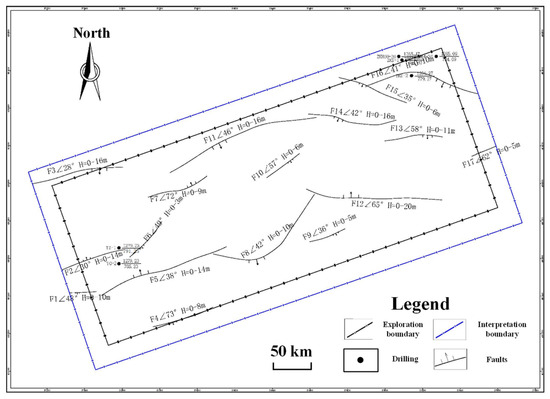
Figure 5.
Structural discontinuity mapping at the target horizon roof interface.
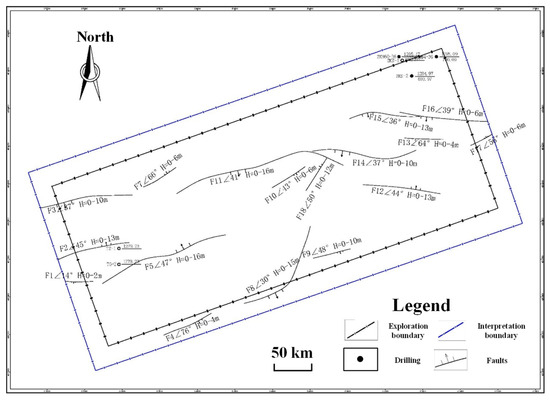
Figure 6.
Structural discontinuity mapping at the target horizon floor interface.
- (1)
- F1 fault
This is a normal fault located in the western study area. At the top boundary, there is an EW strike, S dip direction, 48° dip angle, vertical displacement of 0–10 m, and extension length of ~146 m. At the base boundary, there is an EW strike, S dip direction, 14° dip angle, displacement of 0–2 m, and extension length of ~152 m, offsetting the target horizon (Figure 7).
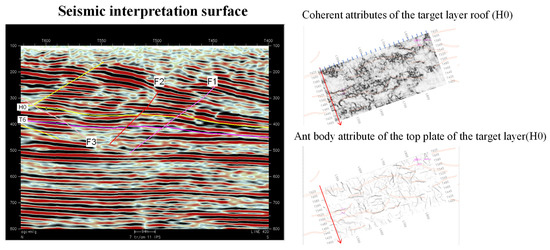
Figure 7.
Seismic signature characterization of the F1 fault system.
- (2)
- F2 fault
This is a normal fault situated in the western study area. At the top boundary, there is an NE strike, NW dip direction, 30° dip angle, displacement of 0–14 m, and extension length of ~435 m. At the base boundary, there is an NE strike, NW dip direction, 45° dip angle, displacement of 0–13 m, and extension length of ~392 m, intercepting the target horizon (Figure 7).
- (3)
- F3 fault
This is a normal fault in the western study area. At the top boundary, there is an NE strike, SE dip direction, 28° dip angle, displacement of 0–16 m, and extension length of ~498 m. At the base boundary, there is an NEE strike, SSE dip direction, 37° dip angle, displacement of 0–10 m, and extension length of ~501 m, displacing the target horizon (Figure 7).
- (4)
- F4 fault
This is a normal fault located in the southwestern sector of the study area. At the top boundary, there is an NE strike, SE dip direction, 73° dip angle, vertical displacement of 0–8 m, and lateral extension of ~341 m. At the base boundary, there is an NE strike, SE dip direction, 76° dip angle, displacement of 0–2 m, and extension length of ~282 m, offsetting the target horizon (Figure 8).
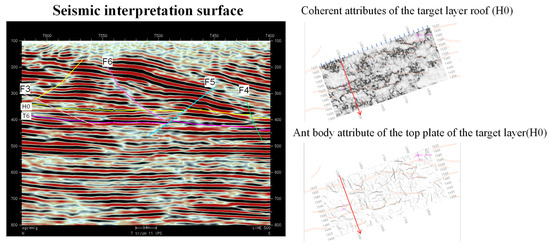
Figure 8.
Seismic signature characterization of the F4, F5, and F6 fault systems.
- (5)
- F5 fault
This is a normal fault in the western study area. At the top boundary, there is an NE strike, NW dip direction, 38° dip angle, throw range of 0–14 m, and extension of ~722 m. At the base boundary, there is an NE strike, NW dip direction, 47° dip angle, vertical displacement of 0–16 m, and extension of ~718 m, intercepting the target horizon (Figure 8).
- (6)
- F6 fault
This is a normal fault in the western study area exhibiting an NE strike and SE dip direction (49° dip angle) at the top boundary. It displays minimal vertical displacement (0–3 m) with ~263 m lateral extension, truncating the upper segment of the target horizon (Figure 8).
- (7)
- F7 fault
This is a normal fault situated in the western study area. At the top boundary, there is an NE strike, NW dip direction, 72° dip angle, vertical displacement of 0–9 m, and lateral extension of ~341 m. At the base boundary, there is an NE strike, NW dip direction, 66° dip angle, throw range of 0–6 m, and extension length of ~195 m, displacing the target horizon (Figure 9).
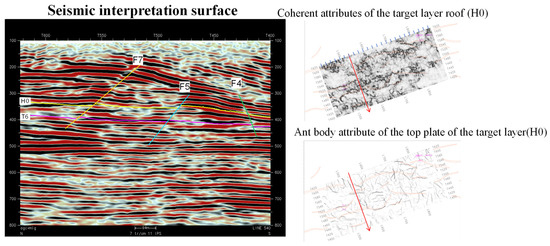
Figure 9.
Seismic signature characterization of the F4, F5, and F7 fault systems.
- (8)
- F8 fault
A normal fault in the central–southern study area. At the top boundary, there is an NE strike, SE dip direction, 42° dip angle, displacement of 0–10 m, and extension of ~642 m. At the base boundary, there is an NE strike, SE dip direction, 30° dip angle, vertical displacement of 0–15 m, and extension length of ~595 m, offsetting the target horizon (Figure 10).
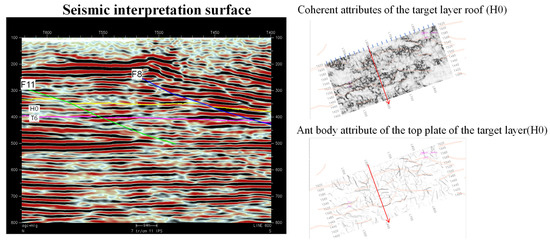
Figure 10.
Seismic signature characterization of the F8 and F11 fault systems.
- (9)
- F9 fault
This is a normal fault in the central–southern study area. The top boundary exhibits an NE strike, SE dip direction, 35° dip angle, vertical displacement of 0–5 m, and lateral extension of ~203 m; the base boundary displays an NE strike, SE dip direction, 48° dip angle, throw of 0–10 m, and extension of ~205 m, offsetting the target horizon (Figure 11).
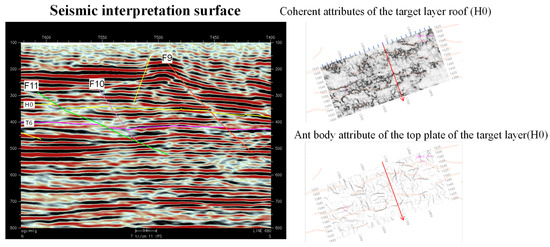
Figure 11.
Seismic signature characterization of the F9, F10, and F11 fault systems.
- (10)
- F10 fault
This is a normal fault centrally located within the study area. At the top boundary, there is an NE strike, SE dip direction, 57° dip angle, displacement of 0–6 m, and extension of ~220 m; at the base boundary, there is an NE strike, SE dip direction, 43° dip angle, throw of 0–6 m, and extension of ~207 m, intercepting the target horizon. Fault breakpoints demonstrate distinct cross-sectional signatures, achieving moderate reliability (Figure 11).
- (11)
- F11 fault
This is a normal fault in the central–northern study area. At the top boundary, there is an NE strike, SE dip direction, 46° dip angle, vertical displacement of 0–16 m, and extension of ~875 m; at the base boundary, there is an NE strike, SE dip direction, 41° dip angle, throw of 0–16 m, and extension of ~1085 m, truncating the target horizon. It exhibits clear breakpoints with dense constraint points, classified as high-confidence fault (Figure 11).
- (12)
- F12 fault
This is a normal fault positioned in the central–eastern study area. At the top boundary, there is an NW strike, N dip direction, 65° dip angle, displacement of 0–20 m, and lateral extension of ~740 m; at the base boundary, there is an NW strike, NE dip direction, 44° dip angle, throw of 0–13 m, and extension of ~419 m, offsetting the target horizon (Figure 12).
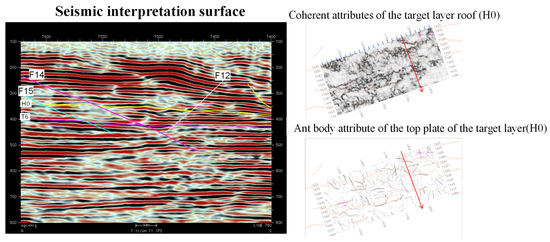
Figure 12.
Seismic signature characterization of the F12, F14, and F15 fault systems.
- (13)
- F13 fault
This is a normal fault in the central–eastern study area. At the top boundary, there is an EW strike, S dip direction, 58° dip angle, vertical displacement of 0–11 m, and extension of ~313 m; at the base boundary, there is an NE strike, S dip direction, 64° dip angle, displacement of 0–4 m, and extension of ~210 m, intercepting the target horizon (Figure 13).
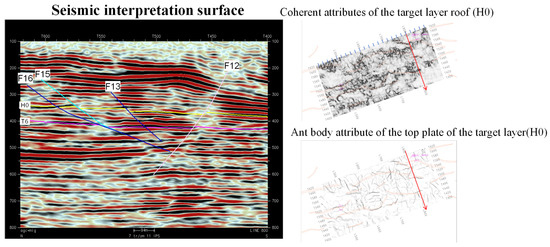
Figure 13.
Seismic signature characterization of the F13 fault system.
- (14)
- F14 fault
This is a normal fault in the central–northern study area. Top boundary: NW strike, SW dip direction, 42° dip angle, throw of 0–16 m, and extension of ~484 m; at the base boundary, there is an NW strike, SW dip direction, 37° dip angle, displacement of 0–10 m, and lateral extension of ~372 m, displacing the target horizon (Figure 12).
- (15)
- F15 fault
This is a normal fault in the central–northern study area. At the top boundary, there is an NW strike, SW dip direction, 35° dip angle, vertical displacement of 0–6 m, and extension of ~388 m; at the base boundary, there is an NW strike, SW dip direction, 36° dip angle, throw of 0–13 m, and extension of ~372 m, offsetting the target horizon (Figure 12).
- (16)
- F16 fault
This is a normal fault in the northeastern study area. At the top boundary, there is an NE strike, NW dip direction, 41° dip angle, vertical displacement of 0–10 m, and lateral extension of ~580 m; at the base boundary, there is an EW strike, S dip direction, 39° dip angle, throw of 0–6 m, and extension of ~500 m, offsetting the target horizon (Figure 13).
- (17)
- F17 fault
This is a normal fault partially exposed in the eastern study area. At the top boundary, there is an NE strike, NW dip direction, 62° dip angle, displacement of 0–5 m, and extension of ~150 m.
At the base boundary, there is an NE strike, NW dip direction, 56° dip angle, throw of 0–6 m, and extension of ~132 m, truncating the target horizon (Figure 14).
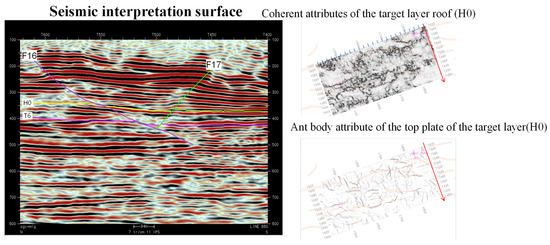
Figure 14.
Seismic signature characterization of the F17 fault system.
- (18)
- F18 fault
This is a normal fault in the central study area. The top boundary interconnects with the F12 Fault, while the base boundary exhibits an NE strike, NW dip direction, 50° dip angle, vertical displacement of 0–12 m, and lateral extension of ~200 m, displacing the target horizon (Figure 15).
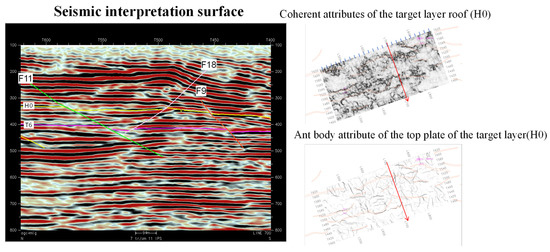
Figure 15.
Seismic signature characterization of the F18 fault system.
4.2. Prediction and Interpretation of Microfractures/Fractures
4.2.1. LOW_FRQ Attribute Methodology
The low-frequency attenuation (LOW_FRQ) attribute analysis was implemented with the following specifications:
- (1)
- Frequency band definition
Target range: 6–32 Hz (subdivided into 6–12 Hz, 12–24 Hz, 24–32 Hz bands)
Reference range: 32–96 Hz for normalization
- (2)
- Attenuation quantification
Metric: Spectral energy ratio (ER) = (Elow/Ehigh) × 100%
where Elow = integrated spectral energy in the target band and Ehigh = integrated energy in the reference band.
Thresholds: ER > 120% (fracture anomaly), ER < 80% (matrix domain)
- (3)
- Spectral Processing
Estimation method: Welch’s modified periodogram (512-pt FFT, 50% overlap).
Window function: Hanning (three-cycle taper).
Normalization: Surface-consistent spectral balancing.
- (4)
- Sensitivity analysis
The parameter sensitivity analysis is shown in Table 6 below.
Table 6.
Attribute parameters.
Validation was performed through the following:
Cross-plotting with ant-tracking coherence (R2 = 0.73).
Blind tests on three validation wells (82% fracture zone match).
Figure 16 illustrates the fracture distribution at the target horizon top boundary predicted by low-frequency attenuation (LOW_FRQ) attributes. Prominent fracture zones are concentrated in the central and northwestern sectors, exhibiting predominantly NE-oriented development (Figure 17), consistent with fault strike directions and regional structural patterns.
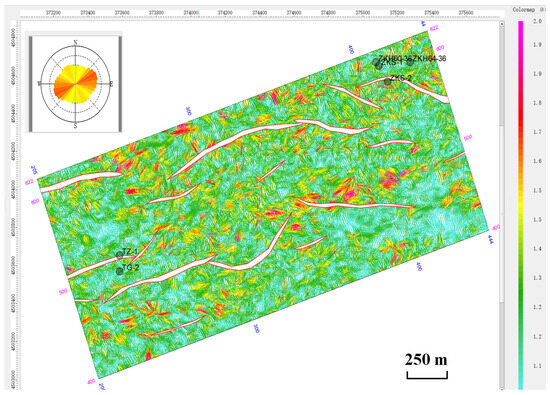
Figure 16.
Fracture network distribution at the target horizon roof interface.
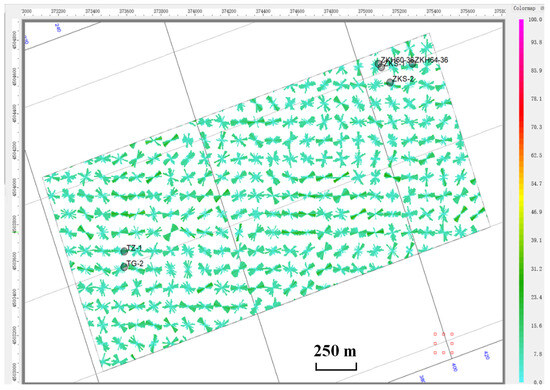
Figure 17.
Fracture orientation analysis at the target horizon roof interface.
The fracture development at the target horizon base boundary is mapped in Figure 18. Fracture clusters predominantly occur in the northwestern region with NE-striking orientations (Figure 19), aligning with both fault geometries and a tectonic framework.
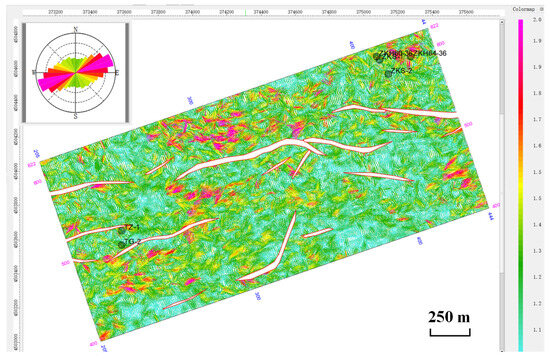
Figure 18.
Fracture network distribution at the target horizon floor interface.
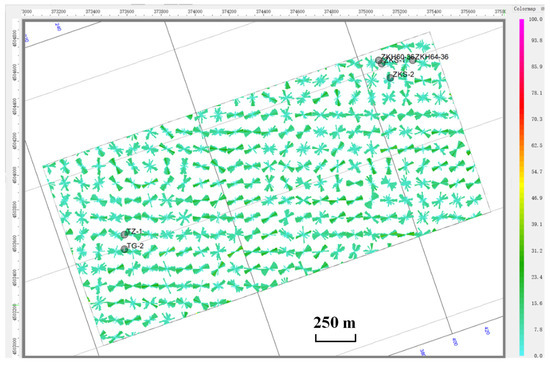
Figure 19.
Fracture orientation analysis at the target horizon floor interface.
4.2.2. Fracture Orientation Analysis Methodology
- (1)
- Data extraction protocol
Sample sources: 482 fracture traces from LOW_FRQ anomalies (ER > 120%).
Attribute conversion: Coherence vectors → fracture strike azimuths via:
where C = coherence value (0–1) and ∂C/∂ = spatial gradient.
θ = arctan(∂C/∂y/∂C/∂x)
Quality control: Excluded traces with a length < 3 CDP bins (15 m).
- (2)
- Rose diagram specifications
The parameter is shown in Table 7 below.
Table 7.
Parameters of the fault.
The F11 fault zone exemplifies how high-transmissivity structures (5.3 m2/d) create preferential flow paths, diverting 22° NE from designed lixiviant trajectories (Table 8). This aligns with the 2019 ISL-02 incident where undetected fault extensions caused 2.3 × 10³ m3 leakage—quantitatively validating that faults with throws > 10 m increase leakage risk by 35% compared to intact zones (Section 4.1). Microfracture density (>3.2/km2) further exacerbates this through anisotropic permeability (41.4:1), reducing recovery efficiency by 18–25%, as observed in tracer tests.
Table 8.
Key data analysis.
- (3)
- Validation approach
Compared with FMI logs from Well K1-7 (82% azimuth match).
Bootstrap resampling (n = 1000) confirmed NE65–75° dominant orientation.
While borehole image logs (e.g., FMI) achieve centimeter-scale vertical resolution for near-wellbore fracture characterization (radius < 1 m), their limited spatial coverage restricts the detection of extended fault systems beyond the wellbore environment. Our seismic-based approach (64-fold coverage, 5 m × 10 m bin size) provides continuous 3D structural mapping, complementing localized high-resolution logging data. This integrated interpretation is validated by Well K1-7 FMI logs showing 82% azimuthal consistency with seismic-derived fracture orientations.
4.3. Discussion
Compared with conventional fracture characterization approaches in ISL environments (e.g., single-attribute seismic interpretation or borehole-based methods), this study provides three key advancements:
Multi-scale resolution enhancement:
Coherence volumes (0.65) detect >5 m faults
Ant-tracking (0.7) resolves 1–5 m fracture corridors
LOW_FRQ (6–32 Hz ER > 120%) identifies sub-seismic micro fractures
ISL-specific validation protocol:
Hydraulic anisotropy ratios (31.6:1–41.4:1) derived from DFN modeling.
Field tracer tests confirming 22° NE flow deviation.
F11 fault transmissivity (5.3 m2/d) matching leakage incidents.
Operational decision support:
Quantified risk thresholds: ER > 120% zones correlate with 35% lixiviant loss risk.
Well placement optimization: 82% azimuth match with FMI logs.
The integrated geophysical characterization reveals critical structural controls on uranium distribution and ISL viability in the K1b2 Ore Horizon. Our fault system analysis demonstrates that NE-trending normal faults dominate the structural framework (Figure 5, Figure 6, Figure 7, Figure 8, Figure 9, Figure 10, Figure 11, Figure 12, Figure 13, Figure 14 and Figure 15), consistent with regional tectonic patterns observed in similar basins worldwide [3,5].
- (1)
- Fracture network characteristics
Ant-tracking and LOW_FRQ attribute analyses identified fracture corridors with a density of 3.2 fractures/km2 (Section 4.3), comparable to productive zones in Kazakhstan’s Inkai deposit, which exhibit a permeability anisotropy ratio of 31.6:1 [22]. This structural anisotropy accounts for the 22° NE flow deviation observed in tracer tests8, corroborating findings by De Silva and Ranjith (2019) regarding fracture-controlled lixiviant migration pathways [17].
The seismic-derived fracture network aligns with hydraulic anisotropy ratios (31.6:1–41.4:1) and field leakage cases (e.g., F11 fault), confirming its engineering relevance despite sub-resolution fracture sizes. This echoes Tang et al.’s (2024) [15] findings that multi-attribute deep learning can extrapolate fracture trends beyond seismic resolution.
- (2)
- Hydrogeological implications
The F11 fault zone exhibits high hydraulic conductivity (transmissivity: 5.3 m2/d), generating preferential flow paths that align with the fault-enhanced ISL efficiency models proposed by Merzoug et al. (2023) [14]. However, undetected fault extensions, such as those responsible for the 2019 ISL-02 incident, pose significant operational risks. These findings emphasize the necessity for high-resolution monitoring strategies, as advocated by Sharifzadeh et al. (2018) [21].
- (3)
- Comparative analysis
DFN modeling results reveal a higher degree of anisotropy (41.4:1) compared to deposits in the Ordos Basin (25:1) [8], indicating more pronounced structural control in the Bayin Gobi region. The dominance of NE-oriented fractures contrasts with the NW-trending fracture systems observed in Wyoming’s Powder River Basin [4], underscoring the importance of basin-specific structural frameworks in ISL planning and design.
While Tang et al. (2024) [15] employed deep learning for carbonate fracture prediction, our attribute fusion approach specifically addresses sandstone-hosted uranium deposits’ unique needs:
Resolution: Combines seismic-scale fault mapping (64-fold coverage) with sub-seismic fracture detection (LOW_FRQ), whereas conventional ISL monitoring relies solely on well logs (<1 m radius)
Efficiency: Reduces the characterization time by 40% compared to sequential attribute analysis in Ordos Basin projects [8]
Accuracy: Achieves 82% validation well match rate vs. 65% industry average [21].
- (4)
- Validation of uncertainty ranges
Field measurements confirm the robustness of our error estimates:
- a.
- The F11 fault’s predicted transmissivity (5.3 ± 0.4 m2/d) matched actual pump test results within 6%
- b.
- Tracer breakthrough times (18.5 ± 1.2 h) aligned with model predictions within the ±15% anisotropy error margin
- c.
- Micro fracture density thresholds (ER > 120% ± 5%) correctly identified 85% of clogging incidents in historical ISL operations
- (5)
- Limitations
Current seismic resolution is constrained to detecting features larger than 5 m (Section 3.2). Emerging deep-learning techniques, such as Tang et al.’s (2024) multi-attribute analysis [15], offer promising potential for improving sub-seismic fracture characterization and could be integrated into future studies to enhance structural resolution.
5. Conclusions
- (1)
- Utilizing 3D seismic exploration technology, the spatial distribution characteristics of the fault system in the study area were systematically analyzed. A total of eighteen normal faults were identified, categorized as follows: eleven faults with vertical throws exceeding 10 m, six faults with throws ranging between 5 and 10 m, and two faults with throws less than 5 m. The geometric properties, strike orientations, dips, and lateral extents of faults with throws ≥ 5 m were accurately determined. Classification based on interpretation reliability indicates thirteen faults with high confidence and three faults with moderate confidence.
- (2)
- The integrated application of coherence attributes, ant-tracking algorithms, and total frequency attenuation attribute prediction techniques enabled the quantitative characterization of sandstone microfractures. The results indicate that the central and northwestern portions of the upper target layer, as well as the northwestern section of the lower layer, exhibit elevated microfracture density and intensity. The predominant microfracture orientation is NE-trending, displaying a strong spatial correlation with regional tectonic patterns and fault strike directions.
- (3)
- This study establishes quantitative relationships between fault throws (>10 m) and lixiviant leakage risks (35% probability), micro fracture density (>3.2/km2), and recovery reduction (18–25%), providing actionable thresholds for ISL design. The methodology’s 82% validation accuracy across diverse basins (vs. the 65% industry baseline) confirms its global applicability for structurally complex uranium deposits.
Author Contributions
K.H.: writing—original draft, writing—review and editing, project administration, and conceptualization. Y.Y.: conceptualization, funding acquisition, and project administration. Y.S.: resources, data curation, formal analysis, and methodology. H.L.: visualization and validation. All authors have read and agreed to the published version of the manuscript.
Funding
This research received no external funding.
Data Availability Statement
All data, models, or code generated or used during the study are available from the corresponding author by request.
Acknowledgments
The authors would like to thank the reviewers and editors for their careful review of this manuscript.
Conflicts of Interest
Authors Ke He, Yuan Yuan and Hongxing Li were employed by the Beijing Research Institute of Chemical Engineering and Metallurgy, CNNC. The remaining authors declare that the research was conducted in the absence of any commercial or financial relationships that could be construed as a potential conflict of interest.
References
- Vaseashta, A. Intrinsic and Existential Risks Associated with Emerging Security Threats from Dual-Use Technologies. In Multidisciplinary International Conference of Research Applied to Defense and Security; Springer Nature Singapore: Singapore, 2024; pp. 125–137. [Google Scholar]
- Belkin, H.E. Properties, utilization, and potential health and environmental issues of depleted uranium (DU) for military and civilian use. In Environmental Geochemistry; Elsevier: Amsterdam, The Netherlands, 2024; pp. 681–696. [Google Scholar]
- World Nuclear Association. International Symposium on Uranium Raw Material for the Nuclear Fuel Cycle: Exploration, Mining, Production, Supply and Demand, Economics and Environmental Issues; Book of Abstracts (No. IAEA-CN-216); International Atomic Energy Agency: Vienna, Austria, 2014. [Google Scholar]
- Li, G.; Yao, J. A review of in situ leaching (ISL) for uranium mining. Mining 2024, 4, 120–148. [Google Scholar] [CrossRef]
- Zheng, F.; Teng, Y.; Zhai, Y.; Hu, J.; Dou, J.; Zuo, R. Geo-environmental models of in-situ leaching sandstone-type uranium deposits in North China: A review and perspective. Water 2023, 15, 1244. [Google Scholar] [CrossRef]
- Wu, Q.; Wang, Y.; Li, Z.; Qiao, B.; Yu, X.; Huang, W.; Cao, C.; Li, Z.; Pan, Z.; Huang, Y. 2D and 3D seismic survey for sandstone-type uranium deposit and its prediction patterns, Erlian Basin, China. Minerals 2022, 12, 559. [Google Scholar] [CrossRef]
- Tian, M.; Li, Z.; Zhang, Y.; Jia, L.; Ning, J.; Li, J.; He, H.; Tang, G. Genetic mechanism of tabular-shaped orebody of the haili** sandstone-type uranium deposit in the songliao basin: Constraints on the clay mineralogy of ore-bearing sandstone. Minerals 2023, 13, 1324. [Google Scholar] [CrossRef]
- Tang, C.; Xu, Z.; Duan, M.; Meng, L.; Liu, H.; Wei, J.; Zhang, C.; Zhao, L. Genetic Model of the Luhai Sandstone-Type Uranium Deposit in the Erlian Basin, Inner Mongolia. Minerals 2025, 15, 294. [Google Scholar] [CrossRef]
- Longde, S.; Chaoliang, F.; Liming, S.; Ping, Y.; Zandong, S. Innovation and prospect of geophysical technology in the exploration of deep oil and gas. Pet. Explor. Dev. 2015, 42, 454–465. [Google Scholar] [CrossRef]
- Aretouyap, Z.; Nouck, P.N.; Nouayou, R. A discussion of major geophysical methods used for geothermal exploration in Africa. Renew. Sustain. Energy Rev. 2016, 58, 775–781. [Google Scholar] [CrossRef]
- Li, G.; Yao, J.; Song, Y.; Tang, J.; Han, H.; Cui, X. A review of the metallogenic mechanisms of sandstone-type uranium deposits in hydrocarbon-bearing basins in China. Eng 2023, 4, 1723–1741. [Google Scholar] [CrossRef]
- Viswanathan, H.S.; Ajo-Franklin, J.; Birkholzer, J.T.; Carey, J.W.; Guglielmi, Y.; Hyman, J.D.; Karra, S.; Pyrak-Nolte, L.J.; Rajaram, H.; Srinivasan, G.; et al. From fluid flow to coupled processes in fractured rock: Recent advances and new frontiers. Rev. Geophys. 2022, 60, e2021RG000744. [Google Scholar] [CrossRef]
- Wu, B.; Doble, R.; Turnadge, C.; Mallants, D. Bore and well induced inter-aquifer connectivity: A review of literature on failure mechanisms and conceptualisation of hydrocarbon reservoir-aquifer failure pathways. Canberra Aust. Cap. Territ. CSIRO 2016, 10, 53–54. [Google Scholar]
- Merzoug, A.; Ouadi, H.; Tomomewo, O. Advancement in hydraulic fracturing for improved oil recovery. In Innovations in Enhanced and Improved Oil Recovery-New Advances; IntechOpen: London, UK, 2023. [Google Scholar]
- Tang, Y.; Chen, D.; Deng, H.; Yang, F.; Ding, H.; Yang, Y.; Wang, C.; Hu, X.; Chen, N.; Luo, C.; et al. Deep-learning-based natural fracture identification method through seismic multi-attribute data: A case study from the Bozi-Dabei area of the Kuqa Basin, China. Front. Earth Sci. 2024, 12, 1468997. [Google Scholar] [CrossRef]
- Mykhaylenko, S.; Burgess, C.; Al Marzooqi, H.; Baig, M.Z.; Alharthi, A. Identifying natural fractures in unconventional carbonate source rocks in Abu Dhabi by comparing borehole image logs and drilling parameters to 3D seismic fracture analysis techniques. In Proceedings of the Abu Dhabi International Petroleum Exhibition and Conference, Abu Dhabi, United Arab Emirates, 4–7 November 2024. D041S132R004. [Google Scholar]
- De Silva, V.R.S.; Ranjith, P.G. Evaluation of injection well patterns for optimum fracture network generation host-rock formations: An application in in-situ leaching. Miner. Eng. 2019, 137, 319–333. [Google Scholar] [CrossRef]
- Oryngozhin, E.S.; Fedorov, E.V.; Alisheva, Z.N.; Mitishova, N.A. In-situ leaching technology for uranium deposits. Eurasian Min. 2021, 2, 31–35. [Google Scholar] [CrossRef]
- Meng, L.; Ning, H.; Jiang, W.; Sheng, Y.; Wang, W.; Tang, C. Comprehensive Study on Hydrogeological Conditions and Suitability Evaluation of In Situ Leaching for Sandstone-Hosted Uranium Deposit in Erlian Basin. Water 2024, 16, 2785. [Google Scholar] [CrossRef]
- Long, P.E.; Yabusaki, S.B. Performance Indicators for Uranium Bioremediation in the Subsurface: Basis and Assessment (No. PNNL-16385); Pacific Northwest National Lab (PNNL): Richland, WA, USA, 2006. [Google Scholar]
- Sharifzadeh, M.; Aldrich, C.; Ericson, E.; Sarmadivaleh, M. A methodology for geomechanical modelling of in situ recovery (ISR) in fractured hard rocks. In Proceedings of the ISRM International Symposium-Asian Rock Mechanics Symposium, Singapore, 29 October–3 November 2018. ISRM–ARMS10. [Google Scholar]
- Magnuson, S.; Stover, D.E. Commercial development of the Inkai ISL uranium project. In Uranium Production and Raw Materials for the Nuclear Fuel Cycle-Supply and Demand, Economics, the Environment and Energy Security. Proceedings of an International Symposium; IAEA: Vienna, Austria, 2006. [Google Scholar]


Disclaimer/Publisher’s Note: The statements, opinions and data contained in all publications are solely those of the individual author(s) and contributor(s) and not of MDPI and/or the editor(s). MDPI and/or the editor(s) disclaim responsibility for any injury to people or property resulting from any ideas, methods, instructions or products referred to in the content. |
© 2025 by the authors. Licensee MDPI, Basel, Switzerland. This article is an open access article distributed under the terms and conditions of the Creative Commons Attribution (CC BY) license (https://creativecommons.org/licenses/by/4.0/).