Abstract
Acoustic emission (AE) is a passive non-destructive testing (NDT) method that allows for online monitoring of oil tank bottom corrosion without production shutdown. However, AE signals are susceptible to ambient noise interference, causing the AE inspection system to mistakenly identify noise as corrosion signals, which significantly reduces AE inspection performance. Therefore, it is important to distinguish between AE signals caused by corrosion and those caused by noise. To address this, an AE inspection platform for vertical atmospheric tank corrosion is established. Six common noise sources in field AE inspections, including mechanical vibration and friction, fluid and raining disturbance, external impacts, and oil leakage are simulated. The impacts of these noises on AE location events are analyzed. Variational mode decomposition (VMD) and dispersion entropy (DE) are used to extract multi-domain features of AE signals. An improved distance evaluation (IDE) algorithm is then introduced to obtain a highly correlated feature subset. A support vector machine (SVM) model optimized by the bald eagle search (BES) algorithm is proposed to identify different noise sources. Field experiments demonstrate that for mechanical friction, external impacts, and effective corrosion signals, the proposed method achieves identification accuracy of 92.95% and 94.00% in the training and test sets, respectively. This proves the reliability of the BES-SVM model, which uses multi-domain features for AE source identification in oil tank bottom corrosion inspections. Moreover, the impacts of the optimization algorithm, feature selection algorithm, and feature type on AE source identification are further investigated.
1. Introduction
Oil tanks are among the most essential equipment in the petroleum industry for oil storage. Oil tanks inevitably experience corrosion during long-term use. As stored oils are generally flammable, explosive, and toxic, once corrosion perforation leakage occurs, the consequence is usually disastrous [,]. Compared with oil tank walls and roofs, the bottoms are more likely to corrode and are more difficult to inspect []. Conventional nondestructive testing (NDT) technologies, such as ultrasonic testing, magnetic flux leakage, and magnetic particle inspection, require various procedures, including production suspension, gas replacement, and tank cleaning, wherein the last step is corrosion inspection. The complex inspection procedures make these approaches laborious, time-consuming, and highly expensive []. AE inspection is an emerging passive NDT technique that dynamically monitors the generation, development, and evolution of material damage without production shutdown, which saves significant time and inspection costs [,]. Defects such as corrosion, stress cracking, and friction create rapid energy release from the source and generate vibrations. The vibrations propagate to the surface in the form of stress waves, resulting in surface displacement, which can be detected by highly sensitive AE sensors and converted into electrical signals for further analysis []. Currently, assessment of the area and degree of corrosion is mainly based on the density distribution of AE events [], which can easily be produced by noises such as mechanical vibrations and fluid disturbances during AE inspection. These noises are easily mistaken for corrosion events and affect the inspection results. Therefore, limiting the interference of noise signals in corrosion evaluation is a critical challenge for AE inspections of oil tank bottom corrosion.
To reduce noise interference, the signal acquisition threshold is increased to filter out low-amplitude signals that are overwhelmingly produced by ambient noises. As corrosion AE signals are generally weak, an excessively high acquisition threshold can result in the loss of considerable valid information [,]. In recent years, several works have been carried out regarding the acquisition of corrosion signals in high noise environments. Haile et al. [] proposed a distributed sensing network for defect detection in large composite structures, capable of localizing damage in complex data and system environments. Raorane et al. [] determined the optimal and suboptimal sensor cluster locations for AE source localization in isotropic plates using a Bayesian-optimized sensor placement methodology. Zhang et al. [] proposed a phased array localization strategy that effectively improved the localization accuracy of hollow structures. The reliability of AE inspection can be enhanced not only by optimizing the arrangement of sensors and localization algorithms but also by implementing guard sensors. These sensors can help eliminate noise interference form specific directions, such as friction noise from two ends of a specimen [], droplet noises from a storage tank roof [], and mechanical noise from oil flow [].
Although hardware filtering and signal acquisition techniques have been proven effective in eliminating specific noise interference, these methods face difficulties in more complex testing environments []. Signal decomposition can effectively separate primary AE source components, such as corrosion and cracks from secondary components generated by mechanical vibrations and other sources []. Wavelet transform (WT) and empirical modal decomposition (EMD) provide abundant information about AE signals and significantly help in identifying AE sources. Xu et al. [] demonstrated the effectiveness of WT in the damage detection of composite materials, highlighting the ability of AE signals to characterize processes such as micro-crack formation and crack propagation. Fan et al. [] proposed an improved EMD method that successfully separated the fault diagnosis AE signals of dry gas seal in the start–stop phase from ambient noises. Works have also been carried out to demonstrate the advantages of the signal decomposition method in extracting valid AE signals from strong noisy environments []. Variational mode decomposition (VMD) is a non-recursive model that overcomes mode aliasing issues of EMD and is more robust to noise []. Although feature vectors combining VMD with various types of entropy have the ability to characterize time–frequency domain properties of AE signals, the problem of insufficient feature extraction still exists.
The classification of different AE signal sources has been investigated in a variety of fields. Qiu et al. [] developed a deep learning convolutional neural network to create a hydrogen defect recognition model, using short-time Fourier transform inputs for feature vector extraction of AE signals representing various damage states. Huang et al. [] utilized AE sensors to collect sound signals of common fault types in electric gate valves in nuclear power plants. A Gated Recurrent Unit Autoencoder (GRU-AE) was employed for fault classification. Zhu et al. [] developed a dual-branch deep convolutional neural network (DB-DCNN) that integrates fast Fourier transform (FFT) and variational mode decomposition (VMD) for concrete stress state identification. Hesser et al. [] proposed a novel approach based on convolutional neural networks and deep transfer learning to identify different types of AE sources for structural health monitoring (SHM) of mechanical and civil engineering components in service. These works have illustrated that AE source identification might also be promising in oil tank bottom corrosion inspection. However, in practice, it is severely affected by interference from noisy environments. With the development of artificial intelligence, machine learning has been widely used in prediction and mode recognition [,,]. This work builds an experimental platform for AE inspection of oil tank bottom corrosion. A multi-domain feature extraction method and a BES-SVM model are proposed to identify AE signals from different noise sources. The identification performance is verified with indoor and field experiments. The key novelty of this work is the introduction of time–frequency domain features and feasibility validation using an actual fixed-roof vertical metal tank model. This approach could be a powerful tool for noise identification in acoustic emission (AE) inspection of oil tank bottom corrosion.
2. Experimental Section
2.1. Experimental Equipment
As shown in Figure 1, the AE inspection platform for oil tank bottom corrosion mainly consisted of an oil tank and an AE inspection system. The oil tank was made from Q235 steel, which is widely used in the petrochemical industry. The diameter, height and wall thickness of the oil tank were 612, 1012, and 6 mm, respectively. It was equipped with a speed-adjustable and corrosion-resistant circulating pump to create mechanical vibration and fluid disturbance. Three needle valves were installed at the tank bottom to simulate oil leakage. To ensure good contact between the AE sensors and outer wall of the oil tank, the AE sensors were mounted on the polished surface on the outside of the oil tank wall at heights of 5, 10, 15, and 20 cm from the bottom.
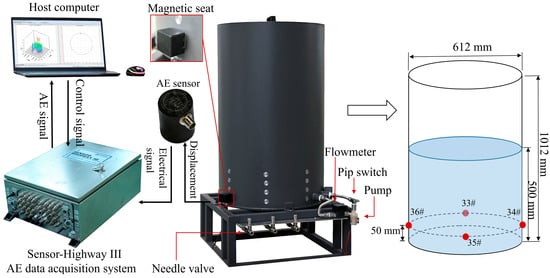
Figure 1.
Schematic diagram of AE inspection platform for oil tank bottom corrosion.
The AE inspection host, AE sensors, and upper computer constituted the AE inspection system. The host was a 16-channel Sensor-Highway III (Physical Acoustics Corporation, Princeton, NJ, USA). Based on the frequency of the metal corrosion signal, preamplifier-integrated sensors (ISPK3I) were used. The sampling frequency was set to 0.5 MHz. The hardware analog filter had a passband ranging from 20 to 100 kHz. At a height of 5 cm from the bottom, AE sensors were horizontally fixed at equal intervals around the polished surface of the tank wall. The parameter settings of the AE host were determined, and preliminary data processing was performed on the upper computer with AE analysis software AE Win.
2.2. Noise Simulation
To identify different noise sources in actual AE inspection, experiments with simulated noises were performed. Mechanical vibrations and fluid disturbances were generated through idle pumping and water circulation, respectively. Sandpaper was used to rub the oil tank to simulate mechanical friction between its different components. A showerhead was employed to rinse the tank, mimicking disturbances from rainy weather. External impacts were simulated by striking the tank wall. Oil leakage was achieved by slightly opening the needle valves at the bottom.
2.3. Experimental Procedure
- (1)
- Preparation: First, 3 wt% NaCl solution was used as the corrosive liquid and added to the tank, completely covering the bottom and reaching a sufficient liquid level. Then, AE sensors were fixed to the polished points with a magnetic fixture and coupling agent.
- (2)
- Parameter settings: The sensitivity of the AE inspection system was tested by breaking pencil lead on the oil tank wall. Then, the liquid in the oil tank was kept still for background noise acquisition, which helped set the AE signal threshold for testing. Table 1 provides the key parameters for AE inspection.
 Table 1. Parameter settings for AE inspection.
- (3)
- Signal acquisition: AE signals were continuously collected below the threshold to make sure the corrosion signal was dominant. Then simulate different noises and record the time to facilitate subsequent addi-tion of noise data labels.
- (4)
- Data processing. AE signal waveform is exported from the analysis software and labeled with noise types on a time basis.
2.4. Interference of Noise in AE Inspection of Oil Tank Corrosion
When the corrosive liquid in the oil tank completely stood still, a 25 dB initial threshold was employed to test the background noise. A scatter diagram of the AE signal amplitude and peak frequency is shown in Figure 2a. The majority of AE signal amplitudes were concentrated between 25 and 50 dB, particularly at lower amplitudes. Additionally, the 50 Hz peak frequency formed a nearly straight line, which is far beyond the range of normal corrosion signals. When external noise was excluded, it was inferred that electromagnetic interference occurred within the AE instrument.
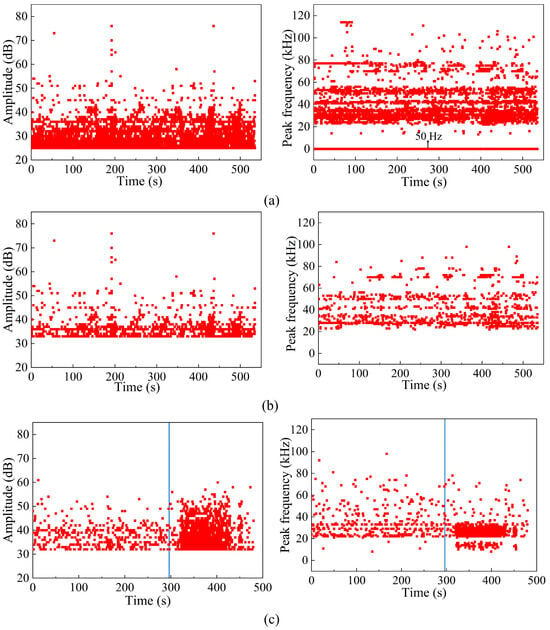
Figure 2.
Scatter diagrams of AE signals: (a) amplitude and peak frequency at 25 dB threshold; (b) amplitude and peak frequency at 32 dB threshold; (c) amplitude and peak frequency with and without noise.
Next, the threshold was increased to 32 dB, and the specific peak frequency noise was eliminated with a digital filter. As shown in Figure 2b, the amplitude and peak frequency of the AE signal were more scattered without the 50 Hz line. The peak frequency was mainly concentrated between 20 and 60 kHz, which corresponds well with the typical characteristics of AE signals from metal corrosion, which generally have a peak frequency of around 50 kHz and an amplitude over 31 dB. This indicates that electromagnetic noise within the instrument was excluded. By raising the amplitude threshold, electromagnetic interference can be effectively reduced at the cost of losing some low-amplitude corrosion signals. The retained information is sufficient to diagnose the corrosion status of oil tank bottoms.
Figure 2c presents the amplitude and peak frequency of the AE signals with and without noise. The application of friction noise begins at the vertical blue line. It is clear that the amplitude of oil tank bottom corrosion was mainly distributed between 32 and 60 dB, and the peak frequency between 20 and 60 kHz. When friction was applied, the density of data points increased sharply without obvious differences in the amplitude or peak frequency ranges. A similar phenomenon also occurred in other noise interference conditions. Therefore, the threshold and filter were not sufficient to eliminate noise interference.
Figure 3 presents the AE signal localization at the oil tank bottom with and without friction noise. When friction was not applied, AE events were intense in the squared area (see Figure 3a), indicating active corrosion in this region. When the oil tank wall was rubbed by sandpaper, another larger area of intense AE events formed (see Figure 3b), identified as corrosion events in AE inspection. Therefore, false identification of oil tank bottom corrosion necessitates distinguishing different types of noise interference in AE inspection of oil tanks.
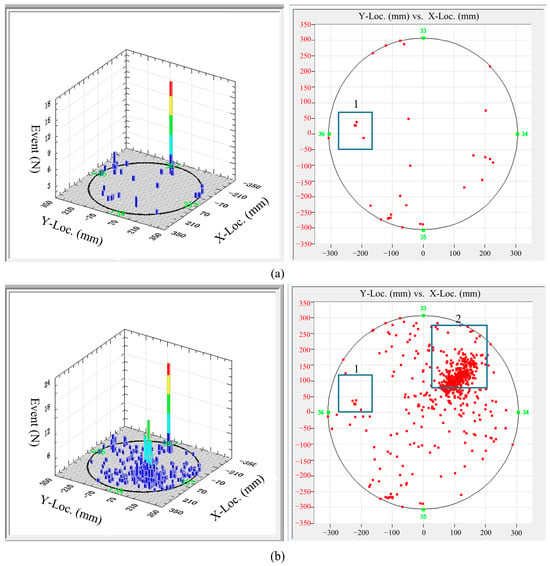
Figure 3.
Three-dimensional and planar location maps of AE events at the bottom of an oil tank (a) without friction noise and (b) with friction noise.
3. Feature Extraction
3.1. Time-Domain Features
Time-domain features are commonly used in AE signal recognition. As shown in Table 2, 14 time-domain features were extracted from the original AE signal, including 8 dimensional features (maximum, minimum, peak, mean, variance, standard deviation, quadratic mean and root mean square) and 6 dimensionless features (kurtosis, skewness, waveform factor, crest factor, pulse factor and margin factor).

Table 2.
Time-domain features.
3.2. Frequency-Domain Features
Fast Fourier transform (FFT) is used to transform time-domain signals into frequency-domain signals, reflecting the relationship between amplitude and frequency. Six frequency-domain features were extracted (see Table 3), including the centroid frequency, which describes the frequency of the dominant signal component in the spectrum; the mean square frequency and root mean square frequency, which characterize the distribution of the amplitude-dominant frequency band; the frequency variance and frequency standard deviation, which reflect the dispersion of spectral energy; and the spectrum mean, which indicates the mean amplitude of the spectrum.

Table 3.
Frequency-domain features.
3.3. Time–Frequency Domain Feature Extraction
Compared with FFT, which only provides the global frequency information of AE signals, variational mode decomposition (VMD) serves as an effective method to capture the local features of AE signals in the time and frequency domains []. To better characterize AE signals triggered by different AE sources, the VMD algorithm was used to decompose the AE waveform into K intrinsic mode function (IMF) components containing different time–frequency information. Then, time–frequency domain features were obtained by calculating the energy and dispersion entropy of each IMF.
3.3.1. VMD
Unlike traditional recursive decomposition algorithms, the VMD algorithm is an adaptive and completely non-recursive signal decomposition method. It decomposes the original signal into multiple IMFs by solving the optimal solution of a constrained variational model, which is given by
where uk and ωk represent the k-th IMF modulus and its central frequency, respectively; is the Dirac operator. Then, penalty factor α and Lagrangian λ(t) were introduced to solve the constrained variational model. The variational problem can be further described as
The augmented Lagrange function was solved using the alternating direction multiplier method, which continuously updates the variables, including , and , until the termination standard is met.
3.3.2. Dispersion Entropy (DE)
Dispersion entropy (DE) is a parameter that describes the irregularity of a time series signal []. For a time series signal xi with a length of N, a normal distribution function is initially applied to map the time-domain signal x to y = {y1,y2,…,yN}, y ∈ (0,1), then map y to [1,2,…,c], obtaining the mapping of signal x(i) in the c-th class
where represents the i-th element of the c-th class in the classification timing sequence, and round(·) is the rounding function.
Define embedding dimension m and delay coefficient τ to get the embedding vector . Since , and , dispersal pattern of is obtained. The probability of each dispersal pattern is calculated using
where represents the number of mappings from to . In this work, the key parameters of DE were determined as follows: embedding dimension m = 3, number of classes c = 6, and time delay τ = 1. Among these parameters, embedding dimension m = 3 ensured that the signal complexity can be fully described while avoiding statistical instability caused by excessively high sample dimensions. The number of classes c was used to map the signal to a discrete state. Six classes of dispersion entropies effectively suppressed noise interference while maintaining sufficient resolution. Taking into account the sampling frequency and autocorrelation characteristics of the signal, when τ = 1, adjacent data points effectively reflect the dynamics of the system.
Finally, dispersion entropy was calculated based on Shannon’s entropy theory:
3.3.3. Multi-Domain Feature Dataset
To extract more information from AE sources, the VMD algorithm was applied to decompose AE waveform signals into K IMF components. The selection of K affects the decomposition performance of VMD. When K is too small, key information of the signal is easily lost. When K is too large, it may cause mode mixing phenomena. In this work, K was determined mainly through empirical optimization of the classification effect. Specifically, multiple sets of experiments were conducted on time–frequency features under different K values (5–12) to observe the classification accuracy of the model. The results show that the classification accuracy was highest when K = 10. By calculating the energy and DE of the IMF components, time–frequency domain features were extracted from the AE waveform signals. A multi-domain feature dataset was constructed by integrating the time-domain, frequency-domain, and time–frequency-domain features. The detailed steps for time–frequency domain feature extraction are outlined as follows.
Initially, the VMD algorithm was used to decompose the AE signals into a series of IMF components ϕ(i), j = 1,2,…,K, where K is the number of decomposition levels. Then, the energy of each IMF components was calculated using
Using Equation (8), each IMF component was calculated to obtain the dispersion entropy, and then a normalized dispersion entropy feature DFj was obtained as follows:
Finally, a high-dimensional feature dataset HF was obtained by combining different types of features:
where q is the total number of samples, and the high-dimensional feature dataset HF is a q-by-40 matrix.
3.4. Feature Selection Based on IDE
Selecting the proper feature subset is a key step in constructing a classification model for noise sources in AE inspection. The purpose of feature selection is to obtain the most discriminating feature subset from a high-dimensional feature dataset []. Distance evaluation is an effective approach for feature dimension reduction. This method evaluates the degree of importance of different features by calculating the distances between them. The distance characterizes the consistency and stability of the features within the feature space, forming the basis for feature selection. The improved distance evaluation (IDE) is a feature selection approach based on distance and variance []. Both intra-class distance and inter-class distance are considered, and a reward factor is introduced to help balance the influence of inter-class variance and intra-class variance. The reward factor βj is given by
where and denote intra-class variance and average inter-class variance for feature j, respectively.
Small intra-class variance indicates that samples within the same class vary less, meaning this parameter better represents the feature class. Inter-class variance represents differences between classes and is effective for class identification. Normalized feature scores are obtained by
where and denote the intra-class mean distance and inter-class mean distance for feature j.
4. BES-SVM Model for AE Source Identification
Support vector machine (SVM) is an efficient machine learning algorithm. It is advantageous in solving small sample classification problems []. Meanwhile, the introduction of a kernel function helps to overcome the challenges of dimensionality and nonlinear separability while reducing computational complexity. Therefore, in this work, SVM was employed to identify AE sources from oil tank bottom corrosion. Classification performance of SVM is affected by core hyperparameters, including the penalty factor C and kernel function parameter g [].
The penalty factor C is a regularization parameter in soft-margin SVM that balances “maximizing the classification margin” and “minimizing classification errors”. It controls the penalty intensity for misclassified samples. In objective functions of soft-margin SVM, the penalty factor C acts as a penalty coefficient multiplied by slack variables (variables measuring the degree of sample misclassification, denoted as ), with the following specific form:
When c→+∞, the penalty intensity is extremely high, and the model approximates a hard-margin SVM, allowing almost no misclassifications (). When c is small, the penalty intensity is weak, causing the model to tolerate more misclassifications, prioritize margin maximization, and may underfit.
The kernel function is used to map low-dimensional linearly inseparable data to a high-dimensional feature space where linear separability is achieved. Kernel function parameters determine the complexity or nonlinearity of the mapping. In this work, the Gaussian kernel (RBF kernel) was employed, which is defined as
where and are sample inputs. The kernel parameter controls the width of the Gaussian kernel, which essentially defines the range of similarity between samples. A larger g enhances the locality of the kernel function (only focusing on local structures near samples), making the model prone to overfitting, while a smaller g weakens the locality, and the model tends to underfit.
Generally, the larger the penalty factor C, the better the model’s nonlinear fitting ability. However, training time also increases. Moreover, a larger kernel width parameter g can easily lead to underfitting []. Therefore, appropriately determining the penalty factor C and kernel function parameter g is a significant challenge in AE source identification.
The swarm intelligence optimization algorithm is inspired by the interaction behaviors of gregarious creatures. Their social structure and behavior characteristics are simulated, and positions of individuals are updated to obtain the optimal solution []. The bald eagle search algorithm (BES) is a swarm intelligence optimization algorithm that simulates the fish hunting strategies of bald eagles []. Its features include strong convergence performance, few parameters, and easy implementation. In this paper, the BES algorithm is introduced to optimize penalty factor C and kernel function parameter g in SVM.
As shown in Figure 4, the key implementation procedures of the BES-SVM model are as follows:
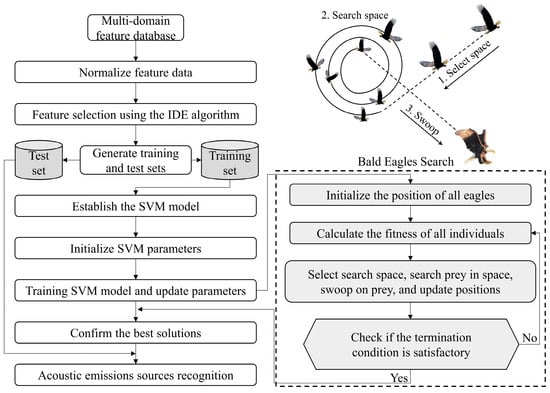
Figure 4.
Overall flowchart of the BES-SVM model.
- (1)
- Set the population number of bald eagles and the iteration number, then initialize the locations of bald eagle individuals.
- (2)
- Define the 5-fold cross-validation loss of SVM as the fitness function of the BES algorithm.
- (3)
- Select the searching space. The optimal position is updated according to the prey population, which further helps to find the optimal space. In this step, the position update is determined by the a priori information obtained from a random search. The mathematical expression for this behavior iswhere α is a factor that determines the change in bald eagle position; r is a random number range from 0 to 1; Pi,new, Pbest, Pmean, and Pi denote the latest position, best position, average position, and the position of the i-th bald eagle individual in the population, respectively.
- (4)
- The bald eagles hover in the searching space to find the best swoop position. A polar coordinate system is used to describe the spiral flight path of bald eagles. The position update in this step can be given bywhere θ(i) and r(i) represent the polar angle and radius of the spiral equation; α is the trajectory factor of the spiral; R is the number of search cycles; and x(i) and y(i) together determine the positions of individuals in the polar coordinates.
- (5)
- Bald eagles swoop down toward the target, and the center around which the bald eagles fly gradually moves to the prey. The position update equation for this phase iswhere c1 and c2 represent the intensity of bald eagles swooping to the center.
- (6)
- When the iteration reaches the desired number, output the best combination of penalty factor C and kernel function parameter g. Otherwise, jump to Step (3) to continue iterating until the termination condition is met.
5. Results and Discussion
To improve the accuracy of AE source identification, a novel method based on multi-domain features and BES-SVM algorithm is proposed. Figure 5 presents a flowchart of the noise identification method.
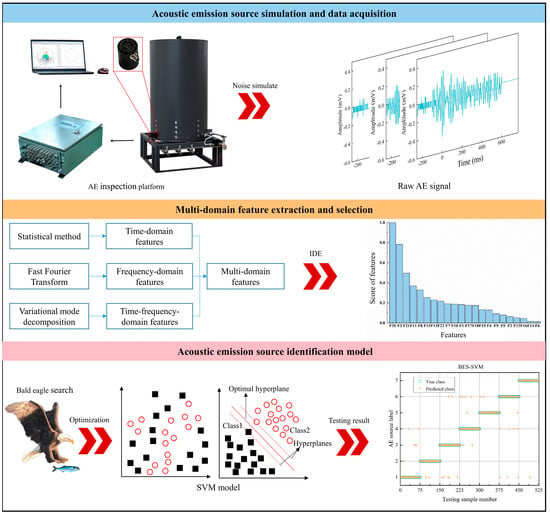
Figure 5.
Flowchart of noise identification method for AE inspection of oil tank bottom corrosion based on multi-domain features and BES-SVM algorithm.
An AE inspection platform was initially used to obtain raw AE signals of oil tank bottom corrosion. Then, time-domain features, frequency-domain features, and multi-domain features were extracted from the waveform. The IDE algorithm was subsequently applied for feature selection to obtain the features that contribute most to classification; thus, a dimension-reduced feature dataset was obtained. Finally, the dataset was randomly divided into a training set and test set at a 1:1 ratio, where the test set was used to assess performance of the BES-SVM model. Specifically, to avoid the numerical problem caused by different ranges of parameter distributions, the original feature data was normalized to a range of [0, 1] prior to feature selection.
Accuracy, recall, precision, and the F1 score are commonly used metrics in the performance evaluation of classification models. Accuracy measures the overall correctness of model prediction, the recall rate evaluates the ability of the model to recognize positive class samples, precision reflects the proportions of actual positive class samples in predicted positive class samples, and the F1 score is the harmonic average of precision and recall.
5.1. Model Performance in AE Source Classification
A total of 1050 data samples were collected, consisting of 150 sets for each of the seven AE sources, including oil tank bottom corrosion, mechanical vibration, fluid disturbance, mechanical friction, external impacts, rainwater interference, and oil leakage from the bottom. A total of 14 time-domain features and 6 frequency-domain features were extracted from the raw AE signals. Then, the VMD algorithm was used to compose the raw AE signals into 10 IMF components, and the energy and DE of each IMF component were calculated to obtain 20 time–frequency domain features. Next, 40 high-dimensional features were extracted from each AE signal, constituting a 1050 × 40 feature matrix. Finally, the feature matrix was normalized to eliminate the impact of feature magnitude.
IDE was introduced to evaluate the relevance of features to AE sources. Scores of the multi-domain features are shown in Figure 6, where a higher score indicates that it contained more important information regarding the AE source. In this work, the top 20 features were selected as inputs for the BES-SVM model. Among them, the mean, frequency mean, energy of IMF3, dispersion entropy of IMF7, and Kurtosis ranked the top five features.
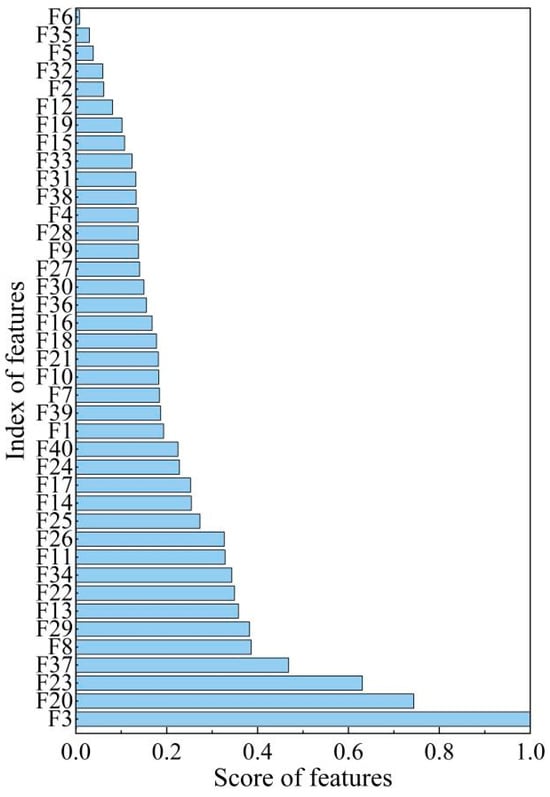
Figure 6.
Scores of multi-domain features using the IDE algorithm.
The variation of model fitness with respect to the iteration number is presented in Figure 7a, where fitness is defined as the average accuracy obtained from 5-fold cross validation. It can be seen that the optimal solution was obtained early in the iteration process. The optimal penalty factor and the kernel function parameter were 56.6692 and 1.0658, respectively, and the 5-fold cross validation accuracy was 94.47%. The corresponding AE source identification results are shown in Figure 7b. The proposed method based on multi-domain features and the BES-SVM model demonstrated a superior ability to identify AE sources. The identification accuracy, precision, recall, and F1 on the test set reached up to 93.71%, 93.80%, 93.71%, and 93.74%, respectively.
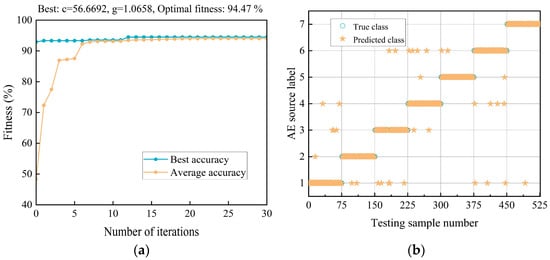
Figure 7.
Analysis results of the proposed method: (a) optimization curve of BES algorithm, and (b) recognition results of BES-SVM.
5.2. Field Validation
To investigate the applicability of the proposed method for AE source identification, field AE inspection was carried out on an in-service vertical storage tank, and AE source identification was performed on the obtained AE signals. As showcased in Figure 8, a fixed-roof vertical metal tank with a nominal volume of 3000 m3 was used to store coal tar. The liquid level was 8.5 m. External impacts and mechanical friction were generated in the noise source simulation window. The model’s generalization ability was validated using 504 data samples, including 315 corrosion signal samples, 72 external impact noise samples, and 117 friction noise samples. The 504 sets of data samples were randomly divided at a ratio of 9:1 into training and test sets. Multi-domain features were extracted as inputs of the BES-SVM model. Figure 9 clearly shows that the model effectively captured the nonlinear relationship between feature parameters and AE source categories in both the training and test sets. Accuracy, precision, recall, and F1 for the training set were 92.95%, 94.05%, 89.35%, and 91.44%, respectively. For the test set, they were 94.00%, 91.73%, 93.75%, and 92.66%, respectively. This demonstrates the excellent performance of the multi-domain feature and BES-SVM model-based method for AE source identification in oil tank bottom corrosion inspection.
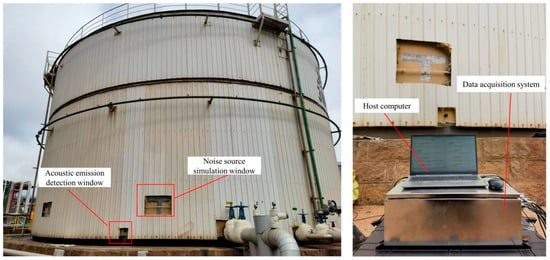
Figure 8.
Field AE inspection of bottom corrosion in vertical atmospheric tank.
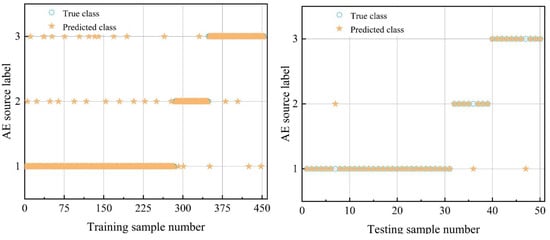
Figure 9.
Noise identification in AE inspection of bottom corrosion of oil tank.
Although the proposed method was developed using an indoor AE inspection platform, its verification on an actual fixed-roof vertical metal tank for coal tar storage demonstrates its scalability and transferability to some extent. However, due to the limitations of on-site conditions, the oil tank and noise types were limited in the field validation. More oil tank types, sizes, and noise resource classes are required for full verification of the generalization ability of the proposed BES-SVM model. Moreover, since AE inspection of oil tank bottom corrosion is conducted periodically rather than continuously, practical application of the BES-SVM model does not require real-time operation. However, as the computational cost of the proposed method is low and the computing power requirement can easily be met by ordinary PCs, the method proposed in this work can also be embedded into a real-time AE inspection system.
5.3. Sensitivity Study
5.3.1. Impact of Optimization Algorithm
To demonstrate the performance of the BES-SVM model in AE source identification, seven different types of swarm intelligence algorithms were employed to optimize the penalty factor and kernel function parameter of SVM, including the whale optimization algorithm (WOA), particle swarm optimization (PSO), grey wolf optimization (GWO), the chaos game algorithm (CGA), the sine cosine algorithm (SCA), transient search optimization (TSO), and the cuckoo search algorithm (CSA). The population and iteration numbers were set to 10 and 30, respectively. The variation trend of fitness in the first training of each model is given in Figure 10. Compared with other models, WOA-SVM and PSO-SVM are more likely to fall into local optimal solutions. Their 5-fold cross-validation accuracy rates were 87.81% and 42.67%, respectively. The BES-SVM model achieved the highest fitness of 94.29%, with fast convergence speed in the early stages, indicating a strong global and local searching capability. Meanwhile, the BES-SVM model reached the optimal solution most of the time, with a standard deviation of testing accuracy of 0.25%, proving its strong robustness and stability.
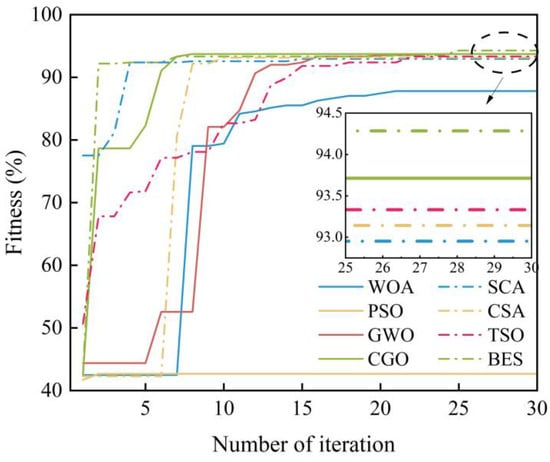
Figure 10.
Fitness curves of different models.
The iteration number of the optimization algorithm also affects the AE source identification capability. To investigate this, the iteration number of each model was set to 20, 30, 40, and 50 times, respectively. To exclude the impact of accidental error, ten repetitive experiments were performed. Table 4, Table 5, Table 6 and Table 7 present the mean and standard deviations of different models using data from the ten experiments. The average accuracy, precision, recall, and F1 score of the BES-SVM model reached up to 93.52%, 93.80%, 93.71%, and 93.74%, respectively, with an iteration number of 30, and the standard deviation was 0.25%. This indicates that BES has a strong global search ability and the BES-SVM model shows good stability, which helps to identify AE sources in oil tank bottom corrosion inspection. Moreover, the values of the four types of indicators are similar, with no obvious conflict between them. This indicates that the model’s performance is relatively balanced across different indicators. Therefore, accuracy is used as the representative metric for comparison and evaluation in the subsequent sections of this paper to simplify result interpretation and decision-making.

Table 4.
Accuracy of different models at corresponding iteration counts.

Table 5.
Precision of different models at corresponding iteration counts.

Table 6.
Recall of different models at corresponding iteration counts.

Table 7.
F1 scores of different models at corresponding iteration counts.
5.3.2. Impact of Feature Selection Algorithm
The performance of IDE was compared with some mainstream feature selection algorithms, including minimum-redundancy maximum-correlation (mRMR) and chi-square detection. Additionally, features were also randomly selected as inputs to the BES-SVM model. Figure 11 shows the recognition accuracy versus feature number curve using different feature selection algorithms. Recognition accuracy using random selection clearly ranked the worst. When the feature number was less than 20, the performance of the IDE algorithm was better than mRMR and the chi-square test. Subsequently, the identification accuracy of these three algorithms leveled off with little difference, indicating that the subsequent features contributed minimally to AE source identification. Since increasing the feature number requires more computation time, feature selection must carefully balance identification accuracy and computation time. In this work, the IDE algorithm was selected to reduce feature dimensions.
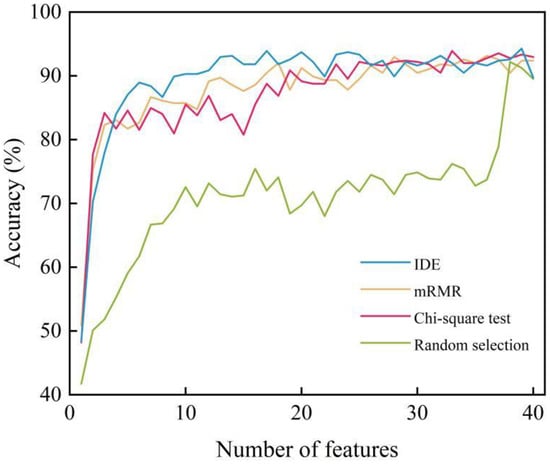
Figure 11.
Recognition accuracy of AE sources using different feature selection algorithms.
5.3.3. Impact of Feature Type
Different types of features are extracted from AE signals, including time-domain features, frequency-domain features, time–frequency-domain features, and multi-domain features. To verify the generalizability of multi-domain features in the application of cross-classification algorithms, these types of features were used as inputs to four classification models, including BES-SVM, decision tree (DT), BP neural network (BPNN), and k-nearest neighbor (KNN). For multi-domain features, those with the 20 highest scores were selected using IDE, while the time-domain features, frequency-domain features, and time–frequency-domain features were directly used as inputs to each classification model. The results of AE source identification based on the different types of input features and classification models are shown in Table 8. The average recognition accuracy of the multi-domain features using different AE source recognition algorithms reached a maximum of 88.57%, which is the largest among all four feature types, indicating that multi-domain features contain more AE source information than other single-domain features.

Table 8.
Comparison of single-domain and multi-domain feature extraction.
6. Conclusions and Future Concerns
Acoustic emission (AE) is a powerful technology for oil tank bottom corrosion inspection. However, it is susceptible to interference by external noises, which the AE inspection system may mistakenly interpret as valid corrosion signals. For AE source identification, this work constructed an AE inspection platform that mainly consists of an oil tank and an AE inspection system. Some common noise sources in actual AE inspection, including mechanical vibration and friction, fluid and raining disturbance, external impacts, and oil leakage were simulated. The impact of noise on AE inspection accuracy was experimental verified. In AE feature extraction, multiple time–frequency-domain features of AE signals were extracted using VMD and DE. A high-dimensional multi-domain feature dataset was built by combining traditional time-domain features and frequency-domain features with time–frequency-domain features. The IDE feature selection algorithm was introduced to obtain a highly correlated feature subset. It was found that the mean, frequency mean, energy of IMF3, dispersion entropy of IMF7, and Kurtosis ranked as the top five features most strongly correlated with AE source type. Compared with other optimization algorithms, BES exhibited superior global search capability and was less likely to become trapped in local optima; therefore, it was employed to optimize the penalty factor C and kernel function parameter g of the SVM model. The proposed BES-SVM model achieved accurate classification of multiple AE sources. The proposed method based on multi-domain features and the BES-SVM model demonstrated a superior ability to identify AE sources. The identification accuracy on the test set reached up to 93.71%. A field experiment was also conducted, demonstrating that for mechanical friction, external impacts, and effective corrosion signals, the proposed method achieved identification accuracy of 92.95% and 94.00% in the training and test sets, respectively. Moreover, the impacts of the optimization algorithm, feature selection algorithm, and feature type on AE source identification were further investigated. In short, the proposed method based on multi-domain features and the BES-SVM algorithm effectively reduces noise interference, thus improving the accuracy of AE inspection of oil tank bottom corrosion.
With the development of artificial intelligence, advanced AI techniques, such as convolutional neural network (CNN), recurrent neural network (RNN), generative adversarial network (GAN), deep reinforcement learning (DRL), Transformer, and self-attention, may be promising for AE inspection of oil tank bottom corrosion. Compared with SVM, these AI techniques are capable of automatic feature extraction and efficient processing of complex data. As a preliminary investigation into AE source identification of oil tank bottom corrosion, this work focused on conventional machine learning and achieved satisfactory performance. In future endeavors, further improvements are expected by applying deep learning.
Author Contributions
Conceptualization, C.H. and W.Z.; Methodology, X.S.; Software, X.S. and D.X.; Validation, W.Z. and R.Z.; Formal analysis, B.Y., X.S. and F.C.; Investigation, C.H. and F.C.; Resources, W.Z. and R.Z.; Data curation, B.Y. and D.X.; Writing—original draft, C.H. and W.Z.; Writing—review & editing, W.L.; Supervision, W.L.; Project administration, C.H.; Funding acquisition, W.L. All authors have read and agreed to the published version of the manuscript.
Funding
This work was financially supported by the Science and Technology Project of Fujian Provincial Administration for Market Regulation (Grant No. FJMS2023020).
Data Availability Statement
The raw data supporting the conclusions of this article will be made available by the authors upon request.
Conflicts of Interest
Author Canwei Huang, Rongbu Zheng, Xueliang Sun, Fuhai Chen were employed by the Fujian Special Equipment Inspection and Research Institute, author Wenpei Zhang was employed by Health Safety & Environmental Protection Department of China Petrochemical Corporation Shanghai Offshore Oil and Gas Branch, author Bo Yang was employed by Central China Branch of PipeChina. The remaining authors declare that the research was conducted in the absence of any commercial or financial relationships that could be construed as a potential conflict of interest.
References
- Zhou, Q.Y.; Li, B.; Lu, Y.; Chen, J.; Shu, C.M.; Bi, M.S. Dynamic risk analysis of oil depot storage tank failure using a fuzzy Bayesian network model. Process Saf. Environ. Prot. 2023, 173, 800–811. [Google Scholar] [CrossRef]
- Yang, Y.; Chen, G.; Reniers, G. Vulnerability assessment of atmospheric storage tanks to floods based on logistic regression. Reliab. Eng. Syst. Saf. 2020, 196, 106721. [Google Scholar] [CrossRef]
- Riemer, D.P.; Orazem, M.E. A mathematical model for the cathodic protection of tank bottoms. Corros. Sci. 2005, 47, 849–868. [Google Scholar] [CrossRef]
- Kolokolnikov, S.; Dubov, A.; Medvedev, A.; Boriskin, D. Comprehensive inspection of refrigerated ammonia storage tank welded joints by the metal magnetic memory technique and conventional NDT methods. Weld. World 2020, 64, 1659–1670. [Google Scholar] [CrossRef]
- Wang, D.; Liao, B.; Hao, C.; Wen, A.; Zheng, J.; Jiang, P.; Gu, C.; Xu, P.; Huang, Q. Acoustic emission characteristics of used 70 MPa type IV hydrogen storage tanks during hydrostatic burst tests. Int. J. Hydrogen Energy 2021, 46, 12605–12614. [Google Scholar] [CrossRef]
- Ebrahimkhanlou, A.; Choi, J.; Hrynyk, T.D.; Salamone, S.; Bayrak, O. Acoustic emission monitoring of containment structures during post-tensioning. Eng. Struct. 2020, 209, 109930. [Google Scholar] [CrossRef]
- He, Y.; Li, M.; Meng, Z.; Chen, S.; Huang, S.; Hu, Y.; Zou, X. An overview of acoustic emission inspection and monitoring technology in the key components of renewable energy systems. Mech. Syst. Signal Process. 2021, 148, 107146. [Google Scholar] [CrossRef]
- Olszewska, A. Using the acoustic emission method for testing aboveground vertical storage tank bottoms. Appl. Acoust. 2022, 188, 108564. [Google Scholar] [CrossRef]
- Kim, Y.P.; Fregonese, M.; Mazille, H.; Féron, D.; Santarini, G. Ability of acoustic emission technique for detection and monitoring of crevice corrosion on 304L austenitic stainless steel. NDT E Int. 2003, 36, 553–562. [Google Scholar] [CrossRef]
- Jirarungsatian, C.; Prateepasen, A. Pitting and uniform corrosion source recognition using acoustic emission parameters. Corros. Sci. 2010, 52, 187–197. [Google Scholar] [CrossRef]
- Haile, M.A.; Bordick, N.E.; Riddick, J.C. Distributed acoustic emission sensing for large complex air structures. Struct. Health Monit. 2018, 17, 624–634. [Google Scholar] [CrossRef]
- Raorane, S.; Ercan, T.; Papadimitriou, C.; Packo, P.; Uhl, T. Bayesian optimal sensor placement for acoustic emission source localization with clusters of sensors in isotropic plates. Mech. Syst. Signal Process. 2024, 214, 111342. [Google Scholar] [CrossRef]
- Zhang, L.; Zhang, T.; Chen, E.; Ozevin, D.; Li, H. Phased acoustic emission sensor array for localizing radial and axial positions of defects in hollow structures. Measurement 2020, 151, 107223. [Google Scholar] [CrossRef]
- Jung, D.; Lee, J. Enhancing Structural Health Monitoring with Acoustic Emission Sensors: A Case Study on Composites under Cyclic Loading. Sensors 2024, 24, 371. [Google Scholar] [CrossRef]
- Li, Y.; Zhang, Y.; Zhu, H.; Yan, R.; Liu, Y.; Sun, L.; Zeng, Z. Recognition Algorithm of Acoustic Emission Signals Based on Conditional Random Field Model in Storage Tank Floor Inspection Using Inner Detector. Shock Vib. 2015, 2015, 173470. [Google Scholar] [CrossRef]
- Sagasta, F.; Zitto, M.E.; Piotrkowski, R.; Benavent-Climent, A.; Suarez, E.; Gallego, A. Acoustic emission energy b-value for local damage evaluation in reinforced concrete structures subjected to seismic loadings. Mech. Syst. Signal Process. 2018, 102, 262–277. [Google Scholar] [CrossRef]
- Vicuña, C.M.; Höweler, C. A method for reduction of Acoustic Emission (AE) data with application in machine failure detection and diagnosis. Mech. Syst. Signal Process. 2012, 97, 44–58. [Google Scholar] [CrossRef]
- Zitto, M.E.; Piotrkowski, R.; Gallego, A.; Sagasta, F.; Benavent-Climent, A. Damage assessed by wavelet scale bands and b-value in dynamical tests of a reinforced concrete slab monitored with acoustic emission. Mech. Syst. Signal Process. 2015, 60–61, 75–89. [Google Scholar] [CrossRef]
- Xu, J.; Luo, X.; Qiu, X.; Hu, G. Wavelet and fractal analysis of acoustic emission characteristic of fatigue damage of asphalt mixtures. Constr. Build. Mater. 2022, 349, 128643. [Google Scholar] [CrossRef]
- Fan, W.; Huang, W.; Liu, Y.; Yin, Y.; Liu, X.; Wang, Y. State Evolution of Dry Gas Seal during Repeated Start–Stop Operation Using Acoustic Emission Method. Tribol. Trans. 2020, 63, 173–181. [Google Scholar] [CrossRef]
- Yang, Z.; Yan, W.; Jin, L.; Li, F.; Hou, Z. A novel feature representation method based on original waveforms for acoustic emission signals. Mech. Syst. Signal Process. 2020, 135, 106365. [Google Scholar] [CrossRef]
- Dragomiretskiy, K.; Zosso, D. Variational Mode Decomposition. IEEE Trans. Signal Process. 2014, 62, 531–544. [Google Scholar] [CrossRef]
- Qiu, F.; Shen, Z.; Bai, Y.; Shan, G.; Qu, D.; Chen, W. Hydrogen defect acoustic emission recognition by deep learning neural network. Int. J. Hydrogen Energy 2024, 54, 878–893. [Google Scholar] [CrossRef]
- Huang, X.; Xia, H.; Liu, Y.; Zio, E.; Yin, W. Fault diagnosis of nuclear power plant electric gate valves based on acoustic emission signals. Ann. Nucl. Energy 2025, 221, 111519. [Google Scholar] [CrossRef]
- Zhu, S.; Zhang, D.; Zhou, M.; Guan, P.; Duo, S.; Huang, H. AI-driven non-destructive concrete stress state identification: A novel approach based on time-frequency analysis of active acoustic emission signals. Adv. Eng. Inform. 2025, 68, 103757. [Google Scholar] [CrossRef]
- Hesser, D.F.; Mostafavi, S.; Kocur, G.K.; Markert, B. Identification of acoustic emission sources for structural health monitoring applications based on convolutional neural networks and deep transfer learning. Neurocomputing 2021, 452, 1–12. [Google Scholar] [CrossRef]
- Xu, L.; Wen, S.M.; Huang, H.F.; Tang, Y.; Wang, Y.; Pan, C. Corrosion failure prediction in natural gas pipelines using an interpretable XGBoost model: Insights and applications. Energy 2025, 325, 136–157. [Google Scholar] [CrossRef]
- Wang, L.; Guo, W.; Guo, J.; Zheng, S.; Wang, Z.; Kang, H.S.; Li, H. An integrated deep learning model for intelligent recognition of long-distance natural gas pipeline features. Reliab. Eng. Syst. Saf. 2025, 255, 110664. [Google Scholar] [CrossRef]
- He, L.; Ding, Y.; Sun, Y.; Xie, M.; Soares, G.C. An intelligent failure feature learning method for failure and maintenance data management of wind turbines. Reliab. Eng. Syst. Saf. 2025, 261, 111113. [Google Scholar] [CrossRef]
- Gu, J.; Tian, F.; Shi, J.; Tan, F. Noise reduction and analysis of leaf electrical signals of strap-leaved plants based on VMD-EWT. Comput. Electron. Agric. 2024, 226, 109441. [Google Scholar] [CrossRef]
- Yan, X.; Jia, M. Intelligent fault diagnosis of rotating machinery using improved multiscale dispersion entropy and mRMR feature selection. Knowl. Based Syst. 2019, 163, 450–471. [Google Scholar] [CrossRef]
- Bono, F.M.; Radicioni, L.; Bombaci, G.; Somaschini, C.; Cinquemani, S. An approach based on convolutional autoencoder for detecting damage location in a mechanical system. Proc. SPIE 2023, 12489, 124890K. [Google Scholar]
- Motahari-Nezhad, M.; Jafari, S.M. Bearing remaining useful life prediction under starved lubricating condition using time domain acoustic emission signal processing. Expert Syst. Appl. 2021, 168, 114391. [Google Scholar] [CrossRef]
- Baccarini, L.M.R.; Rocha e Silva, V.V.; De Menezes, B.R.; Caminhas, W.M. SVM practical industrial application for mechanical faults diagnostic. Expert Syst. Appl. 2011, 38, 6980–6984. [Google Scholar] [CrossRef]
- Zhou, J.; Huang, S.; Wang, M.Z.; Qiu, Y.G. Performance evaluation of hybrid GA–SVM and GWO–SVM models to predict earthquake-induced liquefaction potential of soil: A multi-dataset investigation. Eng. Comput. 2022, 38, 4197–4215. [Google Scholar] [CrossRef]
- Chauhan, V.K.; Dahiya, K.; Sharma, A. Problem formulations and solvers in linear SVM: A review. Artif. Intell. Rev. 2019, 52, 803–855. [Google Scholar] [CrossRef]
- Tang, J.; Liu, G.; Pan, Q. A Review on representative swarm intelligence algorithms for solving optimization problems: Applications and trends. IEEE/CAA J. Autom. Sin. 2021, 8, 1627–1643. [Google Scholar] [CrossRef]
- Alsattar, H.A.; Zaidan, A.A.; Zaidan, B.B. Novel meta-heuristic bald eagle search optimisation algorithm. Artif. Intell. Rev. 2020, 53, 2237–2264. [Google Scholar] [CrossRef]
Disclaimer/Publisher’s Note: The statements, opinions and data contained in all publications are solely those of the individual author(s) and contributor(s) and not of MDPI and/or the editor(s). MDPI and/or the editor(s) disclaim responsibility for any injury to people or property resulting from any ideas, methods, instructions or products referred to in the content. |
© 2025 by the authors. Licensee MDPI, Basel, Switzerland. This article is an open access article distributed under the terms and conditions of the Creative Commons Attribution (CC BY) license (https://creativecommons.org/licenses/by/4.0/).