Abstract
To address the overvoltage problem in distribution networks with large-scale photovoltaic (PV) integration, this paper proposes an interactive game-based voltage optimization control strategy based on microgrid cluster partitioning. A multi-agent control architecture is constructed, including a dynamic partitioning layer, a parallel independent optimization layer, and an interactive game optimization layer. In the dynamic partitioning layer, microgrid clusters are formed considering coupling degree, voltage regulation capability, and cluster scale. In the parallel optimization layer, a network reconfiguration-based control model is established for utility-owned microgrids, and a PV active/reactive power regulation model is developed for PV microgrids, enabling independent cluster-level control. In the game optimization layer, a non-cooperative game model is formulated to coordinate voltage regulation among clusters. The effectiveness of the proposed method is demonstrated on an actual 10 kV feeder system.
1. Introduction
With the proposal of the “dual carbon” strategic goal, China is vigorously developing renewable energy sources such as photovoltaic (PV) and wind power. However, due to the uncoordinated integration of large-scale distributed generation (DG), a series of problems have emerged within distribution networks, including overvoltage, reverse power flow, and line overloads. Among these, the overvoltage problem is particularly prominent, severely constraining the integration and utilization of large-scale distributed generation [].
Traditional distribution networks with photovoltaic (PV) generation are often in a weakly controllable or even uncontrollable state, relying solely on conventional voltage regulation devices. With the large-scale integration of distributed PV into distribution networks, the establishment of hardware foundations like Wide-Area Measurement Systems (WAMS) provides a crucial platform for smart inverters to participate in voltage regulation []. Existing methods for PV inverter participation primarily involve active power curtailment strategies [,], reactive power compensation strategies [,], and optimal active–reactive power (P–Q) allocation strategies [,]. Among these, the optimal P–Q allocation strategy has become the primary means for PV inverters to participate in voltage regulation, as it incorporates all the advantages of both active curtailment and reactive compensation strategies. In practical engineering, distribution network voltage regulation involves the coordinated control of multiple auxiliary voltage regulation devices. Besides PV inverters, other key devices include On-Load Tap Changers (OLTCs) [,] and reactive power compensation devices such as capacitor banks and reactors [,].
Reference [] proposed a coordinated voltage control strategy for distribution networks involving PV and OLTCs, achieving voltage regulation within safe operating limits for all buses through the coordinated action of PV systems, OLTCs, and Static Synchronous Compensators (STATCOMs). Considering the different regulation speeds of various reactive power compensation devices, Reference [] designed a two-time-scale approach for the optimal configuration of discrete and continuous regulation devices. This method enables real-time tracking of the distribution network state, online decision-making for optimal reactive power regulation schemes, and operates without relying on precise power flow models. Reference [] addressed long-time-scale regulation involving OLTCs and capacitor banks by establishing a day-ahead reactive power–voltage optimization model based on Mixed-Integer Second-Order Cone Programming (MISOCP), aiming to minimize active power losses and overcome the high communication overhead and weak real-time performance of traditional methods.
The aforementioned methods all assume that the distribution network operator has absolute dispatching authority over distributed generation (DG). However, in practice, large-scale distributed PV is often installed on the customer side. Under relevant PV operation standards and requirements (such as power factor and point-of-common-coupling voltage limits), these systems are managed by PV operators, and the utility company lacks direct authority to control the PV inverters. If both the utility company and PV operators participate in voltage regulation solely to maximize their own interests, it not only increases losses for the utility but also leads to resource wastage. From this perspective, the utility company and PV operators represent distinct interest entities within the distribution network’s voltage regulation landscape []. Furthermore, each PV operator also aims to minimize its own regulation costs when participating, making them separate interest entities as well. How to perform refined partitioning of the microgrids participating in voltage regulation within the distribution network into microgrid clusters—such that the partitioning results reflect both the common interests within a cluster and the independence between clusters regarding voltage regulation participation—requires further in-depth research.
When microgrid clusters participate in voltage regulation, each cluster should determine its regulation strategy based on various factors such as the voltage level in its area, its own regulation capability, and the benefits of regulation. In recent years, distributed optimization scheduling strategies have provided ideas for formulating voltage regulation strategies involving multiple interests []. Reference [] proposed a microgrid cluster partitioning method based on an improved modularity function and developed a voltage control strategy that prioritizes active power regulation of inverters followed by reactive power regulation, significantly simplifying the distribution network voltage control process. Reference [] presented a distribution network voltage control method based on microgrid cluster partitioning, constructing an optimal active and reactive power control model for PV inverters within clusters and solving it using a Particle Swarm Optimization (PSO) algorithm to achieve effective voltage control. Reference [] introduced a zonal coordinated optimal voltage control method for active distribution networks with high-penetration distributed PV. Within reactive power zones, a second-order cone optimization model for PV inverter reactive power was established, aiming for minimal reactive power adjustment. Within active power zones, a second-order cone optimization model for PV active power curtailment was built, aiming for minimal curtailment. Coordinated optimization between active and reactive power zones enabled rapid voltage control. Reference [] proposed a reactive power–voltage control strategy for PV based on adaptive active power adjustment. Considering the differences in reactive power regulation capability among PV microgrid clusters, it employed a reactive power variable droop control to provide necessary reactive power support to the grid. When the inverter’s reactive power capacity was insufficient, it curtailed part of the PV active power output based on priority to meet the system’s reactive power demand.
The implementation premise of the above distributed optimization control methods is that the distribution network topology remains unchanged. However, after large-scale DG integration, the network topology changes according to its operating state, and the boundaries of “zones” or “clusters” also shift. Consequently, the applicability of these methods becomes limited. Existing methods not only lack adaptability to dynamic changes in network topology, but their models also often fail to adequately account for dynamic interactivity and fairness in resource allocation. Furthermore, these methods are primarily implemented based on maximizing the utility company’s interests. Especially when coordination between multiple zones is involved, they do not fully consider the subjective willingness of each regulating entity to participate, lacking fairness and interactivity. Based on the preceding literature review, this study identifies the following critical and interrelated research gaps in current research addressing distribution networks with high-penetration distributed energy resources: firstly, there is a lack of effective mechanisms to support real-time and autonomous interactive decision-making among microgrids; secondly, there is insufficient attention to fairness in the allocation of costs and benefits arising from collaborative operation; thirdly, existing models have limited adaptability to topological changes in dynamic environments. Therefore, how to comprehensively utilize various voltage regulation measures within the distribution network under changing topologies and establish fair and reasonable regulation strategies still requires further resolution.
To address the aforementioned issues, this paper proposes an interactive game-based voltage optimization control strategy for distribution networks based on microgrid cluster partitioning. Firstly, a multi-agent voltage optimization control architecture for the distribution network is constructed. Then, within the dynamic microgrid cluster partitioning layer, a comprehensive partitioning index for distribution network microgrids is established, and a partitioning method based on a community detection algorithm is proposed. In the parallel independent optimization layer, voltage optimization control models are, respectively, developed for the utility-owned microgrid cluster and the PV microgrid clusters. In the interactive game optimization layer, an interactive game model for microgrid clusters is constructed based on non-cooperative game theory. This facilitates coordinated cooperation among microgrid clusters during the voltage control process, thereby enhancing the voltage management level of the distribution network.
2. Interactive Game-Based Optimization Control Method for Microgrid Clusters
The interactive game-based optimization control method for microgrid clusters proposed in this paper comprises a three-layer optimization architecture: the Microgrid Cluster Dynamic Partitioning Layer, the Parallel Independent Optimization Layer, and the Interactive Game Optimization Layer. The interaction relationships and implementation logic between these optimization layers are illustrated in Figure 1.
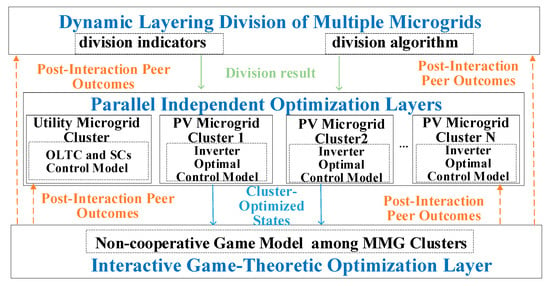
Figure 1.
Schematic of the proposed control strategy.
The Microgrid Cluster Partitioning Layer is primarily responsible for the dynamic partitioning and adjustment of the various microgrids within the distribution network. It serves as the foundation for the subsequent Parallel Independent Optimization Layer and Interactive Game Optimization Layer. Within the Parallel Independent Optimization Layer, a voltage optimization control model internal to the microgrid cluster is established for each microgrid cluster. This layer then performs parallel independent optimization solving within each cluster, based on the optimization results received from the Interactive Game Optimization Layer.
Following the independent optimization within each microgrid cluster, the optimization results are transmitted to the Interactive Game Optimization Layer. Here, the microgrid clusters engage in game-based interactions based on their respective optimization results, aiming to minimize their own regulation costs. The optimized results from these interactive games are then fed back to both the Microgrid Cluster Partitioning Layer and the Parallel Independent Optimization Layer. These results are used as inputs for the next round of optimization. This iterative cycle repeats continuously until convergence is achieved, ultimately generating the final optimal control scheme.
3. Method for Dynamic Partitioning of Multiple Microgrid Clusters
Voltage regulation within the distribution network requires coordinated cooperation among various voltage regulation devices. In this paper, the voltage regulation devices present in the distribution network primarily include OLTCs, Line Sectionalizing Switches and Tie Switches, and PV Inverters. Among these, the OLTCs, line sectionalizing switches, and tie switches are owned by the utility company, while the PV inverters are managed by PV operators. Therefore, the microgrids within the distribution network can be classified into two main categories based on the ownership of the regulation devices: Utility-Owned Microgrids and PV Inverters. As mentioned previously, PV operators also aim to minimize their own regulation costs when participating in voltage regulation, and different PV operators constitute separate interest entities. Therefore, finer-grained partitioning of the PV microgrids is required.
3.1. Partitioning Indices for Multiple Microgrid Clusters
When partitioning microgrid groups within a distribution network, it is essential to consider the intrinsic characteristics of microgrids to establish appropriate partitioning indicators. From the perspective of microgrid participation in voltage regulation, the following characteristics are essential:
- (1)
- High internal interest coupling;
- (2)
- Participatory voltage regulation capability;
- (3)
- Balanced group size among stakeholders.
Based on these considerations, this paper constructs microgrid group partitioning indicators to enable reasonable and effective group division.
3.1.1. Interest Coupling Degree Indicator
When overvoltage occurs in a certain area of a distribution network, not all nodes can effectively control the voltage in that region. Typically, only those nodes with high-voltage sensitivity can achieve voltage control within a safe operating range with minimal regulation effort, indicating high individual interest coupling. These nodes are inclined to be grouped into the same microgrid cluster.
Voltage sensitivity matrices can be obtained through transformations of the Jacobian matrix from power flow analysis in power systems. The power flow calculation satisfies the following equation:
where and are active and reactive power injection changes; and are voltage angle and magnitude changes; , , , are the formed Jacobian matrix represents the relationship between the variations in node voltage phase angles and magnitudes (, ) and the variations in node injected power (, ). Perform matrix transformation on Equation (1):
where and represents the changes in node voltage magnitude and phase angle when unit active power is injected into the node. and are sensitivity of voltage magnitude to active and reactive power.
Rewriting (1), the voltage magnitude variation can be expressed as:
Assuming the cost of regulating active power is SP = AP ΔP and for reactive power
SQ = AQΔQ, (3) becomes:
By normalizing the cost sensitivity matrix and incorporating preference weights. Let EPU = JPU/AP, EQU = JQU/AQ. Then, the relationship between voltage variation and power variation in distribution network nodes can be converted into the relationship between voltage variation and node regulation cost, as shown below:
Here, EPU, EPU are defined as interest coupling matrices, indicating how much voltage changes per unit cost of regulation.
We then define the interest coupling index α as:
where П denotes the set of all microgrid groups, П[i] represents the microgrid group to which node belongs, and N denotes the number of microgrids in the distribution network. μ(i,Ψ): Sum of interest coupling between microgrid i and group Ψ, as shown below:
where Ω is Total sum of interest coupling across the system; Eij: is Interest coupling between nodes i and j, calculated as:
, , , , They represent the node benefit coupling degree matrix EPU and EPU and the elements within EPU and EPU, respectively. The benefit coupling degree index α characterizes the degree of benefit coupling among nodes in the distribution network when adjusting voltages. It ranges from (0, 1), with a higher value indicating a greater degree of benefit coupling among microgrids within the microgrid cluster.
3.1.2. Voltage Regulation Capability Indicator
Besides strong internal interest coupling, a microgrid group must also have sufficient regulatory capacity to respond to voltage needs. The voltage regulation capability indicator β is defined as:
where C is the number of microgrid groups, and Пj is the j-th microgrid cluster. δ(Пj) is the proportion of required to available voltage regulation capacity:
Here, Δ is the required voltage regulation for group j. Δ is available voltage regulation from active/reactive power. Its value can be obtained by substituting the adjustable active and reactive power [ΔPs, ΔQs] within the microgrid cluster into Equation (3).
The value range of the microgrid cluster regulation capability index β is [0, 1], and a larger value indicates a stronger ability of the microgrid cluster to participate in voltage regulation under the current division state.
3.1.3. Group Size Balance Indicator
The size of each microgrid group impacts the complexity of subsequent optimization models. Larger microgrid clusters, with more nodes, result in higher-dimensional variables in their voltage optimization control models. Unbalanced group sizes may lead to uneven computational loads. If there is a significant disparity in the sizes of microgrid clusters, it will cause substantial differences in the solution times for voltage optimization within different clusters. Consequently, optimization results may not be obtained on the same time scale, hindering the rapid regulation of voltage. Thus, the group size balance indicator γ is defined as:
where Nj is the number of nodes in group j, and N is the total number of nodes. The value range of the microgrid cluster size balancing index is (0, 1), with a larger value indicating a more balanced size distribution among the divided microgrid clusters.
Combining the above three indicators, we propose a composite partitioning index ζ:
where ω1, ω2, ω3 are weights representing the importance of each indicator, set based on the decision-maker preference.
The comprehensive division index for microgrid clusters not only reflects the degree of coupling of individual interests within each microgrid cluster but also indicates the varying capabilities of different microgrid clusters in participating in voltage regulation. In practical applications, weight determination can employ subjective weighting methods (such as AHP and expert experience), objective weighting methods (such as the entropy weight method, variance method, and PCA), or a combination of both, tailored to reflect the relative emphasis on interest coupling degree, regulation capability, and scale balance across different scenarios. Additionally, it serves to constrain the size of microgrid clusters, preventing them from becoming excessively large and thereby increasing the computational complexity of voltage optimization control models within the clusters.
3.2. Microgrid Group Partitioning Algorithm
With the large-scale integration of distributed energy resources, distribution networks are evolving into complex systems composed of interconnected nodes and lines. During the voltage regulation process, certain nodes exhibit strong community characteristics, such as the aforementioned high interest coupling and active participation in voltage regulation. Nodes within the same community typically share stronger internal correlations, while nodes belonging to different communities exhibit weaker inter-community relationships. These community attributes reflect the relational characteristics among nodes in complex networks. Community detection algorithms utilize these relationships to uncover latent structures and identify the formation mechanisms of communities within the network.
Based on the previously defined comprehensive stakeholder partitioning index, this paper applies a community detection algorithm to identify communities among distribution network nodes. The resulting communities correspond to distinct stakeholder groups within the distribution network. The implementation steps are as follows:
Step 1: Initialize each node as an individual community. Compute the initial ζ using Equation (13).
Step 2: For a given community, randomly select another to merge. Calculate the updated ζ and its increment Δζ.
Step 3: Iterate over all possible pairwise community merges. Choose the pair with the largest Δζ for merging.
Step 4: Treat the merged community as a new entity and repeat Steps 2–3.
Step 5: Terminate when no further merge increases ζ. The final partitioning is the one yielding the maximum ζ, with each community representing a microgrid group.
4. Optimization Control Model Within Microgrid Groups
4.1. Voltage Optimization Control Model for Utility-Owned Microgrids
The utility-owned microgrid group (denoted as Пgrid), primarily regulates voltage through OLTC and network reconfiguration. The regulation cost mainly includes the switching cost of the OLTC and tie switches. The objective function for voltage optimization is expressed as:
where Rk is cost per OLTC tap change; k, kpre current and previous tap positions of the OLTC; χ is set of all network nodes. Rs is cost per switching action of the tie switch; sij, is on/off states of line (i,j) at the current and previous time steps (1 for closed, 0 for open);
The constraints for the microgrid voltage optimization control model of the power company are as follows:
Constraints:
- (1)
- Power Flow Constraints
Here, Γ(i) represents the set of nodes connected to node i. and denote the injected active power and reactive power at the root node of the network, respectively. and represent the active power and reactive power output by the photovoltaic inverter at node j, with their values being constant and optimized by the photovoltaic profit entity. and denote the active and reactive load demands at node j. Pij represents the active power transmitted on line i-j, and Qij represents the reactive power transmitted on line i-j. ui and uj denote the voltages at nodes i and j, respectively. Gij, Bij and θij represent the conductance, susceptance, and phase angle difference between nodes i and j, respectively.
- (2)
- Network radial structure constraints
Here, τij is a Boolean variable that represents the direction of power flow in the line. When the power flow is from node j to node i, τij = 1. The first term in the above formula is used to ensure the bidirectionality of the power flow direction. The second term indicates that, except for the root node of the network, all other nodes have a parent node. The third term indicates that the root node does not have a parent node. Through these constraints, the radial nature of the network structure can be ensured.
- (3)
- Voltage Constraints
Here, umin and umax respectively represent the lower and upper limits of the safe operating range for node voltages.
- (4)
- OLTC Operational Constraints
In the formula, uL and uH respectively represent the voltage magnitudes on the low-voltage side and high-voltage side of the OLTC (On-Load Tap Changer), while kmin and kmax denote the minimum and maximum values of the OLTC tap position.
To efficiently solve the nonlinear optimization problem, nonlinear terms in the above constraints are linearized. (See Appendix A in the original document.)
4.2. Voltage Optimization Control Model for PV Microgrids
PV microgrids regulate voltage by adjusting active and reactive power output via inverters. The cost includes active power curtailment and inverter loss for reactive power support. The objective function is:
where Fq: Objective function of PV microgrid group Пq. RPV,P: Cost coefficient for active power curtailment; , : Available and dispatched active power at node. RPV,Q: Cost coefficient for reactive power regulation; : Reactive power output.
Constraints for this model are provided in Appendix B of the original paper, including:
- (1)
- Power flow equations;
- (2)
- Inverter operating limits (apparent power limits, power factor range);
- (3)
- Tie to OLTC and switching states from the utility microgrid.
5. Interactive Coordination Model Among Microgrid Groups
When participating in voltage regulation, any microgrid group hopes to participate in voltage regulation at the cost of its minimum adjustment cost. However, a reduction in the adjustment cost of any microgrid group implies an increase in the adjustment costs of other microgrid groups. Therefore, voltage regulation involving multiple microgrid groups is a competitive game process among them. This paper establishes a non-cooperative game model to describe the competitive game relationship among multiple microgrid groups during the voltage regulation process, thereby achieving interactive coordination among multiple microgrid groups. The model is expressed as follows:
Players: Пq (q = 1, 2, …, C), Пgrid
Strategies: Dq (q = 1, 2, …, C), Dgrid
Here:
The operating cost function: Fq(Dq, Dgrid), Fgrid(Dq, Dgrid), here q = 1, 2, …, C.
According to reference [], for a strategic game, if its strategy space is a non-empty compact convex subset of a Euclidean space and its payoff function is continuous and concave, then the game has a pure strategy Nash equilibrium. In the model presented in this paper, the strategy spaces of the game are all non-empty compact convex sets, and the payoff functions are continuous and concave. Therefore, based on the definition of equilibrium, it exists as follows:
That is, (q = 1, 2, …, C), Dgrid*, are all the optimal responses of one’s own side under the opponent’s choice of optimal strategy. In other words, under this strategy combination, all benefit subjects can achieve the minimum operating cost under the equilibrium meaning.
6. Solution Process for the Three-Layer Interactive Optimization Control of Distribution Networks
This paper proposes a three-layer interactive optimization control method for distribution networks with multiple microgrid groups. The implementation steps are as follows:
Step 1: Initialization of Regulation Devices in Each Microgrid Group
Initialize the regulation parameters for each device within the microgrid groups:
where forecasted active power of the PV at node j;
Step 2: Dynamic Microgrid Group Partitioning
Execute the stakeholder (microgrid group) partitioning process using the community detection algorithm based on the composite index ζ, and transmit the partitioning results to the parallel independent optimization layer.
Step 3: Parallel Independent Optimization Within Each Microgrid Group
Based on the dispatch variables of regulation devices and considering the constraints of each model, independently solve the voltage optimization control models for each microgrid group.
Compute the initial cost of each group:
PjPV (j∈Пq, q = 1, 2, …, C), QjPV (j∈Пq, q= 1, 2, …, C), k, sij((i,j)∈χ), Fq(q = 1, 2, …, C), Fgrid.
Step 4: Interactive Game-Based Optimization
Define the convergence threshold ϸ and compute the change in total cost:
If Δ ≤ ϸ the iteration is considered converged, and the optimal control solution is returned.
Otherwise, update the device settings:
Return to Step 2 and repeat the process until convergence is achieved.
7. Case Study and Analysis
7.1. Explanation of Example Parameters
This paper adopts a practical 10 kV feeder in China as the analysis object to verify the effectiveness of the proposed method. The topology structure of this 10 kV feeder is shown in Figure 2, comprising 69 nodes in total, forming a radial three-phase balanced system. The specific parameters of the lines are detailed in Appendix C, Table A1. The total load connection amount in the lines is 22.43 MW. OLTCs are installed in the initial sections of the lines, and the installation positions of the sectionalizing switches and tie switches are illustrated in Figure 2.
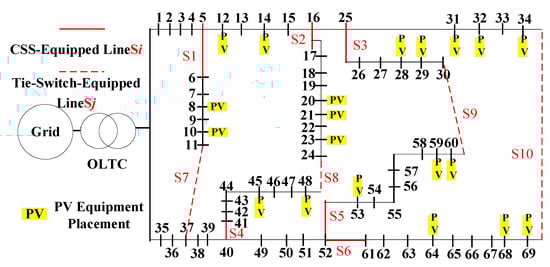
Figure 2.
A real network topology of 69 nodes system.
The total photovoltaic (PV) connection capacity in the feeder is 10.47 MW, all of which are distributed PV systems managed by PV operators. The installation locations and capacities of each PV system are shown in Appendix C, Table A2. This paper utilizes OpenDSS 2023 software for model building of the feeder and employs MATLAB R2024a to call OpenDSS 2023 for simulation analysis. In the simulation, the allowable power factor range for PV inverters is (−0.95, 0.95).
7.2. Implementation of the Method in This Paper
The node voltage distribution diagram of the 69-node feeder under no voltage regulation measures throughout the day is shown in Appendix D, Figure A1. At this time, switches S1, S2, S3, S4, S5, and S10 are in the closed state, while switches S6, S7, S8, and S9 are in the open state. It can be seen from the diagram that during most periods of the day, multiple nodes in the feeder experience voltage issues, and effective voltage regulation means must be adopted. In response to the overvoltage problem in the feeder, this paper selects the scenario with the most severe node voltage exceedance throughout the day for analysis and adopts the voltage control method proposed herein for regulation. After optimization and control using the method in this paper, the division results of the benefit subjects in the feeder, the switching states of the line switches, and the regulation amounts of the line on-load voltage regulating transformers are as shown in Table 1.

Table 1.
The partition of stakeholders and switch optimization results.
Under the control strategy in this paper, the feeder is divided into 7 photovoltaic (PV) microgrid clusters, which, together with the power company’s microgrid clusters, form multiple microgrid clusters within the feeder area. In response to the overvoltage issue in the distribution network, the power company’s microgrid has undergone network reconfiguration and on-load transformer regulation. Specifically, switches S1 and S10 have changed from their original closed state to an open state, while switches S6 and S7 have changed from an open state to a closed state, and the OLTC has been adjusted down by one tap position. Simultaneously, the PV microgrid clusters have also undergone corresponding adjustments. The active and reactive power regulation amounts managed by them are shown in Appendix D, Figure A2. After these adjustments, the voltage distribution in the distribution network is as shown in Appendix D, Figure A3. As depicted in the figure, without any voltage regulation measures, overvoltage phenomena occurred at all PV installation nodes within the distribution network. Therefore, all PV operators within each PV microgrid cluster have made adjustments to their respective PV systems. Through coordination with the power company’s microgrid, the distribution network voltage has been regulated to within the safe operating range.
7.3. Performance Analysis of Microgrid Cluster Division
The quality of microgrid cluster division directly affects the subsequent voltage control effect. In the numerical example of this paper, it is considered that the benefit coupling degree indicator, the regulation capability indicator of microgrid clusters, and the scale balance indicator of microgrid clusters are equally important for the division of microgrid clusters. Therefore, the weights are chosen as ω1 = ω2 = ω3 = 1.
During the microgrid cluster division process in this paper, the changes in the comprehensive division indicator ζ for multiple microgrid clusters in the distribution network, corresponding to different microgrid cluster divisions, are illustrated in Figure 3. As depicted in the figure, the comprehensive division indicator ζ reaches its maximum value when the PV operators within the distribution network are divided into 7 microgrid clusters.
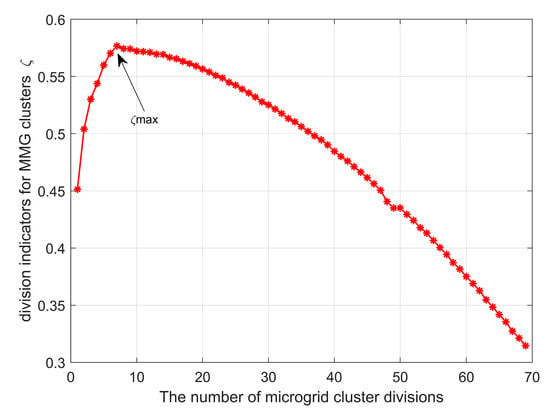
Figure 3.
Comprehensive partition index ζ versus the number of stakeholders.
Therefore, the feeder is divided into 7 PV microgrid clusters, and the node regions corresponding to each microgrid cluster are detailed in Table 1. To demonstrate the effectiveness of the multi-microgrid cluster division method proposed in this paper [,], a comparison analysis is conducted with the modularity function division method. The modularity function division method primarily constructs a modularity function for the distribution network based on its structural parameters and employs a partitioning algorithm to divide the network into regions. Under the modularity function division method, the division of PV microgrid clusters within the distribution network is presented in Table 2.
Table 2.
Partition results of modularity function.
A comparison of Table 1 and Table 2 reveals that under the modularity function division method, microgrid clusters П1 and П7 do not contain any PV systems. When overvoltage occurs in the distribution network, microgrid clusters П1 and П7 lack adjustable resources for voltage regulation, making it difficult to address the overvoltage issues within their coverage areas. In contrast, as shown in Table 1, under the method proposed in this paper, each microgrid cluster is equipped with PV systems, ensuring that there are sufficient adjustable resources within each microgrid cluster for subsequent voltage regulation.
Furthermore, Table 1 indicates that under the modularity function division method, the distribution network is divided into 10 microgrid clusters. The smallest microgrid cluster (П1) covers 4 nodes, while the largest microgrid cluster (П10) covers 13 nodes, resulting in a significant disparity in cluster sizes. However, under the method proposed in this paper, the distribution network is divided into 7 microgrid clusters. The smallest microgrid clusters (П1, П2, П4, П7) cover 9 nodes each, and the largest benefit subject (П6) covers 12 nodes. Compared to the modularity function division method, the PV microgrid clusters under the proposed method are more evenly sized, effectively preventing certain microgrid clusters from being excessively large and increasing the difficulty of solving the voltage optimization control model for microgrid clusters.
To further illustrate the effectiveness of the proposed method in this paper, the voltage control strategy presented herein was applied under two different partitioning methods for voltage control. The voltage control results are depicted in Figure 4, and a comparison of the total reactive power adjustment QPV, total active power adjustment PPV, and total cost of photovoltaic regulation FPV for photovoltaic inverters within the distribution network is presented in Table 3.
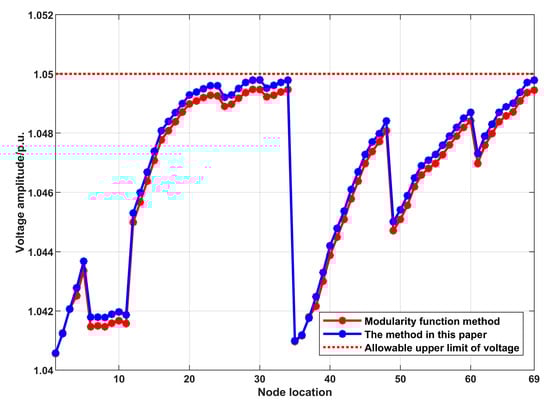
Figure 4.
Comparison of voltage profiles under the two methods.
Table 3.
Comparison of the optimization results.
The simulation results indicate that the voltage control strategy proposed in this paper can maintain voltage regulation within the safe operating range under both partitioning methods mentioned above. However, in terms of regulation cost, the proposed partitioning method incurs lower costs compared to the modularity function method. Additionally, regarding the adjustment of photovoltaic inverters, the proposed method results in higher reactive power adjustment and lower active power adjustment of the inverters. Compared to the modularity function method, the proposed approach more effectively utilizes the reactive power of photovoltaic inverters, reduces the photovoltaic curtailment rate, and exhibits superior partitioning performance.
7.4. Voltage Control Performance Analysis
To further analyze the superiority of the proposed method in distribution network voltage control, it is compared with the traditional centralized control method [] and the partitioned control method presented in reference. The traditional centralized control method regards all nodes in the distribution network as a single stakeholder and then utilizes the subsequent voltage control method proposed in this paper for voltage regulation. The optimization results of switches within the distribution network under the three voltage control methods are shown in Table 4.
Table 4.
Comparison of switch optimization.
A comparison of Table 4 reveals that the optimization results of the power company’s microgrid cluster under the centralized control method are identical to those presented in this paper, indicating that the proposed method achieves the same optimization results as centralized control in optimizing OLTC and line switches. However, under the partitioned control method, neither OLTC nor line switches are activated. This is because the partitioned control method primarily relies on local voltage regulation by photovoltaic inverters within each partition, without considering network reconfiguration or the coordination of multiple voltage regulation devices in the distribution network. Consequently, both OLTC and line switches remain inactive. The total reactive power adjustment QPV, total active power adjustment PPV, total photovoltaic regulation cost FPV, total power company regulation cost FGrid, and optimization time considering communication delay Topt for photovoltaic inverters in the distribution network under these three methods are presented in Table 5. As shown in Table 5, for the reactive power adjustment of photovoltaic inverters, the partitioned control method results in the highest total reactive power adjustment of photovoltaic inverters, while the proposed method yields the lowest total reactive power adjustment. This implies that partitioned control maximizes the utilization of reactive power from photovoltaic inverters. Regarding active power curtailment, the partitioned control method leads to the highest total active power curtailment of photovoltaics, whereas the centralized control method results in the least active power curtailment, indicating that centralized control maximizes the accommodation of photovoltaic power. In terms of optimization time, the partitioned control method has the shortest optimization time when considering communication delays, while the centralized control method has the longest optimization time. This suggests that the partitioned control method exhibits the best performance in terms of computational speed. Figure 5 illustrates the voltage distribution of the distribution network under the three different control methods.
Table 5.
Comparison of the optimization results.
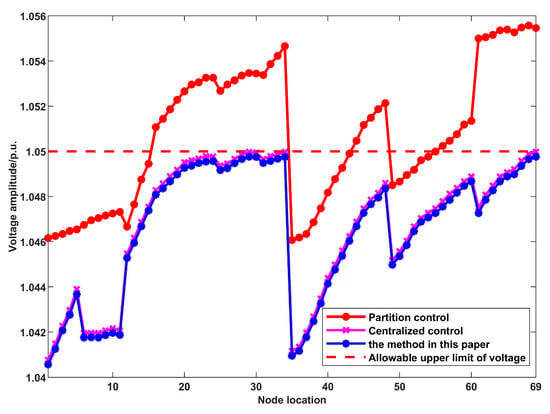
Figure 5.
Comparison of voltage profiles under the three method.
- (1)
- Partitioned control outperforms the proposed method in terms of photovoltaic inverter reactive power utilization and optimization computational performance. However, partitioned control solely relies on photovoltaic inverter regulation and fails to achieve coordinated operation among multiple voltage regulation devices within the distribution network. Consequently, it cannot regulate the distribution network voltage within the safe operating range. In contrast, the proposed method enables coordinated operation of multiple voltage regulation devices within the distribution network through an interactive game between photovoltaic microgrid clusters and power company stakeholders, thereby further regulating the distribution network voltage within the safe operating range.
- (2)
- Centralized control exhibits advantages over the proposed method in terms of photovoltaic inverter reactive power regulation, active power curtailment, and photovoltaic regulation cost. However, based on the result data, the total reactive power adjustment, total active power adjustment, and total regulation cost of photovoltaic inverters are nearly identical between the two methods. It is important to note that, considering communication delays, the optimization time of the proposed method is 63.6 s, while the optimization time of the centralized control method is 364.1 s. Under the same optimization effect, the proposed method demonstrates a faster optimization speed and significantly superior optimization computational performance compared to centralized control.
Therefore, based on the comprehensive analysis above, the proposed method is more suitable for voltage control in future distribution networks with large-scale distributed photovoltaic integration.
8. Conclusions
To address the challenges of multi-stakeholder coordination and voltage control in distribution networks with high penetration of distributed generation, this paper proposes a three-layer interactive optimization control strategy. The main contributions and conclusions are as follows:
A Multi-Stakeholder Voltage Optimization Framework is constructed, consisting of dynamic stakeholder partitioning, parallel independent optimization, and interactive game-based coordination. This structure enables effective collaboration while preserving the autonomy of each participant.
A Composite Index-Based Microgrid Grouping Method is proposed, considering interest coupling, voltage regulation capability, and group size balance. A community detection algorithm is used to dynamically partition microgrid groups based on these indicators.
Independent Voltage Optimization Models are developed for both utility-owned and PV microgrids, addressing their respective cost structures and regulation mechanisms. This allows for autonomous decision-making within each group.
A Non-Cooperative Game-Based Coordination Model is designed to resolve conflicts among different stakeholder groups and achieve an overall cost-effective regulation solution. The existence of a Nash equilibrium ensures convergence of the proposed method.
Simulation results on a real 10 kV feeder demonstrate that the proposed method effectively suppresses voltage violations, significantly reduces total regulation cost, and achieves rapid convergence. Compared to uncoordinated control, the strategy improves both voltage safety and economic performance; compared to centralized control, it better respects stakeholder autonomy and data privacy.
In practical operation, due to the significant uncertainty of photovoltaic (PV) output, there may be substantial deviations between the actual output and forecasted values. If voltage control strategies are still formulated entirely based on forecasted data, it can easily lead to ineffective voltage regulation. Therefore, subsequent research will build upon the work presented in this paper to further incorporate the uncertainty of large-scale PV output and develop a robust voltage optimization control strategy based on multi-stakeholder partitioning, thereby enhancing the distribution network’s capability to address overvoltage issues.
On the other hand, while the partitioning method proposed in this paper effectively balances interest coupling degree, regulatory capability, and scale balance in small-to-medium-scale systems, in large-scale distribution networks, the calculation of the comprehensive indicator increment Δζ during the pairwise merging process may incur significant computational overhead. Future work will focus on improving the scalability of the algorithm by exploring heuristic approaches such as local neighborhood constraints, incremental updates, and parallel computing to enhance its practicality in large-scale systems.
Author Contributions
Data curation, Software, Writing—original draft, Supervision, W.S.; Writing—review and editing, Z.Z.; Methodology, Project administration, M.D.; Investigation, J.H.; Resources, Formal analysis, R.W.; Formal analysis, Validation, C.X. All authors have read and agreed to the published version of the manuscript.
Funding
Science and Technology Project of State Grid Shandong Electric Power Company “Research and Application of Industrial Park Source-Load-Storage Coordinated Optimization Support Technology for Improving Operational Flexibility” (2024A-041).
Data Availability Statement
The original contributions presented in this study are included in the article. Further inquiries can be directed to the corresponding author.
Conflicts of Interest
Authors Wenchuan Sun, Zhongtang Zhou, Ming Du, and Jiawei Huang are employed by Linyi Power Supply Company of the State Grid Shandong Electric Power Company. The remaining authors declare that the research was conducted in the absence of any commercial or financial relationships that could be construed as a potential conflict of interest. The authors declare that this study received funding from Science and Technology Project of State Grid Shandong Electric Power Company. The funder was not involved in the study design, collection, analysis, interpretation of data, the writing of this article, or the decision to submit it for publication.
Appendix A
The model contains nonlinear constraints, primarily Equations (15)–(18), which are processed as follows.
Substituting the above equations into Equations (17) and (18) allows them to be transformed into:
The last term of the above equation can be relaxed using a second-order cone constraint, transforming it into the standard form of a second-order cone:
For the nonlinear term involving the product of sij and Pij still present in Equation (15), the “branch voltage” method from reference [] is adopted for linearization:
where and UIJ, respectively, denote the node voltage variables Ui and Uj which correspond to the “branch voltage” variables associated with branch i-j. From the above equation, it can be seen that when branch i-j is disconnected, both and become 0. When branch i-j is connected, UiIJ = Ui and UjIJ = Uj. Hence, Equations (17) and (18) can be transformed into:
At this point, all constraints in the model have been transformed into either linear or second-order cone forms. The model is now converted into a Mixed-Integer Second-Order Cone Programming (MISOCP) problem, which can be efficiently solved using Cplex.
Appendix B
The constraints of the photovoltaic microgrid voltage optimization control model are as follows:
where Equations (A8) to (A11) represent the power flow constraints. Equations (A12) to (A13) describe the operational constraints of the photovoltaic inverters, where denotes the apparent capacity of the photovoltaic inverter at node j, and θmin represents the minimum allowable power factor angle for the inverter. is the optimized active power output value of the photovoltaic system at node j, indicates the reactive power regulation value of the photovoltaic inverter at node j, which is calculated by other microgrid clusters excluding the power flow equation Пq of the photovoltaic microgrid cluster. k* denotes the tap position of the OLTC, and represents the switching status variable of branch i-j. Both k* and are provided by the power company’s microgrid cluster optimization.
Appendix C
Table A1.
Parameters of the 10kV radial feeder.
Table A1.
Parameters of the 10kV radial feeder.
| Starting Node | Terminal Point | Line Impedance (Ω/km) | Line Model | Distance (km) | Starting Node | Terminal Point | Line Impedance (Ω/km) | Line Model | Distance (km) |
|---|---|---|---|---|---|---|---|---|---|
| 0 | 1 | 0.0754 + j0.085 | DL-300 | 0.92 | 34 | 69 | 0.099 + j0.093 | JKLY-185 | 0.574 |
| 1 | 2 | 0.099 + j0.093 | JKLY-185 | 0.221 | 0 | 35 | 0.0754 + j0.085 | DL-300 | 0.88 |
| 2 | 3 | 0.099 + j0.093 | JKLY-185 | 0.099 | 35 | 36 | 0.099 + j0.093 | JKLY-185 | 0.102 |
| 3 | 4 | 0.099 + j0.093 | JKLY-185 | 0.203 | 36 | 37 | 0.099 + j0.093 | JKLY-185 | 0.036 |
| 4 | 5 | 0.099 + j0.093 | JKLY-185 | 0.106 | 37 | 38 | 0.099 + j0.093 | JKLY-185 | 0.036 |
| 5 | 6 | 0.099 + j0.093 | JKLY-185 | 0.459 | 38 | 39 | 0.099 + j0.093 | JKLY-185 | 0.108 |
| 6 | 7 | 0.099 + j0.093 | JKLY-185 | 0.274 | 39 | 40 | 0.099 + j0.093 | JKLY-185 | 0.105 |
| 7 | 8 | 0.099 + j0.093 | JKLY-185 | 0.312 | 40 | 41 | 0.099 + j0.093 | JKLY-185 | 0.336 |
| 8 | 9 | 0.099 + j0.093 | JKLY-185 | 0.233 | 41 | 42 | 0.099 + j0.093 | JKLY-185 | 0.201 |
| 9 | 10 | 0.099 + j0.093 | JKLY-185 | 0.085 | 42 | 43 | 0.099 + j0.093 | JKLY-185 | 0.146 |
| 10 | 11 | 0.099 + j0.093 | JKLY-185 | 0.157 | 43 | 44 | 0.099 + j0.093 | JKLY-185 | 0.157 |
| 11 | 37 | 0.32 + j0.119 | JKLY-70 | 0.681 | 44 | 45 | 0.099 + j0.093 | JKLY-185 | 0.056 |
| 5 | 12 | 0.099 + j0.093 | JKLY-185 | 0.311 | 45 | 46 | 0.099 + j0.093 | JKLY-185 | 0.201 |
| 12 | 13 | 0.099 + j0.093 | JKLY-185 | 0.073 | 46 | 47 | 0.32 + j0.119 | JKLY-70 | 0.133 |
| 13 | 14 | 0.099 + j0.093 | JKLY-185 | 0.315 | 47 | 48 | 0.099 + j0.093 | JKLY-185 | 0.092 |
| 14 | 15 | 0.099 + j0.093 | JKLY-185 | 0.618 | 40 | 49 | 0.32 + j0.119 | JKLY-70 | 0.364 |
| 15 | 16 | 0.099 + j0.093 | JKLY-185 | 0.445 | 49 | 50 | 0.099 + j0.093 | JKLY-185 | 0.136 |
| 16 | 17 | 0.32 + j0.119 | JKLY-70 | 0.059 | 50 | 51 | 0.099 + j0.093 | JKLY-185 | 0.122 |
| 17 | 18 | 0.32 + j0.119 | JKLY-70 | 0.141 | 51 | 52 | 0.099 + j0.093 | JKLY-185 | 0.141 |
| 18 | 19 | 0.32 + j0.119 | JKLY-70 | 0.202 | 52 | 53 | 0.32 + j0.119 | JKLY-70 | 0.335 |
| 19 | 20 | 0.32 + j0.119 | JKLY-70 | 0.284 | 53 | 54 | 0.32 + j0.119 | JKLY-70 | 0.335 |
| 20 | 21 | 0.32 + j0.119 | JKLY-70 | 0.163 | 54 | 55 | 0.32 + j0.119 | JKLY-70 | 0.114 |
| 21 | 22 | 0.099 + j0.093 | JKLY-185 | 0.249 | 55 | 56 | 0.32 + j0.119 | JKLY-70 | 0.143 |
| 22 | 23 | 0.099 + j0.093 | JKLY-185 | 0.27 | 56 | 57 | 0.32 + j0.119 | JKLY-70 | 0.103 |
| 23 | 24 | 0.099 + j0.093 | JKLY-185 | 0.05 | 57 | 58 | 0.32 + j0.119 | JKLY-70 | 0.096 |
| 24 | 48 | 0.099 + j0.093 | JKLY-185 | 0.435 | 58 | 59 | 0.32 + j0.119 | JKLY-70 | 0.101 |
| 16 | 25 | 0.32 + j0.119 | JKLY-70 | 0.447 | 59 | 60 | 0.32 + j0.119 | JKLY-70 | 0.156 |
| 25 | 26 | 0.32 + j0.119 | JKLY-70 | 0.367 | 52 | 61 | 0.32 + j0.119 | JKLY-70 | 0.418 |
| 26 | 27 | 0.32 + j0.119 | JKLY-70 | 0.085 | 61 | 62 | 0.32 + j0.119 | JKLY-70 | 0.056 |
| 27 | 28 | 0.32 + j0.119 | JKLY-70 | 0.13 | 62 | 63 | 0.32 + j0.119 | JKLY-70 | 0.048 |
| 28 | 29 | 0.32 + j0.119 | JKLY-70 | 0.09 | 63 | 64 | 0.32 + j0.119 | JKLY-70 | 0.094 |
| 29 | 30 | 0.32 + j0.119 | JKLY-70 | 0.22 | 64 | 65 | 0.32 + j0.119 | JKLY-70 | 0.121 |
| 30 | 60 | 0.099 + j0.093 | JKLY-185 | 0.574 | 65 | 66 | 0.32 + j0.119 | JKLY-70 | 0.136 |
| 25 | 31 | 0.32 + j0.119 | JKLY-70 | 0.341 | 66 | 67 | 0.32 + j0.119 | JKLY-70 | 0.065 |
| 31 | 32 | 0.32 + j0.119 | JKLY-70 | 0.302 | 67 | 68 | 0.32 + j0.119 | JKLY-70 | 0.162 |
| 32 | 33 | 0.32 + j0.119 | JKLY-70 | 0.362 | 68 | 69 | 0.32 + j0.119 | JKLY-70 | 0.159 |
| 33 | 34 | 0.32 + j0.119 | JKLY-70 | 0.063 |
Table A2.
Capacity and locations of the installed PV.
Table A2.
Capacity and locations of the installed PV.
| Node | Capacity/kW | Node | Capacity/kW | Node | Capacity/kW |
|---|---|---|---|---|---|
| 8 | 200 | 10 | 502 | 11 | 81 |
| 12 | 407 | 14 | 102 | 20 | 500 |
| 21 | 512 | 23 | 501 | 28 | 512 |
| 29 | 501 | 31 | 400 | 32 | 500 |
| 34 | 600 | 45 | 700 | 48 | 850 |
| 53 | 400 | 59 | 780 | 60 | 800 |
| 64 | 600 | 68 | 800 | 69 | 390 |
Appendix D

Figure A1.
A real network topology of 30 nodes system.

Figure A2.
The regulated active and reactive power of PVs under the proposed method.

Figure A3.
Voltage profiles under the proposed method.
References
- Cui, Y.; Zou, X.; Zhao, Y. Electricity-carbon integrated demand response scheduling method for new power system considering dynamic electricity-carbon emission factor. Electr. Power Autom. Equip. 2024, 44, 1–7. [Google Scholar] [CrossRef]
- Zhou, X.; Zhao, Q.; Zhang, Y. Analysis of the Development Trend of China’s Energy and Power System Under the Dual Carbon Target: Green Electricity Substitution and Green Hydrogen Substitution. Proc. CSEE 2024, 44, 6707–6721. [Google Scholar] [CrossRef]
- Ou, L.; Jiang, T.; Zhang, Y. Multi-time scale voltage control method of distribution network with high-penetration distributed PV considering reactive power regulation of converter. Electr. Power Autom. Equip. 2024, 44, 221–230. [Google Scholar] [CrossRef]
- Ma, D.; Xing, M.; Hu, X. Distributed collaborative optimization dispatch in new power systems: A survey. Control Decis. 2025, 40, 2337–2360. [Google Scholar] [CrossRef]
- Zhang, B.; Gao, Y.; Li, T. Data-driven Voltage/Var Optimization Control of Active Distribution Network Considering the Reliability of Photovoltaic Power. Proc. CSEE 2024, 44, 5934–5947. [Google Scholar] [CrossRef]
- Kang, T.; Liu, K.; Li, Z. Hierarchical Voltage Coordination Control Strategy of Middle-and Low-voltage Level Power Distribution Network Based on Photovoltaic Inverter Adjustments. High Volt. Eng. 2024, 50, 1225–1234. [Google Scholar] [CrossRef]
- Liu, S.; Guo, C.; Feng, B. Active voltage control method of distributed photovoltaic based on value decomposition deep reinforcement learn. Electr. Power Autom. Equip. 2023, 43, 152–159. [Google Scholar] [CrossRef]
- Li, S.W.; Wu, H.B.; Zhou, Y.Y. Two-stage voltage control strategy in distribution networks with coordinated multimode operation of PV inverters. IET Renew. Power Gener. 2023, 17, 66–82. [Google Scholar] [CrossRef]
- Tasnim, S.; Sarimuthu, C.R.; Lan, B.L. A game theory approach for OLTC voltage control operation in an active distribution network. Electr. Power Syst. Res. 2023, 214, 108861. [Google Scholar] [CrossRef]
- Spertino, F.; Ciocia, A.; Mazza, A. Voltage control in low voltage grids with independent operation of on-load tap changer and distributed photovoltaic inverters. Electr. Power Syst. Res. 2022, 211, 108187. [Google Scholar] [CrossRef]
- Hu, R.; Wang, W.; Wu, X. Coordinated active and reactive power control for distribution networks with high penetrations of photovoltaic systems. Sol. Energy 2022, 231, 809–827. [Google Scholar] [CrossRef]
- Alabri, W.; Jayaweera, D. Optimal coordination of unbalanced power distribution systems with integrated photovoltaic systems and semi-fast electric vehicles charging stations. IET Gener. Transm. Distrib. 2022, 16, 2399–2415. [Google Scholar] [CrossRef]
- Jiao, W.S.; Chen, J.; Wu, Q.W. Distributed coordinated voltage control for distribution networks with DG and OLTC based on MPC and gradient projection. IEEE Trans. Power Syst. 2022, 37, 680–690. [Google Scholar] [CrossRef]
- Miao, L.; Peng, Y.; Hu, D. Data-driven Reactive Power Optimization Strategy of Distribution Network Based on Autoencoder Constrained Temporal Convolutional Networks. High Volt. Eng. 2024, 50, 4058–4068. [Google Scholar] [CrossRef]
- Qian, L.; Wei, Q.; Hu, P. Online Reactive Power Optimization Method Based on Data-driven Predictive Control for DistributionNetwork with Low Situation Awareness. Autom. Electr. Power Syst. 2025, 49, 61–69. [Google Scholar] [CrossRef]
- Xiao, C.; Ding, M.; Sun, L. Network partition-based two-layer optimal scheduling for active distribution networks with multiple stakeholders. IEEE Trans. Ind. Inform. 2021, 17, 5948–5960. [Google Scholar] [CrossRef]
- Huang, D.; Yang, K.; Yu, J. Research on Voltage Regulation Strategy of Distributed Photovoltaic Cluster Considering the Payload Bal. Power Syst. Technol. 2024, 48, 4275–4287. [Google Scholar] [CrossRef]
- Ge, J.; Liu, Y.; Pang, D. Cluster Division Voltage Control Strategy of Photovoltaic Distribution Network with High Permeability. High Volt. Eng. 2024, 50, 74–82. [Google Scholar] [CrossRef]
- Zhao, B.; Xu, Z.; Xu, C.C. Network partition based zonal voltage control for distribution networks with distributed PV systems. IEEE Trans. Smart Grid 2018, 9, 4087–4098. [Google Scholar] [CrossRef]
- Li, X.; Xie, J.; Zhang, S. A Two-Stage Robust Strategy for Voltage/Var Control in Active Distribution Networks Based on Cluster Partitioning. Proceedings of the CSEE, 1–14. [2025-08-22]. Available online: https://link.cnki.net/urlid/11.2107.tm.20240930.1418.003 (accessed on 22 August 2025).
- Zhou, Y.; Zhou, Y.; Zhao, C. Voltage control strategy for integrated photovoltaic and energy storage in distribution network based on improved MASAC algorithm. Electr. Power Autom. Equip. 2025, 45, 190–198. [Google Scholar] [CrossRef]
- Li, C.; Miao, S.; Sheng, W. Optimization operation strategy of active distribution network considering dynamic network reconfiguration. Trans. China Electrotech. Soc. 2019, 34, 3909–3919. [Google Scholar] [CrossRef]
- Zeng, J.; Tan, H.; Liu, J. Research on optimization algorithm of microgrid energy management based on a state potential game. Power Syst. Prot. Control 2025, 53, 24–34. [Google Scholar] [CrossRef]
- Wang, Y.; Wu, J.; Yuan, M. Dynamic partitioning method and optimized operation strategy for distribution network clusters considering photovoltaic integration. Electr. Power Autom. Equip. 2025, 45, 122–129+147. [Google Scholar] [CrossRef]
- Antoniadou-Plytaria, K.E.; Kouveliotis-Lysikatos, I.N.; Georgilakis, P.S.; Hatziargyriou, N.D. Distributed and Decentralized Voltage Control of Smart Distribution Networks: Models, Methods, and Future Research. IEEE Trans. Smart Grid 2017, 8, 2999–3008. [Google Scholar] [CrossRef]
Disclaimer/Publisher’s Note: The statements, opinions and data contained in all publications are solely those of the individual author(s) and contributor(s) and not of MDPI and/or the editor(s). MDPI and/or the editor(s) disclaim responsibility for any injury to people or property resulting from any ideas, methods, instructions or products referred to in the content. |
© 2025 by the authors. Licensee MDPI, Basel, Switzerland. This article is an open access article distributed under the terms and conditions of the Creative Commons Attribution (CC BY) license (https://creativecommons.org/licenses/by/4.0/).