Abstract
The semi-active cab suspension system for trucks is gaining increasing importance due to its economic advantages, low energy consumption, and significant enhancement of ride comfort. This paper investigates the effects of three control methods on improving ride comfort of semi-active cab suspension systems under random and bump road conditions: Proportional-Integral-Derivative (PID) control, fuzzy PID control, and Model Predictive Control (MPC). Initially, an accurate multi-degree-of-freedom truck cab suspension model was developed and validated through actual road tests. Based on this model, three control strategies were designed and implemented. Finally, the effectiveness of each control strategy was evaluated under various road conditions, including random and bump road scenarios. The results indicate that these control strategies can effectively reduce vibrations and impacts, significantly improving ride comfort. This improvement is crucial for alleviating driver fatigue and enhancing driving safety. Among them, the MPC control showed superior performance, reducing vibrations by at least 31% under both random and bump road conditions, outperforming PID and Fuzzy PID in terms of effectiveness and robustness.
1. Introduction
Trucks are composed of multiple intricate components, including the cab, frame, and wheels. During operation, uneven road surfaces can induce vibrations and shocks that are transmitted to the cab through the cab suspension, suspension, and tires, consequently impacting the driver’s comfort and driving safety. The primary function of the cab suspension system is to isolate road-induced vibrations, thereby reducing vibrations within the cab to enhance driver comfort and ensure driving safety. Therefore, investigating cab suspension systems is crucial for enhancing driving comfort and safety [1,2,3,4,5,6,7].
For the cab suspension system, research primarily focuses on three categories: passive suspension, semi-active suspension, and active suspension. Among these, semi-active suspension has garnered attention due to its combination of the advantages of both passive and active suspension systems. Compared to passive suspension, semi-active suspension demonstrates superior performance in enhancing driving comfort and vehicle stability [8], Compared to active suspension systems, semi-active suspension systems require only a small amount of external energy input, resulting in lower energy consumption and cost [9]. Control technology plays a crucial role in semi-active cab suspension systems. Superior control technology can mitigate vehicle jolts on uneven surfaces, effectively manage body posture, and enhance driving safety. Conversely, if the control technology is poorly implemented, its performance may be inferior to that of traditional passive suspension systems [10,11,12]. Inappropriate control logic may lead to excessive adjustments, which not only reduces driving comfort but also increases the risk of driving. Therefore, developing high-performance control technologies is of utmost importance. Common control methods for semi-active cab suspensions include PID [13,14], sliding mode control [15,16], optimal control [17], and fuzzy control [18,19], and neural network control [20].
Optimal control techniques are widely used in the semi-active control systems of cab suspensions. Two primary methods, the Linear Quadratic Regulator (LQR) and Linear Quadratic Gaussian (LQG), achieve optimal performance by determining the weighted matrices for system states and control variables [21]. Xia et al. developed an LQG control strategy for truck active suspension systems to improve cargo integrity and other performance aspects. Their four-degree-of-freedom active suspension model showed significant enhancements in cargo integrity, ride comfort, and handling stability over passive suspension systems through time-domain and frequency-domain simulations [22]. Gandhi et al. evaluated the LQR’s effectiveness in a four-degree-of-freedom half-car suspension model using MATLAB-Simulink simulations, which indicated that LQR significantly improves ride quality and passenger comfort [23]. Yan and Zhang explored LQG control for heavy truck cab active suspension systems to boost ride comfort and safety. Their study, involving a half-truck cab active suspension model and a linear quadratic optimal control strategy, demonstrated marked reductions in vertical cab acceleration, roll angle, and pitch angle acceleration, enhancing overall ride comfort and driving safety [24]. Model Predictive Control (MPC) is an advanced strategy that guides current control decisions by predicting future system behavior. Unlike LQR and PID control, which only constrain input and output variables, MPC can handle various constraints on state variables, providing exceptional performance for complex systems. Lu et al. proposed a coordinated semi-active suspension system for trucks using MPC to improve ride comfort by addressing vertical, roll, and pitch vibrations. Co-simulations between ADAMS/Car and MATLAB/Simulink showed that MPC outperforms Skyhook control, optimizing truck cab dynamics and significantly enhancing driver comfort during long-haul transportation [25]. Yang et al. utilized an MPC algorithm that enhances vehicle suspension systems through road surface recognition. By tracking road parameters and employing a Bayesian approach to optimize suspension control, the MPC algorithm significantly reduces acceleration, suspension displacement, and tire displacement compared to passive suspension systems, thereby improving passenger comfort across various speeds and road conditions [26].
Fuzzy control is extensively utilized in semi-active cab suspension systems, primarily due to its ability to manage complex and nonlinear dynamic behaviors. This method enhances driving comfort and safety across diverse road conditions. Furthermore, fuzzy control is highly robust in addressing uncertainties and disturbances, which improves the system’s stability and reliability in challenging driving environments. Ning et al. introduced a semi-active control approach for active seat suspension using a disturbance observer-based Takagi-Sugeno (TS) fuzzy controller. This approach incorporates acceleration feedback to boost the controller’s performance and stability, compensating for disturbances like friction and model simplification. It emphasizes minimizing low-frequency vibrations to enhance ride comfort and reduce driver fatigue [27]. Nguyen et al. devised a PID-fuzzy control strategy for cab isolation systems, merging fuzzy and PID control to mitigate vibrations in the cab isolation frame. Research has shown significant reductions in the power spectral density (PSD) and weighted root mean square (RMS) values of vertical driver seat and pitch cab angle vibrations, especially under high-density elastoplastic soil conditions [28]. Liem et al. explored the use of fuzzy logic controllers in heavy truck cab isolation systems, aiming to improve ride comfort by reducing the RMS acceleration of the driver’s seat and the pitch and roll angles of the cab. Their findings demonstrated that RMS acceleration is considerably decreased across various road conditions, highlighting the effectiveness of fuzzy logic control in enhancing ride comfort and reducing vibrations compared to passive isolation systems [29].
In semi-active cab suspension control research, simplified multi-degree-of-freedom models are commonly employed. Nguyen et al. studied the ride comfort of an 8-degree-of-freedom heavy truck cab. Their study utilized an 8-degree-of-freedom dynamic model with Matlab/Simulink and fuzzy logic control, demonstrating significant improvements in ride comfort on both step and random road surfaces [30]. Akçay et al. developed a three-degree-of-freedom cab model using stochastic optimal control to analyze and improve truck driving dynamics. Their research compared LQG design with reduced-order controllers, showing that both effectively attenuated cab vibrations. HIFOO optimization presented a promising alternative, excelling in minimizing heave, pitch, and roll accelerations under random road excitation [31]. Basaran et al. proposed a seven-degree-of-freedom truck cab suspension model using an adaptive vector backstepping control method. The proposed control system aimed to improve the vibration control of the truck cab, significantly suppressing vibrations under various road conditions, thereby enhancing driver comfort and safety [32]. The truck cab suspension system is a complex system, and establishing an accurate dynamic model is crucial for designing suspension control strategies. A common issue in most studies on semi-active cab suspension models is the lack of effective model validation. Accurate simulation of the cab’s dynamic response is crucial for designing control strategies, as it directly impacts the performance of the suspension system. To address this research gap, this paper develops a precise ten-degree-of-freedom dynamic model for a truck cab suspension system, validated through real vehicle testing. We employed 3D accelerometers and data acquisition equipment to collect dynamic response data of the cab suspension at various vehicle speeds. These collected responses were then compared with the model’s data, verifying the accuracy of the model. Based on this validated model, three different control strategies were designed to enhance ride comfort. The performance of these strategies was subsequently compared and evaluated under various driving conditions.
The key contributions of this research are summarized as follows:
- An accurate four-wheel road model was constructed, with the actual road surface roughness of the test road measured;
- The accuracy of the full-vehicle cab suspension model was verified experimentally;
- Three control strategies for semi-active suspension control were proposed;
- The performance of the control strategies was evaluated on both random and bumpy roads.
The structure of this paper is as follows: Section 2 details the establishment and validation of the accurate semi-active cab suspension and road models. Section 3 describes the three proposed control strategies. Section 4 examines the performance of the various control strategies under different scenarios. Finally, Section 5 provides a summary.
2. Model and Verification
2.1. The Truck Cab Suspension Model
The truck cab suspension model discussed in this paper encompasses the cab, frame, wheels, cab suspension, and suspension system. As depicted in Figure 1, the model includes various degrees of freedom: the wheels possess four vertical degrees of freedom, the frame has three degrees of freedom (vertical motion, roll, and pitch), and the cab has three degrees of freedom (vertical motion, roll, and pitch). The model also takes into account the uneven effects of road disturbances on the front and rear wheels, as well as on the left and right sides. Compared to the traditional quarter-car model, this more comprehensive multi-degree-of-freedom vehicle model can more accurately represent the dynamic behavior of the vehicle under actual driving conditions [33,34].
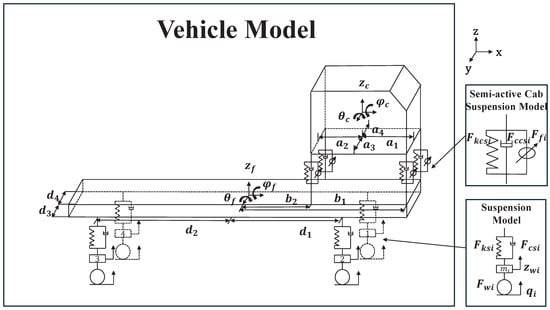
Figure 1.
Schematic diagram of the truck cab suspension model.
According to Newton’s second law, the vertical vibration differential equation of the wheel assembly is illustrated by Equation (1):
The frame is supported by four suspensions and, in turn, the cab is supported by four cab mounts. The differential equations governing the vertical, pitch, and roll motions of the frame are presented in Equation (2):
The cab, supported by four cab mounts, exhibits vertical, pitch, and roll motions, the control differential equations of which are demonstrated in Equation (3):
where represents the mass of the four tire components, while and denote the masses of the vehicle frame and cab, respectively. and signify the moments of inertia of the frame and cab in the x-direction, and and denote the moments of inertia in the y-direction for the frame and cab, respectively. Parameters , , and are geometric dimensions of the vehicle, with their specific meanings illustrated in Figure 1. The forces , , , , , and correspond to the tire force, suspension stiffness force, suspension damping force, cab suspension stiffness force, cab suspension damping force, and semi-active suspension control force, respectively. Table 1 enumerates the specific values for the vehicle’s mass, moments of inertia, and geometric dimensions.

Table 1.
Vehicle parameters.
The absolute displacement of the suspension is described by Equation (4):
where is the distance from the suspension to the vehicle’s center of mass, is the distance from the lower support point of the cab suspension to the vehicle’s center of mass, representing geometric parameters, and is the distance from the upper support point of the cab suspension to the center of mass of the cab. The variable q denotes the road excitation, is the vertical displacement of the suspension spring, is the vertical displacement of the frame, and is the vertical displacement of the cab. The relative displacements and velocities are provided in Appendix A.
The mechanical characteristics of the damper exhibit significant nonlinearity, which is crucial to the overall vehicle performance. The damping force as a function of relative velocity v is obtained by fitting experimental data using a cubic polynomial, as shown in Equation (5):
where represents the damping force of the shock absorber. The coefficient denotes the damping coefficients obtained through polynomial fitting. The specific parameters are listed in Table 2.
Table 2.
Shock absorber parameters.
To accurately describe the nonlinear characteristics of tires, this study employs a quadratic curve fitting method to analyze experimental data obtained under different tire pressure conditions. A quadratic polynomial is chosen for fitting, as shown in Equation (6):
where represents the vertical tire force, denotes the stiffness coefficients, and x represents the tire displacement.
The stiffness coefficients exhibit a linear relationship with the tire pressure p, fitted using a linear polynomial as shown in Equation (7):
The specific values of the coefficients are detailed in Table 3. The specific fitting results of the damper force and tire force are presented in Appendix B.
Table 3.
The coefficients .
2.2. Road Surface Model
2.2.1. Single Wheel Road Surface Model
The primary factor contributing to vibrations caused by vehicles is the roughness of the road surface, which can be characterized by its spatial power spectral density. This spatial frequency correlates with temporal frequency and varies with the vehicle’s speed [35,36]. When a vehicle travels at a speed u on a road surface with a spatial frequency n, the resulting temporal frequency f can be determined, as shown in Equation (8):
The relationship between the spatial power spectral density and the temporal power spectral density is described by Equation (9):
where is the temporal power spectral density, and is the spatial power spectral density.
The road’s power spectral density is defined by Equation (10):
where represents the roughness coefficient of the road surface, n is the spatial frequency, is the reference spatial frequency (commonly set to 0.1), and w is the slope of the power spectral density, typically valued at −2.
By substituting Equation (9) into Equation (10), the temporal power spectral density can be expressed as Equation (11):
Expressing the vehicle speed u (in m/s) in terms of angular frequency (in rad/s), where , and substituting this into Equation (11) gives us Equation (12):
When , approaches infinity, which is not feasible in practical engineering contexts. To accurately depict the road conditions at low frequencies, a spatial cutoff frequency is introduced. Including this cutoff frequency into Equation (12) results in Equation (13):
Using the principles of random vibration, Equation (14) can be derived:
where is the frequency response function of the system, and is the power spectral density of white noise, with . By combining Equations (13) and (14), we obtain the system’s frequency response function as expressed in Equation (15):
Therefore, the time domain model for the road surface roughness, modeled as filtered white noise, is given by Equation (16):
2.2.2. Correlation of Road Inputs for Front and Rear Wheels
Assuming the front and rear wheel tracks of the vehicle are the same and the vehicle is moving in a straight line at a constant speed, the rear wheel road input is a time-delayed version of the front wheel road input. The relationship between the front and rear wheel road white noise inputs is given by Equation (17):
The time delay is defined by Equation (18):
where represents the rear wheel input, represents the front wheel input, L is the wheelbase, and u is the vehicle speed.
2.2.3. Correlation of Road Inputs for Left and Right Wheels
The correlation function of the road inputs for the left and right wheel tracks, , is given by Equation (19):
Reference [37] presents a relatively simple and realistic mathematical model for four-wheel road input, described by Equation (20):
where B is the vehicle’s wheel track and s is a fitting parameter.
By combining Equations (19) and (20) and using a first-order Pade approximation, we obtain Equation (21):
Applying the inverse Laplace transform to the above equation, we obtain Equation (22):
Thus, the trajectory equation for the left and right wheels can be expressed by Equation (23):
2.2.4. Four-Wheel Pavement Simulation Results
Based on the pavement model formula established in Section 2.2, the primary variables for different pavements are the pavement roughness coefficient and vehicle speed u. According to the ISO 8608 standard [38], the range of roughness coefficients for various pavement grades is shown in Table 4.
Table 4.
Road Surface Levels.
Here, we utilized the MATLAB/Simulink platform to simulate vehicle travel on Class A pavement. According to Table 1, the power spectral density function for Class A pavement is represented as . The vehicle speed u was set to 10 m/s. The time domain plot of the Class A pavement, as obtained from the simulation, is shown in Figure 2.
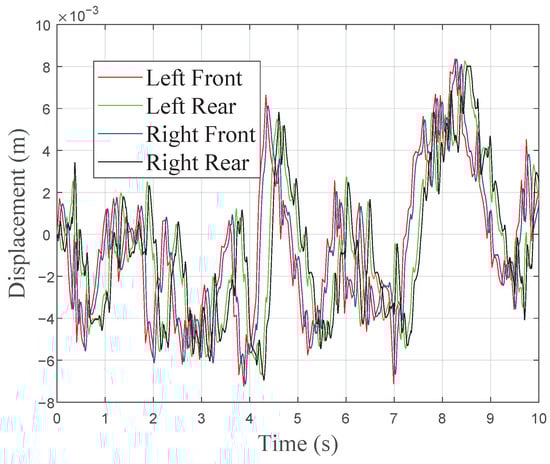
Figure 2.
The Class A road.
We conducted a spectral analysis using the pwelch function in MATLAB. This function calculated the temporal power spectral density, which we then converted to spatial power spectral density using Equation (8), as illustrated in Figure 3.
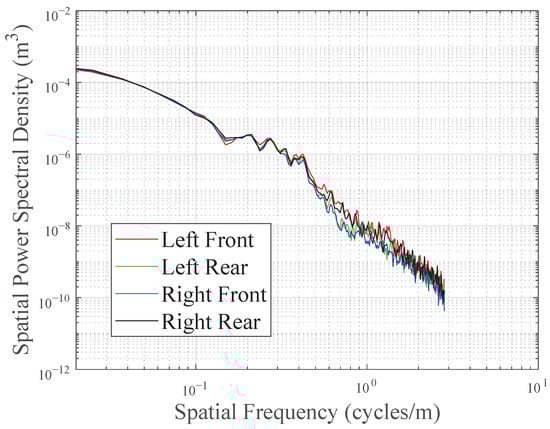
Figure 3.
The spatial power spectral density of the Class A road.
2.3. Measurement of Road Surface Roughness
In this study, the three-meter ruler method was employed to measure road surface roughness. The primary instruments used were a three-meter road inspection ruler and a feeler gauge, as illustrated in Figure 4. The feeler gauge with height markings was inserted into the gap to measure the maximum gap height, accurate to 0.2 mm.
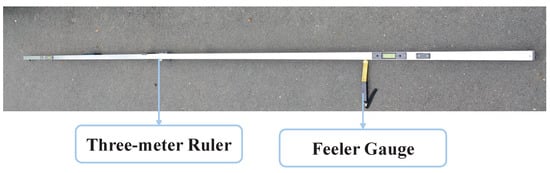
Figure 4.
The three-meter road inspection ruler.
The experimental road surface is located on Sanxia Road in Shiyan City, Hubei Province. The calculation method for single-rod road surface flatness involves taking the maximum gap value between the three-meter ruler and the road surface as the measurement result. Continuous measurements were taken 100 times along a 300 m road section, and the average value was obtained, the measured value d = 3 mm.
The Power Spectral Density (PSD) values were calculated following the method described in the literature [39]. By fitting the d values and the International Roughness Index (IRI) data, a conversion formula between the two was derived, as shown in Equation (24) below:
Based on the aforementioned relationship, the formula for calculating the Power Spectral Density of the tested pavement is as follows:
Finally, the measured of the tested road surface, rounded to the nearest whole number, is .
2.4. Road Test Experiment
Experimental Equipment
In this experiment, the equipment used is illustrated in Figure 5. The data acquisition system utilizes a Siemens LMS data collector, operated in conjunction with Test.Lab software version 18.0. The sensors employed are PCB Model 356A16 accelerometers from the United States, characterized by a ±50 g peak range and a 0.0001 g rms resolution. The calibration of the sensors follows the sensitivity calibration data provided by the manufacturer. The test vehicle is a Dongfeng Tianjin commercial truck. During testing, the driver ensures that the speed measurement error is within 0.5 m/s to meet the precision requirements of the experiment.
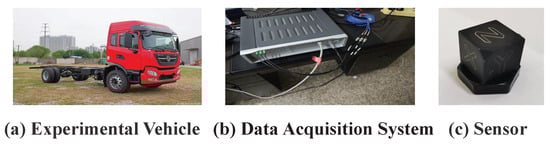
Figure 5.
Experimental equipment: (a) Dongfeng Tianjin experimental truck. (b) LMS data acquisition equipment. (c) Triaxial accelerometer.
The accelerometers are mounted on the seat floor of the cab, and the data acquisition system is connected to a computer to verify the integrity and normalcy of data collection. After installation, it is necessary to calibrate the sensor’s measurement direction to align with the actual spatial coordinate system and adjust the measurement range to avoid data loss due to exceeding the range. The specific installation location is shown in Figure 6.
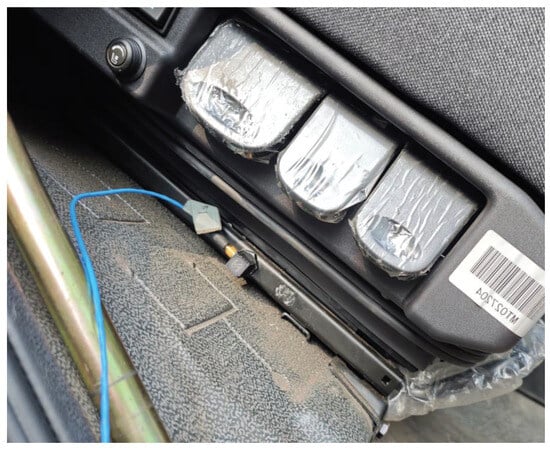
Figure 6.
Sensor installation position.
2.5. Data Filtering
During vehicle operation, road surface irregularities induce vertical vibrations in the vehicle, typically within the frequency range of 0.5 to 15 Hz. In contrast, high-frequency vibrations caused by short-wave stimuli such as engine vibrations fall within the range of 50 to 250 Hz. To effectively filter out these high-frequency vibrations, a second-order Infinite Impulse Response (IIR) digital band-pass filter can be employed, with cutoff frequencies set between 0.5 and 15 Hz. Figure 7 illustrates the effect of filtering on the acceleration signal within the cab of a vehicle traveling at a speed of 20 km/h.
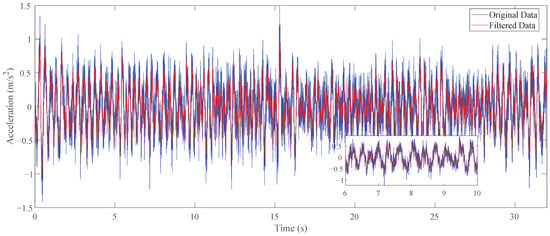
Figure 7.
Experimental data filtering.
From Figure 7, it is evident that the filter successfully eliminates high-frequency vibration noise (e.g., engine noise) while preserving the low-frequency vibration characteristics induced by road surface irregularities. This significantly enhances the usability and accuracy of the signal.
2.6. Model Validation
Ensuring the accuracy of the model is crucial in the development of a semi-active suspension system. This study validates the model’s accuracy by comparing the acceleration data generated from the simulation with the actual measured data. The specific method is illustrated in Figure 8, with the following steps:
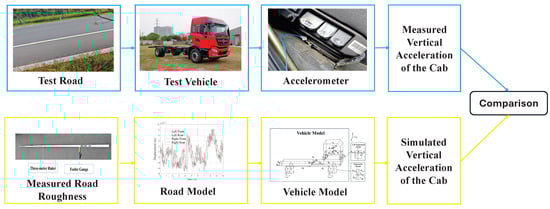
Figure 8.
Model validation methods.
- Measure the actual road surface irregularities of the test road using a three-meter ruler.
- Input the measured road surface irregularities into the road model.
- Compare the acceleration signal obtained from the road model with the filtered measured acceleration signal.
The test vehicle was driven straight for 30 s at speeds of 20 km/h, 40 km/h, and 60 km/h on Sanxia Road in Shiyan City, Hubei Province. The data measured and simulated at different speeds are shown in Figure 9, Figure 10 and Figure 11:
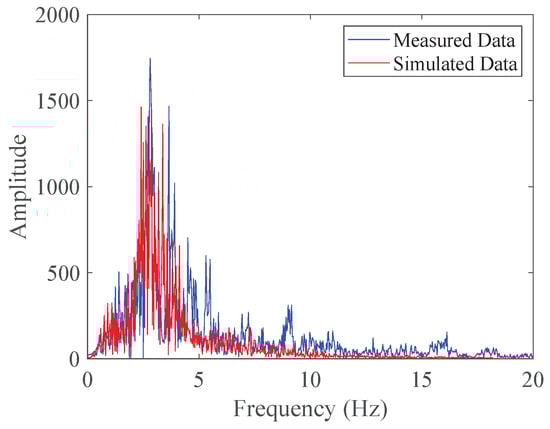
Figure 9.
Simulation Data Comparison with Actual Measurement Data at a Speed of 20 km/h on Grade A Road Surface.
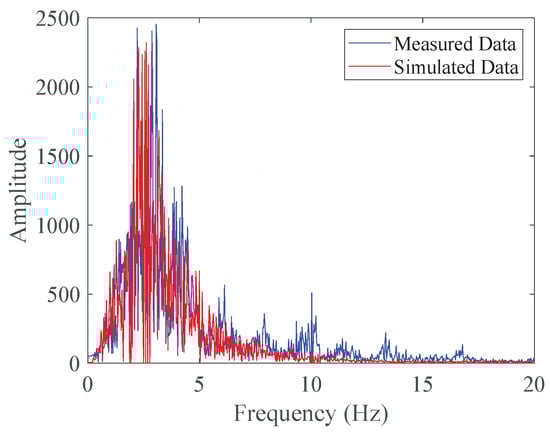
Figure 10.
Simulation Data Comparison with Actual Measurement Data at a Speed of 40 km/h on Grade A Road Surface.
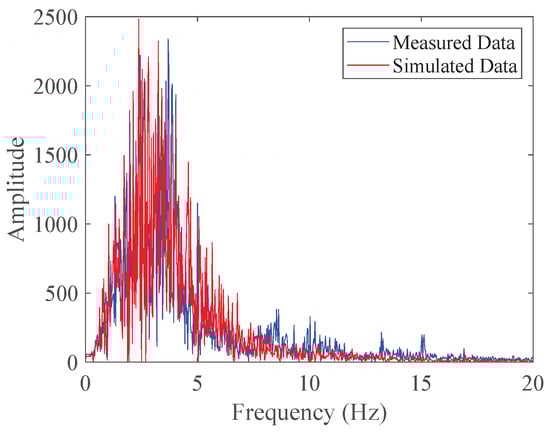
Figure 11.
Simulation Data Comparison with Actual Measurement Data at a Speed of 60 km/h on Grade A Road Surface.
To evaluate the model’s accuracy, the following formula was used to calculate the accuracy rate:
where represents the model accuracy, denotes the measured RMS value of the acceleration signal, and signifies the simulated RMS value of the acceleration signal. Table 5 illustrates the measured and simulated results at various speeds, along with their respective accuracies.
Table 5.
Comparison of Simulation Data with Actual Measurement Data.
As demonstrated in Table 5, the proposed model exhibits high accuracy across different speeds, ranging from 84.66% to 96.99%. This confirms the robust accuracy of the proposed model.
3. Semi-Active Cab Suspension Control Strategies
In this section, we delve into the control strategies and constraints faced by the semi-active cab suspension system of commercial vehicles. To enhance ride comfort, we have designed and compared three control strategies: Proportional-Integral-Derivative (PID) control, Fuzzy PID control, and Model Predictive Control (MPC). These control strategies are constructed to optimize the vibration performance of the cab, addressing dynamic responses under varying road conditions.
3.1. Constraints of Semi-Active Cab Suspension Systems
When designing the controller for an active suspension system, multiple performance-limiting factors must be comprehensively considered to ensure stable operation under various conditions and to achieve the desired outcomes.
- Mechanical Constraints on Suspension Movement: The suspension’s mechanical structure imposes limits on its movement. To avoid vehicle damage and ensure safety, the system must be designed to prevent the suspension from exceeding its physical limits. Specifically, the suspension deflection should be controlled within permissible limits to avoid excessive bottoming out, which can degrade ride comfort and potentially cause structural damage [40]. The limitation on suspension movement can be expressed by Equation (27):where is the maximum allowable deflection of the suspension.
- Actuator Force Limits: The active suspension system relies on actuators to adjust the suspension’s movement in real time. However, the force that these actuators can exert is limited. To avoid damage and maintain system performance, the control force exerted by the actuators must not exceed their maximum limit [41]. This constraint is specified by Equation (28):where is the maximum control force that the suspension actuators can provide, represents the additional required force, and denotes the actual force needed by the semi-active suspension system. corresponds to the passive damping force inherent to the semi-active system.
- Performance Objectives of the Active Suspension System: The primary performance objectives of the active suspension system include improving ride comfort by isolating the cab from road-induced shocks and maintaining road grip by ensuring continuous contact between the tires and the road. Achieving these objectives requires balancing conflicting demands. The static load limit of the tires is described by Equation (29):where is the static load of the tires.
3.2. PID Semi-Active Cab Suspension Control Strategy
3.2.1. PID Control Optimization Objective
The primary objective of optimizing the semi-active suspension system is to minimize the vibrational acceleration response at the cab’s center of mass. To achieve this goal, the active controller must provide appropriate forces to adjust the cab’s posture. The vibration posture of the cab can be controlled in three directions: vertical, roll, and pitch, as illustrated in Figure 12.
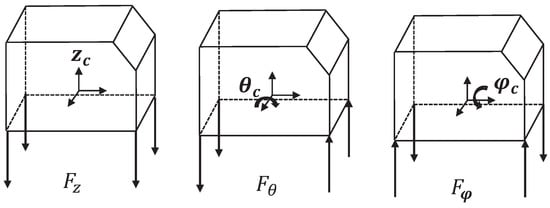
Figure 12.
Analysis of vertical, roll, and pitch vibration of the cab.
- Vertical Vibration Control: When the cab experiences vertical vibrations, the four dampers provide damping forces opposite to the direction of the vibrations. The vertical controller calculates the control force based on the acceleration of the cab.
- Roll Vibration Control: When the cab undergoes roll vibrations, the two left-side dampers and two right-side dampers provide damping forces opposite to the direction of the vibrations. The roll controller calculates the control force based on the roll angular acceleration on the cab.
- Pitch Vibration Control: When the cab experiences pitch vibrations, the two front dampers and two rear dampers provide damping forces opposite the direction of the vibrations. The pitch controller calculates the control force based on the pitch angular acceleration on the cab.
By performing logical force weighting calculations, the control forces from the three controllers are integrated to derive the optimal control force at each suspension point. The optimal control forces for the four suspension points can be expressed by Equation (30):
where are the weighting coefficients.
3.2.2. PID Control Strategy Design
The PID controller is a classic control system algorithm widely applied in semi-active cab suspension systems. The PID controller calculates the control error through three components: proportional, integral, and derivative, and adjusts the control output to achieve the desired control objective. Equation (31) is given by [42]:
where denotes the controller output, and represents the error at the current time. The system’s response characteristics are adjusted through three parameters: proportional gain , integral gain , and derivative gain .
3.3. Fuzzy PID Semi-Active Control Strategy for Cab Suspension System
Fuzzy control is a method based on fuzzy logic, suitable for handling complex and uncertain systems [43]. It formulates rules through expert experience and reasoning, simulating the fuzzy reasoning and decision-making processes of humans. In the design of the fuzzy control strategy, we select speed error e and acceleration error as input variables, with output variables being , , and .
The value ranges for the variables , , , , , and are , , , , , and , respectively. The ranges for , , and are , , and , respectively.
Input and output variables are fuzzified into seven membership levels: Positive Big (PB), Positive Medium (PM), Positive Small (PS), Zero (ZE), Negative Small (NS), Negative Medium (NM), and Negative Big (NB). These levels are represented by triangular membership functions. Next, fuzzy rules are designed, with some rules shown in Table 4. The fuzzy inference uses the Mamdani lookup table (LUT) method, and defuzzification is performed using the centroid method. The expression for the centroid method is as follows [44]:
where is the precise value after defuzzification, is the membership degree of the output fuzzy set, and is the value of the output variable. The selected fuzzy rules are shown in Table 6.
Table 6.
Fuzzy Logic Table.
The correction values of the PID parameters are calculated by Equation (33):
where , , and are the initial PID parameters; , , and are the increments after fuzzification and fuzzy inference of e and .
3.4. Model Predictive Control
Model Predictive Control (MPC) employs dynamic models to forecast the future behavior of controlled objects and accomplishes the control process through three steps [45]: predictive modeling, rolling optimization, and feedback correction. MPC is particularly advantageous in handling multi-input multi-output systems. The fundamental components of MPC consist of three main stages: prediction, optimization, and implementation.
- Prediction Phase: Based on the current system state and predetermined control laws, the system’s output over a future horizon is predicted.
- Optimization Phase: An optimal control sequence is derived by solving a finite-horizon optimization problem.
- Implementation Phase: The first control input of the optimized sequence is applied to the system, and the entire process is repeated at the next sampling instant using updated measurements.
In MPC, the state-space equations of the system are first required. By linearizing the full-vehicle cab suspension system described in Section 2, the state-space representation of the system can be expressed as follows:
where matrices A and C are the system matrices; is the input matrix; is the output matrix; and are the disturbance matrices.
where represents the system states, denotes the control inputs, which are the control forces calculated by the controller to suppress vibrations of the suspension and wheel hub motors, and represents the road disturbances.
The system output is defined as the vertical acceleration, pitch angular acceleration, and roll angular acceleration:
Since the optimization problem in MPC must be performed in the discrete-time domain, the continuous-time model is discretized using the zero-order hold method with a sampling time , yielding the discrete-time model represented as:
where , , , , , and are the matrices of the discrete state-space representation.
The essence of the optimal control in Model Predictive Control (MPC) lies in the design of the cost function. The optimization objective function is formulated as shown in Equation (40) [46]:
where denotes the reference signal, and and are symmetric positive definite weighting matrices.
4. Results
This section evaluates the effectiveness of the three control strategies described in Section 3 in terms of ride comfort for a semi-active cab suspension system. Section 3 provided detailed control design, while Section 2 offered vehicle modeling and parameter information. To assess the proposed controllers’ effectiveness, we selected vertical acceleration, pitch acceleration, and roll acceleration as comprehensive evaluation metrics. All analyses were conducted using MATLAB.
4.1. Random Road Surface
To verify the controllers’ performance, a road model was established as described in Section 2.2. Common road types and speeds were selected for evaluation: Class A road (general highway) and Class B road (rural concrete road), with speeds of 10 m/s and 5 m/s, respectively.
4.1.1. Class A Road at 10 m/s
Under actual road conditions, typical highways are generally classified as Class A roads according to the ISO 8608 standard. For simulation testing, this study selected Class A roads as the research subject and set the vehicle speed at 10 m/s. This condition represents a common scenario for truck operation, where minimizing cab vibrations is crucial for the comfort and safety of the driver. Figure 13 illustrates the performance of three different semi-active suspension control strategies under this typical operating condition, in terms of vertical acceleration (), pitch acceleration (), and roll acceleration (). The results indicate that, under this specific road condition, all three semi-active control strategies significantly outperform the traditional passive control system, effectively reducing the amplitude of acceleration responses in the vertical, pitch, and roll directions, thereby enhancing ride comfort.
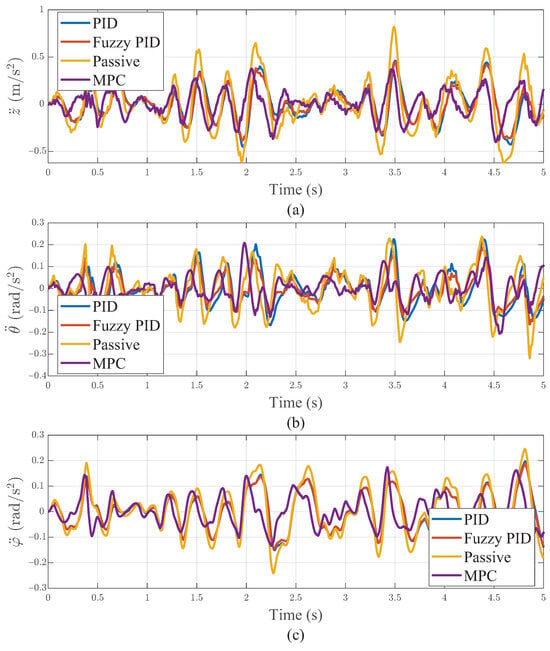
Figure 13.
Performance Comparison of Three Control Strategies on Grade A Road Surface: (a) Vertical Acceleration. (b) Pitch Angle Acceleration. (c) Roll Angle Acceleration.
4.1.2. Class B Road at 5 m/s
For lower-grade roads, such as Class B roads defined by the ISO 8608 standard, which typically represent rural concrete roads, the vehicle speed was set at 5 m/s for simulation testing in this study. This condition was used to evaluate the vehicle’s dynamic performance under more complex and less ideal road conditions. Figure 14 summarizes the test results of the three different semi-active suspension control strategies in terms of vertical acceleration (), pitch acceleration (), and roll acceleration () under Class B road conditions. The comparison reveals that, on the more challenging Class B roads with significant surface disturbances, the proposed control strategies exhibit a clear advantage over traditional passive suspension systems in controlling vibration accelerations, thereby further improving the vehicle’s ride quality.
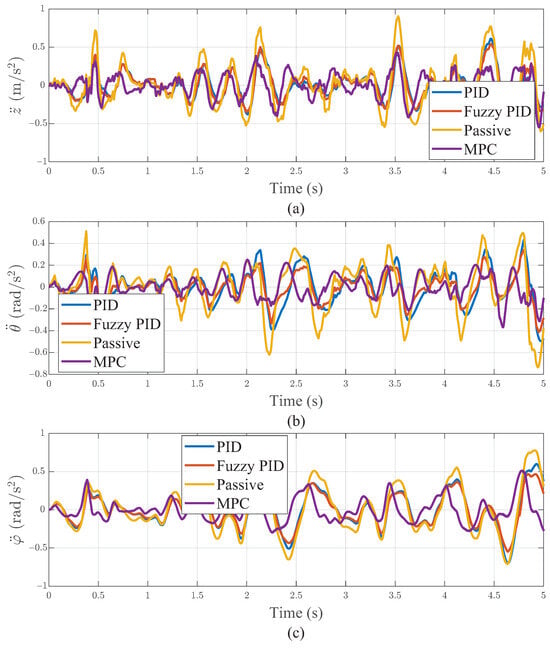
Figure 14.
Performance Comparison of Three Control Strategies on Grade B Road Surface: (a) Vertical Acceleration. (b) Pitch Angle Acceleration. (c) Roll Angle Acceleration.
4.1.3. Performance Comparison
To quantitatively compare the performance of the control strategies, the RMS values of the accelerations were calculated. Table 7 and Table 8 present the RMS values for different road types and speeds.
Table 7.
Comparison of Control Methods on Grade A Road Surface.
Table 8.
Comparison of Control Methods on Grade B Road Surface.
Based on the analysis of Table 7, we can conclude that on Class A roads, MPC control significantly outperforms other control methods in reducing , , . Specifically, compared to passive control, MPC control reduces vertical acceleration by 47%, by 19% compared to PID control, and by 13% compared to fuzzy PID control. Regarding pitch acceleration, MPC control reduces it by 39% compared to passive control, by 25% compared to PID control, and by 6% compared to fuzzy PID control. For roll acceleration, MPC control reduces it by 38% compared to passive control, by 19% compared to PID control, and by 18% compared to fuzzy PID control.
The analysis results of Table 8 indicate that on Class B roads, MPC control also performs best in reducing vehicle longitudinal acceleration, pitch acceleration, and roll acceleration. Specifically, MPC control reduces longitudinal acceleration by 45% compared to passive control, by 12% compared to PID control, and by 9% compared to fuzzy PID control. In terms of pitch acceleration, MPC control reduces it by 53% compared to passive control, by 31% compared to PID control, and by 9% compared to fuzzy PID control. Regarding roll acceleration, MPC control reduces it by 49% compared to passive control, by 34% compared to PID control, and by 25% compared to fuzzy PID control.
The analysis of Table 8 indicates that on Class B roads, MPC control also performs best in reducing vehicle longitudinal acceleration, pitch acceleration, and roll acceleration. Specifically, MPC control reduces vertical acceleration by 45% compared to passive control, by 12% compared to PID control, and by 9% compared to fuzzy PID control. In terms of pitch acceleration, MPC control reduces it by 53% compared to passive control, by 31% compared to PID control, and by 9% compared to fuzzy PID control. Regarding roll acceleration, MPC control reduces it by 49% compared to passive control, by 34% compared to PID control, and by 25% compared to fuzzy PID control.
On random roads, MPC control consistently excels in reducing vehicle acceleration, significantly outperforming passive control, PID control, and fuzzy PID control.
4.2. Bump Response
The bumpy road is described by Equation (41) [47], which represents a common operating condition and also the scenario with the greatest variation in vibrations.
where is the vertical displacement of the road profile at time t, H is the maximum amplitude of the road profile in meters, l is the length of the road profile in meters, u is the vehicle speed in meters per second, t is the time in seconds, and is the initial time when the vehicle encounters the road profile.
Figure 15 shows , , test results of each controller on the bumpy road. Table 9 lists the RMS values of , and on the bumpy road. The analysis of Table 9 indicates that on bumpy roads, MPC control also performs best in reducing vehicle vertical acceleration (), pitch acceleration (), and roll acceleration (). Specifically, compared to passive control, MPC control reduces vertical acceleration by 45%, by 12% compared to PID control, and by 9% compared to fuzzy PID control. In terms of pitch acceleration, MPC control reduces it by 53% compared to passive control, by 31% compared to PID control, and by 9% compared to fuzzy PID control. Regarding roll acceleration, MPC control reduces it by 49% compared to passive control, by 34% compared to PID control, and by 25% compared to fuzzy PID control.
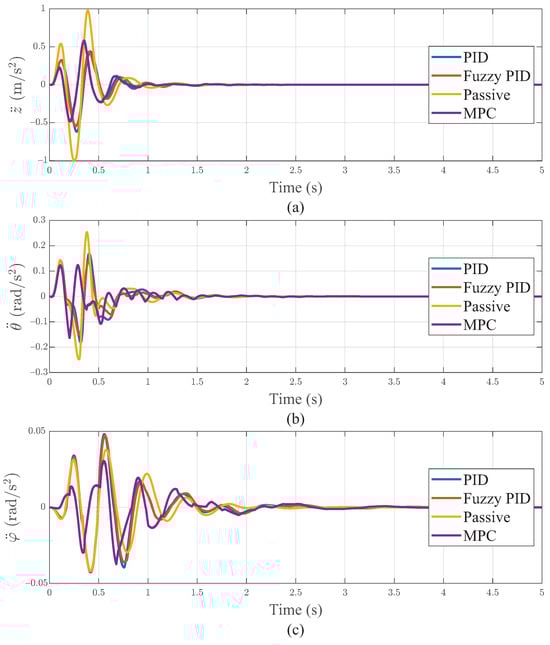
Figure 15.
Comparison of Three Control Methods on Bumpy Road: (a) Vertical Acceleration. (b) Pitch Angle Acceleration. (c) Roll Angle Acceleration.
Table 9.
Comparison of Control Methods at 15 m/s.
In the most challenging scenario, the bottoming-out test, the maximum suspension deflection among all control strategies was 0.005746 m, which is significantly below the constraint value. This demonstrates the robustness of the adopted control strategies.
It is noteworthy that in the control of roll acceleration, a phenomenon of negative optimization was observed, indicating that in some cases, PID and fuzzy PID control might perform worse than passive control. However, MPC control still exhibits significant robustness in this aspect, effectively reducing roll acceleration even in the face of negative optimization.
5. Conclusions
This study investigates the effectiveness of three control methods in enhancing ride comfort for truck semi-active cab suspension systems under random and bumpy road conditions: Proportional-Integral-Derivative control, Fuzzy PID control, and Model Predictive Control.
The main conclusions are as follows:
- A single-wheel and four-wheel road model based on the power spectral density of road roughness was established. The simulations verified the lag between the front and rear wheels and the correlation between the left and right wheels. The actual road roughness coefficient of the test road was obtained using the three-meter straightedge method, with the road surface irregularity is rounded to .;
- The accuracy of the cab suspension system model was experimentally validated by comparing the measured and simulated vertical acceleration data of the cab at different speeds. The model accuracy ranged from 84.66% to 96.99%, demonstrating high precision;
- Three control strategies for the truck’s semi-active cab suspension were designed based on the model: PID control, Fuzzy PID control, and MPC control;
- The validation results on both random and bumpy roads indicate that the proposed control strategy significantly enhances ride comfort. Among the various methods, Model Predictive Control (MPC) demonstrated superior performance and robustness, reducing vibrations by at least 31% without causing any adverse lift effects. This performance is notably better than passive control, PID control, and fuzzy PID control.
In conclusion, the proposed semi-active cab suspension control strategies significantly enhance ride comfort, with MPC showing the best performance. Future research will focus on developing more intelligent and adaptive control systems to address the uncertainties in vehicle parameters.
Author Contributions
Conceptualization, Methodology, Supervision, Writing—original draft, Software, Q.S.; Data curation, Writing—review and editing, C.Y.; Investigation, Validation, B.W. All authors have read and agreed to the published version of the manuscript.
Funding
Supported by the National Natural Science Foundation of China (52072116) and Science and Technology Program of Hubei Province (2023BEB047).
Data Availability Statement
The data are contained within this article.
Conflicts of Interest
The authors declare no conflicts of interest.
Appendix A
The relative displacement of the cab suspension () is expressed as Equation (A1):
The relative displacement of the suspension () is defined as Equation (A2):
The absolute velocity is given by Equation (A3):
The relative velocity of the cab suspension () is given by Equation (A4):
The relative velocity of the suspension () is defined as Equation (A5):
Appendix B
The damping force characteristics obtained from the bench tests were subjected to a curve-fitting analysis. The experimental data are presented in Table A1, and the fitting curves were derived using a cubic polynomial, as illustrated in Figure A1, Figure A2 and Figure A3. The accuracy of the fitting curves was quantitatively assessed using the coefficient of determination (R²), calculated as shown in Equation (A6).
where represents the values on the fitted curve, denotes the actual values, and is the mean of the values.
Table A1.
The Experimental Damping Data.
Table A1.
The Experimental Damping Data.
| Front Cab Suspension | Rear Cab Suspension | Front Suspension | |||
|---|---|---|---|---|---|
| Speed (mm/s) | Force (N) | Speed (mm/s) | Force (N) | Speed (mm/s) | Force (N) |
| −520 | −1000 | ||||
| −390 | −2100 | −390 | −1550 | −390 | −880 |
| −260 | −1650 | −260 | −1250 | −260 | −750 |
| −130 | −1080 | −130 | −720 | −130 | −580 |
| −50 | −510 | −50 | −165 | −50 | −410 |
| 0 | 0 | 0 | 0 | 0 | 0 |
| 50 | 250 | 50 | 220 | 50 | 800 |
| 130 | 1170 | 130 | 522 | 130 | 3000 |
| 260 | 2270 | 260 | 630 | 260 | 3300 |
| 390 | 3510 | 390 | 870 | 390 | 3530 |
| 520 | 3700 | ||||

Figure A1.
Fitted Curve of the Front Suspension Damper in the Cab.

Figure A2.
Fitted Curve of the Rear Suspension Damper in the Cab.
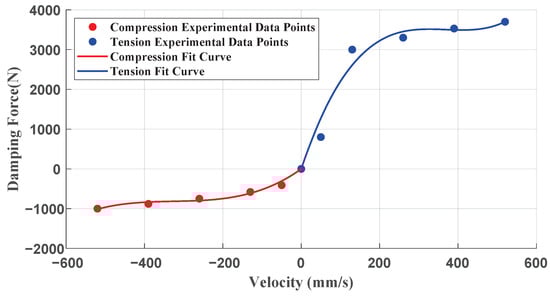
Figure A3.
Fitted Curve of the Front Suspension.
The fitting results demonstrate a high degree of accuracy. Specifically, the coefficients of determination for the compression and tension processes of the cab front suspension are 0.9999 and 0.9967, respectively, for the cab rear suspension, the coefficients are 0.9945 and 0.9950, respectively. Additionally, the coefficients of determination for the compression and tension processes of the front suspension are 0.9749 and 0.9677, respectively. These high coefficients indicate that the cubic polynomial fitting curves accurately describe the mechanical characteristics of the damper.
Furthermore, Table A2 presents the results of the data concerning tire stiffness and tire pressure. A quadratic polynomial was used for the data fitting, and the resulting curves are shown in Figure A4. As observed in Figure A4, the fitting performance for stiffness coefficients and is satisfactory, with coefficients of determination of 0.9994 and 0.9943, respectively.
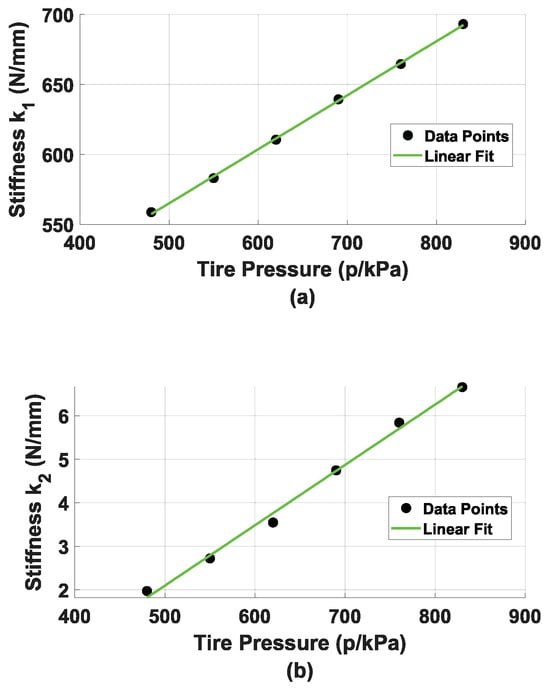
Figure A4.
The Relationship Between and Values and Changes in Tire Inflation Pressure: (a) The Relationship Between the Value and Changes in Tire Inflation Pressure. (b) The Relationship Between the Value and Changes in Tire Inflation Pressure.
Table A2.
The values of pressure p, coefficient , and coefficient .
Table A2.
The values of pressure p, coefficient , and coefficient .
| p (kPa) | k1 (N/m) | k2 (N/m2) |
|---|---|---|
| 480 | 558.77 | 1.9717 |
| 550 | 583.01 | 2.7217 |
| 620 | 610.51 | 3.5460 |
| 690 | 639.32 | 4.7447 |
| 760 | 664.57 | 5.8395 |
| 830 | 693.11 | 6.6560 |
References
- Zhang, J.; Guo, P.; Lin, J.; Wang, K. A Mathematical Model for Coupled Vibration System of Road Vehicle and Coupling Effect Analysis. Appl. Math. Model. 2016, 40, 1199–1217. [Google Scholar] [CrossRef]
- Xu, P.; Bernardo, B.; Tan, K. Optimal Mounting Design for Cab Vibration Isolation. Int. J. Veh. Des. 2011, 57, 292. [Google Scholar] [CrossRef]
- ElMadany, M. The Performance of Passive Cab Suspension Systems in Tractor-Semitrailer Vehicles. J. King Saud Univ.-Eng. Sci. 1990, 2, 131–151. [Google Scholar] [CrossRef]
- Nguyen, V.; Zhang, J.; Le, V.; Jiao, R. Vibration Analysis and Modeling of an Off-Road Vibratory Roller Equipped with Three Different Cab’s Isolation Mounts. Shock Vib. 2018, 2018, 1–17. [Google Scholar] [CrossRef]
- Ahn, D.V.; Kim, K.; Oh, J.; Seo, J.; Lee, J.W.; Park, Y.J. Optimal Control of Semi-Active Suspension for Agricultural Tractors Using Linear Quadratic Gaussian Control. Sensors 2023, 23, 6474. [Google Scholar] [CrossRef]
- Van Quynh, L.; Van Cuong, B.; Long, L.X.; Van Quan, D. Effects of Suspension Design Parameters of a Semi-trailer Truck on Vehicle Ride Comfort and Road Surface Friendliness. In Advances in Engineering Research and Application; Sattler, K.U., Nguyen, D.C., Vu, N.P., Tien Long, B., Puta, H., Eds.; Springer: Cham, Switzerland, 2020; Volume 104, pp. 281–289. [Google Scholar] [CrossRef]
- Ye, T.; Nguyen, V.; Li, S. Enhancing the Vibratory Roller’s Ride Comfort with Semi-Active Seat Suspension Embedded by Quasi-Zero Stiffness Structure. Int. J. Dyn. Control 2023, 11, 2069–2081. [Google Scholar] [CrossRef]
- Bashir, A.O.; Rui, X.; Zhang, J. Ride Comfort Improvement of a Semi-active Vehicle Suspension Based on Hybrid Fuzzy and Fuzzy-PID Controller. Stud. Inform. Control 2019, 28, 421–430. [Google Scholar] [CrossRef]
- Gui, L.M.; Shi, W.K.; Liu, W. A Semi-Active Suspension Design for off-Road Vehicle Base on Magneto-rheological Technology. In Proceedings of the 2012 9th International Conference on Fuzzy Systems and Knowledge Discovery, Chongqing, China, 29–31 May 2012; pp. 2565–2568. [Google Scholar] [CrossRef]
- Viadero-Monasterio, F.; Boada, B.L.; Zhang, H.; Boada, M.J.L. Integral-Based Event Triggering Actuator Fault-Tolerant Control for an Active Suspension System Under a Networked Communication Scheme. IEEE Trans. Veh. Technol. 2023, 72, 13848–13860. [Google Scholar] [CrossRef]
- Viadero-Monasterio, F.; Boada, B.L.; Boada, M.J.L.; Díaz, V. H∞ Dynamic Output Feedback Control for a Networked Control Active Suspension System under Actuator Faults. Mech. Syst. Sig. Process. 2022, 162, 108050. [Google Scholar] [CrossRef]
- Meléndez-Useros, M.; Jiménez-Salas, M.; Viadero-Monasterio, F.; López-Boada, M.J. Novel Methodology for Integrated Actuator and Sensors Fault Detection and Estimation in an Active Suspension System. IEEE Trans. Reliab. 2024, 1–14. [Google Scholar] [CrossRef]
- Tian, M.; Nguyen, V. Control Performance of Suspension System of Cars with PID Control Based on 3D Dynamic Model. J. Mech. Eng. Autom. Control Syst. 2020, 1, 1–10. [Google Scholar] [CrossRef]
- Ni, S.; Nguyen, V. Performance of Semi-Active Cab Suspension System with Different Control Methods. J. Mechatron. Artif. Intell. Eng. 2023, 4, 8–17. [Google Scholar] [CrossRef]
- Maciejewski, I.; Blazejewski, A.; Pecolt, S.; Krzyzynski, T. A Sliding Mode Control Strategy for Active Horizontal Seat Suspension under Realistic Input Vibration. J. Vib. Control 2023, 29, 2539–2551. [Google Scholar] [CrossRef]
- Zhao, Z.; Wang, C.; Zhao, J.; Du, W. LQR Force Command Planning–Based Sliding Mode Control for Active Suspension System. Proc. Inst. Mech. Eng. I J. Syst. Control Eng. 2024, 238, 373–385. [Google Scholar] [CrossRef]
- Lu, Y.; Khajepour, A.; Soltani, A.; Li, R.; Zhen, R.; Liu, Y.; Wang, M. Gain-Adaptive Skyhook-LQR: A Coordinated Controller for Improving Truck Cabin Dynamics. Control Eng. Pract. 2023, 130, 105365. [Google Scholar] [CrossRef]
- Gheibollahi, H.; Tehrani, M.M.; Najafi, A. Improving Ride Comfort Approach by Fuzzy and Genetic-Based PID Controller in Active Seat Suspension. Int. J. Autom. Control 2024, 18, 184–213. [Google Scholar] [CrossRef]
- Zhang, B.; Liu, M.; Wang, K.; Tan, B.; Deng, Y.; Qin, A.; Liu, J. Takagi–Sugeno Fuzzy Model-Based Control for Semi-Active Cab Suspension Equipped with an Electromagnetic Damper and an Air Spring. Machines 2023, 11, 226. [Google Scholar] [CrossRef]
- Hamza, A.; Ben Yahia, N. Heavy Trucks with Intelligent Control of Active Suspension Based on Artificial Neural Networks. Proc. Inst. Mech. Eng. I J. Syst. Control Eng. 2021, 235, 952–969. [Google Scholar] [CrossRef]
- He, Q.; Li, H.; Zhang, R.; Jia, T. Study on the LQR Control of High-speed Elevator Car Horizontal Vibration Based on the Jumping Inertia Weight Particle Swarm Optimization. Int. J. Acoust. Vib. 2022, 27, 122–137. [Google Scholar] [CrossRef]
- Xia, R.x.; Li, J.h.; He, J.; Shi, D.f.; Zhang, Y. Linear-Quadratic-Gaussian Controller for Truck Active Suspension Based on Cargo Integrity. Adv. Mech. Eng. 2015, 7, 168781401562032. [Google Scholar] [CrossRef]
- Gandhi, P.; Adarsh, S.; Ramachandran, K. Performance Analysis of Half Car Suspension Model with 4 DOF Using PID, LQR, FUZZY and ANFIS Controllers. Procedia Comput. Sci. 2017, 115, 2–13. [Google Scholar] [CrossRef]
- Yan, G.H.; Zhang, S. Research on Modeling and Optimization Control of Heavy Truck Cab Active Suspension System. Appl. Mech. Mater. 2014, 687–691, 359–362. [Google Scholar] [CrossRef]
- Lu, Y.; Khajepour, A.; Soltani, A. A Coordinated Control System for Truck Cabin Suspension Based on Model Predictive Control. Int. J. Heavy Veh. Syst. 2022, 29, 518. [Google Scholar] [CrossRef]
- Yang, T. Active Suspension Control Strategy for Vehicles Based on Road Surface Recognition. Nonlinear Dyn. 2024, 112, 11043–11065. [Google Scholar] [CrossRef]
- Ning, D.; Sun, S.; Zhang, F.; Du, H.; Li, W.; Zhang, B. Disturbance Observer Based Takagi-Sugeno Fuzzy Control for an Active Seat Suspension. Mech. Syst. Sig. Process. 2017, 93, 515–530. [Google Scholar] [CrossRef]
- Nguyen, V.; Jiao, R.; Le, V.; Hoang, A. Performance of PID-Fuzzy Control for Cab Isolation Mounts of Soil Compactors. Math. Models Eng. 2019, 5, 137–145. [Google Scholar] [CrossRef]
- Liem, N.V.; Jianrun, Z.; Quynh, L.V.; Renqiang, J. Study of Fuzzy Control for Cab’s Isolation System of Heavy Truck. Vibroeng. Procedia 2016, 10, 309–314. [Google Scholar]
- Nguyen, V.L.; Le, V.Q. Ride Comfort Performance of Heavy Truck with Three Control Cases of Semi-Active Isolation Systems. Vibroeng. Procedia 2019, 22, 93–98. [Google Scholar] [CrossRef]
- Akçay, H.; Türkay, S. Stochastic Optimal Control of Truck Cabin with Active Suspension. Int. J. Heavy Veh. Syst. 2014, 21, 183–207. [Google Scholar] [CrossRef]
- Basaran, S.; Basaran, M. Vibration Control of Truck Cabins With the Adaptive Vectorial Backstepping Design of Electromagnetic Active Suspension System. IEEE Access 2020, 8, 173056–173067. [Google Scholar] [CrossRef]
- Yan, S.; Sun, W.; Gao, H. Vibration Suppression for Motor-Driven Uncertain Active Suspensions with Hard Constraints and Analysis of Energy Consumption. IEEE Trans. Syst. Man, Cybern. Syst. 2022, 52, 618–630. [Google Scholar] [CrossRef]
- Yu, M.; Evangelou, S.A.; Dini, D. Advances in Active Suspension Systems for Road Vehicles. Engineering 2024, 33, 160–177. [Google Scholar] [CrossRef]
- Wang, C.; Cui, X.; Zhao, S.; Zhou, X.; Song, Y.; Wang, Y.; Guo, K. A Deep Reinforcement Learning-Based Active Suspension Control Algorithm Considering Deterministic Experience Tracing for Autonomous Vehicle. Appl. Soft Comput. 2024, 153, 111259. [Google Scholar] [CrossRef]
- Qin, A.; Zhang, B.; Ning, D.; Tan, B.; Du, H. A Self-Sensing Approach for Estimating Suspension Displacement and Velocity in Semi-Active Electromagnetic Dampers. Mech. Syst. Sig. Process. 2024, 208, 111049. [Google Scholar] [CrossRef]
- Bogsjö, K. Coherence of Road Roughness in Left and Right Wheel-Path. Veh. Syst. Dyn. 2008, 46, 599–609. [Google Scholar] [CrossRef]
- ISO 8608:2016; Mechanical Vibration—Road Surface Profiles—Reporting of Measured Data. International Organization for Standardization: Geneva, Switzerland, 2016.
- Li, P.; Hu, G.; Xia, H.; Guo, R. Efficient Method Based on Recurrent Neural Networks for Pavement Evenness Detection. Measurement 2023, 212, 112676. [Google Scholar] [CrossRef]
- Zhao, R.; Xie, H.; Gong, X.; Sun, X.; Cao, C. Neural Network-Based Adaptive Height Tracking Control of Active Air Suspension System with Magnetorheological Fluid Damper Subject to Uncertain Mass and Input Delay. Sensors 2023, 24, 156. [Google Scholar] [CrossRef]
- Krauze, P. Identification of Control-Related Signal Path for Semi-Active Vehicle Suspension with Magnetorheological Dampers. Sensors 2023, 23, 5770. [Google Scholar] [CrossRef]
- Ardeshiri, R.R.; Gheisarnejad, M.; Tavan, M.R.; Vafamand, N.; Khooban, M.H. A Robust Intelligent Controller-Based Motion Control of a Wheeled Mobile Robot. Trans. Inst. Meas. Control 2022, 44, 2911–2918. [Google Scholar] [CrossRef]
- Dai, D.; Zhang, J.; Zhang, B.; Li, P.; Hu, W. Adaptive Hierarchical Optimization Control for Electrohydraulic Suspension with Resistor-Capacitor Operator. Appl. Math. Model. 2024, 126, 606–624. [Google Scholar] [CrossRef]
- Shirmohammadi, H.; Hadadi, F. Optimizing Total Delay and Average Queue Length Based on the Fuzzy Logic Controller in Urban Intersections. Int. J. Supply Oper. Manag. 2019, 6, 142–158. [Google Scholar]
- Zhang, N.; Yang, S.; Wu, G.; Ding, H.; Zhang, Z.; Guo, K. Fast Distributed Model Predictive Control Method for Active Suspension Systems. Sensors 2023, 23, 3357. [Google Scholar] [CrossRef] [PubMed]
- Nuhel, A.K.; Al Amin, M.; Paul, D.; Bhatia, D.; Paul, R.; Sazid, M.M. Model Predictive Control (MPC) and Proportional Integral Derivative Control (PID) for Autonomous Lane Keeping Maneuvers: A Comparative Study of Their Efficacy and Stability. In Proceedings of the Cognitive Computing and Cyber Physical Systems, Proceedings of the 4th EAI International Conference, IC4S 2023, Bhimavaram, India, 4–6 August 2023; Pareek, P., Gupta, N., Reis, M.J.C.S., Eds.; Springer: Cham, Switzerland, 2024; Volume 537, pp. 107–121. [Google Scholar] [CrossRef]
- Wong, P.K.; Li, W.; Ma, X.; Yang, Z.; Wang, X.; Zhao, J. Adaptive Event-Triggered Dynamic Output Feedback Control for Nonlinear Active Suspension Systems Based on Interval Type-2 Fuzzy Method. Mech. Syst. Sig. Process. 2024, 212, 111280. [Google Scholar] [CrossRef]
Disclaimer/Publisher’s Note: The statements, opinions and data contained in all publications are solely those of the individual author(s) and contributor(s) and not of MDPI and/or the editor(s). MDPI and/or the editor(s) disclaim responsibility for any injury to people or property resulting from any ideas, methods, instructions or products referred to in the content. |
© 2024 by the authors. Licensee MDPI, Basel, Switzerland. This article is an open access article distributed under the terms and conditions of the Creative Commons Attribution (CC BY) license (https://creativecommons.org/licenses/by/4.0/).