Abstract
As waterflooding multi-layer reservoirs reach the high-water-cut stage, inter-layer conflicts become increasingly serious, leading to a worsening development effect over time. Production layer regrouping is an effective approach for resolving inter-layer conflicts and improving waterflooding efficiency. At the current stage, there are limitations to most of the methods of production layer regrouping. This article proposes a smart method for optimizing the layer regroup plan based on a genetic algorithm. Comprehensively considering various factors that affect the regroup of layers, such as layer thickness, porosity, permeability, remaining oil saturation, remaining reserves, recovery ratio, water cut, etc., based on the combination principle of “smaller intra-group variance and larger inter-group variance of each influencing factor are expected”, a genetic algorithm is used to calculate the fitness value of the initial combination schemes, and the advantageous schemes with higher fitness values are selected as the basis of the next generation. Then, crossover and mutation operations are performed on those advantageous schemes to generate new schemes. Through continuous selection and evolution, until the global optimal solution with the highest fitness value is found, the optimal combination scheme is determined. Comparative analysis with numerical simulation results demonstrates the reliability of this intelligent method, with an increased oil recovery of 4.34% for the sample reservoir. Unlike selecting a preferable plan from a limited number of predefined combination schemes, this method is an automatic optimization to solve the optimal solution of the problem. It improves both efficiency and accuracy as compared to conventional reservoir engineering methods, numerical simulation methods, and most mathematical methods, thus providing effective guidance for EOR strategies of waterflooding reservoirs in the high-water-cut stage.
1. Introduction
As waterflooding multi-layer reservoirs reach the high-water-cut stage, due to the strong heterogeneity between layers, inter-layer conflicts become increasingly serious, resulting in imbalanced injection and production, uneven recovery ratio, and significant differences in remaining oil distribution among layers, seriously affecting the effectiveness of water injection development [1,2,3]. Production layer regrouping is an effective approach for resolving inter-layer conflicts and improving waterflooding efficiency [4,5,6,7].
Scholars have conducted extensive research on the work of production layer regrouping. Currently, most methods used for production layer regrouping are conventional reservoir engineering methods, numerical simulation methods, and some mathematical methods.
On the basis of accurately understanding the geological and development characteristics of oil reservoirs, scholars such as Jin Y. and Yao B. have used conventional reservoir engineering methods to reasonably group the production layers for their reservoirs [8,9,10,11,12,13]. Conventional reservoir engineering methods are relatively fast, but the determined layer combination scheme is limited; it is difficult to compare multiple schemes.
Scholars such as Wang S. and Li L. used numerical simulation methods to comprehensively consider various factors that affect the grouping of layers, proposed a relatively quantitative classification standard for production layers, and optimized the layer combination of the oilfields [14,15,16]. Although the numerical simulation method can compare and select multiple layer combinations, the early model preparation requires a long time and is not efficient.
Many scholars used mathematical methods such as grey correlation, the clustering method, and enumeration to comprehensively consider various factors reflecting the contradictions of reservoir layers, and developed relevant programs for layer combination, achieving rapid layer regrouping and optimization [16,17,18,19,20,21,22]. Li Q. used the mono-objective grey situation decision-making method [17], introduced the concept of effect factors to consider various factors that reflect the conflicts of reservoir layer series to create a measurement matrix for comprehensive effects, and then selected the preferable layer regroup plan from the given schemes. This method produces reliable results and improves the working efficiency. Shen A. introduced a method using grey correlation and cluster analysis [18]. The grey correlation was used to identify the main influencing factors of layer regrouping, then the clustering method was used to group production layers with the most similar properties into the same layer series.
Mathematical methods can effectively improve the efficiency of layer regrouping work, but currently, most mathematical methods can only analyze a subset of parameters influencing layer regrouping, or they are limited to selecting the best scheme from a predefined set rather than seeking the optimal solution to the problem.
As mentioned above, at the current stage, there are limitations to most of the methods for production layer regrouping. Conventional reservoir engineering methods face challenges in comparing the results of multiple schemes. Reservoir numerical simulation methods require a lengthy model preparation period, resulting in lower efficiency. Most mathematical methods can only analyze a subset of parameters influencing layers regrouping, or they are limited to selecting the best option from a predefined set rather than seeking the optimal solution to the problem. A relatively smart method is needed that is not limited to a few predefined schemes but that can automatically optimize and generate more solutions to gain the optimal layer regrouping scheme.
The genetic algorithm is a method to search for optimal solutions by simulating the process of natural evolution. This algorithm, through mathematical calculation and computer simulation, converts the problem-solving process into a process similar to the selection, crossover, and mutation of chromosome genes in biological evolution [23]. The genetic algorithm uses a probabilistic mechanism for iteration, which makes the method random, and uses an evaluation function for the heuristic search, which makes the process simple. The mutation mechanism prevents the algorithm from becoming trapped in local optima, leading to strong search capabilities. With potential parallelism, it can simultaneously compare multiple individuals and quickly and accurately determine the optimal layer series subdivision scheme. When dealing with a complex combination of optimization problems, the genetic algorithm, compared to some conventional optimization algorithms, usually achieves better results more quickly [24]. The genetic algorithm has been widely applied in fields such as combination optimization, machine learning, signal processing, adaptive control, engineering optimization, and artificial life and is an important intelligent algorithm [25].
This article introduces a smart method for production layer regrouping based on the genetic algorithm. Comprehensively considering various factors that affect the regroup of layers, based on the combination principle of “smaller intra-group variance and larger inter-group variance of each influencing factor are expected “, the genetic algorithm is used to calculate the intra-group variance and inter-group variance of each influencing factor for each initial grouping scheme and to then calculate the fitness values of those schemes. Based on the fitness value, the advantageous schemes with higher fitness values are selected as the basis of the next generation. Then, crossover and mutation operations are performed on those advantageous schemes to generate new schemes. Through continuous selection and evolution, until the global optimal solution with the highest fitness value is found, the optimal combination scheme is determined. Unlike selecting a preferable plan from a limited number of predefined combination schemes, this method is an automatic optimization to solve the optimal solution of the problem. It improves both efficiency and accuracy as compared to conventional reservoir engineering methods, numerical simulation methods, and most of the mathematical methods.
It should be noted that the genetic algorithm method is not a new optimization method; it has not been used in the area of layer regrouping of oilfield development. As it is a very useful optimization method, we introduced the genetic algorithm as a smart optimization method for production layer regrouping. According to the theory of the genetic algorithm, we defined the calculation formula for the fitness value of the layer combination scheme based on the idea of reservoir engineering, then we take continuous selection, crossover, and mutation operations to those schemes to obtain the optimal combination scheme. These formulas and ideas are our innovation, but not an innovation of genetic algorithm theory; more precisely, they are an innovation of applying the genetic algorithm to reservoir engineering.
2. Methodology
2.1. Genetic Algorithm
The genetic algorithm entails a method of finding the optimal solution by simulating natural evolution processes. The genetic algorithm maps the phenotypes of all individuals in the population to numerical values, i.e., encoding, and utilizes randomization techniques to efficiently search for an encoded parameter space. After initializing the population, better approximate solutions are obtained according to the principles of survival of the fittest. The genetic operations of genetic algorithms are selection, crossover, and mutation [23,24]. The selection operation ensures the advantageous individuals of the previous generation population are inherited, while the crossover and mutation operations are aimed at obtaining more diverse populations, so as to quickly find the optimal solution.
2.2. Optimization of the Layer Regrouping Scheme with Genetic Algorithm
This paper applies the genetic algorithm to the optimization of production layer regrouping in oilfield development. The specific idea is as follows: comprehensively consider various factors that affect layers regrouping, such as the layer thickness, porosity, permeability, remaining oil saturation, recovery ratio, remaining reserves, comprehensive water cut, well section length, number of oil layers, etc., which form an N × r matrix (N is the total number of sub-layers and r is the number of influencing factors). First, randomly generate or artificially provide several sets of combination schemes as the initial population, with each combination scheme serving as an individual of the population. Then, calculate the comprehensive variance of each influencing factor for each individual (each combination scheme) as the fitness value of that combination scheme (see Section 2.2.4 for details), Based on the fitness value, the advantageous schemes with higher fitness values are selected as the basis of the next generation. Then, crossover and mutation operations are performed on those advantageous schemes to generate new schemes. Through continuous selection and evolution, until the global optimal solution with the highest fitness value is found, the optimal combination scheme is determined. The flowchart is shown in Figure 1, as follows:
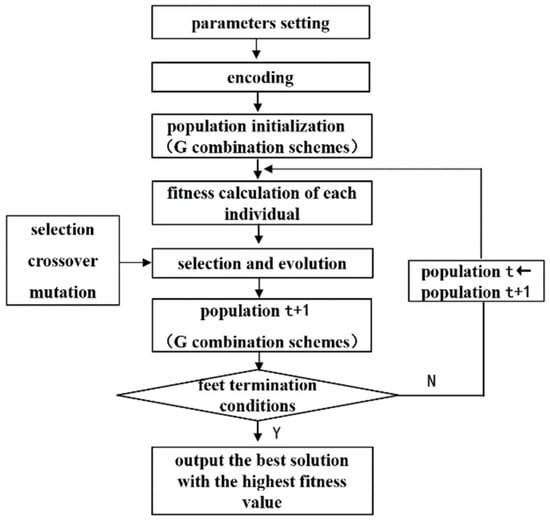
Figure 1.
Flowchart of the genetic algorithm.
2.2.1. Parameter Setting and Tuning
As mentioned above, this method considers various factors that affect the layer regrouping, such as layer thickness, porosity, permeability, remaining oil saturation, recovery ratio, remaining reserves, comprehensive water cut, well section length, number of oil layers, etc. These parameters form an N × r matrix (N is the total number of sub-layers and r is the number of influencing factors); Figure 2 shows the schematic diagram of the parameter matrix.
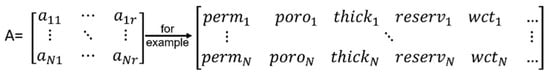
Figure 2.
Schematic diagram of the parameter matrix.
Other parameters include the (1) population size G, which is the number of combination schemes within the population; (2) total number of layers series S; (3) total number of small layers N; (4) crossover probability Pc; (5) mutation probability Pm; and (6) maximum generations T, which is the maximum number of iterations.
Parameter tuning: The larger the value of G, the larger the population size, and the more solutions obtained during the calculation process; however, the computational complexity will also increase, leading to a slower calculation speed. On the premise of ensuring calculation speed, a larger G value can be set. The total number of layer groups S is determined based on the actual needs of the oilfield. N is the actual total number of layers. The crossover probability (Pc) directly affects the searching efficiency of the optimal solution. The mutation operations help increase population diversity. For optimization issues, low crossover probability and high mutation probability are usually required to maintain population diversity. Through actual testing, here, we set crossover probability Pc = 0.8 and mutation probability Pm = 0.005, which can better ensure the searching efficiency and convergence speed of the algorithm. Increasing the total iteration number T can improve the solution quality, but too many iterations will increase the computation time.
For the above parameters, for different oil fields, simply change the values of S and N in the program, and input the N × r matrix composed of the factors that affect the layer group division. If necessary, adjustments can be made to G, Pc, Pm, and T.
2.2.2. Encoding
The encoding method of this method is very simple. Each single layer group is represented by a one-dimensional array, and the length of the array is the total number of all layers. If the layer group contains a certain layer, the corresponding position in the array is represented by 1; otherwise, it is represented by 0. Figure 3 shows a combination scheme with 10 sub-layers being divided into 3 groups: “1” indicates that the layer is included in the group, while “0” indicates that the layer is not included in that group.
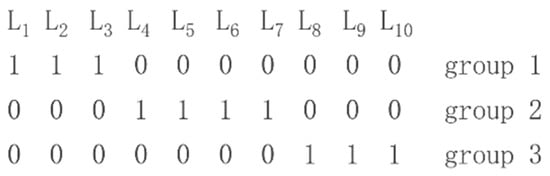
Figure 3.
Schematic diagram of the production layers group and coding mode.
2.2.3. Population Initialization
Define the initial population P(0), which consists of G combination schemes. The initial schemes can be randomly generated or set manually (setting a reasonably sound initial population could accelerate the solution process). Figure 4 shows the schematic diagram of the population definition.
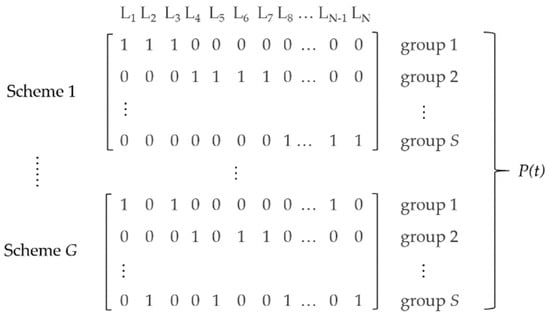
Figure 4.
Schematic diagram of the population definition.
2.2.4. Calculation of the Fitness Value for Each Regrouping Scheme
The fitness in the genetic algorithm is an indicator of the superiority of an individual (that is, each combination scheme). According to the principle of layer grouping in oilfield development, layers with small differences in reservoir property parameters are suitable for combining in one group. Therefore, first, calculate the intra-group variance and inter-group variance of each influencing factor in each combination scheme. Smaller intra-group variance and larger inter-group variance of the influencing factors are expected as a reasonable combination scheme. Based on this idea, these two variances are then combined into a comprehensive variance (as described in Section (3)), defined as the fitness value of each layer combination scheme.
Calculate the fitness value of each combination scheme in population P(t) (t = 0, 1, 2, …, T) according to the following steps.
(1) Calculation of the intra-group variance of the influencing factor.
Assuming there are r influencing factors, the intra-group variance of the influencing factors of each layer group is calculated and then the average of for all layer groups is determined through the following formulas:
i, the i-th layer group (i = 1, 2, …, S);
j, the j-th layer in the i-th layer group (j = 1, 2, …, N);
q, the q-th influencing factor (q = 1, 2, …, r);
, the standard variance of the q-th influencing factor between each layer in the i-th layer group;
, the value of the q-th influencing factor in the j-th layer of the i-th layer group;
, the average value of the q-th influencing factor in the i-th layer group;
n, the number of layers in each layer group, could be different between groups;
, the average value of ;
S, total number of layer groups.
(2) Calculation of the inter-group variance of the influencing factors.
The inter-group variance of the influencing factors is calculated through the following formulas. When calculating the variance of each influencing factor between layer group, set the average value of of each influencing factor across all layers within the layer group as the value of that influencing factor in that layer group.
- , the standard variance of the q-th influencing factor between layer groups (q = 1, 2, …, r).
- , the average value of of all layer groups.
(3) Normalization of intra-group variance and inter-group variance and fitness value calculation for each regrouping scheme.
The two variances above are then normalized and combined into a comprehensive variance as the fitness value for each regrouping plan.
and obtained above are normalized as follows:
- , normalized value of ;
- , the minimum value of ;
- , the maximum value of ;
- , normalized value of ;
- , the minimum value of ;
- , the maximum value of ;
- and are then combined into as the fitness value of the layer regroup scheme.
- , weight coefficients for intra-group variance and inter-group variance, . Should be assigned based on the experience of reservoir engineers.
- , weight coefficient for the q-th influencing factor, . Should be assigned based on the experience of reservoir engineers.
- , comprehensive variance, which is the fitness value for the combination scheme.
Notably, smaller intra-group variance and larger inter-group variance are expected based on the layer regrouping principle, so a smaller , a larger , a larger , and, consequently, a larger are expected for an ideal plan.
2.2.5. Genetic Calculation
(1) Selection.
Select schemes within the population based on the scheme fitness value. The superior schemes are chosen as the basis for the next calculation.
The roulette wheel selection method is used to define the probability of a scheme being selected [23], as follows:
, the fitness value of the k-th scheme.
Schemes with higher fitness values have a higher probability of being selected. In this case, still select G schemes (the same scheme can be repeatedly selected) to maintain the population size.
(2) Crossover.
By utilizing the single-point crossover operator, perform random crossovers on the selected schemes obtained through the selection process mentioned above. Randomly select two groups within a scheme, choose a random crossover point, and then perform crossover at that position with the specified crossover probability .
(3) Mutation.
Perform random mutations for each scheme obtained above after crossover calculation. Randomly select one group within a scheme, choose a random mutation position (i.e., position of the layer), and generate a random number between [0,1] as a comparison probability. If this probability is less than the mutation probability , then the selected mutation position changes from 1 to 0 or from 0 to 1. However, it is important to note that the mutation method here is different from the conventional mutation method in the genetic algorithm. It is not a simple change from 1 to 0 or from 0 to 1. In this case, if a layer changes from 1 to 0, then in another group, the same layer must change from 0 to 1, and vice versa. This ensures that different groups do not contain the same layer.
The selection operation mentioned above allows the inheritance of superior schemes, while crossover and mutation operations aim to generate more diversified schemes.
2.2.6. Termination Criteria
The next population P(t + 1) is obtained after the selection, crossover, and mutation of population P(t).
If t ≤ T, then t ← t + 1 and proceed to step Section 2.2.4. Otherwise, the individual scheme with the highest fitness value obtained during the evolution process will be used as the best solution output and the operation will be terminated.
3. Case Application
A computational program was developed based on the above method and was used for the production layer regrouping optimization for the following two reservoirs to verify the reliability of this method.
3.1. Overview of the Reservoir
Case 1:
Block X is a waterflooding sandstone reservoir in China (as shown in Figure 5) with 42 individual sand layers vertically and a production history of approximately 35 years. Currently, the cumulative recovery ratio is 30.39% and the overall water cut is 90.74%, indicating that it has entered a high-water-cut stage. The heterogeneity between layers has resulted in significant variations in the development effect of each layer. For instance, the highest recovery of a single layer is 41.25%, while the lowest is only 1.74%. Some layers have no water production, while most have already entered the high-water-cut stage. The geological and development parameters of each layer are illustrated in Figure 6.
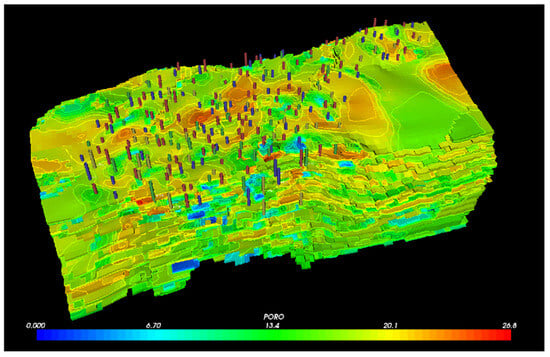
Figure 5.
Overview of block X.
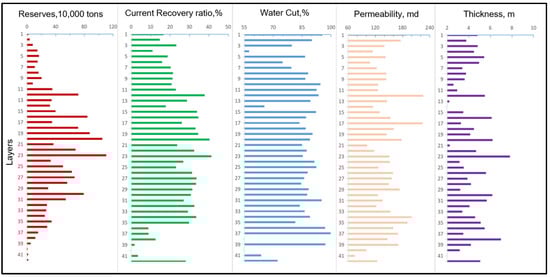
Figure 6.
Geological and development parameters of each layer in Block X.
Case 2:
Block Y is a waterflooding sandstone reservoir in China (as shown in Figure 7) with 42 individual sand layers vertically and a production history of approximately 25 years. Currently, the cumulative recovery ratio is 25.6% and the overall water cut is 93.96%, indicating that it has entered a high-water-cut stage. The heterogeneity between layers has resulted in significant variations in the development effect of each layer. For instance, the highest recovery of a single layer is 50%, while the lowest is only 0.13%. The geological and development parameters of each layer are illustrated in Figure 8.
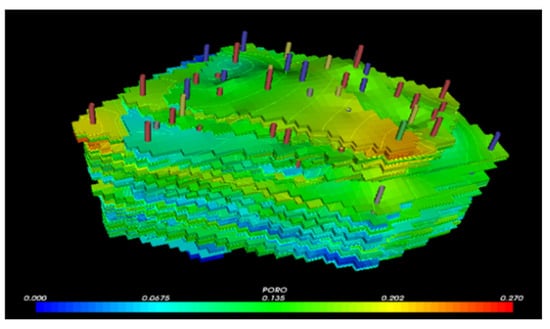
Figure 7.
Overview of block Y.
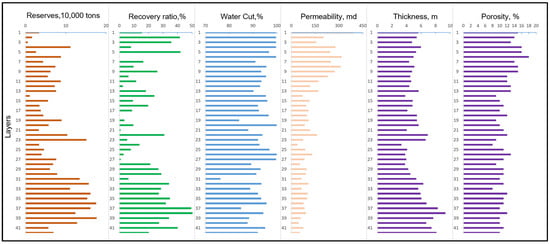
Figure 8.
Geological and development parameters of each layer in Block Y.
3.2. Optimization of the Layer Regrouping Scheme with the Genetic Algorithm
3.2.1. Parameter Setting
Case 1:
The influencing factors considered are geological reserves, remaining reserves, current recovery ratio, water cut, permeability, and effective thickness.
Case 2:
The influencing factors considered are remaining reserves, current recovery ratio, water cut, permeability, effective thickness, and porosity.
Table 1 shows the parameter setting of the two cases.

Table 1.
Parameters setting for Case 1 and Case 2.
3.2.2. Population Initialization
Case 1:
The initial population is defined as follows: 6 initial layer regrouping schemes are designed based on the parameter values of geological reserves, remaining reserves, current recovery ratio, comprehensive water cut, permeability, and effective thickness, as shown in Table 2.
Table 2.
Initial layer regrouping schemes for Case 1.
Case 2:
Randomly generate 8 schemes as the initial population.
3.3. Optimization Results
On the basis of the initial schemes, through selection, crossover, and mutation, a total of 6000 new schemes were generated for case 1 and a total of 9600 new schemes were generated for case 2. The top 10 optimal schemes for each case are shown in Table 3, with the optimized scheme 1 identified as the optimal grouping scheme (Table 4 and Table 5).
Table 3.
Top 10 optimized schemes for each case.
Table 4.
Layer grouping results corresponding to the optimal scheme for Case 1.
Table 5.
Layer grouping results corresponding to the optimal scheme for Case 2.
3.4. Reliability Analysis of the Optimization Results
To verify the reliability of the optimization method proposed in this paper, by using the numerical simulation method, the final recovery ratio of the top 10 optimization schemes for each case was calculated. The comparative results are shown in Table 6, Figure 9 and Figure 10. It can be seen that firstly, the optimization schemes achieved higher recoveries than the non-optimization ones and secondly, the trends of the final recovery rate calculated by numerical simulation and the fitness value calculated by the genetic algorithm method are generally consistent: as the fitness value increases, the final recovery rate increases. Therefore, it is demonstrated that the calculation results of the optimization algorithm in this paper are reliable.
Table 6.
Verification of the optimization results from the genetic algorithm.
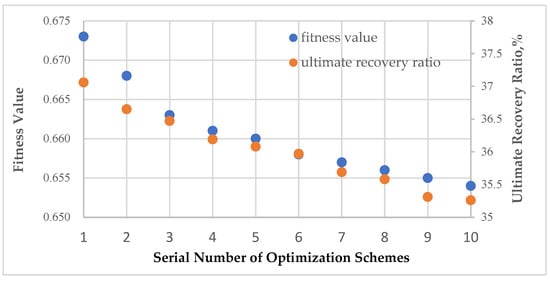
Figure 9.
Case 1—Comparison of trends between the recovery rate predicted by numerical simulation and the fitness value calculated by the genetic algorithm.

Figure 10.
Case 2—Comparison of trends between recovery rate predicted by numerical simulation and fitness value calculated by the genetic algorithm.
3.5. Reliability Analysis of the Optimization Results
Compare the efficiency and accuracy of this method with conventional reservoir engineering methods, numerical simulation methods, and grey decision optimization methods [17].
3.5.1. Efficiency Comparison
The time required for layer regrouping using different methods is shown in Table 7.
Table 7.
Efficiency comparison of different methods.
From Table 7, it can be seen that the genetic algorithm method and grey decision method [17] take a very short time and can do a comparison of multiple schemes. The conventional reservoir engineering methods are also very fast but cannot compare different schemes. Numerical simulation methods can also compare multiple schemes, but both model preparation and computation time are too long.
3.5.2. Accuracy Comparison
Table 8.
Accuracy comparison of different methods.
Table 9.
Comparison of the final recovery ratio for different schemes gained by different methods.
As shown in Table 8, conventional reservoir engineering methods can only develop very limited plans and cannot compare multiple plans. Numerical simulation is the only method that can consider the dynamics of reservoir depletion and is the most reasonable approach, but its drawback is that it can only compare and select a preferable scheme from the given combination schemes, which is also the drawback of the grey decision method [17]. The genetic algorithm in this article can optimize and obtain new and better solutions based on the given initial schemes.
Table 9 compares the final recovery ratio of the optimal layer regrouping scheme obtained by each method. It can be seen that the genetic algorithm method achieved a better scheme with a higher recovery ratio.
4. Deficiencies
This method still has the following deficiencies:
(1) It only considers technical indicators and does not take into account the impact of economic issues or operational factors;
(2) The weight coefficient λ1 and λ2, as well as the weight coefficient , still rely on expertise for assignment;
(3) The calculation speed deepens on the reasonable initial schemes to some extent. The more reasonable the initial schemes are, the faster the optimal solution could be obtained.
5. Conclusions
Taking multiple factors that affect the production layer regroup into consideration, such as geological reserves, the current recovery ratio, remaining reserves, effective thickness, permeability, porosity, and water cut, the genetic algorithm is used to calculate the fitness value of the combination scheme, and, based on the fitness value, selection, and crossover, mutation operations are performed to continuously generate new schemes; until the global optimal solution is found with the biggest fitness value, the optimal scheme is determined.
Unlike selecting a preferable plan from a limited number of predefined combination schemes, this method is an automatic optimization to find the optimal solution to the problem.
This method can take various factors into consideration that influence production layer regrouping, not limited to those mentioned in the two case studies; the data of each relevant factor in the calculation program should be updated.
Numerical simulation results verified the reliability of this genetic algorithm method.
It improves both efficiency and accuracy as compared to the conventional reservoir engineering method, numerical simulation method, and mathematical method, thus providing effective guidance for the EOR strategies of waterflooding reservoirs in the high-water-cut stage.
Author Contributions
Conceptualization, J.Z. and L.C.; Methodology, J.Z. and L.C.; Software, L.C.; Formal analysis, D.H. and L.P.; Investigation, L.C.; Data Curation, B.P.; Writing—original draft preparation, L.C.; Writing—review and editing, J.Z.; Visualization, X.P.; Supervision, J.Z. All authors have read and agreed to the published version of the manuscript.
Funding
This research was funded by the Scientific Research and Technology Development Project of PetroChina: Research on Intelligent Layered Injection Production Engineering Technology (2021ZG12), the Scientific Research and Technology Development Project of CNPC: Real-Time Prediction and Optimization Technology for Intelligent Production Measures in Oil Reservoirs (2023DJ8405), and the Scientific and Technological Project of PetroChina: Upgrade and Promotion of Intelligent Reservoir Analysis and Optimization Software-IRes (2023YQX303).
Data Availability Statement
The original data presented in the study are included in the article; further inquiries can be directed to the corresponding author.
Acknowledgments
The authors would like to express their appreciation to the Research Institute of Petroleum Exploration & Development, PetroChina, and the Artificial Intelligence Technology R&D Center for Exploration and Development, CNPC. We offer thanks to Junhua Chang, Xianing Li, Li Wu, and Liming Wang’s support from the Research Institute of Petroleum Exploration and Development, PetroChina.
Conflicts of Interest
Author Lining Cui was employed by the company Research Institute of Petroleum Exploration & Development, PetroChina. The remaining authors declare that the research was conducted in the absence of any commercial or financial relationships that could be construed as a potential conflict of interest. The company Research Institute of Petroleum Exploration & Development, PetroChina, the company Artificial Intelligence Technology R&D Center for Exploration and Development, CNPC, the Development Department of PetroChina Huabei Oilfield Company, the No.3 Oil Production Plant of PetroChina Huabei Oilfield Company, and the No.4 Oil Production Plant of PetroChina Daqing Oilfield Company had no role in the design of the study; in the collection, analyses, or interpretation of data; in the writing of the manuscript, or in the decision to publish the results.
References
- Han, D. Discussions on Concepts, Countermeasures and Technical Routes for the Redevelopment of High Water-cut Oilfields. Pet. Explor. Dev. 2010, 37, 583–591. [Google Scholar]
- Yu, H.; Wang, Y. Remaining oil distribution characteristics in an oil reservoir with ultra-high water-cut. Energy Geosci. 2022, 6, 4. [Google Scholar] [CrossRef]
- Mikael, H.; Tang, X. Development Journey and Outlook of Chinese Giant Oilfields. Pet. Explor. Dev. 2010, 37, 237–249. [Google Scholar]
- Song, X.; Qu, D. Low Cost Development Strategy for Oilfields in China. Pet. Explor. Dev. 2021, 48, 1007–1018. [Google Scholar] [CrossRef]
- Wang, W. Secondary Development Method of Lamadian Oilfield. Pet. Geol. Oilfield Dev. Daqing 2015, 34, 69–73. [Google Scholar]
- Hu, W. Necessity and Feasibility of PetroChina Mature Field Redevelopment. Pet. Explor. Dev. 2008, 35, 1–5. [Google Scholar] [CrossRef]
- Xue, L.; Liu, P. Status and Prospect of Improved Oil Recovery Technology of High Water Cut Reservoirs. Water 2023, 15, 1342. [Google Scholar] [CrossRef]
- Jin, Y. Optimization Technology of Stratigraphic Series Combination and Well Pattern in X Block During the Extra High Water Cut Period and Its Application. Pet. Geol. Oilfield Dev. Daqing 2020, 39, 86–93. [Google Scholar]
- Huang, X.; Zhang, X. Development by Layer Series Subdivision in Wendong Oil Field. Pet. Explor. Dev. 2003, 30, 84–87. [Google Scholar]
- Li, R.; Zhang, J. The Research of Layer System Subdivision and Adjustment Methods in YSL Block of the Low Permeability Reservoirs. Mech. Eng. Mater. Sci. Civ. Eng. 2013, 274, 153. [Google Scholar] [CrossRef]
- Yao, B.; Zhao, Q. A Successful Test with Subdivision of Oil Layers and Adjustment of Water Flooding in Gaotaizi Oil Zone, Daqing Oilfield. Pet. Explor. Dev. 2008, 35, 220–224. [Google Scholar] [CrossRef]
- Lin, L. Study on Optimization of Combined Parameters of Subdivision Water Injection Layer Sections in Ultra-high Water Cut Stage. In Proceedings of the 3rd International Conference on Advances in Energy and Environment Research (ICAEER 2018), Guilin, China, 10–12 August 2018; Volume 53, p. 01020. [Google Scholar] [CrossRef]
- Wang, H. Research on Improvement of Water Flooding by Subdivision of Extra-High Water Cut Period. In Proceedings of the 4th International Conference on Energy Science and Applied Technology, Chongqing, China, 29–30 December 2018; Volume 2066, p. 020033. [Google Scholar] [CrossRef]
- Wang, S.; Niu, S. Layer Subdivision in The Late High Water Cut Stage in The Complex Fault Block Reservoirs, Dongxin Oilfield. Pet. Explor. Dev. 2004, 31, 116–118+139. [Google Scholar]
- Li, L. Technical Limits of Layer Recombination and Well Pattern Reconfiguration in B2 Oil Region. In Proceedings of the International Field Exploration and Development Conference 2019; Springer Series in Geomechanics and Geoengineering; Springer: Singapore, 2020; pp. 1560–1568. [Google Scholar] [CrossRef]
- Zhang, C.; Teng, S. Optimization of CO2 flooding layer combination in multi thin and ultra-low permeability beach bar sand reservoirs. Pet. Geol. Recovery Effic. 2021, 28, 119–125. [Google Scholar]
- Li, Q.; Zhang, J. Grey Decision-making Theory in the Optimization of Strata Series Recombination Programs of High water-cut Oilfields. Pet. Explor. Dev. 2011, 38, 463–468. [Google Scholar] [CrossRef]
- Shen, A.; Gao, L. Application of Grey Correlation and Cluster Analysis Method in Optimization and Reorganization of Oil Layer Series. Math. Prac. Theor. 2019, 5, 130–137. [Google Scholar]
- Wu, Y. Optimization of Production Layers Subdivision and Prediction of Oil Displacement Effect in Multi-layer Water Drive Reservoirs. Chem. Enterp. Manag. 2021, 11, 197–198. [Google Scholar]
- Hu, Q.; Wang, X. The Mathematical Method and Application of Strata Series Recombination in the Middle-late Stages of Multi-layer Sandstone Reservoir Development. In Proceedings of the International Field Exploration and Development Conference 2022; Springer Series in Geomechanics and Geoengineering; Springer: Singapore, 2023; pp. 4063–4078. [Google Scholar] [CrossRef]
- Wu, Z.; Cui, C. Layer Regrouping Optimization for Multilayer Heterogeneous Reservoirs at a High Water Cut Stage. Arab. J. Geosci. 2019, 12, 458. [Google Scholar] [CrossRef]
- Cui, C.; Jian, P. Layer Regrouping for Water-flooded Commingled Reservoirs at a High Water-cut Stage. Pet. Sci. 2016, 13, 272–279. [Google Scholar] [CrossRef][Green Version]
- Holland, J. Adaptation in Natural and Artificial Systems; University of Michigan Press: Ann Arbor, MI, USA, 1975; pp. 211–247. [Google Scholar]
- Yan, X. Genetic Algorithm and Its Applications; China University of Geosciences Press: Beijing, China, 2018; pp. 2–51. [Google Scholar]
- Zheng, S. Industrial Intelligence Technology and Applications; Shanghai Science & Technology Publishers: Shanghai, China, 2019; pp. 250–251. [Google Scholar]
Disclaimer/Publisher’s Note: The statements, opinions and data contained in all publications are solely those of the individual author(s) and contributor(s) and not of MDPI and/or the editor(s). MDPI and/or the editor(s) disclaim responsibility for any injury to people or property resulting from any ideas, methods, instructions or products referred to in the content. |
© 2024 by the authors. Licensee MDPI, Basel, Switzerland. This article is an open access article distributed under the terms and conditions of the Creative Commons Attribution (CC BY) license (https://creativecommons.org/licenses/by/4.0/).