Abstract
The surface hydrology and diffuse pollution loading is hypothesized based on the unique characteristics under different rainfall types in watersheds with a subtropical monsoon climate. This study evaluated the effects of different rainfall event intensity on surface runoff and diffuse nitrogen loss in a subtropical watershed located in the latitude range between 22.5° north and 25° north in southern China by adapting the hydrological model SWAT (Soil and Water Assessment Tool). The rainfall events were classified into four categories including light rainfall (LR), moderate rainfall (MR), intense rainfall (IR), and extreme rainfall (ER). Our results showed that the ER events had the lowest occurrences of 7 days per year, but they contributed the most to total surface runoff (54.29%) and TN losses (57.63%) in the subtropical watershed researched. Although forests and pastures had a better effect on reducing diffuse pollution, their surface runoff and nitrogen loss were still proved to be serious under ER events. As for the nitrogen loss form, water-soluble nitrogen oxides nitrogen (ON-N) loss was the dominant form of total nitrogen (TN) loss, which accounted for 90% of the total loss in the simulated watershed in the subtropical monsoon climate region. Under LR events, however, nitrate nitrogen (NO3-N) accounted for 74.54% and 55.59% of TN losses from paddy fields and dry lands, respectively. The effects of antecedent soil water content (ASW) on surface runoff and TN loss were higher under ER events. The surface runoff and TN loss in the high-ASW condition were 1.17–3.86 times and 1.34–1.76 times higher, respectively, than in the low-ASW condition. These findings highlighted the important influence of ER events on diffuse pollution and have significant implications for controlling diffuse pollution under different rainfall types. This conclusion proved that extra attention and efforts are required in handling non-point-source pollution in subtropical monsoon watersheds than the watersheds in cooler regions because the natural systems including forest and pastures are no longer effective enough in controlling surface runoff and TN loss during ER.
1. Introduction
Watershed diffuse pollution has become an important cause of water quality deterioration and it is also the direct consequence of hydrological processes under rainfall events []. Nitrogen (N), as a primary component of the diffuse pollution, is sensitive to different climatic conditions []. The climatic condition contributes to 6.12–26.20% change in total nitrogen (TN) loss []. In particular, the climatic conditions such as extreme rainfall events and heavy annual rainfall are reported to be critical in influencing nitrogen loss through hydrological features, litter decomposition, and soil nitrogen transformation [,,]. Moreover, the runoff and TN loss are expected to be serious in watersheds with both high annual rainfall and temperature []. Their loss coefficients in temperate climate regions were usually 8 to 12 times higher than in cold climates []. Therefore, the extreme rainfall events during rainy seasons have become major concerns regarding diffuse nitrogen pollution []. What is worse, climate change, which has been accelerating during the last century, has led to higher annual rainfall and more extreme rainfall events globally, especially to the regions with subtropical monsoon climate [,]. Therefore, it is of vital importance to assess the impacts and understand the mechanisms by which changes in climatic conditions affect the watershed diffuse pollution under subtropical monsoon climate.
Except for the temporal and spatial distribution tendencies of the watershed diffuse pollution, the soil N biochemical cycle can also be affected by climate factors; hence, the forms of nitrogen loss from terrestrial ecosystems could vary significantly throughout different climate zones due to the different soil N transformation processes [,]. For instance, dissolved organic nitrogen is the main form of diffuse nitrogen in the watersheds with subtropical acidic forest soil, while nitrate nitrogen (NO3-N) is dominate in watersheds with temperate acidic forest soils []. Among the impacting factors, rainfall characteristics are one of the most critical in affecting the nitrogen form in the watershed diffuse pollution, such as adsorbed organic nitrogen (ON-N) and dissolved NO3-N. The NO3-N was reported to be relatively dominant under light rainfall (LR) conditions, while the ON-N was dominant under heavy rainfall conditions []. For example, the percentage of ON-N was expected to increase from 44.87% to 61.92% of the TN loss when the rainfall intensity changed from 45 mm/h to 120 mm/h on bare loess soil and the percentage of NO3-N decreased from 48.40% to 29.40% of the TN loss when the storm return period changed from less than 1 year to more than 10 years in a sub-watershed of the Mahantango Creek, USA [,]. However, the watersheds under subtropical monsoon climate face different conditions. Diffuse pollution has been proved to be serious and critical in these watersheds. What is worse, the mechanisms by which changes in climatic conditions affect the temporal and spatial distribution behaviors and nitrogen loss forms remained unclear. Hence, it is important to assess surface runoff and nitrogen loss characteristics in watersheds with subtropical monsoon climate.
Another critical factor affecting watershed diffuse nitrogen pollution is the soil parameters and land use changes within the watershed, which could explain more than 70% of the total nitrogen in the river under some extreme cases [,]. Among the soil parameters that could lead to watershed diffuse nitrogen pollution changes, the antecedent soil water content (ASW) is one of the most critical factors that affects soil water storage and infiltration capacity, thereby influencing diffuse pollution mechanisms []. Land use changes such as changes in crop types, land management practices, land use distributions, and riverbank buffers could affect watershed diffuse nitrogen pollution distribution behaviors [,,,,]. Hou et al. found that a decrease of nearly 10% in the nitrogen load in surface runoff could be achieved by redistributing land uses within the experimental watershed without any changes in any types of land management practices []. The modelling of nine management practice scenarios indicated that pasture installation resulted in a 97% reduction in NO3-N loss in a watershed of central Iowa []. Meanwhile, different land use types can affect the forms of watershed nitrogen loss significantly. For instance, in stream water of catchments dominated by tea plantations, the total ON-N and NO3-N concentrations were 3.27 and 5.40 times higher than the concentrations in forested catchments, respectively []. However, as watersheds are complex and robust ecosystems that are sensitive to both natural and artificial factors, the dynamics of how changes in land use and climate change impact the watershed diffuse nitrogen pollution forms and distribution behaviors under subtropical monsoon climate have remained unclear. Additionally, the interactions between rainfall patterns and land use changes have introduced extra uncertainties in the watershed nitrogen pollution behaviors. Therefore, it is critical and essential for us to understand the dynamics of the watershed diffuse nitrogen pollution processes that are related to land use changes and different rainfall patterns in the subtropical monsoon climate regions.
The Soil and Water Assessment Tool (SWAT), a useful model for the assessment of watershed hydrological processes and nutrient loading in mixed land use watersheds [], was employed in this study to estimate the overall influence of rainfall patterns on watershed diffuse nitrogen pollution in a typical watershed under subtropical monsoon climate. Specifically, the main objectives of this study were to (1) assess the characteristics of surface runoff and TN loss under different rainfall types; (2) investigate the forms of nitrogen loss under different rainfall types; (3) clarify the effects of soil hydrological factors, especially ASW, on surface runoff and TN loss in a mixed land use watershed with subtropical monsoon climate.
2. Materials and Methods
2.1. Study Area Description and Rainfall Patterns
The Dongjiang watershed, located in southern China (Figure 1), experiences a subtropical monsoon climate with an average annual temperature of 21 °C and rainfall of 1800 mm. The elevation ranged from −14 m to 1491 m in the Dongjiang watershed with six weather stations and three hydrological stations used in this research, which made the watershed a suitable watershed for setting up hydraulic models for assessing non-point-source pollution and surface runoff. More than 72% of the total area is covered by forests and more than 13% by agricultural lands. Reports and data from local governments have shown that the excessive application of fertilizers has increased the diffuse nitrogen pollution to water bodies, which accelerated water quality degradation in the watershed. Some of the possible reasons that could lead to the extensive use of fertilizer could be the need for higher crop production from local farmers and lack of regulations in fertilizer application processes in this region. Up to now, no detailed reports have been revealed concerning the reasons that were directly related with this excessive application of fertilizers.
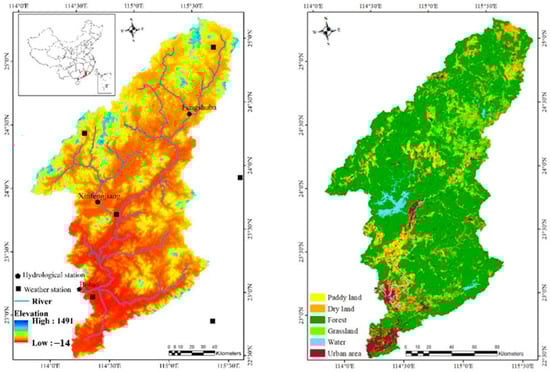
Figure 1.
Location, topographic distribution, and land use (2015) of Dongjiang Watershed.
The rainfall in this watershed showed significantly temporal variations with a distinctive wet season from April to September. According to annual rainfall, the study years were classified into three scenarios: dry (1989, 1991, 1996, 2003, 2004, 2007, 2009, 2012, 2013), normal (1988, 1990, 1992, 1993, 1994, 1995, 1998, 1999, 2002, 2005, 2014, 2017), and wet years (1997, 2001, 2006, 2008, 2011, 2015, 2016). The wet years had an annual rainfall from 1981.62 mm to 2487.47 mm, while normal years were from 1587.91 mm to 1973.40 mm, and dry years were from 1287.52 mm to 1582.84 mm, as shown in Table 1. By adapting the above classification numbers, the non-parametric Least Significant Difference (LSD) test showed a significant difference between groups at a significance level of 0.05 (Table 1), which proved that differences existed between groups. All the statistics tests were prepared in R (version 4.2.0).

Table 1.
Characteristics of dry, normal, and wet years based on the yearly rainfall.
The daily precipitation was classified into four groups with the percentile threshold method, which is commonly used with a percentile value (95th percentile) as the extreme threshold during 1988 to 2017 []. The rainfall threshold of the whole watershed was calculated using the mean precipitation of each weather station weighted by covering area within the watershed. The definitions of LR and MR were based on the classification from the China Meteorological Administration. The daily rainfall amount (Ri) was divided into four types: 1 mm ≤ LR< 10 mm; 10 mm ≤ MR < 25 mm; 25 mm ≤ intense rainfall (IR) < 55.9 mm; and extreme rainfall (ER) ≥ 55.9 mm. The LR had the highest annual occurrence (81 days) and the lowest rainfall amount (358 mm). The annual occurrence was 38 days for MR and 21 days for IR, representing 26.55% and 32.93% of the annual rainfall, respectively. Although ER had the lowest occurrence frequency (7 days on average), it contributed 24.96% of the annual rainfall amount. The rainfall amount of ER (575 mm) was almost equal to MR (611 mm). The main difference between wet, normal, and dry years was rainfall occurrences and amount of IR and ER (Table 2). The rainfall occurrence of IR and ER in wet years was 7 and 3 days higher than normal years, respectively, and 12 and 5 days higher than dry years. The rainfall amount of ER in wet years was 47.90% and 104.24% higher than in normal and dry years, respectively.
Table 2.
Statistical features of rainfall pattern in dry, normal, and wet years from 1988 to 2017.
2.2. SWAT Model Setup
The SWAT model (version 2012) was used to simulate the surface runoff and nitrogen loss in the watershed. The model databases included Digital Elevation Model (DEM), land use, soil properties, meteorological data, and agricultural management information. The DEM was obtained from the Geospatial Data Cloud (http://www.gscloud.cn, accessed on 1 July 2020). Land use properties of 1990, 2000, 2010, and 2015 were obtained from the Resource and Environment Data Cloud Platform, Chinese Academy of Sciences (http://www.resdc.cn/, accessed on 23 May 2020) and were used in the model simulation to represent the land use of 1985–1994, 1995–2004, 2005–2011, 2012–2017 (Table 3). The database of soil properties was obtained from the Institute of Soil Science, Chinese academy of Science (access date 21 November 2019). The three major soil types in Dongjiang watershed are red soil, latosol, and paddy soil, which occupy 39.39%, 36.95%, and 16.93% of the total area, respectively. Daily meteorological data (rainfall, maximum and minimum temperature, relative humidity, wind speed, and daylight hours) from 1985 to 2017 were collected from the National Meteorological Information Centre, China Meteorological Administration (http://data.cma.cn, accessed on 12 March 2020). The solar radiation data were calculated by daylight hours through the method proposed by Neitsch, and further details can be found in the model’s theoretical documentation []. The dominant crops for paddy field and dryland were rice and peanut, respectively. They were set as an annual rotation tillage system. The date of sowing, fertilization, and harvesting, as well as the amount of fertilizer, were imported into the model. According to the local agricultural survey, the average amount of nitrogen fertilizer (element N) applied in each crop season was 200 kg/ha and 187 kg/ha for rice and peanuts, respectively. The model run from 1985 to 2017 and the data from 1985 to 1987 was used for model warm-up. All the GIS data and SWAT were prepared in ArcGIS (version 10.2).
Table 3.
Land use composition dynamics for Dongjiang watershed from 1990 to 2015 (%).
2.3. Model Calibration and Validation
The daily stream flow data obtained from three hydrological stations for the 2011–2014 period (Fengshuba, Xinfengjiang, and Boluo) and the monthly TN load obtained from the Boluo station from 2013 to 2014 were used for model calibration and validation. As one of the most widely used algorithms for model calibration and validation, the Sequential Uncertainty Fitting (SUFI2) algorithm provides the researchers the ability to assess the fitness between two sequential time series with uncertainty. As a result, calibration and validation analyses were conducted using the SUFI2 algorithm in the SWAT-CUP (SWAT-CUP version 5.1.6.2), which was developed by the Neprash Corporation and Texas A&M University. Satisfactory model performance of daily stream flow and monthly TN load were achieved during calibration and validation periods (Figure 2). Coefficients of determination values (R2) were greater than 0.6 and the Nash–Sutcliffe efficiencies (ENS) were greater than 0.5. More importantly, the SWAT model set up could precisely simulate the impacts from extreme weather events such as long-term dry periods and extreme weather events, both of which could play critical roles in generating TN loss and surface runoff. Hence, the SWAT model was reliable for simulating the surface runoff and nitrogen loss in the watershed.
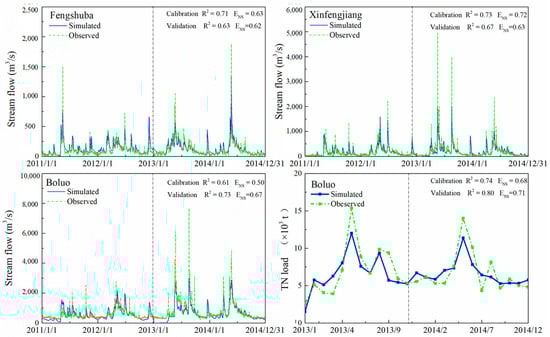
Figure 2.
Simulated and observed daily stream flow and monthly total nitrogen (TN) load.
2.4. Data Analysis
To investigate the effects of ASW on surface runoff and nitrogen loss under different rainfall types, the soil water conditions were divided into three groups based on soil ASW values. The soil moisture condition was defined as ‘low’ when the ASW value was lower than the 25th percentile of all watershed ASW values, as ‘high’ when the value was higher than the 75th percentile, and as ‘medium’ when the value was between the 25th and 75th percentiles.
The differences between rainfall occurrence and amount of each rainfall type were assessed using the one-way analysis of variance (ANOVA). To explore the impacts of hydrological factors (rainfall, soil water, percolation water, and ASW) on watershed surface runoff and nitrogen loss, the simulation years were classified into three categories including dry, normal, and wet years based on annual rainfall amount. Based on the results, the outputs of 2015, 2016, and 2017 were classified as typical normal, wet, and dry years, respectively. The ternary plots were used to present the dynamic effects of rainfall, soil water, and percolation water on surface runoff and nitrogen loss. Each factor was rescaled from 0 to 1, and the plots represented the relative values.
3. Results
3.1. Daily Dynamics of Diffuse TN Loading under Rainfall
To understand the dynamics of how diffuse nitrogen loss is influenced by daily rainfall, the relationship between daily streamflow at the watershed outlet and watershed mean daily rainfall was evaluated. The watershed monitored daily rainfall, simulated stream flow, and nitrogen loading in 2015 are shown in Figure 3. The rainy period mainly occurred from May to August with more extreme rainfall events and higher base value. The rainfall amount of LR, MR, IR, and ER was 358, 611, 758, and 575 mm, with the corresponding occurrence rates at 55.10%, 25.85%, 14.29%, and 4.76%, respectively. Daily stream flow and TN loading change showed a similar trend to rainfall, which meant rainfall was the direct influencing factor for these changes. Additionally, the changes in TN loss and stream flow were higher than precipitation, which proved that TN loss and surface runoff were expected to magnify the increasing level of precipitation and result in more serious ecological concerns and risks.
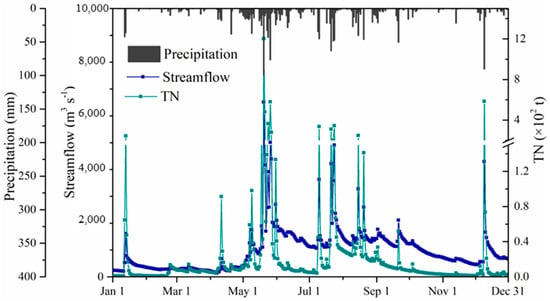
Figure 3.
Watershed daily rainfall, stream flow at outlet, and diffuse TN loading of watershed.
The scatterplot of the response of TN losses to rainfall in this watershed is shown in Figure 4a, in which rainfall intensity was divided into four levels according to the daily rainfall amount, as detailed in Section 2.1. The average TN losses under ER () were over 38 times more than LR () and over 18 times more than IR (), which meant the TN loss was sensitive to the rainfall. One-way ANOVA showed TN losses under different rainfall levels were significantly different (p < 0.01). It was also found that TN losses had significant strong Pearson correlations with daily rainfall amount. The TN losses depended exponentially on rainfall amount as fitted in Figure 4a, while residual error also meant that rainfall was not the only major influencing factor on TN losses. Meanwhile, the ON-N losses showed a similarly exponential relationship with rainfall amount as TN losses, as shown in Figure 4b. While NO3-N showed weak Pearson correlation with rainfall amount (r = 0.272), there were no significant differences between the NO3-N values of ER and IR or ER and MR. This finding indicated that the effect of rainfall intensity on TN loss change was that heavy rainfall was expected to accelerate ON-N loss more than NO3-N.
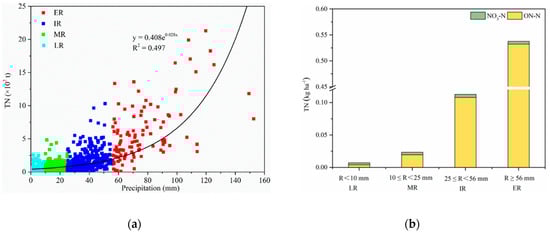
Figure 4.
Watershed TN (a) and ON-N (b) losses at outlet under four rainfall types (LR, light rainfall; MR, moderate rainfall; IR, intense rainfall; ER, extreme rainfall).
3.2. Watershed Diffuse TN Loading from Different Land Uses and Rainfall Conditions
In order to highlight the impacts of land use on TN losses, the watershed daily diffuse TN losses from four main types of land uses were compared. As shown in Figure 5, TN loading increased exponentially with daily rainfall intensity, increasing for all the four types of land use, while the rising tendency varied among different land use types. The average TN losses from all four land uses were lowest under LR events by 0.0015, 0.0050, 0.0363, and 0.0491 kg ha−1 for forest, pasture, paddy fields, and dry lands, respectively. Furthermore, the values increased significantly, up to 0.2873, 1.5479, 1.4371, and 2.2674 kg ha−1 under ER events. It was obvious that the average TN losses were minimal for forest land, especially under ER events. Moreover, IR events contributed to 34.34, 35.07, 38.32, and 39.60% of TN losses for forest, pasture, paddy fields, and dry lands, respectively, while ER events contributed to 26.59, 31.08, 44.26, and 46.15% of TN losses from forest, pasture, paddy fields, and dry lands. As a result, IR and ER were the dominant rainfall types that could cause diffuse TN pollution in this watershed in the subtropical monsoon climate region. The order of sensitivity of TN loss to daily rainfall intensity of the four types of land uses from high to low was dry lands, paddy field, pasture, and forest.
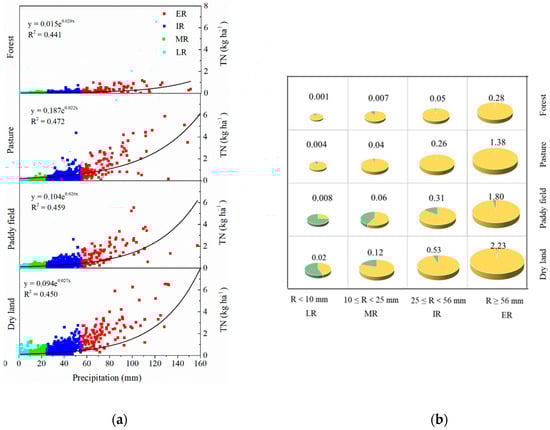
Figure 5.
(a) Streamflow and (b) TN loss from different land uses under four rainfall types. Green area referred to NO3-N and yellow area referred to ON-N.
The proportion of diffused nitrogen forms is shown in Figure 5b. Like Figure 4b, ON-N losses from each land use type increased with daily rainfall exponentially; both TN and ON-N losses showed a significant difference between the four rainfall levels for all the land use types (p < 0.01), while NO3-N losses increased gradually from LR to IR and then decreased slightly under ER except for paddy fields, for which NO3-N loss increased from LR to ER. The differences in NO3-N losses between MR, IR, and ER were not always statistically significant, as shown in Figure 5b. Moreover, although NO3-N losses changed slightly with rainfall level, LR events contributed to most of the NO3-N losses, as it occurred more frequently than any other kind of rainfall; its contribution to NO3-N losses was 34.88, 42.80, 50.47, and 56.63% from forest, pasture, paddy fields, and dry lands, respectively. By contrast, ER events contributed to only 2.99, 4.34, 3.57, and 2.97% of NO3-N loss from forest, pasture, paddy fields, and dry lands, respectively. Hence, LR was the dominant rain condition that caused NO3-N losses in this watershed, but IR and ER were the main type of rainfall causing ON-N and TN losses.
Moreover, paddy fields and dry lands contributed most to TN losses, at 28.80 and 47.52%, and contributed the most to NO3-N losses, at 54.46 and 46.94%, while dry lands and pastures contributed most to ON-N losses, at 51.59% and 29.66%. Dry lands were the most critical diffused nitrogen source in both forms of TN losses, while forests were the least critical source.
3.3. Impact of ASW on Watershed Surface Runoff and TN Loss
After analyzing the impacts of rainfall and land use types on TN loss, the effects of ASW on TN loss under different rainfall types were further compared for detailed dynamics (Figure 6). Our results showed that high ASW would accelerate TN losses under rainfall to a limited degree and was not statistically significant (p > 0.05). Under the ER type of rainfall, TN loss under high-ASW conditions was 1.18, 1.05, 1.54, and 1.59 times the values under low-ASW conditions for forests, dry lands, paddy fields, and pastures, respectively. In dry lands, surface runoff was 33.59 mm under low-ASW conditions, but increased to 37.08 mm under high-ASW conditions. The latter was about 1.18, 1.64, and 1.97 times the values in paddy fields, pastures, and forests in the high-ASW condition. TN loss in pastures was 2.27 kg·ha−1 under high-ASW conditions, and the same values for dry lands were 1.36 and 7.83 times the values in paddy fields and forests, respectively.
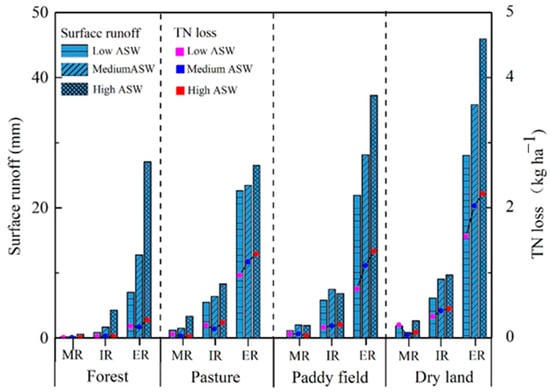
Figure 6.
Impact of ASW on surface runoff and TN loss under different rainfall intensities and land use conditions.
4. Discussion
4.1. Surface Runoff and Diffuse TN Loss under Various Rainfall Types
The relation between surface runoff and diffuse pollution loss is directly influenced by the rainfall characteristics []. ER, which is characterized by high rainfall intensity and low occurrences, plays an important role in causing severe runoff and nutrient losses []. In the subtropical watershed researched in this paper, although ER events had the lowest occurrences of 7 days per year, they contributed the most to total surface runoff (54.29%) and TN losses (57.63%). Additionally, low soil infiltration capacity promoted nitrogen loss since it increased soil erosion by accelerating surface runoff [].
Land use was another critical factor that could influence surface runoff and nitrogen loss. Based on the simulated results, the surface runoff and TN loss from farmlands were higher than that from forests and pastures under all types of rainfall researched in this paper (LR, MR, IR, and ER), which proved that natural lands were advantageous in reducing surface runoff and nitrogen loss compared with artificial agricultural lands []. During this process, a higher percentage of rainfall was absorbed by soil or penetrated to the deeper layers of soil columns in forests and pastures as soil water or percolation water instead of flowing out as runoff []. Agricultural lands, however, usually have the lower soil infiltration capacity and generate more surface runoff and nitrogen loss []. TN loss in dry lands was about 1.7 times higher than paddy fields due to the fact that the surface layers of the dry soil were more vulnerable to precipitation compared with the paddy field. As a result, all types of precipitation could penetrate deeper into the dry soil surface and resulted in increased loss in both TN and sediments. One major soil property that could reflect this difference is that the paddy field usually has lower soil infiltration capacity than dry lands []. Our results also showed that the surface runoff and TN loss from forests and pastures were more sensitive to rainfall types than paddy fields and dry lands. The percentage of surface runoff and TN loss under ER events in forests and pastures (58.41–70.67%) was higher than in paddy fields and dry lands (48.60–50.60%), despite their lower values (Figure 3 and Figure 4). One possible reason for this finding was that the relatively high ASW of the soil in forests and pastures was expected to significantly reduce the soil interception capacity and the soil with decreased interception capacity would generate more surface runoff and TN loss during ER events []. This finding proved that forests and pastures were effective in controlling surface runoff and TN loss during LR, MR, and IR events, but not as effective during ER events. For agricultural lands, frequent fertilizer applications, compacted soil surface, and low soil infiltration capacity were all expected to result in serious surface runoff and nutrient loss under any type of rainfall event. However, the agricultural lands under ER events should still be carefully managed, as the surface runoff and TN loss were still the most serious and critical among all types of rainfall.
In conclusion, surface runoff and TN loss were proved to be serious under ER for forests and pastures and under all types of rainfall for the agricultural lands. Meanwhile, ER was found to be the type of rainfall with the most surface runoff and TN loss for all types of land uses.
4.2. Different Forms of Nitrogen Loss under a Subtropical Monsoon Climate
The previous research by Deelstra et al. has found that nitrogen loss amount was relatively high in the watersheds with high annual rainfall and temperature []. This is likely due to the acceleration of nitrogen-releasing processes from biomass residues as a result of the increased activity of soil microorganisms and fauna under high soil moisture and temperature conditions [,]. Thus, more nitrogen diffuses to water bodies during the rainfall–runoff process in watersheds with high rainfall and temperature. The findings in our research are consistent with previous research in which runoff and TN were significantly higher in a temperate climate region compared with a cold climate region [].
Furthermore, the dominant form of nitrogen loss among different climate regions was ON-N, implying that soil erosion-induced pollution was critical for the diffuse pollution of these regions []. The fraction of ON-N became larger as temperature and rainfall increased, and the ON-N percentage of total nitrogen loss was the highest among all the nitrogen loss forms in watersheds with subtropical monsoon climate (90–95%) in our simulation results. A possible reason for this conclusion was that higher soil moisture and more frequent rainfall events were expected to promote the loss of ON-N that absorbed on soil particles via soil erosion processes. The NO3-N loss ratio, however, would decrease as annual temperature increased even if the annual rainfall amounts were similar [,]. This could be attributed to the accelerated soil nitrogen mineralization process under higher temperature []. This finding was also consistent with the previous research pointing out that the increasing winter temperature mobilized the large stores of ON-N and increased nitrate runoff []. The component of nitrogen could originate from the fact that biomass residues in forests and pastures could be easily decomposed in a relatively short period of time due to high temperature and humidity in subtropical regions [].
The ON-N is adsorbed by soil particles and transported with sediment during soil erosion in the nitrogen loss process []. Generally, increased rainfall was expected to result in increased ON-N loss via soil erosion [,]. The same patterns could also be observed in this study, as the percentage of ON-N loss increased as rainfall increased. Under ER events, more than 97.22% of the TN loss was in the form of ON-N, the majority of which is generated via soil erosion.
However, the dominant nitrogen loss forms showed critical variance under different rainfall and land use types. For forests and pastures, the ON-N loss accounted for more than 90% of TN loss regardless of rainfall type, which implied that nitrogen loss from these two land use types was mainly related to soil erosion in the simulated watershed. For agricultural lands, NO3-N, stored in the upper soil layers from excessive fertilizer application, was highly soluble in water and could be easily washed away via the runoff process []. This could partially explain the reason that the percentages of NO3-N loss in the paddy field and dry lands were higher than in forests and pastures. The fact that the ON-N loss ratios were lower in paddy fields than in dry lands might result from the decreased soil erosion and nitrogen loss in paddy fields with higher field ridge and water storage capacity [,].
4.3. Implications for Subtropical Watershed Management
The ER events were extremely critical in subtropical watersheds, especially under high antecedent moisture conditions and in wet years. Compared with forests and pastures in the same region, agricultural lands were more vulnerable to more serious rainfall events because significant changes in surface runoff and nitrogen loss ratio took place when rainfall events moved from LR to ER. Therefore, ecological engineering structures and buffer strips should be implemented along agricultural lands to naturalize the negative impacts on surface runoff and nitrogen loss from frequent and unpredictable extreme rainfall in subtropical regions [].
Meanwhile, even though forests and pastures were proved to be sources of TN loss and surface runoff, the recommendations for those two types of land use were not applicable due to the fact that they belong to the native local ecosystems. As part of the local ecosystems, the pollution and surface runoff should be a natural part of the processes within a reasonable range. However, as climate change has become more and more significant and critical, the increase in TN loss and surface runoff has become more and more concerning for decision-makers and should be taken into consideration in future.
Furthermore, soil management practices such as conservation tillage, mulching, and hedgerow systems could also be implemented in the watershed in subtropical monsoon regions []. Agricultural diffuse pollution should be further minimized by reducing fertilizer application, increasing fertilizer use efficiency, and adopting no-tillage management []. Moreover, increasing the ridge height of paddy fields is an effective way to enhance field water storage and reduce surface runoff and nitrogen loss []. For forest and pasture lands, more care needs to be taken to prevent them from generating more TN loss and surface runoff and becoming a critical source of pollution and ecological concerns under on-going climate change.
5. Conclusions
The characteristics of surface runoff and diffuse nitrogen loss under different rainfall types in a typical subtropical monsoon watershed were investigated using the SWAT model. The results demonstrated that surface runoff and TN loss were expected to become more serious as rainfall amount increased. ER events had the lowest occurrences, but it contributed the most to surface runoff and TN loss. Although forests and pastures had a better effect on reducing diffuse pollution, their surface runoff and nitrogen loss were still proved to be serious under ER events. ON-N loss was the dominant form of TN loss, accounting for 90% of the total loss in the simulated watershed in the subtropical monsoon climate region. The percentage of ON-N loss increased as rainfall events changed from LR to ER and nearly all the TN loss was in the form of ON-N under ER events. ON-N was the dominant form of nitrogen loss generated from forests and pastures regardless of rainfall type, while NO3-N loss was dominant under LR events for paddy fields and dry lands. The effects of ASW on surface runoff and TN loss were higher under ER events. The surface runoff and TN loss in the high-ASW condition were up to 4 times and about 1.5 times higher, respectively, than in the low-ASW condition.
The findings in this research have proved that ER events should be considered the priority period in reducing nitrogen loss and surface runoff generated from the watersheds in subtropical monsoon region. Notably, due to the extremely high annual rainfall amount and daily rainfall intensity in this climate region, forests and pastures, which were usually considered to be effective in controlling nitrogen loss and surface runoff, would still produce a considerable amount of TN loss and surface runoff via soil erosion. This conclusion proved that extra attention and efforts were required in handling non-point-source pollution in subtropical monsoon watersheds than the watersheds in cooler regions because the natural systems including forest and pastures were no longer effective enough in controlling surface runoff and TN loss during ER. However, as our paper only analyzed the changes brought to surface runoff and TN loss without assessing the ecological risks that could be triggered by these changes, some of the future research could be applied to the area assessing the harm and risk of the local ecosystems, especially under climate changes. Additionally, some of the non-point-source pollution could be solved by civil engineering processes designed using bio-chemical processes, especially for the extensive amount of TN loss in the surface runoff during ER. It would be beneficial both to local ecosystems as well as farmers if the TN loss via agricultural land could be further utilized.
As a result, it is of vital importance for the decision-makers to make necessary plans against ecological disasters triggered by extreme weather events, especially for the watersheds in the subtropical monsoon region, such as the Dongjiang watershed researched in this paper. Additionally, possible land management such as raising paddy fields’ ridge heights and growing protective crops during rainy seasons should also be applied to the agricultural land in this region as well.
Author Contributions
Writing—original draft, C.H.; Writing—review & editing, W.O.; Supervision, Z.Y. All authors have read and agreed to the published version of the manuscript.
Funding
The research presented here benefits from financial support from the National Key Research and Development Program of China (2022YFC3202202).
Institutional Review Board Statement
Not applicable.
Informed Consent Statement
Not applicable.
Data Availability Statement
Not applicable.
Conflicts of Interest
The authors declare no conflict of interest. The authors declare that they have no known competing financial interests or personal relationships that could have appeared to influence the work reported in this paper.
References
- Kumwimba, M.N.; Meng, F.; Iseyemi, O.; Moore, M.T.; Bo, Z.; Tao, W.; Liang, T.J.; Ilunga, L. Removal of non-point source pollutants from domestic sewage and agricultural runoff by vegetated drainage ditches (VDDs): Design, mechanism, management strategies, and future directions. Sci. Total Environ. 2018, 639, 742–759. [Google Scholar] [CrossRef] [PubMed]
- Oygarden, L.; Deelstra, J.; Lagzdins, A.; Bechmann, M.; Greipsland, I.; Kyllmar, K.; Povilaitis, A.; Iital, A. Climate change and the potential effects on runoff and nitrogen losses in the Nordic–Baltic region. Agr. Ecosyst. Environ. 2014, 198, 114–126. [Google Scholar] [CrossRef]
- Nguyen, H.H.; Recknagel, F.; Meyer, W. Effects of projected urbanization and climate change on flow and nutrient loads of a Mediterranean catchment in South Australia. Ecohydrol. Hydrobiol. 2018, 19, 279–288. [Google Scholar] [CrossRef]
- Gao, X.; Ouyang, W.; Hao, Z.; Shi, Y.; Wei, P.; Hao, F. Farmland-atmosphere feedbacks amplify decreases in diffuse nitrogen pollution in a freeze-thaw agricultural area under climate warming conditions. Sci. Total Environ. 2017, 579, 484–494. [Google Scholar] [CrossRef] [PubMed]
- Ng Kee Kwong, K.F.; Bholah, A.; Volcy, L.; Pynee, K. Nitrogen and phosphorus transport by surface runoff from a silty clay loam soil under sugarcane in the humid tropical environment of Mauritius. Agri. Ecosyst. Environ. 2002, 91, 147–157. [Google Scholar] [CrossRef]
- Philben, M.; Ziegler, S.E.; Edwards, K.A.; Kahler, R.; Benner, R. Soil organic nitrogen cycling increases with temperature and precipitation along a boreal forest latitudinal transect. Biogeochemistry 2016, 127, 397–410. [Google Scholar] [CrossRef]
- Peña-Peña, K.; Irmler, U. Nitrogen and carbon losses from decomposing litter in natural and agroecosystems of two different climate regions of Brazil. Eur. J. Soil Biol. 2018, 86, 26–33. [Google Scholar] [CrossRef]
- Zhang, Y.; Zhou, Y.; Shao, Q.; Liu, H.; Lei, Q.; Zhai, X.; Wang, X. Diffuse nutrient losses and the impact factors determining their regional differences in four catchments from North to South China. J. Hydro. 2016, 543, 577–594. [Google Scholar] [CrossRef]
- Huang, J.C.; Lee, T.Y.; Kao, S.J.; Hsu, S.C.; Lin, H.J.; Peng, T.R. Land use effect and hydrological control on nitrate yield in subtropical mountainous watersheds. Hydrol. Earth Syst. Sci. 2012, 16, 699–714. [Google Scholar] [CrossRef]
- Domroes, M.; Schaefer, D. Recent climate change affecting rainstorm occurrences: A case study in East China. Clim. Past. 2008, 4, 303–309. [Google Scholar] [CrossRef]
- The National Aeronautics and Space Administration (NASA). Climate Change: Vital Signs of the Planet. 2022. Available online: https://climate.nasa.gov/ (accessed on 5 October 2022).
- Zhang, J.; Tian, P.; Tang, J.; Yuan, L.; Ke, Y.; Cai, Z.; Zhu, B.; Müller, C. The characteristics of soil N transformations regulate the composition of hydrologic N export from terrestrial ecosystem. J. Geophys. Res. Biogeosci. 2016, 121, 1409–1419. [Google Scholar] [CrossRef]
- Drewry, J.J.; Newham, L.T.H.; Croke, B.F.W. Suspended sediment, nitrogen and phosphorus concentrations and exports during storm-events to the Tuross estuary, Australia. J. Environ. Manag. 2009, 90, 879–887. [Google Scholar] [CrossRef] [PubMed]
- Wu, L.; Peng, M.; Qiao, S.; Ma, X. Assessing impacts of rainfall intensity and slope on dissolved and adsorbed nitrogen loss under bare loessial soil by simulated rainfalls. Catena 2018, 170, 51–63. [Google Scholar] [CrossRef]
- Zhu, Q.; Schmidt, J.P.; Buda, A.R.; Bryant, R.B.; Folmar, G.J. Nitrogen loss from a mixed land use watershed as influenced by hydrology and seasons. J. Hydrol. 2011, 405, 307–315. [Google Scholar] [CrossRef]
- Hessen, D.O.; Hindar, A.; Holtan, G. The significance of nitrogen runoff for eutrophication of freshwater and marine recipients. Oceanology 1997, 26, 312–320. [Google Scholar]
- Li, W.; Zhai, L.; Lei, Q.; Wollheim, W.M.; Liu, J.; Liu, H.; Hu, W.; Ren, T.; Wang, H.; Liu, S. Influences of agricultural land use composition and distribution on nitrogen export from a subtropical watershed in China. Sci. Total Environ. 2018, 642, 21–32. [Google Scholar] [CrossRef] [PubMed]
- Hardie, M.A.; Cotching, W.E.; Doyle, R.B.; Holz, G.; Lisson, S.; Mattern, K. Effect of antecedent soil moisture on preferential flow in a texture-contrast soil. J. Hydrol. 2011, 398, 191–201. [Google Scholar] [CrossRef]
- Acero Triana, J.S.; Chu, M.L.; Guzman, J.A.; Moriasi, D.N.; Steiner, J.L. Evaluating the risks of groundwater extraction in an agricultural landscape under different climate projections. Water 2020, 12, 400. [Google Scholar] [CrossRef]
- Botero-Acosta, A.; Chu, M.L.; Huang, C. Impacts of environmental stressors on nonpoint source pollution in intensively managed hydrologic systems. J. Hydrol. 2019, 579, 124056. [Google Scholar] [CrossRef]
- Han, J.; Guzman, J.A.; Chu, M.L. Gully erosion susceptibility considering spatiotemporal environmental variables: Midwest US region. J. Hydrol. Reg. 2022, 43, 101196. [Google Scholar] [CrossRef]
- Hou, C.; Chu, M.L.; Botero-Acosta, A.; Guzman, J.A. Modeling field scale nitrogen non-point source pollution (NPS) fate and transport: Influences from land management practices and climate. Sci. Total Environ. 2021, 759, 143502. [Google Scholar] [CrossRef] [PubMed]
- Triana, J.S.A.; Chu, M.L.; Shipley, N.J.; Van Riper, C.J.; Stewart, W.P.; Suski, C.D. A decision-making framework for evaluating environmental tradeoffs in enhancing ecosystem services across complex agricultural landscapes. J. Environ. Manag. 2022, 314, 115077. [Google Scholar] [CrossRef] [PubMed]
- Hou, C.; Chu, M.L.; Guzman, J.A.; Triana, J.S.A.; Moriasi, D.N.; Steiner, J.L. Field scale nitrogen load in surface runoff: Impacts of management practices and changing climate. J. Environ. Manag. 2019, 249, 109327. [Google Scholar] [CrossRef]
- Chaplot, V.; Saleh, A.; Jaynes, D.B.; Arnold, J. Predicting water, sediment and NO3-N loads under scenarios of land-use and management practices in a flat watershed. Water Air Soil Pollut. 2004, 154, 271–293. [Google Scholar] [CrossRef]
- Jacobs, S.R.; Breuer, L.; Butterbach-Bahl, K.; Pelster, D.E.; Rufino, M.C. Land use affects total dissolved nitrogen and nitrate concentrations in tropical montane streams in Kenya. Sci. Total Environ. 2017, 603–604, 519–532. [Google Scholar] [CrossRef] [PubMed]
- Ouyang, W.; Gao, X.; Wei, P.; Gao, B.; Lin, C.; Hao, F. A review of diffuse pollution modeling and associated implications for watershed management in China. J. Soils Sediments 2017, 17, 1527–1536. [Google Scholar] [CrossRef]
- Toride, K.; Cawthorne, D.L.; Ishida, K.; Kavvas, M.L.; Anderson, M.L. Long-term trend analysis on total and extreme precipitation over Shasta Dam watershed. Sci. Total Environ. 2018, 626, 244–254. [Google Scholar] [CrossRef]
- Neitsch, S.L.; Arnold, J.G.; Kiniry, J.R.; Williams, J.R.; King, K.W. Soil and Water Assessment Tool Theoretical Documentation: Version 2005; Texas Water Resources Institute: College Station, TX, USA, 2005. [Google Scholar]
- Truman, C.; Strickland, T.; Potter, T.; Franklin, D.; Bosch, D.; Bednarz, C. Variable rainfall intensity and tillage effects on runoff, sediment, and carbon losses from a loamy sand under simulated rainfall. J. Environ. Qual. 2007, 36, 1495–1502. [Google Scholar] [CrossRef] [PubMed]
- Dai, C.; Liu, Y.; Wang, T.; Li, Z.; Zhou, Y. Exploring optimal measures to reduce soil erosion and nutrient losses in southern China. Agric. Water Manag. 2018, 210, 41–48. [Google Scholar] [CrossRef]
- Assouline, S. Rainfall-induced soil surface sealing: A critical review of observations, conceptual models, and solutions. Vadose Zone J. 2004, 3, 570–591. [Google Scholar] [CrossRef]
- Hao, F.; Zhang, X.; Wang, X.; Ouyang, W. Assessing the relationship between landscape patterns and nonpoint-source pollution in the Danjiangkou Reservoir Basin in China. J. Am. Water Resour. Assoc. 2012, 48, 1162–1177. [Google Scholar] [CrossRef]
- Qiu, G.Y.; Yin, J.; Tian, F.; Geng, S. Effects of the “Conversion of Cropland to Forest and Grassland Program” on the water budget of the Jinghe River catchment in China. J. Environ. Qual. 2011, 40, 1745–1755. [Google Scholar] [CrossRef] [PubMed]
- Brown, A.E.; Zhang, L.; Mcmahon, T.A.; Western, A.W.; Vertessy, R.A. A review of paired catchment studies for determining changes in water yield resulting from alterations in vegetation. J. Hydrol. 2005, 310, 28–61. [Google Scholar] [CrossRef]
- Deelstra, J.; Iital, A.; Povilaitis, A.; Kyllamr, K.; Greipsland, I.; Bliche-Mathiesen, G.; Jansons, V.; Koskiaho, J.; Lagzdins, A. Reprint of “Hydrological pathways and nitrogen runoff in agricultural dominated catchments in Nordic and Baltic countries”. Agric. Ecosyst. Environ. 2014, 198, 65–73. [Google Scholar] [CrossRef]
- Mao, R.; Zhang, X.; Song, C.; Wang, X.; Finnegan, P. Plant functional group controls litter decomposition rate and its temperature sensitivity: An incubation experiment on litters from a boreal peatland in northeast China. Sci. Total Environ. 2018, 626, 678–683. [Google Scholar] [CrossRef]
- Ouyang, W.; Xu, X.; Hao, Z.; Gao, X. Effects of soil moisture content on upland nitrogen loss. J. Hydrol. 2017, 546, 71–80. [Google Scholar] [CrossRef]
- Huang, H. Impacts of Land-Use, Soil Property and Climate Change on NPS Pollution Loss under Long-Term Agricultural Activities. Ph.D. Thesis, Beijing Normal University, Beijing, China, 2016. (In Chinese). [Google Scholar]
- Fan, M.; Shibata, H. Simulation of watershed hydrology and stream water quality under land use and climate change scenarios in Teshio River watershed, northern Japan. Ecol. Indic. 2015, 50, 79–89. [Google Scholar] [CrossRef]
- Hao, C.; Yan, D.; Xiao, W.; Shi, M.; He, D.; Sun, Z. Impacts of typical rainfall processes on nitrogen in typical rainfieldss of black soil region in Northeast China. Arab. J. Geosci. 2015, 8, 6745–6757. [Google Scholar] [CrossRef]
- Dekun, S. Characteristics of nitrogen loss on slope under simulated rainfall. Bull. Soil Water Conserv. 2009, 29, 98–101. [Google Scholar]
- Ouyang, W.; Wu, Y.; Hao, Z.; Zhang, Q.; Bu, Q.; Gao, X. Combined impacts of land use and soil property changes on soil erosion in a mollisol area under long-term agricultural development. Sci. Total Environ. 2018, 613–614, 798–809. [Google Scholar] [CrossRef] [PubMed]
- Cristan, R.; Aust, W.M.; Bolding, M.C.; Barrett, S.M.; Munsell, J.F.; Schilling, E. Effectiveness of Forestry best management practices in the United States: Literature review. For. Ecol. Manag. 2016, 360, 133–151. [Google Scholar] [CrossRef]
- Wei, P.; Ouyang, W.; Gao, X.; Hao, F.; Hao, Z.; Liu, B. Modified control strategies for critical source area of nitrogen (CSAN) in a typical freeze-thaw watershed. J. Hydrol. 2017, 551, 518–531. [Google Scholar] [CrossRef]
Disclaimer/Publisher’s Note: The statements, opinions and data contained in all publications are solely those of the individual author(s) and contributor(s) and not of MDPI and/or the editor(s). MDPI and/or the editor(s) disclaim responsibility for any injury to people or property resulting from any ideas, methods, instructions or products referred to in the content. |
© 2023 by the authors. Licensee MDPI, Basel, Switzerland. This article is an open access article distributed under the terms and conditions of the Creative Commons Attribution (CC BY) license (https://creativecommons.org/licenses/by/4.0/).