Article

Numerical Simulation of the Effect of Heat Conductivity on Proton Exchange Membrane Fuel Cell Performance in Different Axis Directions

1
Architectural Design and Research Institute of Southeast University-Electric Power Design Institute, Nanjing 210018, China
2
School of Energy and Environment, Southeast University, Nanjing 210018, China
3
School of Electrical and Engineering, Southeast University, Nanjing 210018, China
*
Author to whom correspondence should be addressed.
Processes 2023, 11(6), 1713; https://doi.org/10.3390/pr11061713
Submission received: 28 March 2023 / Revised: 24 May 2023 / Accepted: 25 May 2023 / Published: 3 June 2023

Abstract

:
In this paper, the effect of changes in the thermal conductivity of porous electrodes in three coordinate directions on the capability of proton exchange membrane fuel cells is investigated on the basis of current density versus voltammetry curves, and the temperature distribution and water-carrying capacity distribution of the membrane. The results show that when the cell discharge voltage of the PEMFC is 0.3 V, the thermal conductivity in the Z-direction of the porous electrode has a greater effect on the performance of the PEMFC than in the other directions, with the thermal conductivity in the X- and Y-directions of the porous electrode having less than a 5% effect on the performance of the PEMFC, which can therefore be neglected. When the thermal conductivity of the porous electrode in the Z-direction of the PEMFC is 500 W/(m·K) and 1000 W/(m·K), the performance of the PEMFC is improved by 5.78% and 5.87%, respectively, and when the thermal conductivity of the porous electrode in the X-direction of the PEMFC is 500 W/(m·K) and 1000 W/(m·K), the performance of the PEMFC is improved by 2.09% and 2.89%, and the PEMFC performance is improved by 1.51% and 2.00% when the Y-direction thermal conductivity of the porous electrode of the PEMFC is 500 W/(m·K) and 1000 W/(m·K), respectively. The improvement in performance decreases with increasing thermal conductivity, because the thickness of the porous electrode is too thin. Since the side of the model is set to adiabatic heat exchange conditions, while the top and bottom surfaces are set to natural convection heat exchange conditions, the Z-direction thermal conductivity of the porous electrode plays the most important role in the temperature distribution of the PEMFC. The Z-direction thermal conductivity of the porous electrode causes the temperature distribution of the PEMFC assembly to be more uniform, and the Z-direction thermal conductivity of the porous electrode also causes the area of the high-water-content region on the proton exchange membrane to significantly increase.

1. Introduction

The hydrogen fuel cell was invented in 1839. At first, this kind of fuel cell was only used to generate electricity for lighting lamps. However, with the gradual consumption of fossil energy, the earth’s environment is getting worse. The vigorous development of renewable energy sources to reduce the loss of fossil energy resources has become the focus of close attention around the world [1]. Fuel cells are a real method of utilizing renewable energy because of their low carbon emissions and use of fuel from renewable sources. If fuel cells are widely used, this will be of great help in a global energy crisis [2,3]. Hydrogen fuel cells cause less pollution [4,5,6,7] than other types of fuel cell. Hydrogen fuel cells are the most promising type of fuel cell to be used by people in daily life [8]. They have also been the focus of research in a number of different countries. If hydrogen fuel cells can be commercialized, this would be of great help to developments around the world.
A numerical simulation method is used in this paper, and such methods have also been widely used in academic fields for scenarios where carrying out experiments is not convenient [9,10]. The porous electrode of a proton exchange membrane fuel cell consists of a gas diffusion layer and a catalytic layer [11]. The gas diffusion layer is a transport channel for the reaction gas and the produced water, as well as for charge and heat transfer, and complex coupled heat and mass transfer and phase change processes occur within it. The gas diffusion layer is generally made of carbon paper, and its structure is characterized by significant anisotropy. However, most computational simulation models in the literature use a homogeneous simulation model for gas diffusion layers [12,13,14,15,16,17,18,19], using the same transfer coefficients in all directions. Only a few papers [20,21,22,23,24] have investigated the effect of non-isotropic characteristics in the gas diffusion layer on the capabilities of proton exchange membrane fuel cells. Zhou and Liu [20] used numerical simulations to study the effect of different degrees of conductivity in the gas diffusion layer in the thickness direction and in the plane direction on the overall and local capabilities of the cell. Pasaogullari et al. [21] used a two-dimensional simulation model to study the effect of using a non-isotropic gas diffusion layer on heat and mass transfer in the fuel cell. Pharoah et al. [22] developed a two-dimensional single-phase simulation model and used it to study the effect of using a non-isotropic gas diffusion layer on local current density and overall cell capability. He et al. [23] used a three-dimensional numerical simulation model to study the effect of non-isotropic heat conductivity in the gas diffusion layer on cell temperature distribution and liquid water discharge. Han et al. [24] found that at low operating temperatures, the output performance of the proton exchange membrane fuel cell can be effectively improved with an appropriate non-isotropic heat conductivity, and Han et al. [24] also proposed that many porous electrode materials can be prepared in an anisotropic manner, and that this can be achieved with the current level of scientific research and preparation.
The heat transfer characteristics of proton exchange membrane fuel cells constitute one of the important properties affecting the cells’ capabilities. To date, a large number of scholars have studied the heat transfer characteristics of fluids and solids. Sandip S [25,26,27] studied the flow of nanofluids under a superimposed magnetic field and the flow field and temperature field of the magnetic fluid were determined analytically. Deep C [28] studied the effect of the position of a discrete heater in a cylindrical thermal system. Many researchers have studied the heat transfer characteristics of proton exchange membrane fuel cells in great depth [29,30]. Bock R [29] proposed that the catalytic layer is an area in which heat conductivity research is scarce, and the heat conductivity of this area greatly affects the temperature distribution inside the proton exchange membrane fuel cell, thus affecting the performance of the proton exchange membrane fuel cell. Burheim OS [30] concluded that proton exchange membrane fuel cells are non-isothermal during operation, and the heat conductivity of proton exchange membrane fuel cell materials has received extensive attention in the past decade, with many researchers having spent time and energy on studying the effect of the heat conductivity of proton exchange membrane fuel cell materials on the performance of proton exchange membrane fuel cells.
Based on the above literature, combined with the research aims of this paper, firstly, physical and mathematical simulation models of proton exchange membrane fuel cells were established, and then two different sets of heat conductivity values were selected to study the effect of changes in heat conductivity in the X-, Y- and Z-directions on the current density and volt relationship curve of the porous electrodes of proton exchange membrane fuel cells, and a suitable set of heat conductivity values was selected for subsequent study by comparing the two different sets of heat conductivity values. Subsequently, the effect of non-isotropic heat conductivity on the temperature distribution and membrane water carrying capacity distribution of the proton exchange membrane fuel cell was analyzed. The simulation model results were used to analyze the reasons for the change in proton exchange membrane fuel cell capability in depth, and to propose methods for enhancing the capabilities of the proton exchange membrane fuel cell. Although other scholars have performed related research, that previous research has mostly been based on single components. In other words, the effect of the gas diffusion layer or catalytic layer anisotropic thermal conductivity on the cell has generally been analyzed separately. The research in this paper is based on the concept of porous electrodes, in combination with an analysis of the effects of anisotropic thermal conductivity in the gas diffusion layer and the catalytic layer on the performance of the proton exchange membrane fuel cell and in combination with the current reality of the rapid development of anisotropic materials such as PEMFC. This simulation can provide a reference for the future of the use of advanced anisotropic materials for PEMFC.

2. Simulation Model Specification

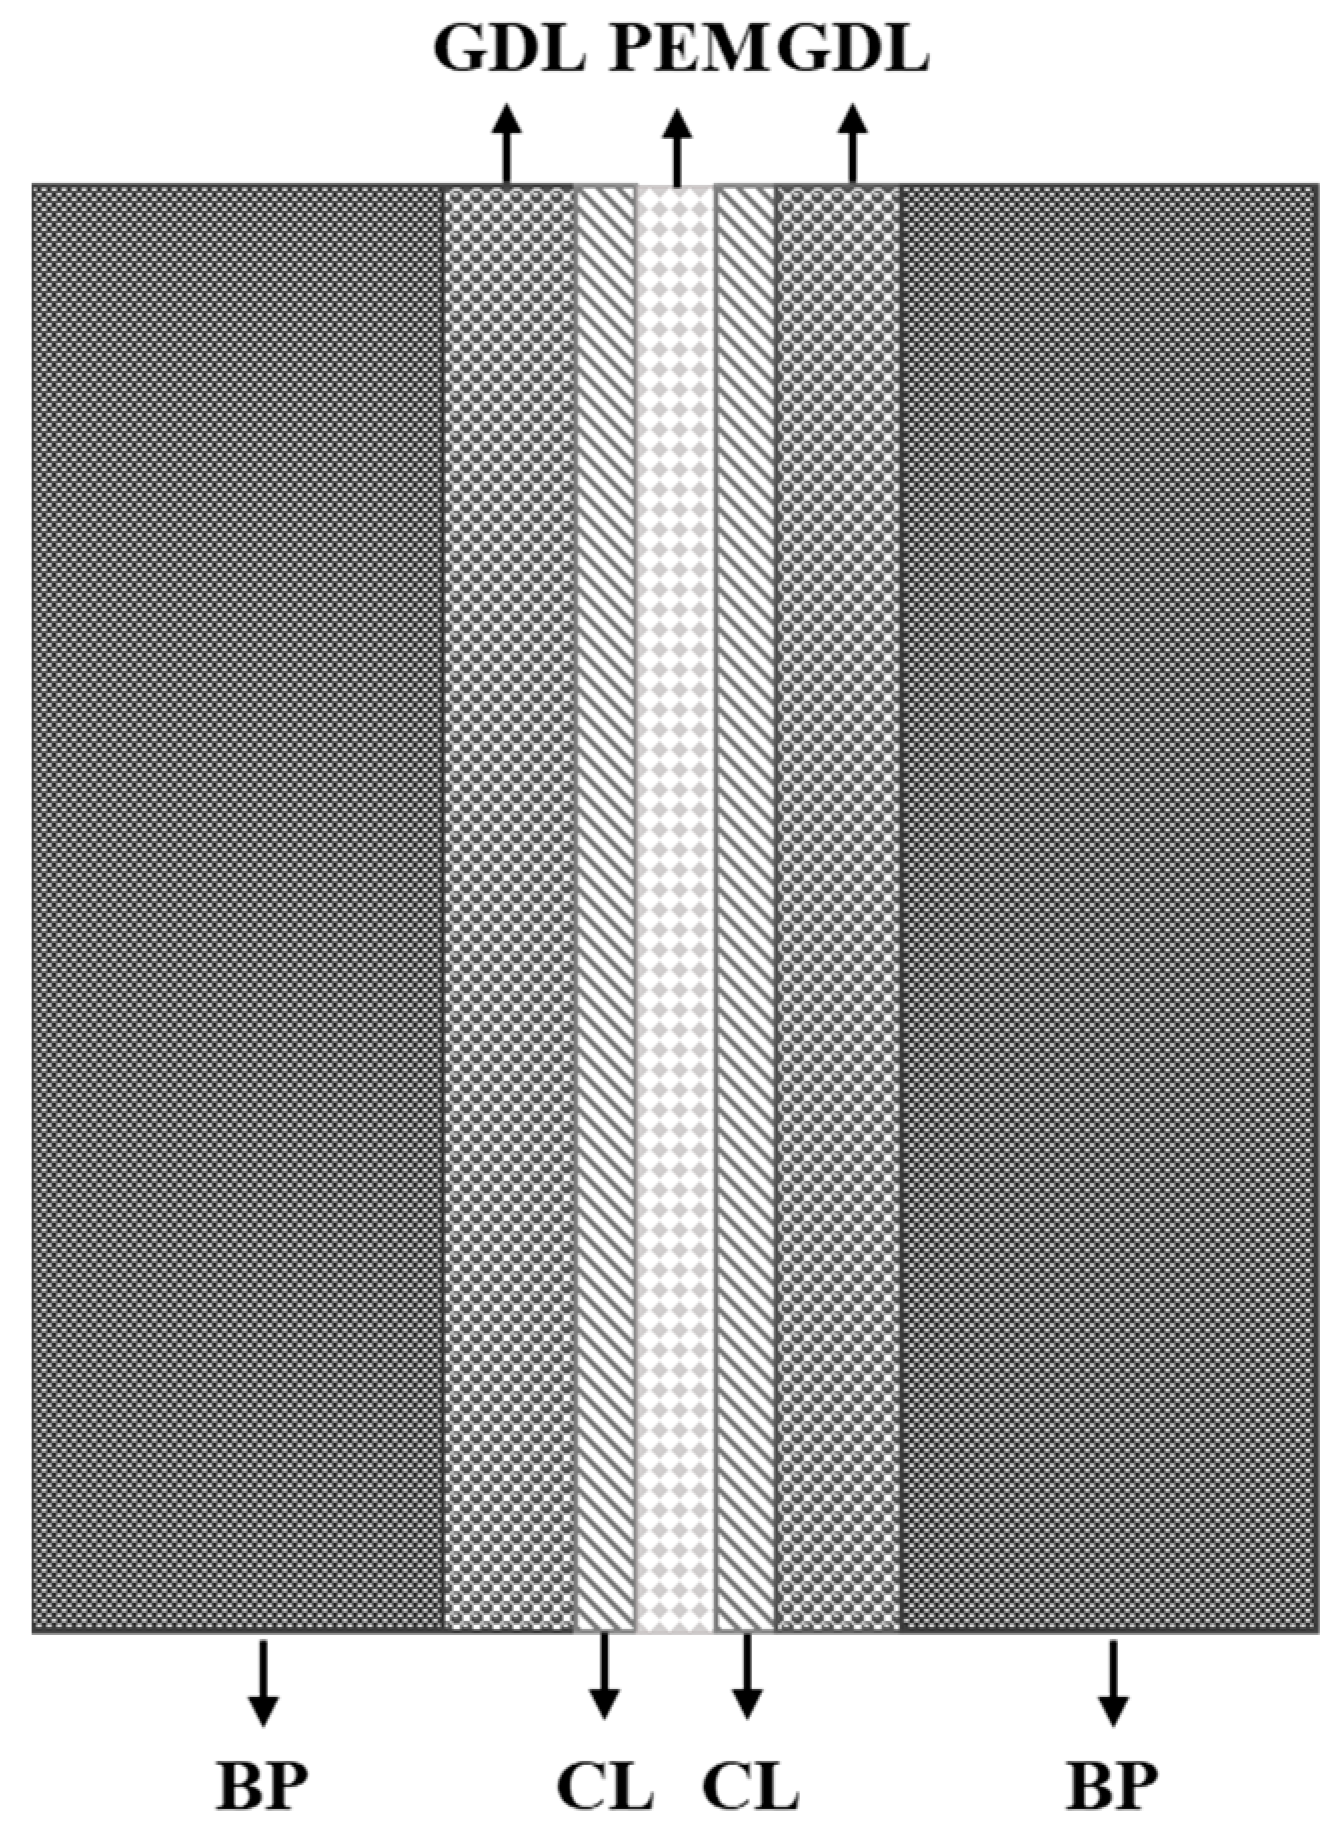
2.1. Physical Simulation Model

Figure 1 shows the component structure of the proton exchange membrane fuel cell. PEM represents the key proton exchange membrane component, CL represents the catalytic layer for chemical reaction, GDL represents the gas diffusion layer, which supports the structure of the proton exchange membrane fuel cell, and BP represents the bipolar plate, where current is collected. Air and hydrogen flow through the gas channel inlets of the cathode and anode sides, respectively, and the diffusion of the catalytic layer reaction is achieved through the gas channel, rather than the outlet of reaction gas and aqueous vapor. When the electron moves to the cathode and anode side due to the external circuit, the protons produced by the proton exchange membrane are transferred from the anode to the cathode side. The simulation model used in this paper is a more realistic three-direction reflection of the operation of proton exchange membrane fuel cells. The geometric parameters used in this study are shown in Table 1. These geometric parameters are consistent with the research results of Chen et al. [31], and have wide applicability.
The actual working conditions are complex and changeable, and four assumptions are adopted in this paper:
(1) Set to the ideal gas reactants.
(2) Negligible contact resistance between resistive interfaces.
(3) The proton exchange membrane fuel cell simulation model runs in a steady state.
(4) PEM does not allow gas to pass through.
(5) Capillary-pressure-driven water transport is neglected.
(6) The simulation parameters in this paper do not change with temperature.

2.2. Governing Equations

COMSOL Multiphysics uses the finite element method as the numerical calculation method, and the creation and solution of partial differential equations or systems of equations are used to simulate real physical processes, using mathematical methods to achieve the solution of real physical processes. Multiphysics provides a large library of case studies, flexible 1D to 3D modeling, and free mesh dissection, as well as multiple interfaces for real-time linkage with other software, greatly reducing the software learning time for researchers.
The control equations used by the software in the simulation process are as follows:
(1)
Equation for conservation of mass:
· ( ε ρ u ) = S m
S m is the mass source term.
(2)
Equation for conservation of momentum:
· ( ε ρ u u ) = ε p + · ( ε μ u ) + S u  
S u is the momentum source term.
(3)
Equation for conservation of energy:
· ( ε ρ c p u T ) = · ( k e f f T ) + S Q
S Q is the energy source term.
(4)
Equation for conservation of components:
· ( ε u c k ) = · ( D k e f f c k ) + S k
S k is the component source term, and the component source items for gas in the catalytic layer are:
S H 2 = M H 2 2 F i a   S O 2 = M O 2 4 F i c S H 2 O = M H 2 O 2 F i c
The electrochemical equations:
(1)
The anode- and cathode-side Butler–Volmer equations are:
S a = j a ,   r e f ( c H 2 c H 2 ,   r e f ) γ a ( e α a F η a R T e α c F η c R T ) S c = j c ,   r e f ( c O 2 c O 2 ,   r e f ) γ c ( e α a F η c R T e α c F η a R T )  
(2)
The current conservation equation:
· ( σ e e ) + S e = 0 · ( σ m m ) + S m = 0  
The membrane proton conductivity can be expressed as:
σ m = ( 0.514 λ 3 × 10 126 ) e ( 1268 ( 1 303 1 T ) )
Water present on the PEM is generated in several different ways, namely pressure, concentration difference, and electromigration.
(1)
Water flux produced by electromigration on membrane:
N = n d I F
The electromigration coefficient is n d = 2.5 λ 22
(2)
Water flux caused by unbalanced pressure on both sides of the membrane:
Pressure migration refers to the amount of water transferred from the high-pressure side to the low-pressure side under the action of pressure differences between the two sides of the membrane, or when there is zero difference between the pressure values set on the two sides of the membrane; therefore, this does not take into account water flow occurring due to pressure.
(3)
Water flux produced by differences in concentration between the two sides of the membrane:
J = D m c y
where D m = D λ [ 2416 ( 1 303 1 T ) ] is the water diffusion coefficient of the PEM [26].
The water phase transition equation:
(1)
On the cathode side:
S H 2 O = 0.208 × 1000 × 18 × P H 2 O P s a t R × T × u c
(2)
On the anode side:
S H 2 O = 0.346 × 1000 × 18 × P H 2 O P s a t R × T × u a

2.3. Boundary Conditions

Interface conditions involving the inlet and outlet of the flow channel and the upper and lower surfaces of the PEMFC:
(1)
Inlet boundary:
Given the inlet velocity, molar fraction of the reaction gas and temperature:
u i n = ξ x I 0 A 1 n F A 2 R T 0 p
X i n = X 0 ,   T i n = T 0
(2)
Outlet boundary:
Back pressure at the outlet is set to 0 Pa.
(3)
Upper and lower boundaries:
Convective heat exchange between the upper and lower surfaces of the cell and the environment.
q 0 = h ( T e x t T )

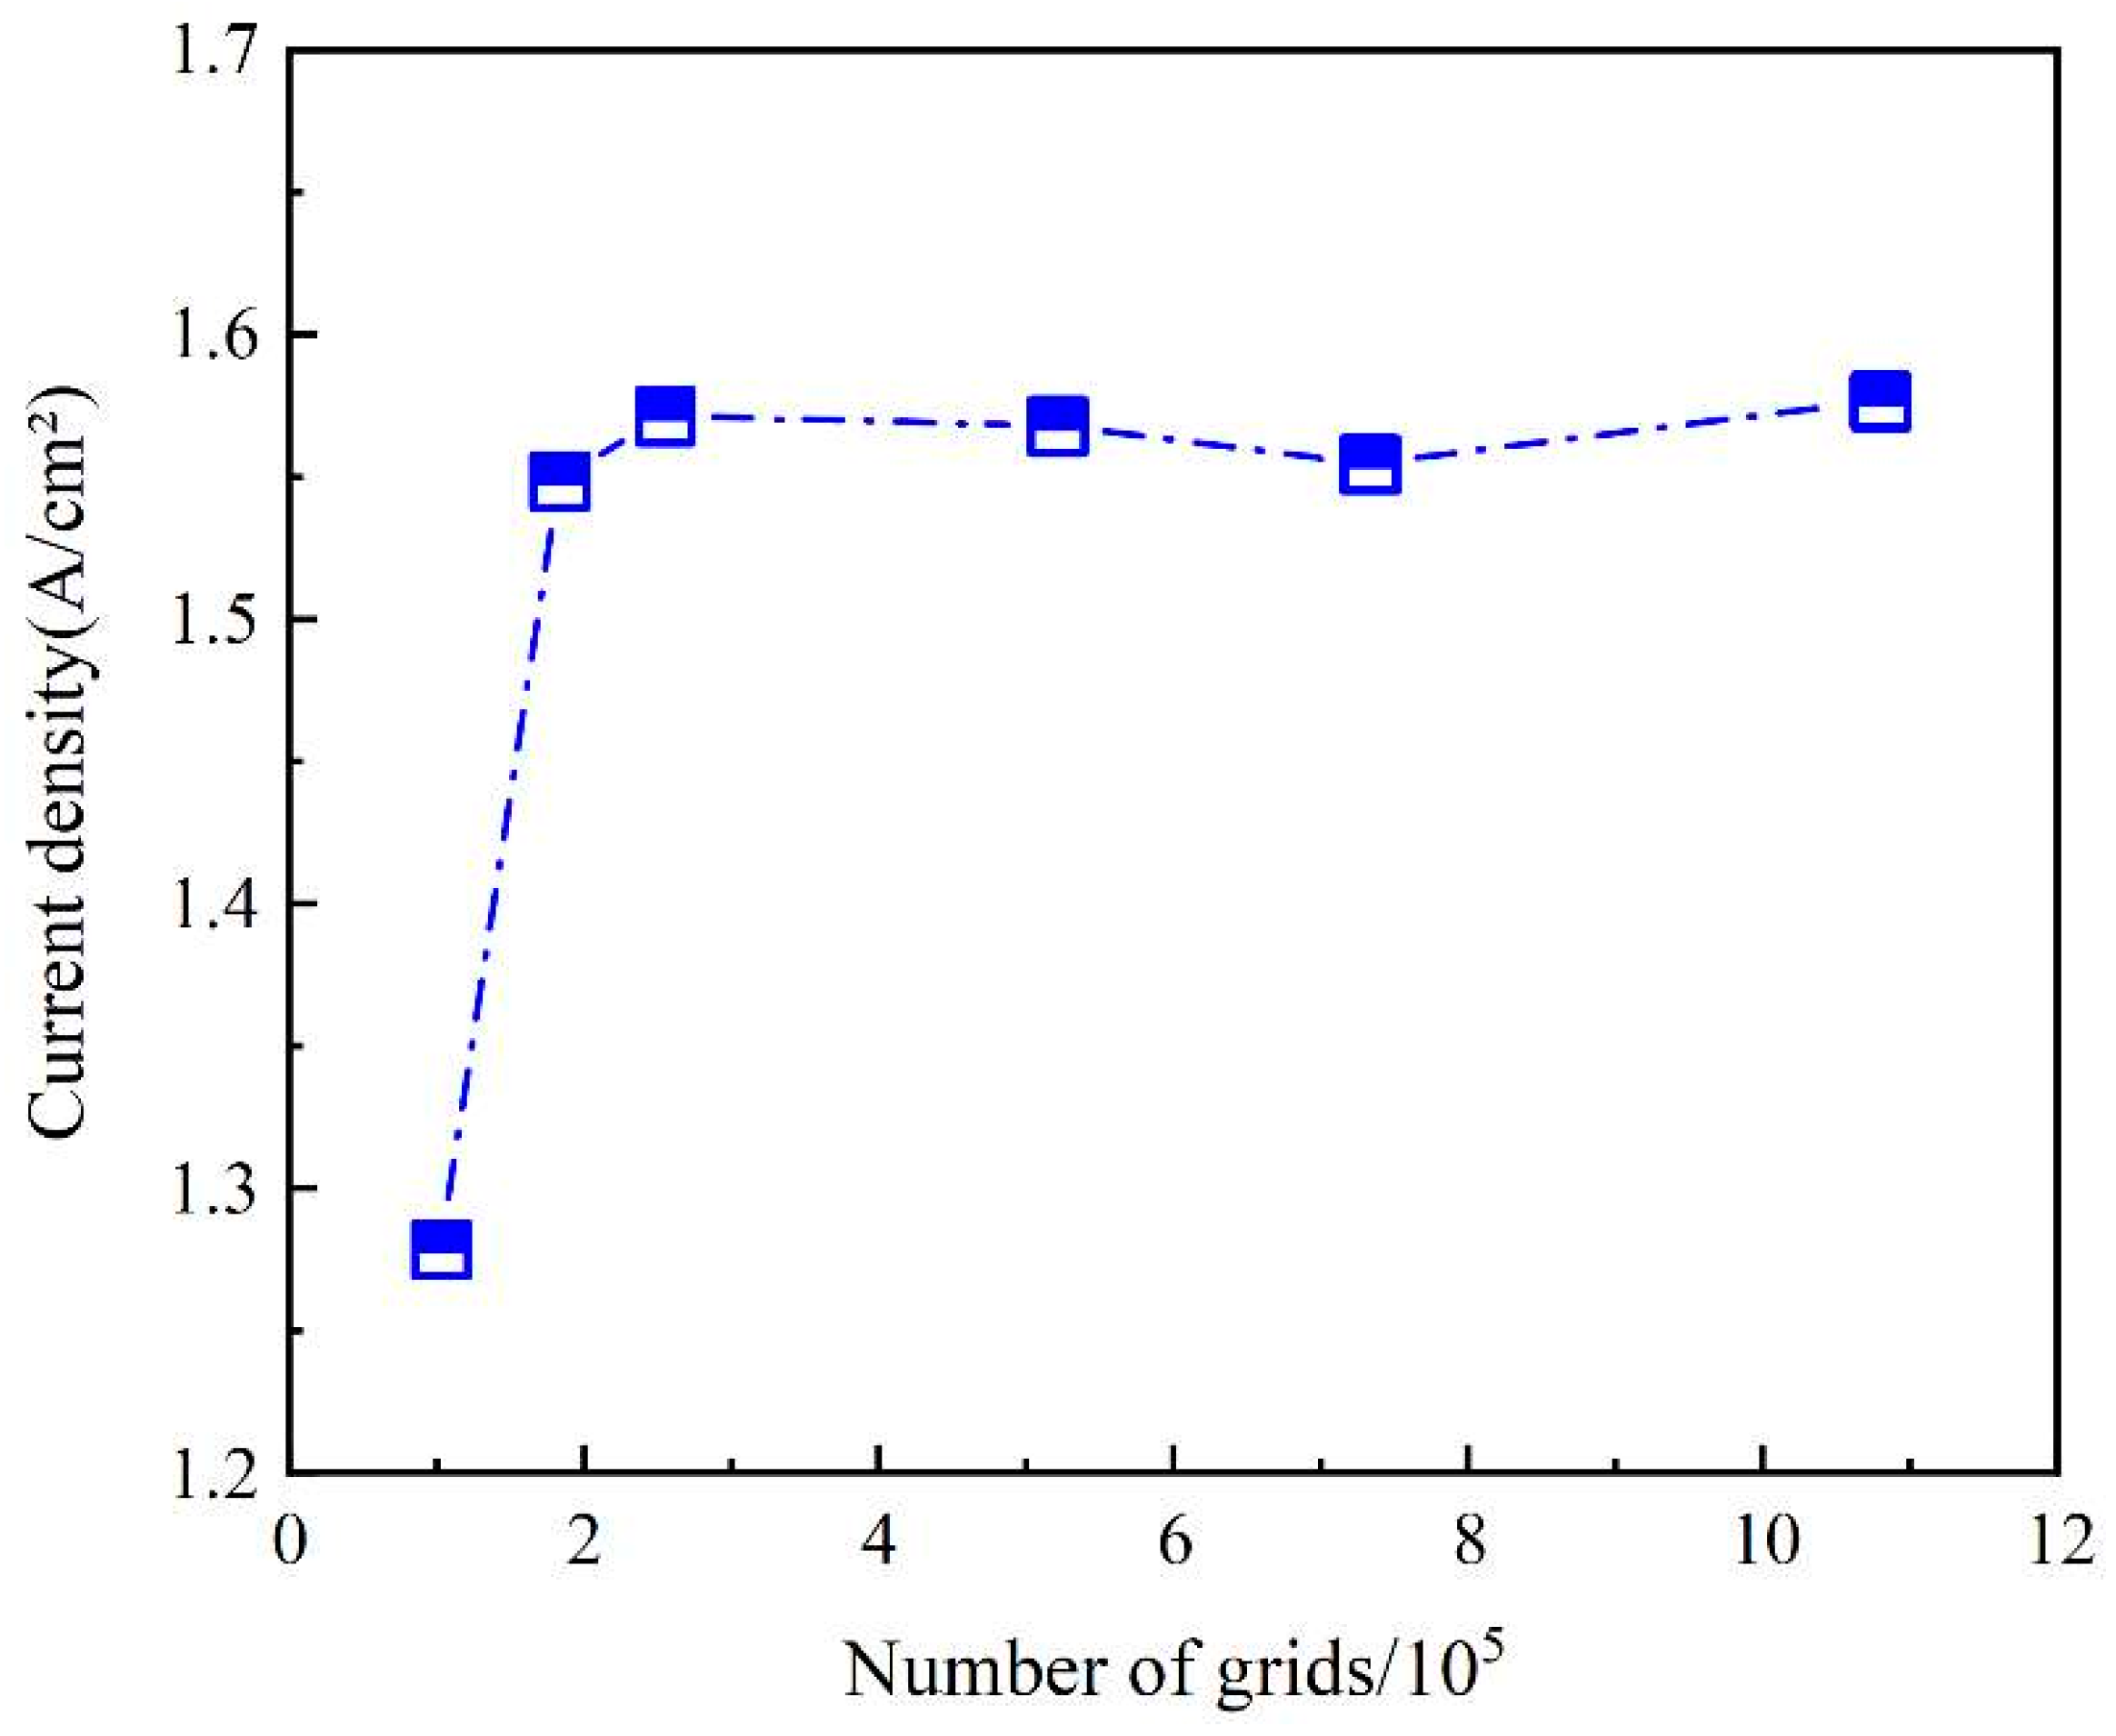
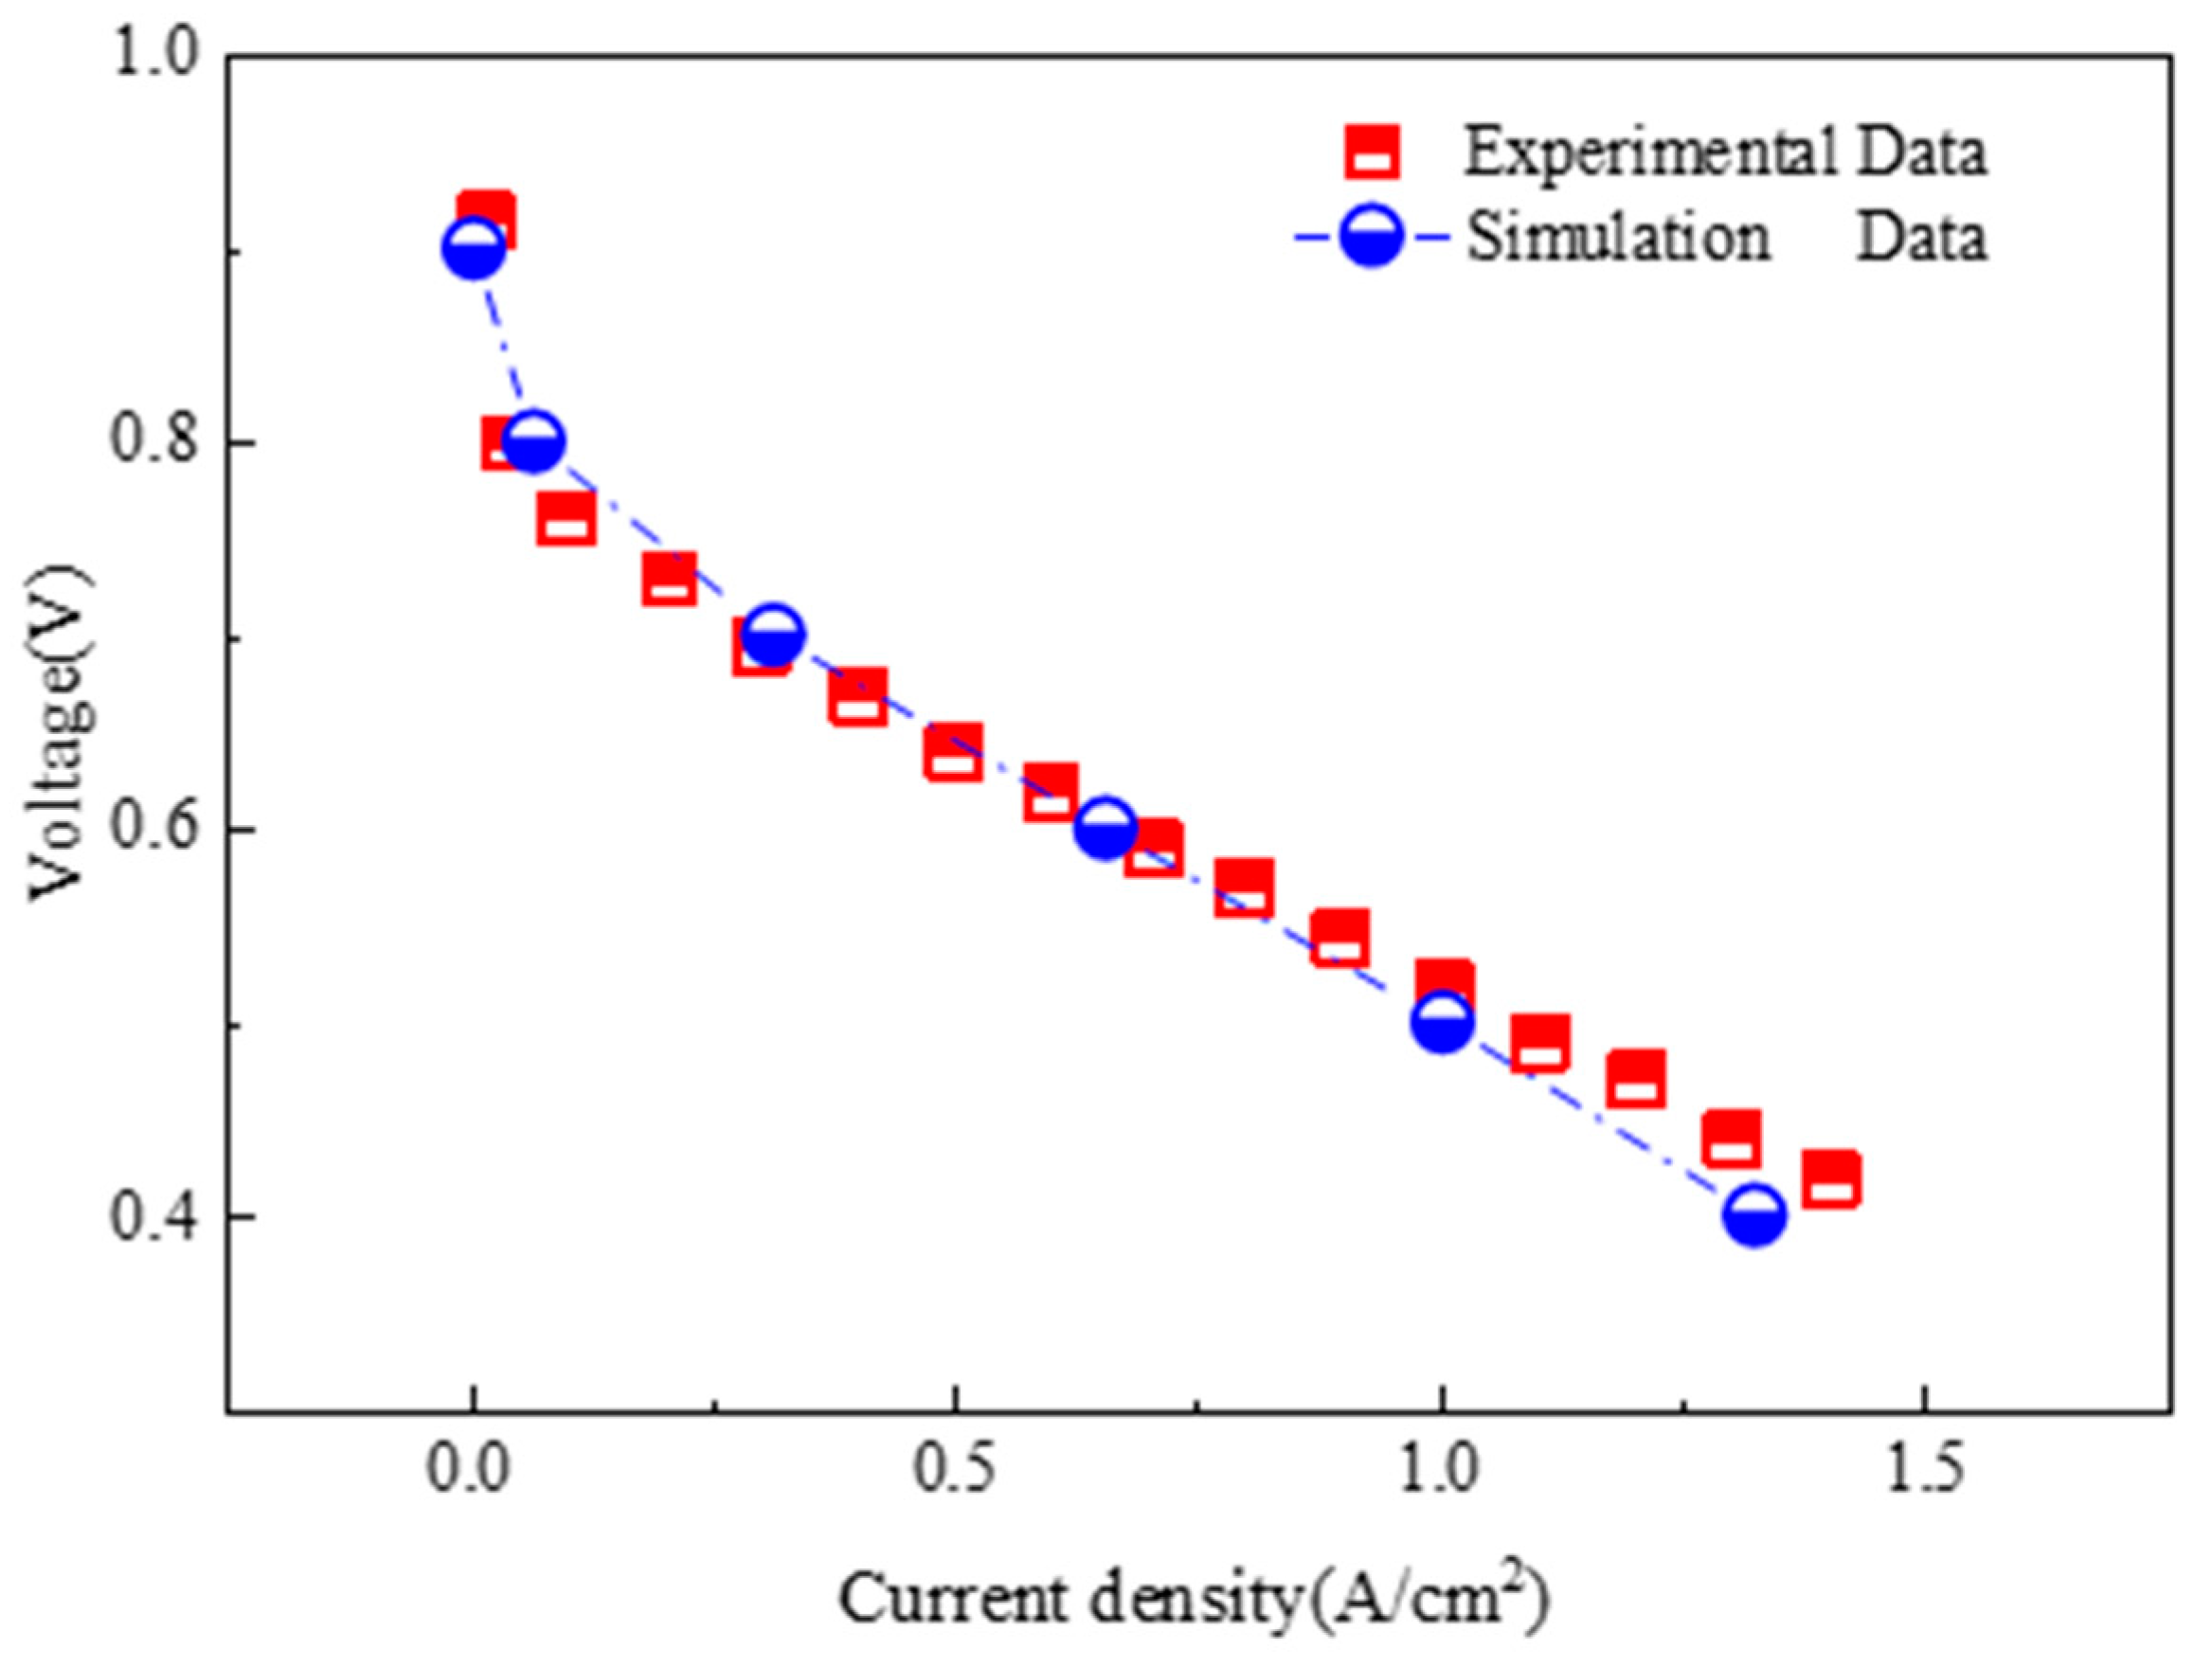
2.4. Simulation Model Validation

The current density of the proton exchange membrane fuel cell is important, so the calculation results of the simulation model are transformed into the current density of the studied simulation model. Figure 2 compares the current densities of six simulation models with different mesh numbers at 0.6 V. A comparison of the results shows that the cell tends to be stable with increasing number of grids. Considering the requirements of computational efficiency and accuracy, in this paper, the fifth grid is chosen, and the number of grids in the fifth simulation model is 730,000.
The accuracy verification of the simulation model is the key link in the simulation. The simulation results are compared with the experimental results reported by Freire et al. [32]. By comparing the current density and volt relationship curves of the two simulation models, it is found that the simulation model employed in this paper demonstrated a deviation of less than 10% when compared to the experimental measurements of the performance of the proton exchange membrane fuel cell. The data in Figure 3 present a comparison of the simulated data with the experimental data obtained from the literature. Since the error is within a reasonable range, the simulation model is chosen in this paper to perform simulation research.
The parameters presented in Table 2 are used in the numerical simulation. The physical parameters of the materials used are shown in Table 3. These parameters were derived from Liu H.J. [33], and are the basis for subsequent research and analysis.

3. Results and Discussion

Two kinds of heat conductivity were selected for the X-, Y- and Z-direction in the porous electrode, where the X-, Y- and Z-direction coincide with the width, length and height of the channel. These seven working conditions correspond to isotropic heat conduction. The heat conductivity in one direction is set to be 500 W/(m·K) or 1000 W/(m·K). In this paper, only one of these two heat conductivities is selected, in order to analyze the effect on temperature and membrane water carrying capacity by comparing the simulation results. According to the research of Balandia A et al. [34,35,36], the heat conductivity of suspended graphene at room temperature varies in the range of 1500–5000 W/(m·K). The results of our literature research show that, while 500 W/(m·K) is reasonable, the thermal conductivity of this material could reach 1000 W/(m·K) in the future, and the research being performed in this paper is more forward-looking.

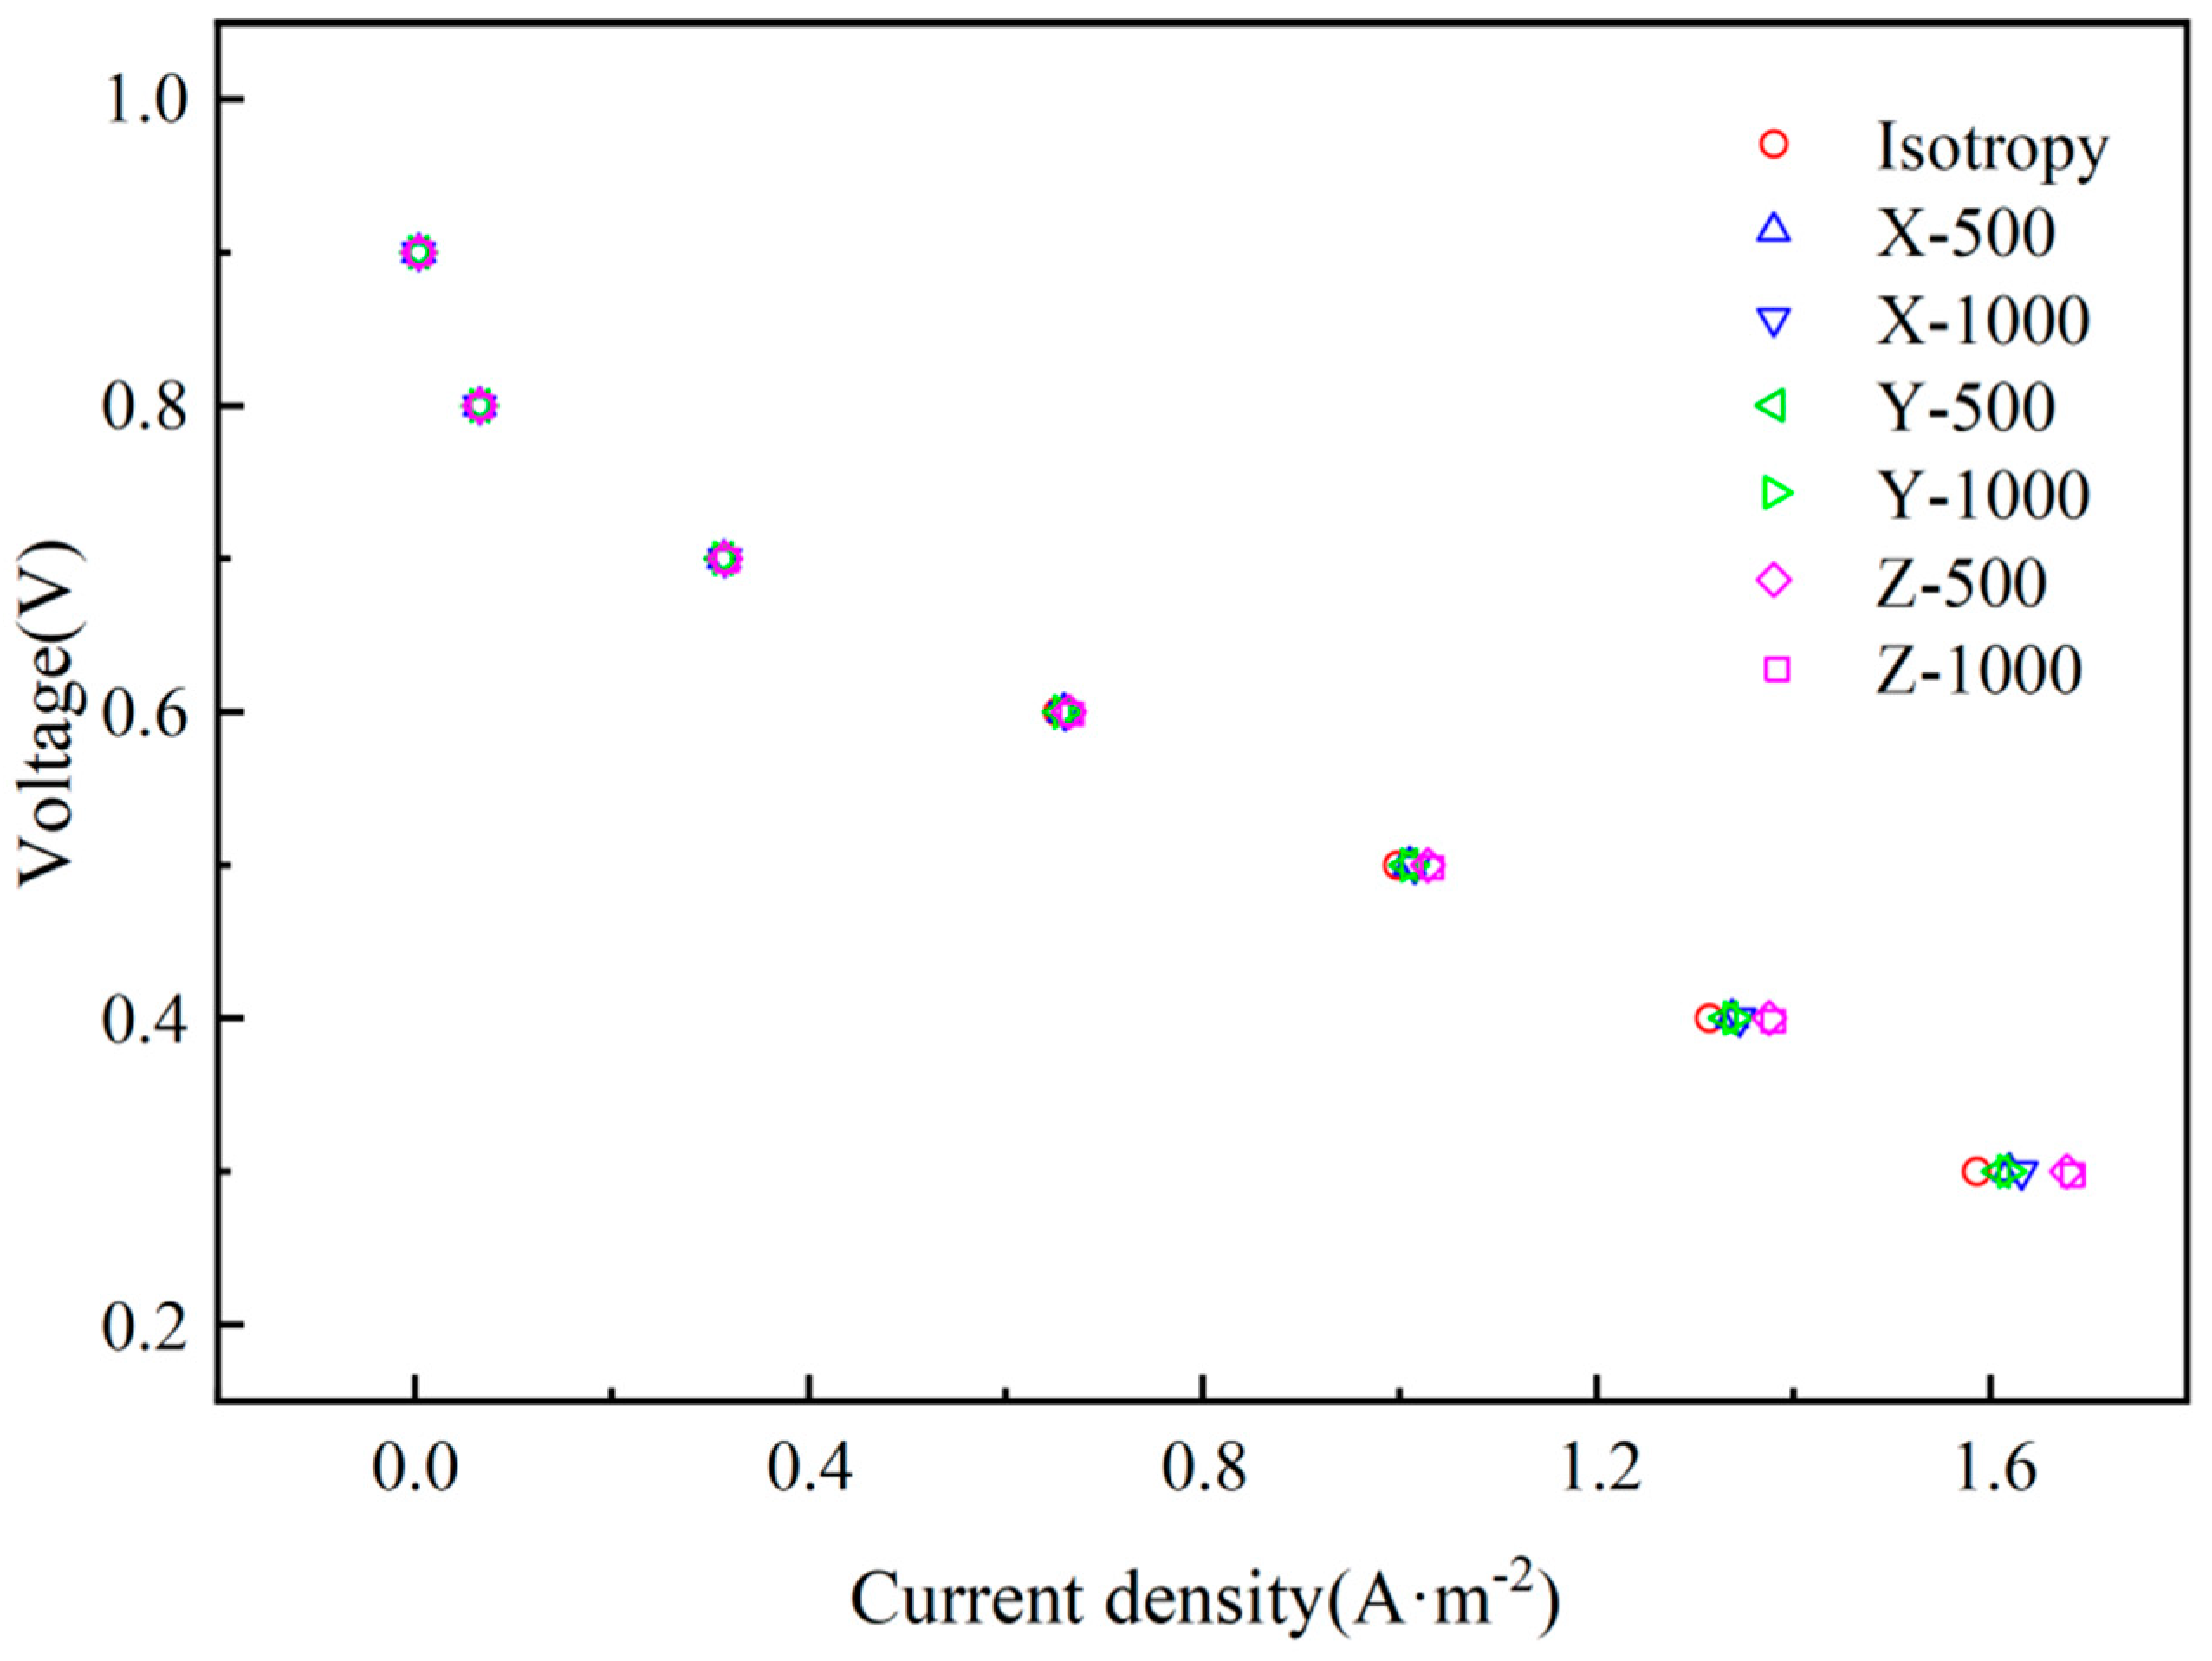
3.1. Cell Capability

Figure 4 shows a comparison of the performance curves of the proton exchange membrane fuel cell in three directions under seven heat conduction working condition scenarios. In Figure 4, when the cell output voltage is lower than 0.6 V, it can be seen that the non-isotropic heat conductivity simulation model with values of heat conductivity of 500 W/(m·K) and 1000 W/(m·K) along the Z-direction has the best capability, and the proton exchange membrane fuel cell capability is improved by 5.78% and 5.87%. When the cell output voltage is 0.3 V and the X-direction heat conductivity is 500 W/(m·K) and 1000 W/(m·K), the capability of proton exchange membrane fuel cell increases by 2.09% and 2.89%, respectively. When the cell output voltage is 0.3 V and the heat conductivity in the Y-direction is 500 W/(m·K) and 1000 W/(m·K), the performance of the proton exchange membrane fuel cell increases by 1.51% and 2.00%, respectively.
Comparing the results in Figure 4, it can be seen that the heat conductivity in the Z-direction plays the most important role in the capability of the proton exchange membrane fuel cell, while the heat conductivity in the X- and Y-direction has little effect on the capability of the proton exchange membrane fuel cell. The increase in heat conductivity in Z-direction causes the temperature distribution in the catalytic layer and the gas diffusion layer to be more uniform, and the heat generated by the catalytic layer reaction can be transferred out in time to ensure that the capability will decrease as a result of the high temperature of the catalytic layer. The heat conductivity in the X- and Y-direction only causes the temperature of the porous electrode on the XY plane of the proton exchange membrane fuel cell to be relatively uniform, and does not have much effect on its capability. By comparing the current density and voltage relationship curves of two different heat conductivity scenarios in the same direction, it can be seen that when the heat conductivity exceeds 500 W/(m·K), the increase in heat conductivity has no obvious effect on improving the capability of the proton exchange membrane fuel cell. This is because the thickness of the porous electrode is too small, the thickness of the catalytic layer is 5 × 10⁻⁵ m, and the thickness of the gas diffusion layer is 3 × 10⁻³ m. If the heat conductivity is too great, the effect will not be obvious, so there must be a range of different values of heat conductivity that are the most economical.

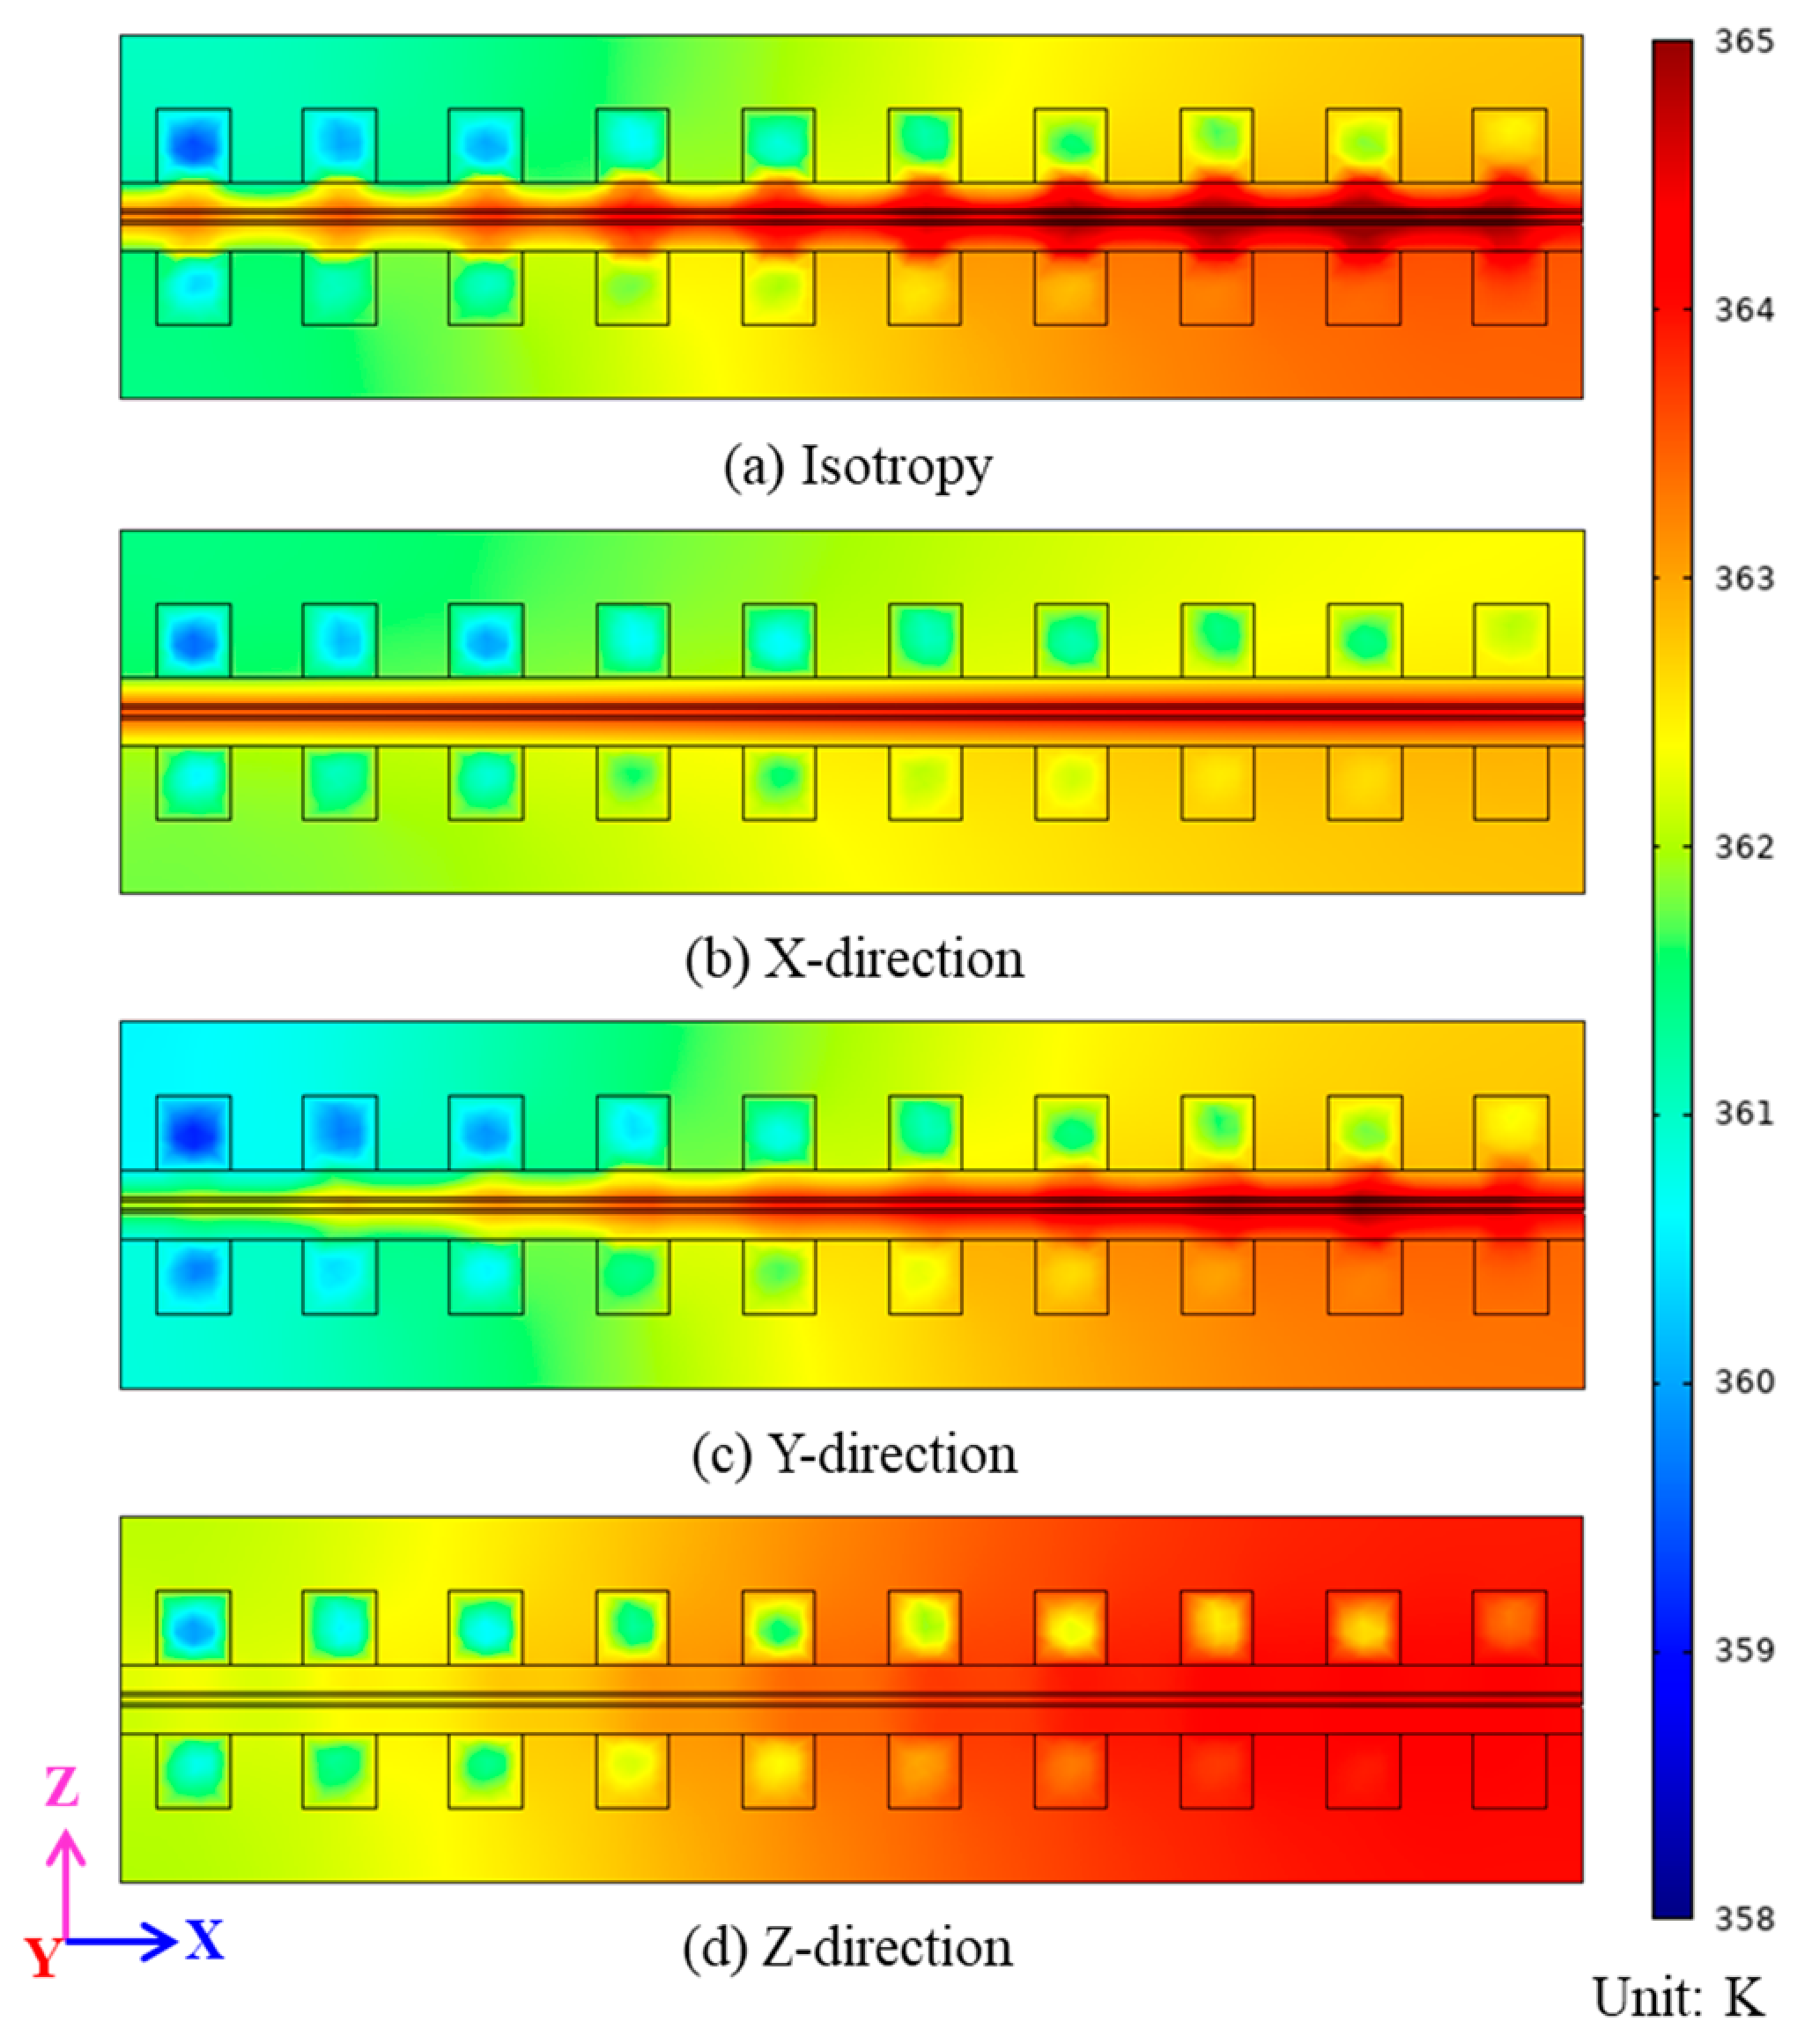
3.2. Temperature Distribution

A single cell has two catalytic layers, one is the Acatalytic layer and the other is the Ccatalytic layer, but the Ccatalytic layer is more important for proton exchange membrane fuel cells, so this section focuses on the Ccatalytic layer. Since the capability of the proton exchange membrane fuel cell is basically the same for values of heat conductivity of 500 W/(m·K) and 1000 W/(m·K), only heat conductivity of 500 W/(m·K) will be studied in the subsequent sections. Figure 5 shows the temperature distribution of the Ccatalytic layer for four thermal conductivity operating conditions when the operating temperature of the proton exchange membrane fuel cell is 353 K and the cell output volt is 0.3 V. In Figure 5a–d, the temperature maxima are 365.36 K, 364.14 K, 365.00 K and 364.15 K, and the temperature minima are 357.83 K, 360.69 K, 358.74 K and 353.04 K. The area in the blue box of Figure 5 is the maximum temperature area, and Figure 5a, i.e., isotropic heat conduction, exhibits a relatively uniform temperature distribution, and the proportion of the maximum temperature area is small, so it is not clearly marked. Figure 5b presents the case in which the heat conductivity is increased in the X-direction, from which it can be seen that when the heat conductivity increases in the X-direction, a clear temperature gradient along the Y-direction appears on the catalytic layer. Figure 5c shows the case in which the heat conductivity is increased in the Y-direction, from which it can be seen that when the heat conductivity is increased in the Y-direction, there is no obvious temperature gradient on the catalytic layer, and the cell temperature distribution is more uniform, and the maximum temperature is concentrated in the middle region of the catalytic layer.
The Y = 1 × 10⁻² m cross-section temperature distribution for the four settings of heat conductivity when the operating temperature of the proton exchange membrane fuel cell is 353 K and the cell output volt is 0.3 V is shown in Figure 6. The total length of the proton exchange membrane fuel cell along the Y-direction is 2 × 10⁻² m, so the Y = 1 × 10⁻¹ m cross-section is the central cross-section of the proton exchange membrane fuel cell. Figure 6a shows the case of isotropic heat conductivity, and the temperature distribution in this case is consistent with the research results of many authors [37,38], the temperature presents the highest temperature in the catalytic layer, and the temperature spreads outward from the highest region. Figure 6b shows the case in which the heat conductivity is increased in the X-direction, from which it can be seen that high temperature only appears inside the porous electrode, and the heat generated by the reaction does not diffuse to other components. Figure 6c shows the case in which the heat conductivity is increased in the Y-direction, from which it can be seen that when the heat conductivity is increased in the Y-direction, the heat diffuses in the X-direction, and the heat accumulates on the side of the proton exchange membrane fuel cell outlet. Figure 6d shows the case in which the heat conductivity is increased in the Z-direction.

3.3. Membrane Water Carrying Capacity Distribution

The proton exchange membrane, also known as the hydrogen ion exchange membrane, is an ion-selective membrane that provides channels for proton migration and transport, separates gas reactants, and blocks electrolytes in batteries. The proton exchange membrane is at the most central position of the membrane electrode. As a proton transfer carrier, it transfers the protons generated by the anode catalytic layer to the cathode catalytic layer and reacts with oxygen to form water. At the same time, the proton exchange membrane acts as a physical barrier separating the anode fuel from the cathode fuel to avoid direct contact between the two. In addition, the proton exchange membrane does not conduct electrons, forcing electrons to conduct through an external circuit to achieve the purpose of providing energy, and has the advantages of good heat resistance, high proton conductivity, and high mechanical strength [39,40,41].
Figure 7 shows the distribution of membrane water carrying capacity near the cathode side under four heat conductivity working conditions with a working temperature of the proton exchange membrane fuel cell of 353 K and a cell output volt of 0.3 V. In Figure 7a–d, the membrane water carrying capacity maxima are 15.17, 15.23, 15.51 and 16.04, and the temperature minima are 4.20, 4.21, 4.30 and 4.31. It is obvious from Figure 7 that the water carrying capacity of the proton exchange membrane increases the most when the heat conductivity of the porous electrode increases in the Z-direction. By comparing Figure 7a–d, it can be seen that when the heat conductivity increases in the X-, Y- and Z-direction, the water carrying capacity of the PEM increases to different degrees, and the water carrying capacity increases the most when the heat conductivity increases in the Z-direction, thus improving the performance of the proton exchange membrane fuel cell the most.

4. Conclusions

In this paper, a simulation model of a proton exchange membrane fuel cell was established according to our research needs. After verifying the accuracy of the simulation model, the influence of the heat conductivity of the non-isotropic porous electrode on the capability, temperature and membrane water carrying capacity of the proton exchange membrane fuel cell was studied by varying the value of heat conductivity along three axes. The conclusions of this paper can be summarized as follows:
(1)
When the cell output voltage of the proton exchange membrane fuel cell was 0.3 V, the heat conductivity of the porous electrode in the Z-direction had a greater impact on proton exchange membrane fuel cell performance compared to the other directions, and the heat conductivity in the X-direction and Y-direction had less influence on the performance of the proton exchange membrane fuel cell. When the heat conductivity in the Z-direction of the proton exchange membrane fuel cell was 500 W/(m·K) and 1000 W/(m·K), the proton exchange membrane fuel cell performance was improved by 5.78% and 5.87%; when the heat conductivity in the X-direction of the proton exchange membrane fuel cell was 500 W/(m·K) and 1000 W/(m·K), the proton exchange membrane fuel cell performance was improved by 2.09% and 2.89%; and when the heat conductivity in the Y-direction of the proton exchange membrane fuel cell was 500 W/(m·K) and 1000 W/(m·K), the proton exchange membrane fuel cell performance was improved by 1.51% and 2.00%. Since the thickness of the porous electrode was too thin, the improvement in capability decreased with increasing heat conductivity.
(2)
The heat conductivity in the Z-direction played the most important role in the temperature distribution in the proton exchange membrane fuel cell, and the Z-directional heat conductivity caused the temperature distribution of the proton exchange membrane fuel cell components to be more uniform. The heat conductivity in the X-direction and Y-direction had less influence on the temperature distribution.
(3)
The Z-direction heat conductivity increased the water carrying capacity of the thin film, which represented a significant increase in the high-water-carrying-capacity region, while X- and Y-direction heat conductivity had no significant effect on the water carrying capacity of the thin film. From the analysis presented here, it was found that the capability of the proton exchange membrane fuel cell was proportional to the membrane water carrying capacity.
According to this paper, the performance of the proton exchange membrane fuel cell was most affected by the heat conductivity of the porous electrode in the Z-direction, and current technology also is also able to realize the preparation of non-isotropic materials, so specially prepared non-isotropic heat-conductive porous electrodes can be considered for use in proton exchange membrane fuel cells.
The research in this paper still has great shortcomings. In the future, the most cost-effective point between heat conductivity and material production cost will be studied on the basis of the results in this paper in order to guide the production of anisotropic materials.

Author Contributions

Writing-original draft, L.Z.; Writing-review&editing, K.S.; Software, J.W.; Project administration, Z.C. All authors have read and agreed to the published version of the manuscript.

Funding

National Natural Science Foundation of China (No. 52074040).

Conflicts of Interest

The authors declare no conflict of interest.

Nomenclature

Aarea (m2)
cmolar concentration (mol·m−3)
Ddiffusion coefficient (m2·s−1)
FFaraday’s constant (C·mol−1)
hheat transfer coefficient (W·m−2·K−1)
Hheight (m)
irefreference exchange current density (A·m−2)
Icell current density (A·m−2)
kthermal conductivity (W·m−1·K−1)
maspmean absolute surface slope
Mmolar mass (kg·mol−1)
Mgasgas parameter (m)
Ppressure (Pa)
PH2Ovapor pressure (Pa)
PsatThe saturation pressure of water (Pa)
Runiversal gas constant (8.314 J·mol−1·K−1)
Ssource term of governing equations
ttime (s)
Ttemperature (K)
uvelocity vector (m·s−1)
Vpotential (V)
X, Y, Zcoordinate (m)
Xspecies mass fraction
α transfer coefficient
ε porosity
ζ stoichiometric flow ratio
η overpotential (V)
λ membrane water content
γ concentration index
μ viscosity (kg·m−1·s−1)
ρ density (kg·m−3)
σ electrical conductivity (S·m−1)
potential (V)
BPbipolar plate
CLcatalytic layer
GCgas channel
GDLgas diffusion layer
PEMproton exchange membrane
PEMFCproton exchange membrane fuel cell

References

  1. Chen, X.; Yu, Z.K.; Zhou, H.W.; Chen, Y.; Liu, Q.; Xu, J.H.; Gong, G.C.; Wan, Z.M. Study on wave parallel flow field of PEM fule cell. J. Eng. Thermophys. 2021, 42, 1021–1025. [Google Scholar]
  2. Liu, J.G.; Sun, G.Q. A survey of fuel cells. Physics 2004, 33, 79–84. [Google Scholar]
  3. Hou, M.; Yi, B.L. Progress and perspective of fuel cell technology. J. Electrochem. 2012, 18, 1–13. [Google Scholar]
  4. Liao, Z.H.; Wei, L.; Suo, Z.B.; Shi, W.Y.; Jiang, F.M. Amesoscopic Pore-Scale simulation model of Multi-Disciplinary coupling in proton exchange membrane fuel cell cathode side catalyst layer during cold start. Adv. New Renew. Enengy 2020, 8, 81–90. [Google Scholar]
  5. Kandlikar, S.G.; Lu, Z. Thermal management issues in a proton exchange membrane fuel cell stack—A brief review of current status. Appl. Therm. Eng. 2009, 29, 1276–1280. [Google Scholar] [CrossRef]
  6. Liu, L.N.; Zhang, R.Y.; Guo, L.Y. Numerical investigation on the nano/microscale transport processes in proton exchange membrane fuel cells: A review. Chin. Sci. Bull. 2021, 67, 2258–2276. (In Chinese) [Google Scholar] [CrossRef]
  7. Zhao, X.; Li, Y.; Liu, Z.; Li, Q.; Chen, W. Thermal management system simulation modeling of a water-cooled proton exchange membrane fuel cell. Int. J. Hydrog. Energy 2015, 40, 3048–3056. [Google Scholar] [CrossRef]
  8. Liu, F.L.; Xin, M.D. Simulation of flow and mass transfer characteristics in anode of proton exchange membrane fuel cell. J. Therm. Sci. Technol. 2015, 4, 233–236. [Google Scholar]
  9. Assari, P.; Dehghan, M. A meshless method for the numerical solution of nonlinear weakly singular integral equations using radial basis functions. Eur. Phys. J. Plus 2017, 132, 199. [Google Scholar] [CrossRef]
  10. Yildiz, M.A.; Botha, G.; Yuan, H.; Merzari, E.; Kurwitz, R.C.; Hassan, Y.A. Direct numerical simulation of the flow through a randomly packed pebble bed. J. Fluids Eng. 2020, 142, 041405. [Google Scholar] [CrossRef]
  11. Cao, T.F.; Lin, H.; He, Y.L.; Tao, W.Q. Numerical investigation of the non-isotropic transport process within proton exchange membrane fuel cell. J. Eng. Thermophys. 2012, 33, 1051–1055. [Google Scholar]
  12. Berning, T.; Djilali, N. Three-Dimensional Computational Analysis of Transport Phenomena in a proton exchange membrane fuel cell. J. Power Sources 2002, 106, 284–294. [Google Scholar] [CrossRef]
  13. Um, S.; Wang, C.Y. Three-dimensional analysis of transport and electrochemical reactions in polymer electrolyte fuel cells. J. Power Sources 2004, 125, 420–432. [Google Scholar] [CrossRef]
  14. Sivertsen, B.R.; Djilali, N. CFD-Based Simulation modelling of proton exchange membrane fuel cells. J. Power Sources 2005, 109, 65–78. [Google Scholar] [CrossRef]
  15. Sun, H.; Liu, H. proton exchange membrane fuel cell Capability and its Two-Phase Mass Transport. J. Power Sources 2005, 143, 125–135. [Google Scholar] [CrossRef]
  16. Ju, H.C.; Wang, C.Y.; Cleghorn, S.; Beuscher, U. Non-isothermal simulation modelling of polymer electrolyte fuel cells II. Parametric study of low-humidity. J. Electrochem. Soc. 2006, 153, A249–A254. [Google Scholar] [CrossRef]
  17. Jang, J.H.; Yan, W.M.; Li, H.Y. Three-dimensional numerical study on cell capability and transport phenomena of proton exchange membrane fuel cells with convention n al flow fields. J. Hydrog. Energy 2008, 33, 156–164. [Google Scholar] [CrossRef]
  18. Liu, X.; Lou, G.; Wen, Z. Three-dimensional two-phase flow simulation model of proton exchange membrane fuel cell with parallel gas distribution. J. Power Sources 2010, 195, 2764–2773. [Google Scholar] [CrossRef]
  19. Shang, K.; Han, C.; Jiang, T.; Chen, Z.Q. Numerical study of proton exchange membrane fuel cell heat and mass transfer characteristics based on roughness interface thermal resistance simulation model. Int. J. Hydrog. Energy 2022, 48, 7460–7475. [Google Scholar] [CrossRef]
  20. Nam, J.H.; Kaviany, M. Effective diffusivity and water saturation distribution in single and two layer proton exchange membrane fuel cell diffusion medium. Int. J. Heat Mass Transf. 2003, 46, 4595–4611. [Google Scholar] [CrossRef]
  21. Pasaogullari, U.; Mukherjee, P.P.; Wang, C.Y. Anisotropic heat and water transport in a PEFC cathode side gas diffusion layer. J. Electrochem. Soc. 2007, 154, B823–B834. [Google Scholar] [CrossRef]
  22. Pharoah, J.G.; Karan, K.; Sun, W. On effective transport coefficients in proton exchange membrane fuel cell electrodes: Anisotropy of the porous transport layers. J. Power Sources 2006, 161, 214–224. [Google Scholar] [CrossRef]
  23. He, G.; Yamazaki, Y.; Abudula, A. A three-dimensional analysis of the effect of anisotropy gas diffusion layer(gas diffusion layer) heat conductivity on the heat transfer and two-phase behavior in a proton exchange membrane fuel cell. J. Power Sources 2010, 195, 1551–1560. [Google Scholar] [CrossRef]
  24. Han, C.; Jiang, T.; Shang, K.; Xu, B.; Chen, Z.Q. Heat and mass transfer capability of proton exchange membrane fuel cells with electrode of non-isotropic heat conductivity. Int. J. Heat Mass Transf. 2021, 182, 121957. [Google Scholar] [CrossRef]
  25. Sandip, S.; Ganguly, S.; Biswas, G. Buoyancy driven convection of nanofluids in an infinitely long channel under the effect of a magnetic field. Int. J. Heat Mass Transf. 2014, 71, 328–340. [Google Scholar]
  26. Sandip, S.; Suvankar, G.; Pradip, D. Thermofluidic characteristics of combined electroosmotic and pressure driven flows in narrow confinements in presence of spatially non-uniform magnetic field. Int. J. Heat Mass Transf. 2017, 104, 1325–1340. [Google Scholar]
  27. Sandip, S.; Suvankar, G.; Manoranjan, M. Single diffusive magnetohydrodynamic pressure driven miscible displacement flows in a channel. Phys. Fluid 2019, 31, 082102. [Google Scholar]
  28. Chatterjee, D.; Biswas, N.; Manna, N.K.; Sarkar, S. Effect of discrete heating-cooling on magneto-thermal-hybrid nanofluidic convection in cylindrical system. Int. J. Mech. Sci. 2023, 238, 107852. [Google Scholar] [CrossRef]
  29. Bock, R.; Karoliussen, H.; Pollet, B.G.; Secanell, M.; Seland, F.; Stanier, D.; Burheim, O.S. The influence of graphitization on the heat conductivity of catalyst layers and temperature gradients in proton exchange membrane fuel cells. Int. J. Hydrog. Energy 2020, 45, 1335–1342. [Google Scholar] [CrossRef]
  30. Burheim, O.S. Review: Proton exchange membrane fuel cell Materials’ Heat conductivity and influence on Internal Temperature Profiles. Polym. Electrolyte Fuel Cells 2017, 80, 509–525. [Google Scholar]
  31. Chen, S.Z.; Xia, Z.X.; Wang, Y.C.; Zhang, X.Y.; Wu, Y.H. Numerical simulation of influencing factors on capability of proton exchange membrane fuel cell with serpentine flow field. Chin. J. Power Sources 2017, 41, 230–233. [Google Scholar]
  32. Luciana, L.S.; Antolini, E.; Linardi, M.; Santiago, E.I.; Passos, R.R. Influence of operational parameters on the capability of proton exchange membrane fuel cells with serpentine flow field channels having different (rectangular and trapezoidal) cross-section shape. Int. J. Hydrog. Energy 2014, 39, 12052–12060. [Google Scholar]
  33. Liu, H.J.; Zhang, G.D.; Li, D. Three-dimensional multi-phase simulation of cooling patterns for proton exchange membrane fuel cell based on a modified Bruggeman equation. Appl. Therm. Eng. 2020, 174, 115313. [Google Scholar] [CrossRef]
  34. Balandin, A.A.; Ghosh, S.; Bao, W.Z. Superior thermal conductivity of single-layer graphene. Nano Lett. 2008, 8, 902–907. [Google Scholar] [CrossRef]
  35. Lee, J.U.; Yoon, D.; Kim, H. Thermal conductivity of suspended pristine graphene measured by Raman spectroscopy. Phys. Rev. B 2011, 83, 081419. [Google Scholar] [CrossRef] [Green Version]
  36. Chen, S.S.; Moore, A.L.; Cai, W.W. Raman measurements of thermal transport in suspended monolayer graphene of variable sizes in vacuum and gaseous environments. ACS Nano 2011, 5, 321–328. [Google Scholar] [CrossRef]
  37. Ye, K.; Li, J.; Qu, D.W.; Yu, F. Effects of external supply parameters on the output capability and hydrothermal balance of proton exchange membrane fuel cell. Renesable Energy Resour. 2021, 39, 19–24. [Google Scholar]
  38. Sun, S.M.; Sun, T.H.; Qin, H.L. Numerical simulation of temperature field of proton exchange membrane fuel cell. J. Jilin Univ. Archit. 2016, 33, 55–58. [Google Scholar]
  39. Xing, L.; Shi, W.D.; Su, H.N.; Xu, Q.; Das, P.K.; Mao, B.D. Membrane electrode assemlies for proton exchange membrane fuel cells: A review of functional graded design and optimization. Energy 2019, 177, 445–464. [Google Scholar] [CrossRef]
  40. Kim, D.J.; Jo, M.J.; Nam, S.Y. A review of polymer-nanocomposite electrolyte membranes for fuel cell application. J. Ind. Eng. Chem. 2015, 21, 36–52. [Google Scholar] [CrossRef]
  41. Mustain, W.E.; Chatenet, M.; Page, M.; Kim, Y.S. Durability challenges of anion exchange membrane fuel cells. Energy Environ. Sci. 2020, 13, 2805–2838. [Google Scholar] [CrossRef]
Figure 1. Schematic diagram of the proton exchange membrane fuel cell simulation model.
Processes 11 01713 g001
Figure 2. Grid verification.
Processes 11 01713 g002
Figure 3. Comparison of experimental datas and simulation datas [27].
Processes 11 01713 g003
Figure 4. The current density and voltage relationship curve under seven different heat conductivity scenarios.
Processes 11 01713 g004
Figure 5. Comparison of temperature distribution of the Ccatalytic layer: (a) isotropy; (b) X-direction; (c) Y-direction; (d) Z-direction.
Processes 11 01713 g005
Figure 6. Y = 1 × 10⁻² m cross-section temperature distribution nephogram: (a) isotropy; (b) X-direction; (c) Y-direction; (d) Z-direction.
Processes 11 01713 g006
Figure 7. Comparison of water carrying capacity and distribution on proton exchange membrane: (a) isotropy; (b) X-direction; (c) Y-direction; (d) Z-direction.
Processes 11 01713 g007
Table 1. Geometric parameters of the simulation model.
Height (m)Width (m)Length (m)
PEM1 × 10−42 × 10−22 × 10−2
CL5 × 10−52 × 10−22 × 10−2
GDL3.8 × 10−42 × 10−22 × 10−2
GC1 × 10−31 × 10−31.9 × 10−2
BP2 × 10−32 × 10−22 × 10−2
Table 2. Basic parameters.
ParameterValue
Operating temperature353 K
Porosity of Acatalytic layer and Ccatalytic layer0.3
Permeability of Acatalytic layer and Ccatalytic layer2.36 × 10−12 m2
Porosity of gas diffusion layer0.5
Permeability of gas diffusion layer1.18 × 10−11 m2
Density of current exchange on the cathode side 1 × 10⁻³ A·m−2
Density of current exchange on the anode side1 × 102 A·m−2
Relative humidity of gas100%
Active specific surface area of catalytic layer1 × 107 m−1
Anode hydrogen measurement number4.8
Cathode-side air measurement number8
Inlet pressure1 atm
Table 3. Physical parameters of material.
c p ρ σ s k
J·kg−1·K−1kg·m−3S·m−1W/(m·K)
BP691188083,00085.5
GDL71044010001.6
CL710201010008
PEM200019801 × 10−162
Disclaimer/Publisher’s Note: The statements, opinions and data contained in all publications are solely those of the individual author(s) and contributor(s) and not of MDPI and/or the editor(s). MDPI and/or the editor(s) disclaim responsibility for any injury to people or property resulting from any ideas, methods, instructions or products referred to in the content.

