Abstract
Once a chemical production accident occurs in a chemical plant, it often causes serious economic losses, casualties, and environmental damage. Statistics show that many major accidents in the production and storage of chemicals are mainly caused by human factors. This article considers the influence of the human factor and proposes a quantitative analysis model of a chemical plant based on a Bayesian network. The model takes into account the main human factors in seven aspects: organization, information, job design, human system interface, task environment, workplace design, and operator characteristics. The Bayesian network modeling method and simulation were used to predict the safety quantitative value and safety level of the chemical plant. Using this model, we can quickly calculate the safe quantitative ratio of each factor in the chemical plant. Through the safety quantitative value, safety level, and sensitivity analysis, the safety hazards of chemical companies can be discovered. Immediate improvements of potential safety hazards in chemical plants are very effective in preventing major safety accidents. This model provides an effective method for chemical park managers to monitor and manage chemical plants based on quantitative safety data.
1. Introduction
The chemical industry is an important basic industry of the national economy and has made outstanding contributions to the economic development of various countries. Due to the complicated processes within the chemical industry, the materials themselves are dangerous, and there are high (low)-temperature, high-pressure, flammable, explosive, and corrosive working environments, which make it a potentially dangerous industry. In the event of a safety production accident, serious economic losses, casualties, and environmental damage often occur. However, in the past two decades, with the development of society and the advancement of science and technology, the number of major accidents has gradually decreased; however, when the cause is a chemical accident, the cost is still high. Therefore, reducing the accident rate of chemical plants has always been the direction of the chemical industry.
At present, the production technology of the chemical industry has been updated, but many major accidents are mainly caused by human factors. The latest statistics show that in the process of chemical production and storage, the proportion of industrial accidents caused by human factors is more than 60% [1,2,3]. With the continuous improvement and innovation of equipment and technology, the relative number of accidents caused by equipment and technical failures is decreasing. Much of the work on human factors has focused on the symptoms of human error rather than the root cause, which can be explained by the uncertainty that constitutes human error [3]. In the analysis of accident investigations, people often attribute accidents to human error, and they think that human error is due to the frontline operator not performing the operation correctly or ignoring the operation. However, most accident causes are indirectly related to other human factors, such as organization, design, and management. After all, in most systems today, it is impossible to confirm that an accident was caused by a single human.
The literature shows that a lot of work has been conducted on the human factor, but it focuses on the unsafe behavior of frontline operators. The first-generation human reliability assessment (HRA) methods are mainly performance models of people, typical for the technique for human error-rate prediction (THERP) [4], the human error assessment and reduction technique (HEART) [5], human cognitive reliability (HCR) [6], and so on. The typical second-generation HRA methods are the cognitive reliability and error analysis method (CREAM) [7], A Technique for Human Event Analysis (ATHEANA) [8], etc. The typical third-generation methods are the Cognitive Environment Simulation (CES) [9], the Information, Decision, and Action in Crew (IDAC) context [10], etc. In recent years, more and more accident investigations have shown that the root cause of accidents is often indirectly related to the organization, design, and management of human factors.
Over the past decade, with the development of safety risk assessment methods, some methods have guided and supported industrial operators to assess and manage safety risks. Among them, it is worth re-examining the safety risk assessment methods proposed by the American Petroleum Institute (API) [11], the American Chemical Engineering Research Institute [12], the Sandia National Laboratory [13], and the National Institute of Justice [14]. These methods allow for a qualitative or semi-quantitative (e.g., in the case of API methods) safety risk assessment; thus, only the general guidance for safety risk mitigation and the list of possible solutions for safety countermeasures depend on existing safety [15]. In the quantitative assessment of chemical plant safety, other studies are also increasing. Valerie de Dianous et al. [16] studied the consequences and causes of the various types of accidents faced by enterprises in the chemical industry, with an emphasis on the use of bow structure diagrams. Christian Delvosalle et al. carefully analyzed the possible accident scenarios of major hazards [17]. Bahman proposed a new method that predicts and evaluates the possible impact of an industry’s accidents in a process unit of other process units [18]. The Australian National Environmental Protection Committee provided a method for assessing site pollution and proposed a combination of qualitative and quantitative methods [19]. The EU Joint Research Centre launched the Accidental Risk Assessment Methodology for Industries (ARAMIS) project in 2002 and provided a comprehensive evaluation methodology as part of the project [17,20,21]. However, these methods are mainly relatively static and are mostly used in chemical park planning; even if there are a few studies with dynamic and quantitative aspects, the factors of consideration are limited, and there are limited studies on personnel factors.
A Bayesian network is an important method for chemical plant safety assessment, and it is widely used in various fields. Khakzad et al. presented an application of bow and Bayesian network methods for a quantitative risk analysis of drilling operations [22]. Francesca Argenti et al. proposed a vulnerability assessment method for vandalism using Bayesian network-based chemical facilities [23]. Majeed Abimbola et al. applied Bayesian networks to manage the safety and risk analysis of pressure drilling operations [24]. Susana Garcia-Herrero et al. used Bayesian networks to analyze the relationship between working conditions, psychological/physical symptoms, and occupational accidents [25]. Esmaeil Zarei et al. proposed a model for the dynamic safety assessment of natural gas stations using Bayesian networks [26]. Faisal Aqlan et al. performed a system dynamic security analysis by mapping the bow to a Bayesian network [27]. J.M. FMatias et al. compared the Bayesian network method with other expert systems (classification tree, SVM support vector machine, and ELM extreme learning machine) in terms of risk prediction, and, through the process of building a Bayesian network model, the variables, data collection, coding, and risk prevention mechanisms can be better defined [28]. Eunchang Lee et al. proposed a Bayesian belief network for the risk management of large-scale engineering projects, after identifying key risk factors, by using the Bayesian network to establish a process for risk assessment [29]. Although the Bayesian method is widely used for most aspects, it is still relatively rare in the quantitative analysis of safety in chemical plants.
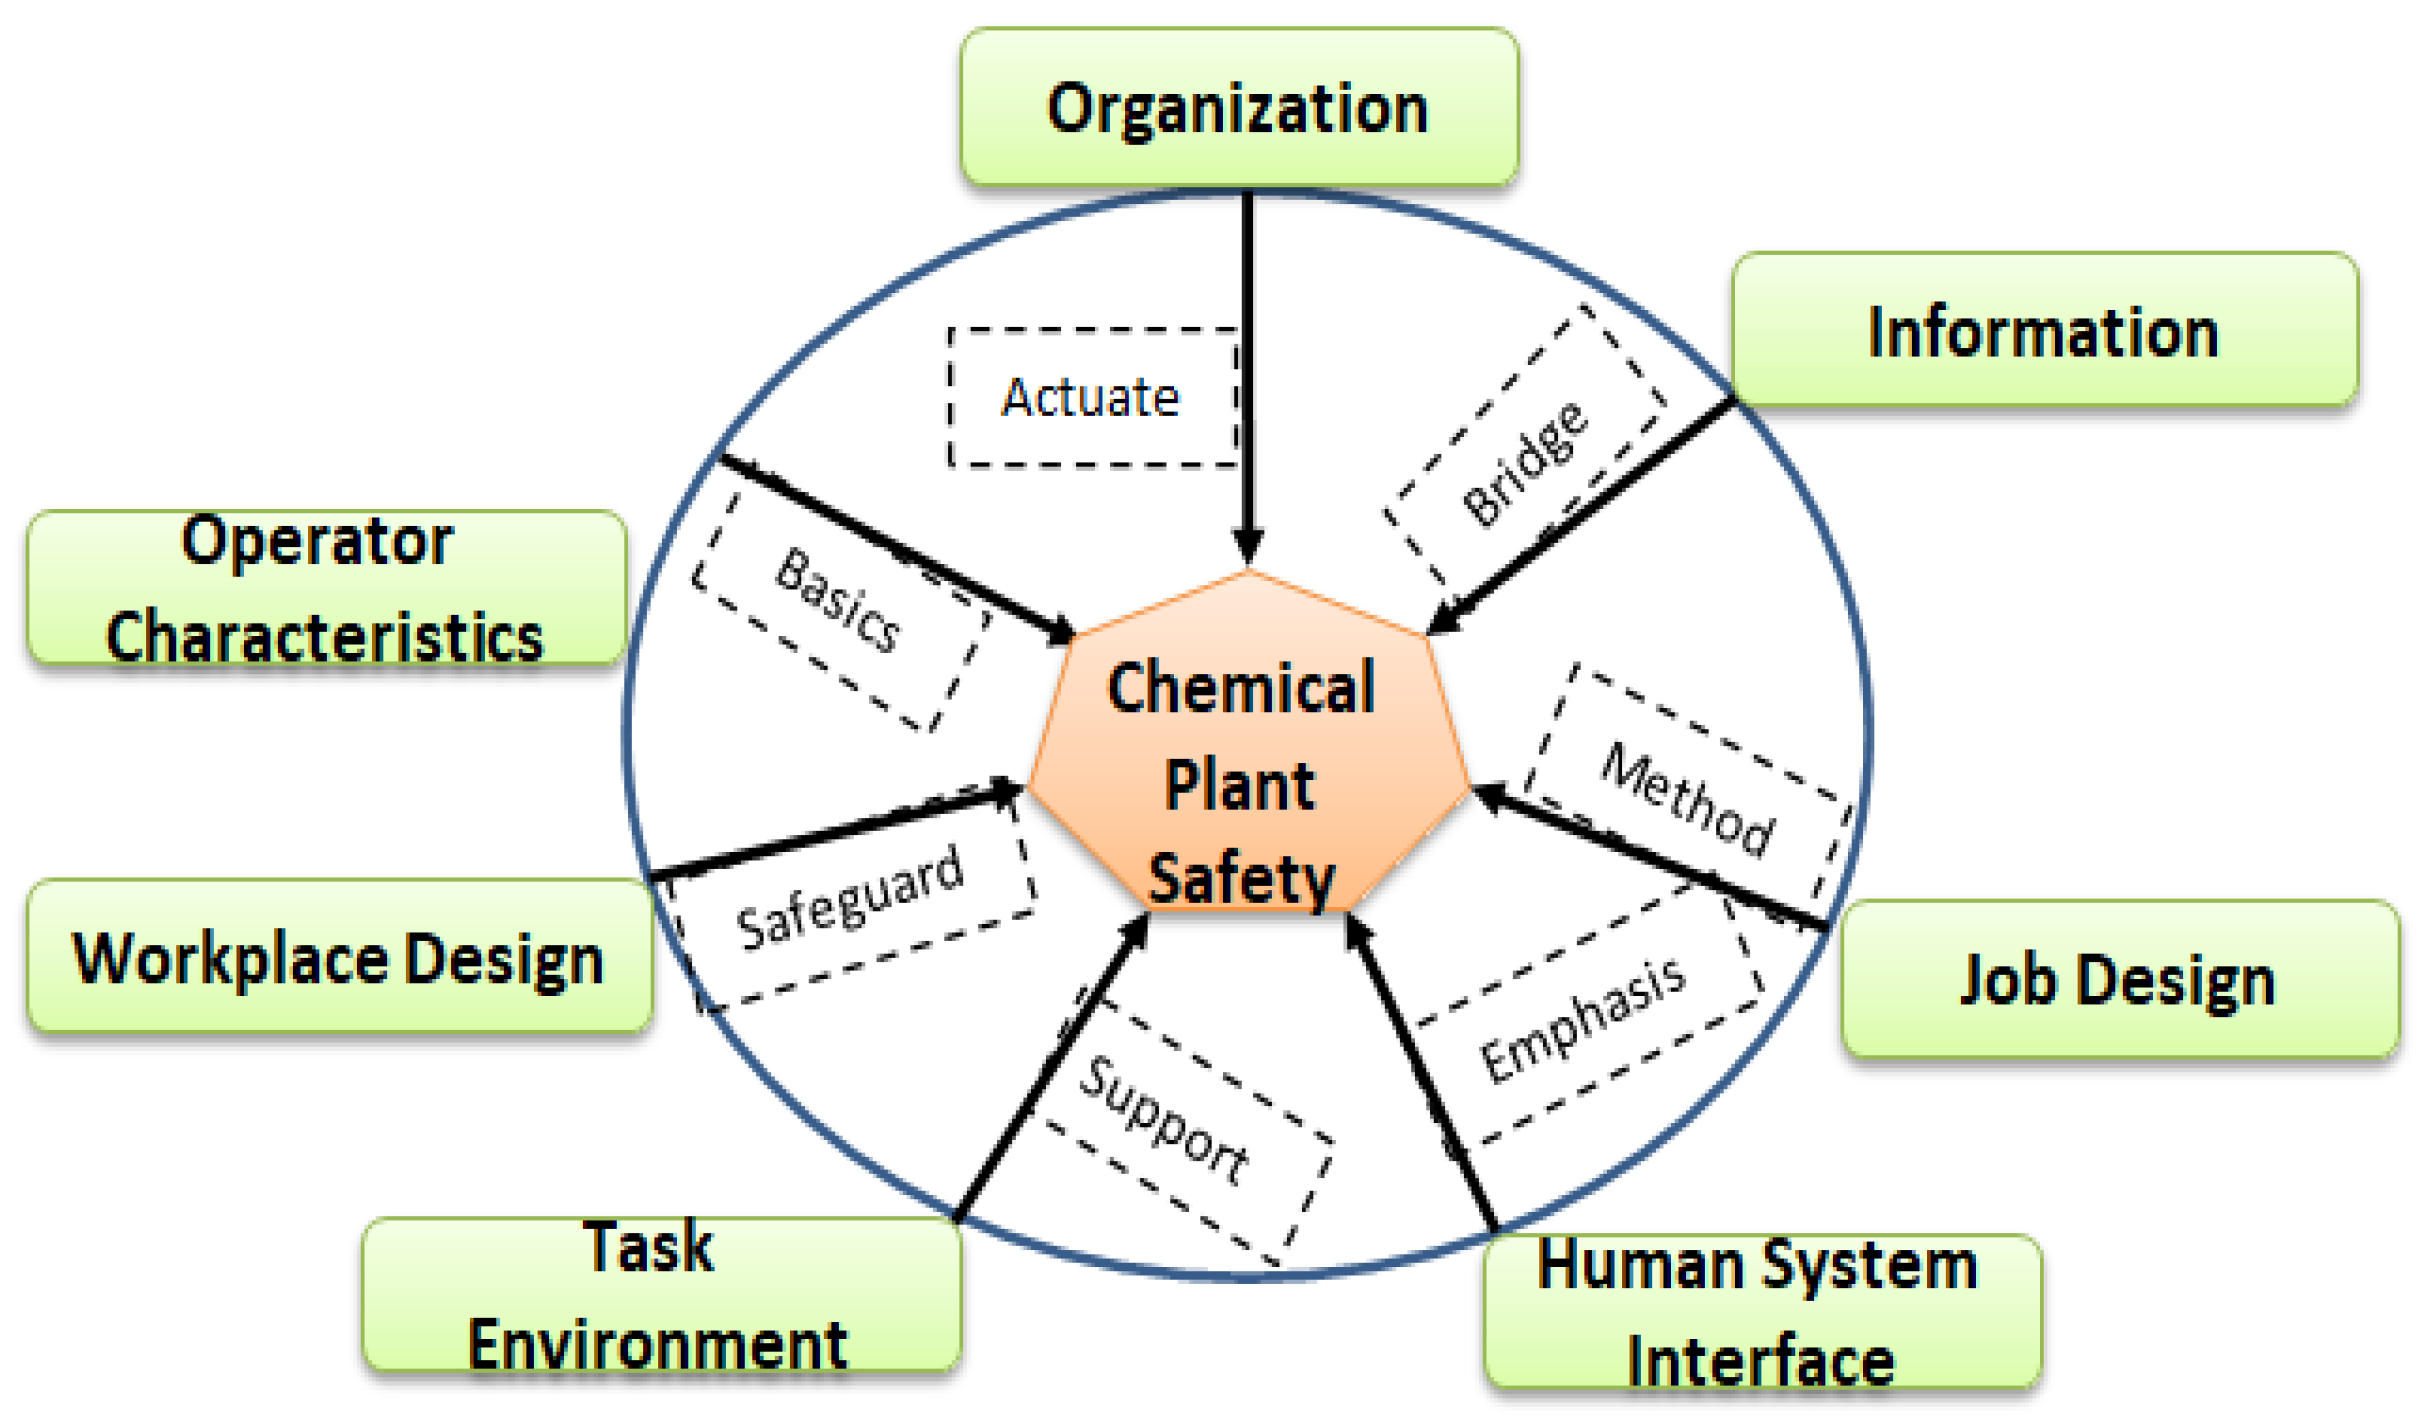
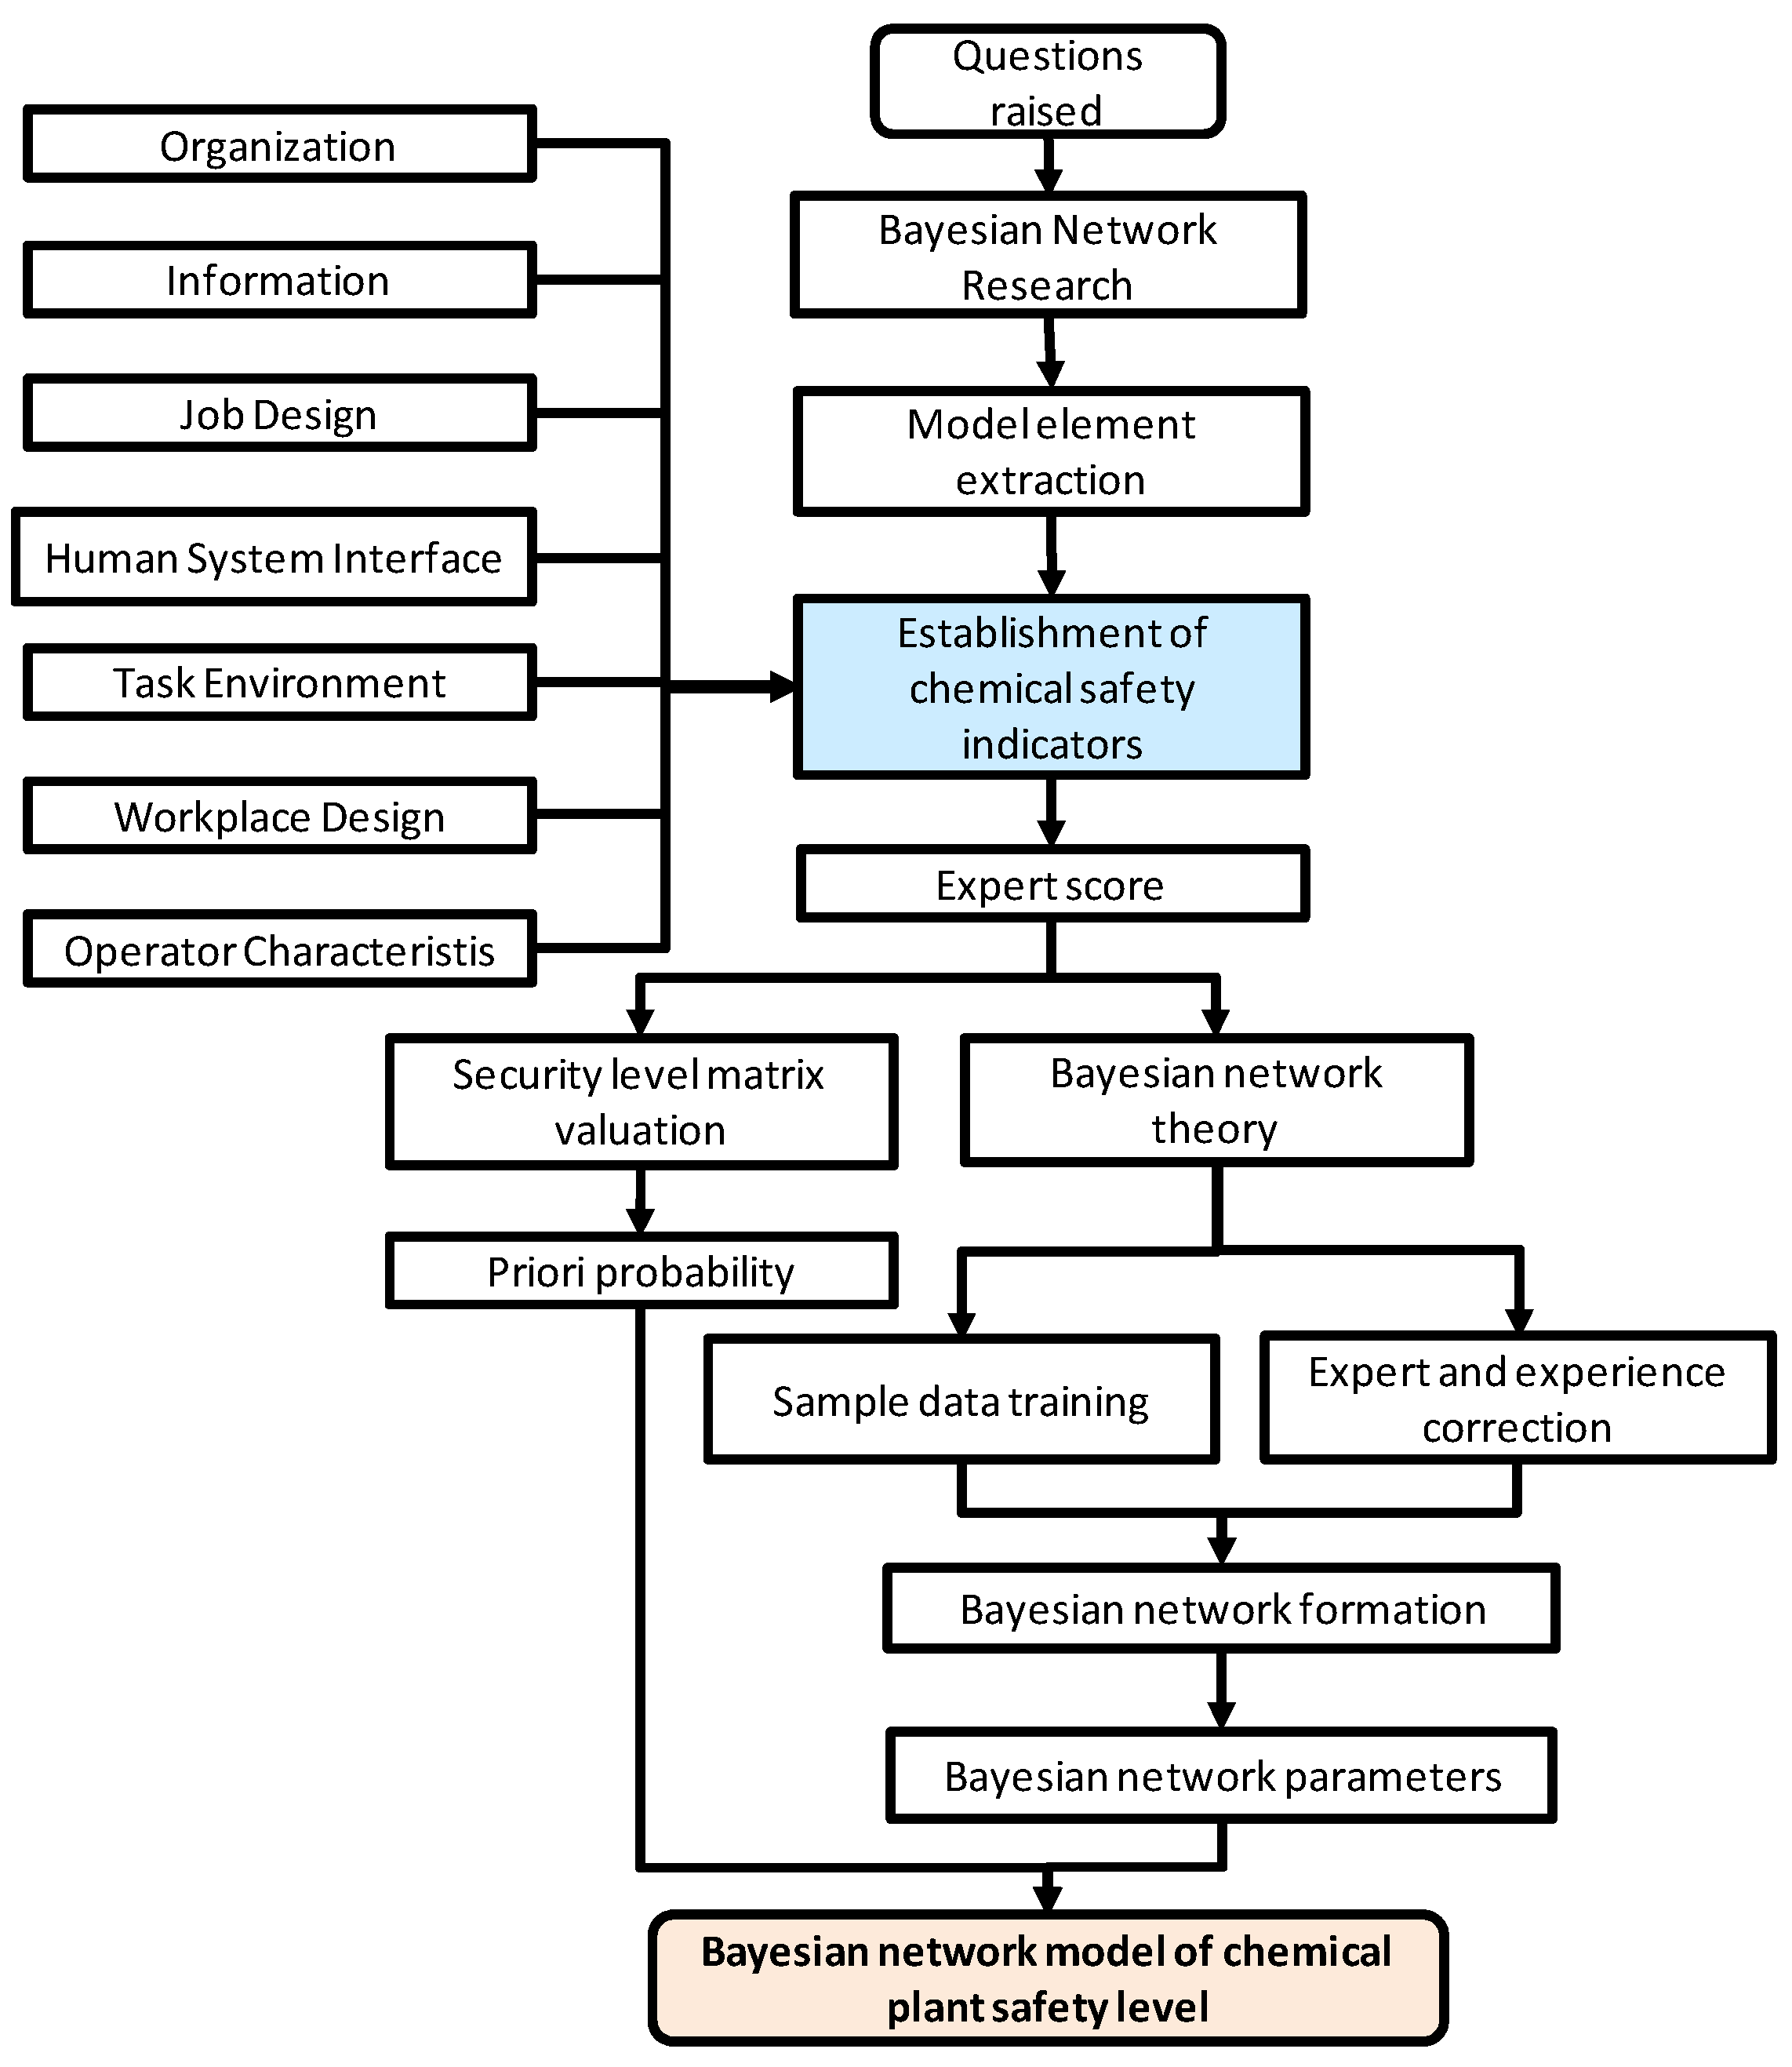
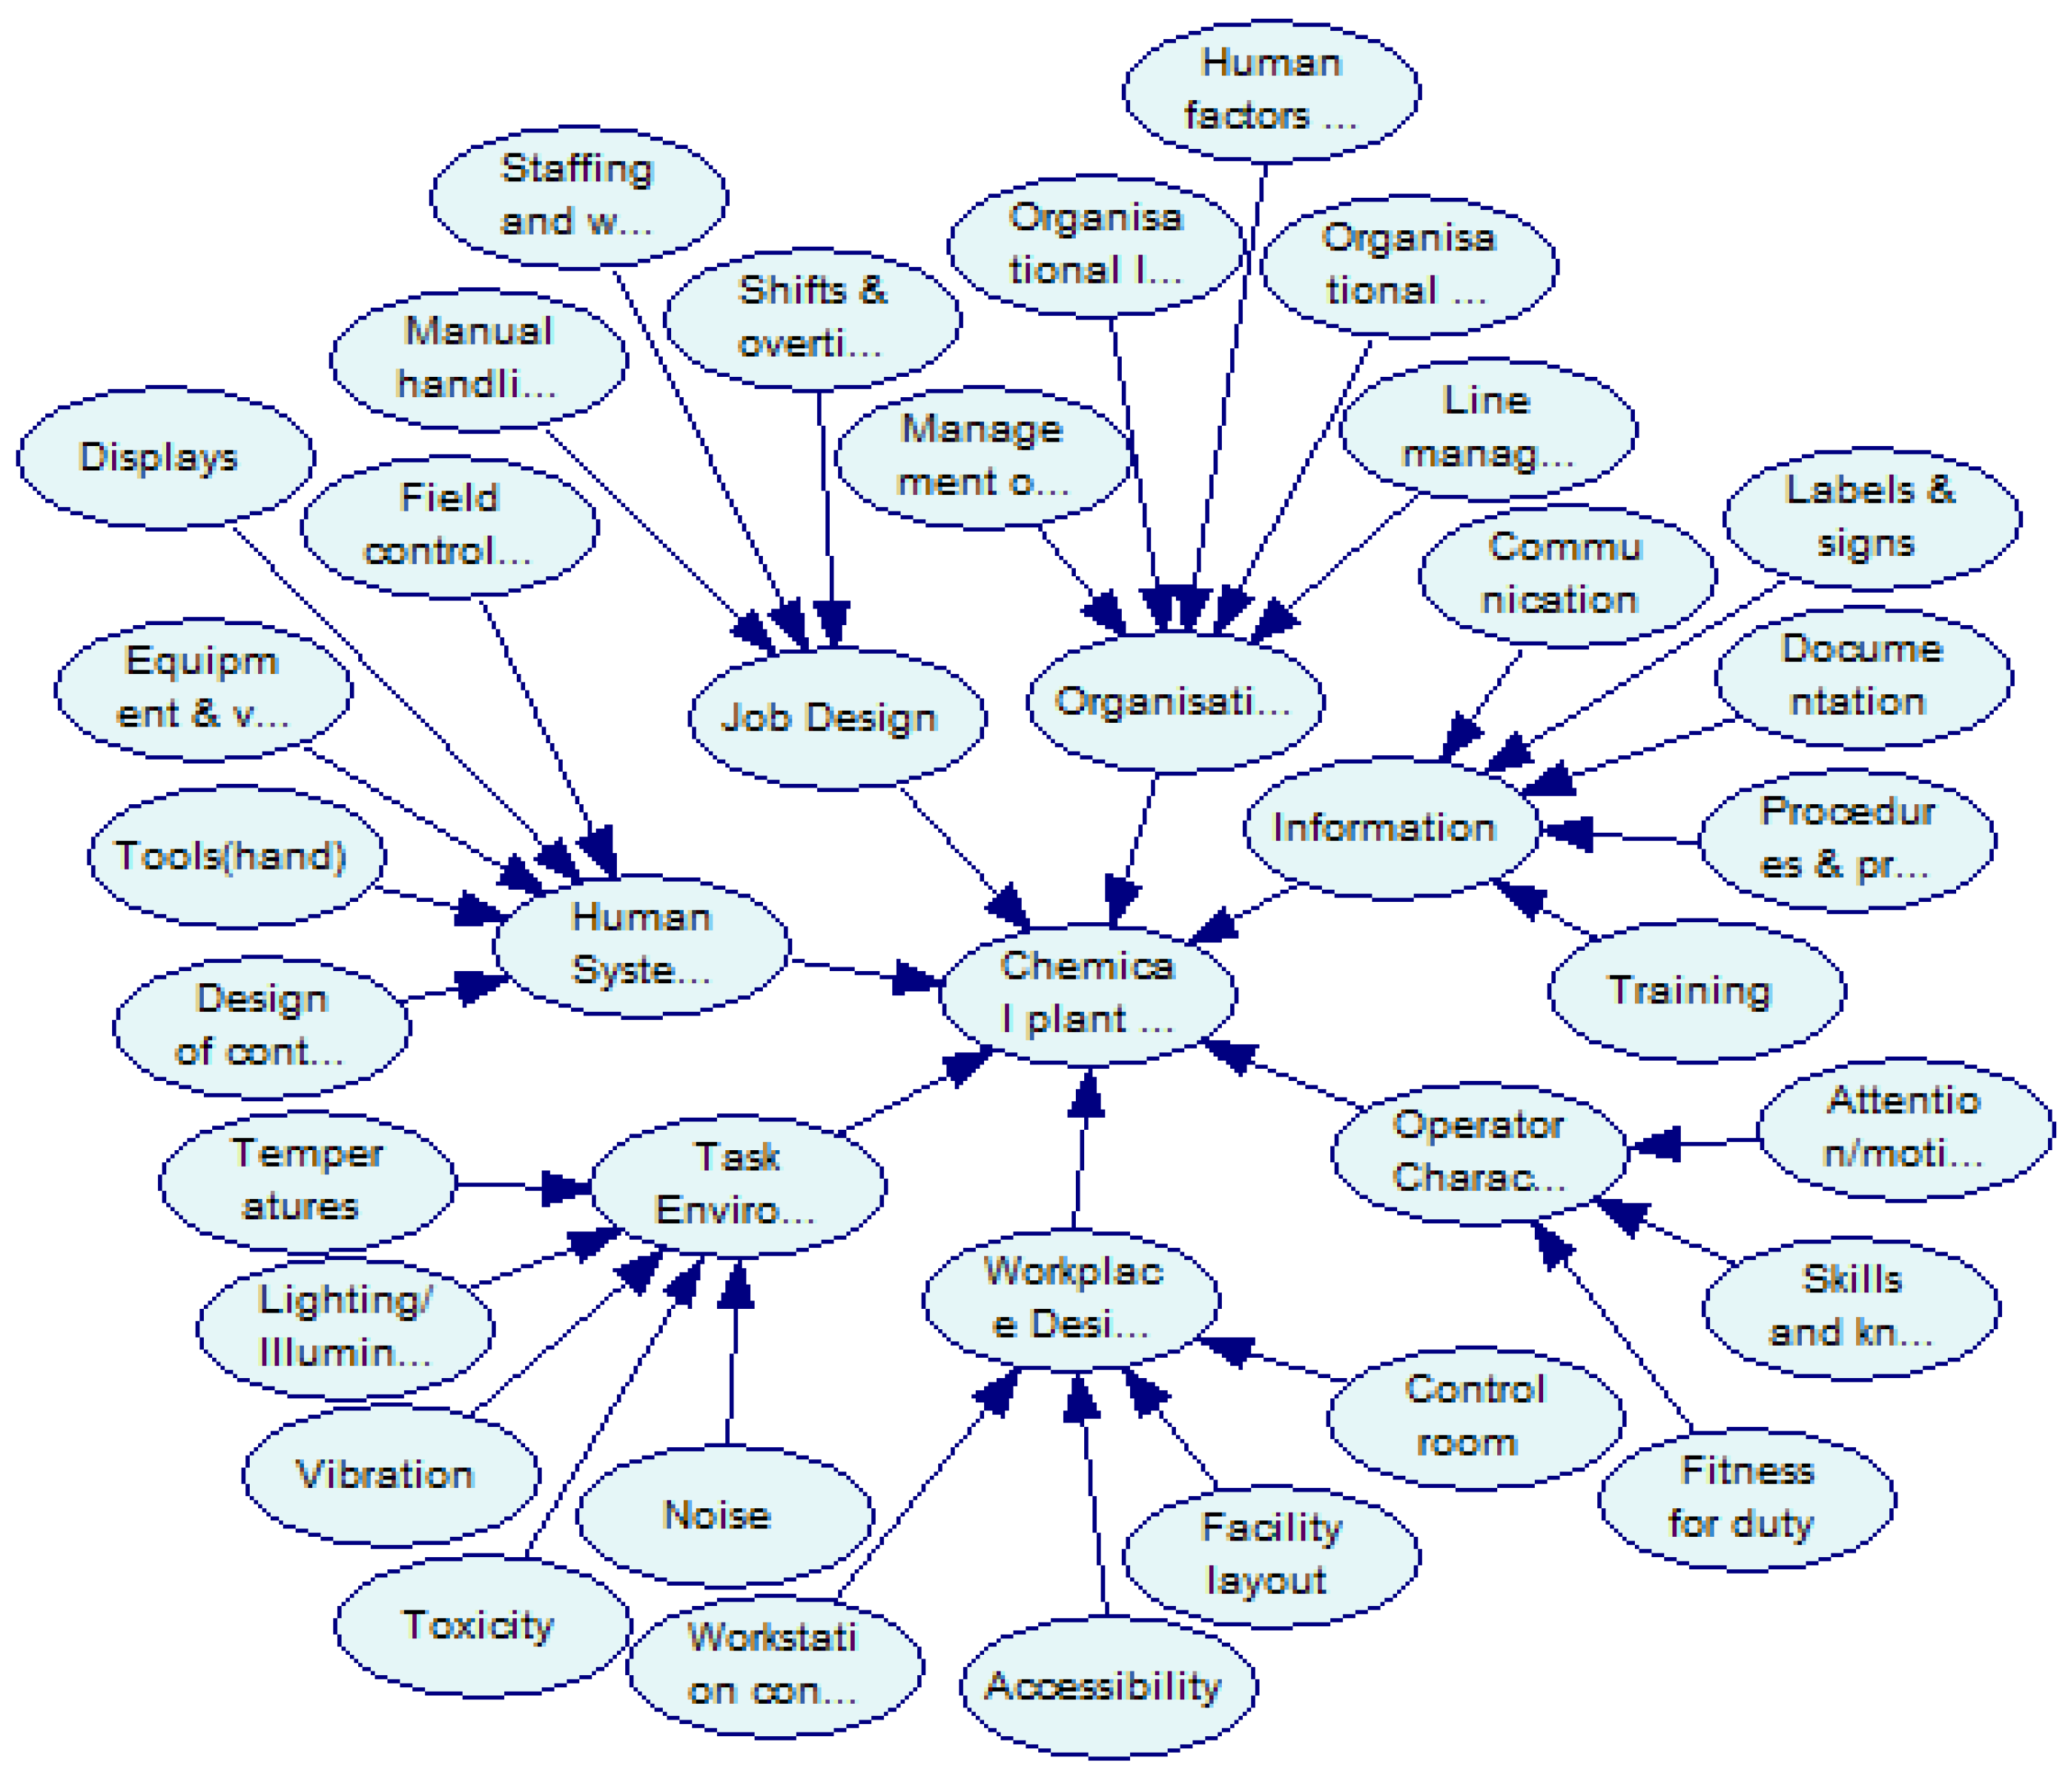
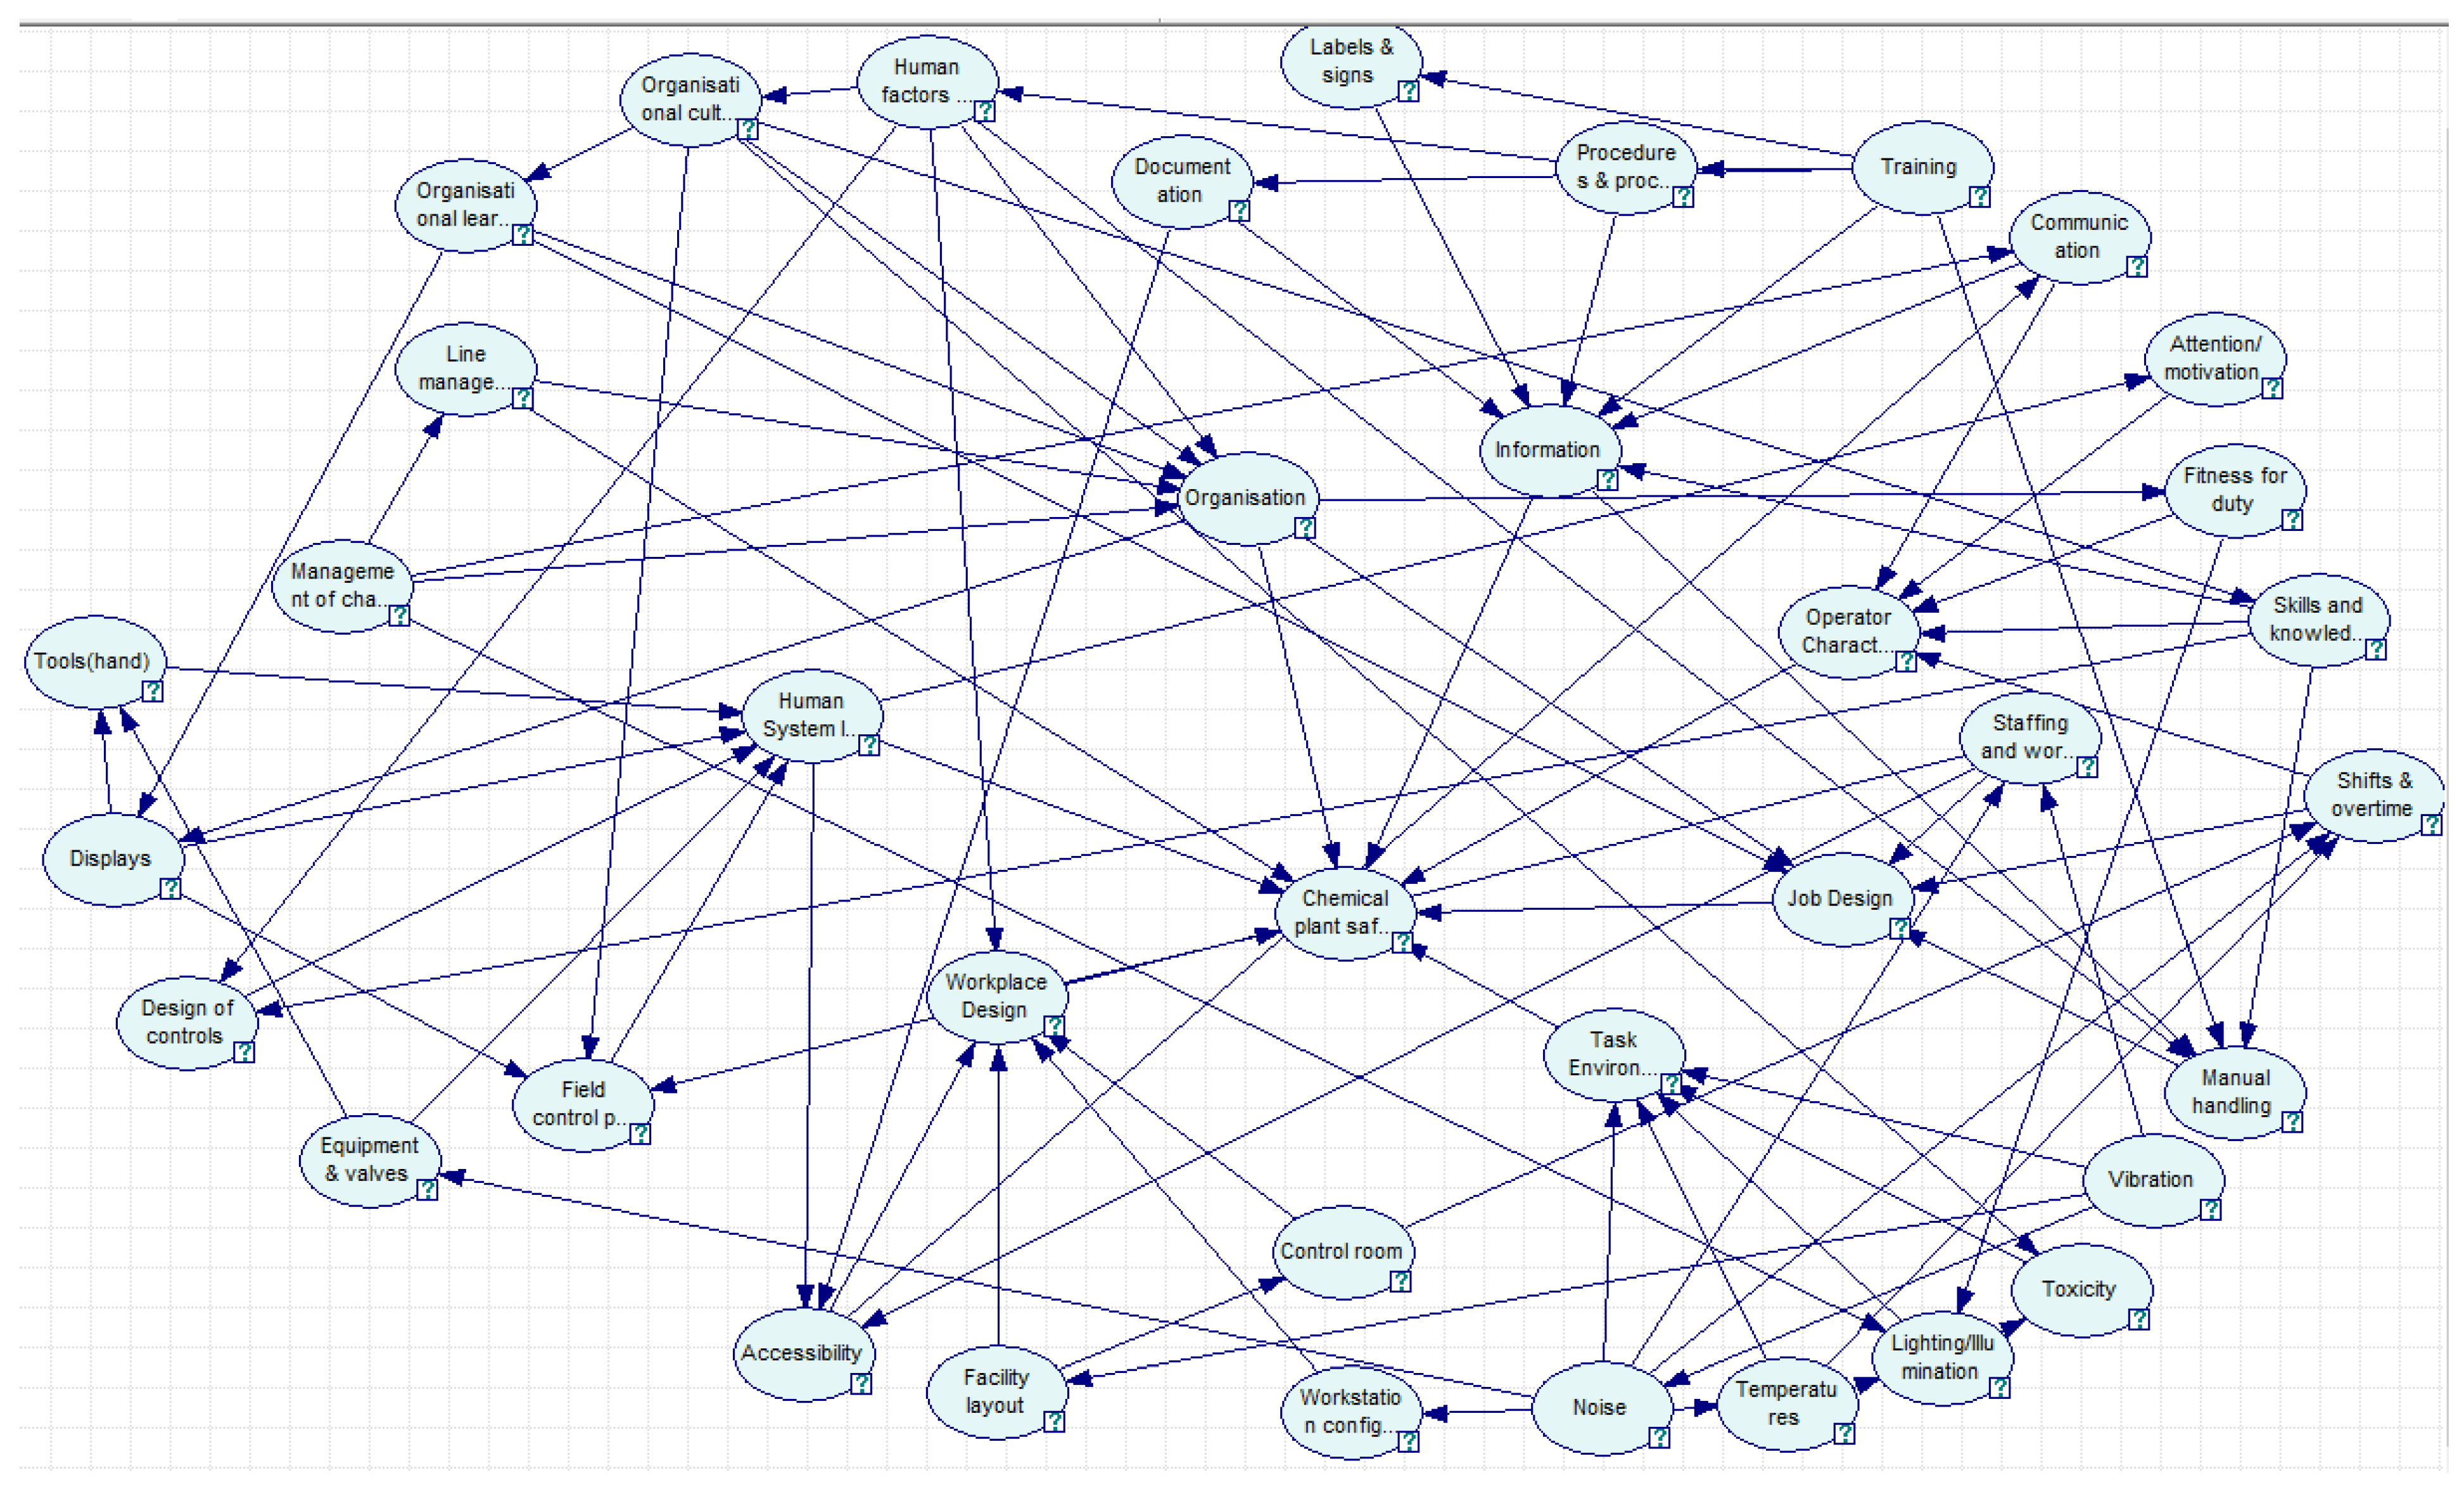
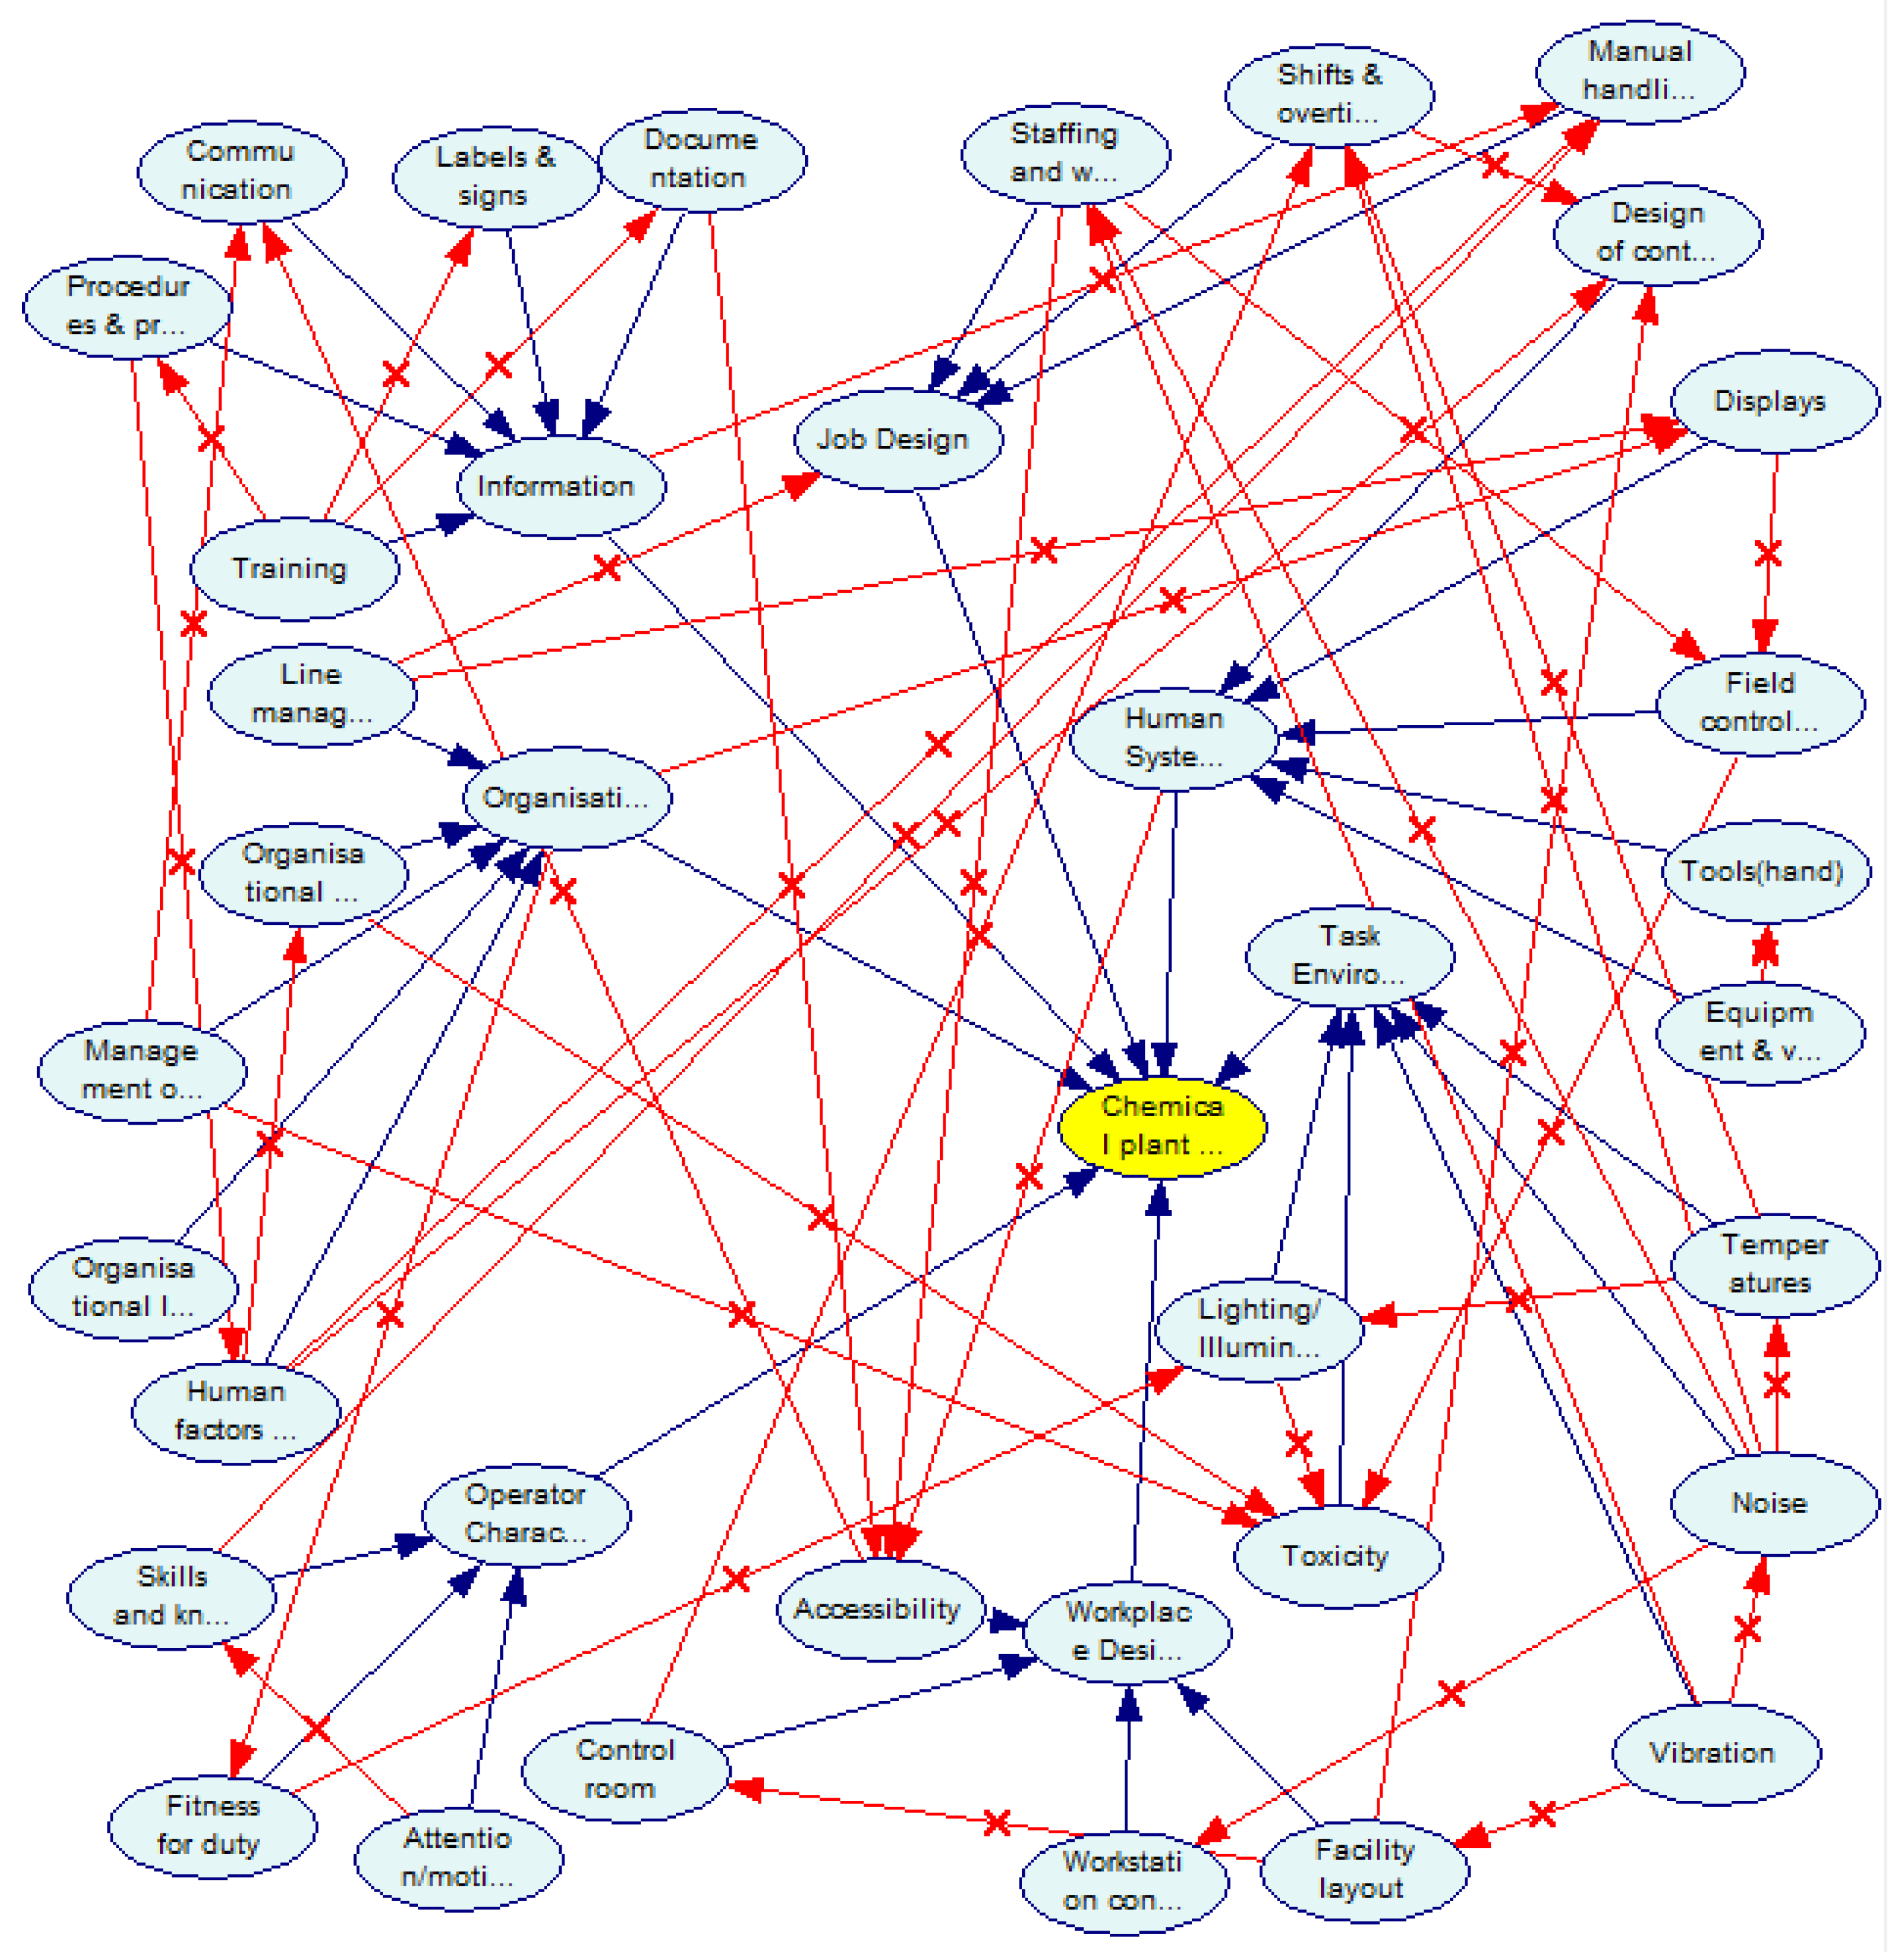
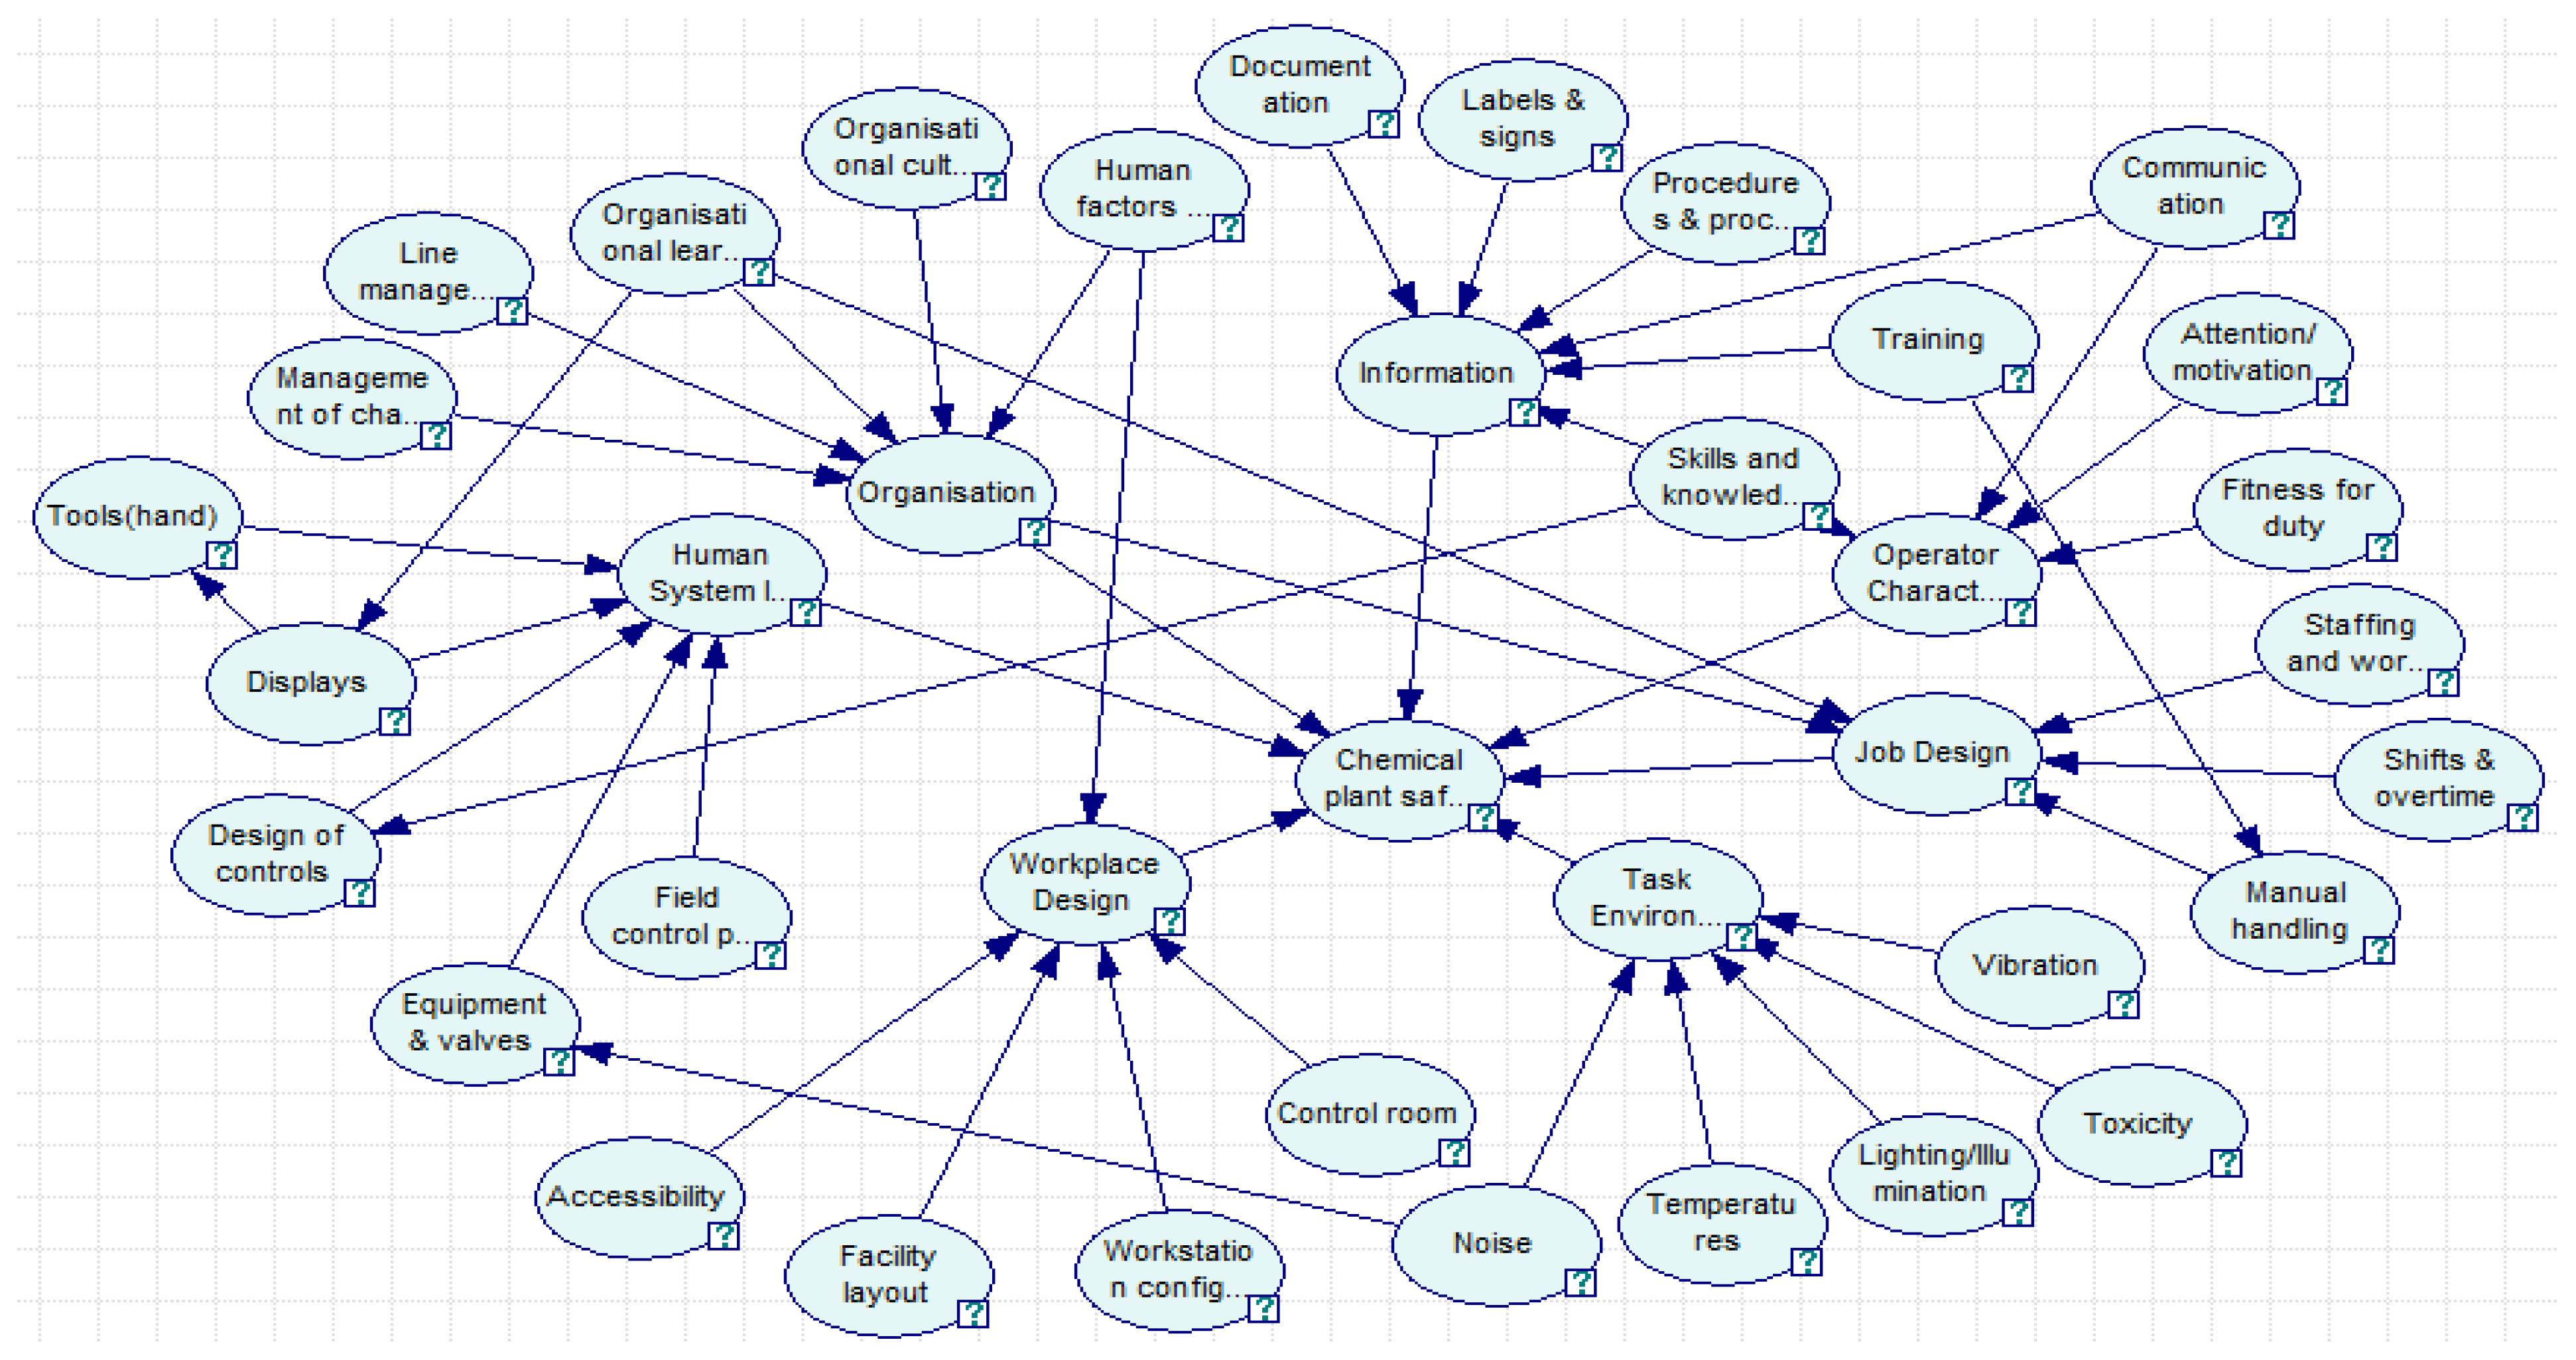
Given the lack of quantitative analysis research on human factors in chemical plant safety, this paper proposes a chemical plant quantitative analysis model based on a Bayesian network from a human factors perspective. In this model, detailed analysis was carried out from the perspective of human reliability in seven aspects: organization, information, job design, human system interface, task environment, workplace design, and operator characteristics. This was accomplished by using a questionnaire and the expert judgment method, establishing a chemical plant safety indicator system, and using Bayesian network training samples. Finally, the Bayesian network was used for processing and modeling, and the chemical plant safety quantitative value was calculated to determine the safety level of the chemical plant for safety management.
The content of the paper is distributed as follows: Section 2 explains the chemical plant factor analysis and Bayesian network structure and establishes the model; Section 3 presents specific case studies; Section 4 provides the main results and discussions of the work; and Section 5 is a description of the conclusions.
2. Materials and Methods
2.1. Bayesian Network
A Bayesian network [30], also known as a reliability network, is an extension of the Bayesian method and is one of the most effective theoretical models for uncertain knowledge representation and reasoning. A Bayesian network is a directed acyclic graph (DAG) consisting of a representative variable node and a directed edge connecting these nodes. The nodes represent random variables, and the directed edges between the nodes represent the mutual relationship between the nodes (pointed by the parent node to their child nodes), and conditional probability is used to express the relationship strength, since there is no parent node with the prior probability for information expression. Node variables can be abstractions of any problem, such as test values, observations, opinions, etc. Applicable to the expression and analysis of uncertain and probabilistic events and applied to decisions that are conditionally dependent on multiple control factors, node variables can be reasoned from incomplete, inaccurate, or uncertain knowledge or information.
2.1.1. Bayesian Rule
- (1)
- Prior probability
Prior probability refers to the probability of occurrence of each event determined according to historical data or subjective judgment; this type of probability has not been confirmed by experiments and belongs to the probability before the test, so it is called the prior probability. The prior probabilities are generally divided into two categories. One is the objective prior probability, which is the probability calculated using historical data from the past. The second is the subjective prior probability, which means that when there are no historical data or the historical data are incomplete, the probability of obtaining an event occurrence can only be judged by people’s subjective experience.
- (2)
- Posterior probability
Posterior probability generally refers to the use of the Bayesian formula, combined with investigation and other means, to obtain new additional information, and a more accurate probability is obtained by correcting the prior probability. Posterior probability = (likelihood * prior probability)/normalized constant.
- (3)
- Joint probability
Joint probability, also called the multiplication formula, refers to the probability of the product of two arbitrary events or the probability of an event.
- (4)
- Full probability formula
Let B1, B2, …, Bn be mutually exclusive events, and let P(Bi) > 0, i = 1, 2, …, n, B1 + B2 + …, + Bn = Ω. Another event, A = AB1 + AB2 + …, + ABn, is said to satisfy the abovementioned conditions; B1, B2, …, Bn is a complete event group, and . The schematic is shown in Figure 1.
Figure 1.
Schematic diagram of the calculation of the full probability formula.
Bi is the cause, and A is the result; thus, the full probability formula can be visually regarded as “derive the result from the cause”. The reason has a certain “effect” on the occurrence of the result, that is, the probability of occurrence of the result is related to the size of the “effect” of various reasons. The full probability formula expresses the relationship between them. It is shown in Figure 2.
Figure 2.
Full probability formula expression diagram.
2.1.2. Bayesian Formula
Bayesian deterministic theory was developed by British mathematician Thomas Bayes (1702–1761) to describe the relationship between two conditional probabilities. Bayesian formula, also known as Bayesian theorem and Bayesian rule, is a standard method for correcting subjective judgment about probability distribution (i.e., prior probability) by applying observed phenomena in probability statistics. The Bayesian formula is widely used. Let the prior probability be P(Bi), and the new additional information obtained by the survey is P(Aj|Bi) (I = 1, 2, …, n; j = 1, 2, …, m). Then, the posterior probability calculated by the Bayesian formula is .
2.1.3. Bayesian Modeling Method
The main tasks of Bayesian network modeling include determining the topology of the network and determining the conditional probability distribution of each node in the network. The conditional probability distribution of all nodes in the network is collectively referred to as the probability parameter of the network. Bayesian network modeling, which includes a qualitative process [31] and a quantitative phase, determines the topology and the probability parameters. There are three main ways to model Bayesian networks. The first is that expert topology is used to manually establish the model topology and provide the probability parameters. The second is to automatically acquire the Bayesian network through the study of the database. The third is a two-stage modeling method that combines the advantages of the former two; therefore, the Bayesian network is manually established by expert knowledge, and then the previously obtained Bayesian network model is corrected by learning the database.
2.2. Analysis of Factors Affecting Chemical Plant Safety
Chemical plant safety must not only consider the safety of the personnel themselves but also the impact of production, systems, equipment, and the environment on people. With advances in automation, intelligence, and systematization, chemical plant accidents are rarely caused by a single cause of systems, equipment, and the environment; instead, they are basically caused by comprehensive causes. Among them, the influence of personnel is indispensable, and management is also performed by personnel. Therefore, this paper established a quantitative analysis model for chemical plant safety based on personnel factors. The main contents of the model include organization, information, work design, human system interface, task environment, workplace design, and operator characteristics [32]. Organization is the driver, information is the bridge, work design is the method, the human system interface is the key, task environment is the support, workplace design is the guarantee, and operator characteristics are the foundation. They are factors that affect the safety of the chemical plant together, as shown in Figure 3.
Figure 3.
Schematic diagram of the factors affecting the chemical plant safety research model.
2.2.1. Organization
From the perspective of management, the so-called organization refers to a social entity. It has a clear goal-oriented and well-designed structure and a consciously coordinated system of activities, while maintaining close contact with the external environment. The organizational factors that affect the safety of chemical plants include human factors, safety policy, organizational culture, management of change, organizational learning (audit and reviews), and line management and supervision.
2.2.2. Information
The main challenge is to ensure that the operator has all the information they need to perform their tasks safely and efficiently. Operators can receive information by directly sensing, by communicating with others, and by displaying and alerting. The operator must also know how to act according to the state of the plant. The information factors that affect the safety of chemical plants include training, procedures and procedure development, communication, labels and signs, and documentation.
2.2.3. Job Design
Position design is the specification of the content, methods, and relationships of the position to meet the technical and organizational requirements and the individual needs of the position holder. When defining tasks, the capabilities and limitations of workers must be taken into account in order to achieve optimal human performance. In order to achieve this goal, it is important to ensure that there are a sufficient number of qualified staff to schedule planned shifts and work schedules to minimize fatigue and stress and maximize concentration. The design of this work should also minimize the risks to workers’ health and safety, especially for manual tasks. The job design factors that affect the safety of chemical plants include staffing and work schedules, shifts and overtime, and manual handling.
2.2.4. Human System Interface
This is the key to the interaction between people and the system. Through this interface, the operator knows what is happening in the system and can give the system some input, feedback, or control measures that will eventually change the state of the system. The limiting factors of this interface depend on the perception, perception, and ability of the actual operator [33]. The human system interface factors that affect the safety of chemical plants include design of controls, displays, field control panels, tools (hand), and equipment and valves.
2.2.5. Task Environment
Environmental conditions that affect performance include excessive vibration and noise, extreme temperatures, and insufficient lighting. These adverse environmental conditions put pressure on the staff, interfere with their performance, and increase their chances of making mistakes when performing their tasks. Work environments that require protective equipment, such as a confined space environment or the need for unusual body postures, can also affect performance. The task environment factors that affect the safety of chemical plants include lighting/illumination, temperatures, noise, vibration, and toxicity.
2.2.6. Workplace Design
The layout of the plant should minimize the risk during operation, inspection, testing, maintenance, modification, repair, and replacement. According to COMAH’s assessment of safety reports in mechanical engineering, the evidence needed to fully consider these issues during the design is usually sufficient for the assessment. The plant design should provide adequate safeguards to ensure safety and reliability and even prevent deviations from exceeding design conditions. The safety report should state how the system that requires human interaction is designed to take into account the needs of the user and be reliable. Task and link analysis can be a great tool to improve facility layout. The task environment factors that affect the safety of chemical plants include facility layout, workstation configuration, control room, and accessibility.
2.2.7. Operator Characteristics
The operator’s physical and cognitive characteristics, skills, knowledge, attention, motivation, responsibility, and ability also have an impact on human error. Skills refer to how humans process and interpret information; they are not intrinsic personal qualities and can be obtained through training and experience. They refer to the ability to recall and perform every step of the task, technical reading and painting skills, physical, cognitive, visual, and listening skills. Knowledge needs to describe what a person needs to understand and understand in order to satisfactorily complete tasks such as those that involve dangerous situations, equipment, plant processes, operating procedures, rules, and restrictions. The operator characteristics factors that affect the safety of chemical plants include attention/motivation, fitness for duty, skills, and knowledge.
2.3. Modeling Algorithm Application Flow
There are a number of factors to consider when applying algorithms in practice. The actual modeling process of the Bayesian network should be viewed as a whole process. This is because, in practice, the definition of variables, the selection and processing of data, the choice of algorithms, and the actual modeling all involve many potential problems. The modeling process is shown in Figure 4.
Figure 4.
Bayesian network modeling flow chart.
2.4. Determination of Bayesian Network Nodes for Chemical Plant Safety
2.4.1. Bayesian Network Node Selection
According to the previous analysis, it is not difficult to find many factors affecting the safety of chemical plants. In combination with the characteristics of Bayesian networks, the selection of influencing factors for modeling must follow the necessary principles. First is the representative principle: the selected nodes can reflect the comprehensive information embodied in the chemical plant safety management, representing the intrinsic characteristics of each element, to avoid information leakage or redundancy. Second is the principle of independence: the information contained in the selected nodes is not contained and does not intersect, ensuring logical independence. Third is the principle of validity: the selected nodes should be able to extract and refine information from a dangerous goods accident investigation report to ensure the effective acquisition of data. Therefore, in combination with expert knowledge and analysis of accident investigation reports, 30 nodes were finally determined through global considerations.
The target node of the Bayesian network structure is chemical plant safety, which was defined as S, and 30 nodes were divided according to organization, information, work design, human system interface, task environment, workplace design, and operator characteristics, and the nodes are numbered as shown in Table 1 [34].
Table 1.
Chemical plant safety factors.
2.4.2. State Definition of Bayesian Network Nodes
Since the intentional characteristics of each node are different, it is necessary to explain the state of the node. For the convenience of network implementation and operation considerations, we consulted the expert’s opinion and defined the node state in a unified way. There are 5 states for 30 factors, as shown in Table 2 [24].
Table 2.
State evaluation of the node.
2.5. Establishment of a Bayesian Network Structure for Chemical Plant Safety
2.5.1. Bayesian Network Evaluation Criteria Definition
Based on the selected nodes, the network structure was established through expert knowledge and machine learning [22]. The degree of impact of each node on the size of the safety risk is different in each incident. Combined with the description of the investigation report, each influencing factor was identified and evaluated. According to the evaluation criteria, the relative influence degree of each factor was evaluated to determine its score. For this purpose, the Likert scale was selected. The least important = 1 is the lowest, and the most important = 5 is the highest. At the same time, we defined the safety level and risk level of chemical plants. The evaluation criteria are shown in Table 3.
Table 3.
Node evaluation criteria.
As shown in Table 3, very safe and very low risk received a 5, safe and low risk received a 4, general received a 3, unsafe and high risk received a 2, and very unsafe and very high risk received a 1. However, for the convenience of research, this article used the safety level of the chemical plant for calculating, and the calculation result can directly correspond to the risk level.
2.5.2. Bayesian Network Data Collection
- (1)
- Investigation on the degree of influence of chemical plant safety
A questionnaire was prepared against the impact assessment criteria. According to the importance of human error, the factors at all levels were scored. N experts were invited to score the factors, and the list of scores is shown in Table 4.
Table 4.
Factor impact degree questionnaire scoring list.
- (2)
- Chemical plant safety factor status valuation survey
A questionnaire was prepared against the evaluation criteria of the state estimate. Valuation of all levels of factors is based on actual assessment of the state of the chemical plant. N experts were invited to make a valuation, and the list of valuations is shown in Table 5.
Table 5.
List of factors state evaluation questionnaire results.
where F indicates the safety factor of the chemical plant, and A/J indicates the author and expert scores for the degree of factor impact. A’/J’ means that authors and experts rate the factor status estimates; i indicates each safety factor, i = 1, 2, 3 … 37; and j indicates the Jth expert score, j = 1, 2, 3 … N.
2.5.3. Chemical Plant Safety Rating Factor Valuation
Data from the survey results are available for each factor’s impact on chemical plant safety and state valuation. The safety evaluation value was obtained by the coordinates of the questionnaire data value of the degree of influence and the state estimation, and the safety level matrix (as shown in Figure 5) was used to normalize the data to obtain the safety level of each factor.
Figure 5.
Safety level matrix.
In Figure 5, the safety status is divided into five levels, S1, S2, S3, S4, and S5, which represent very unsafe, unsafe, generally, safe, and very safe, respectively. According to an algorithm similar to the risk estimate, 25 safe values (with a large number of duplicate values) can be obtained from Figure 5. Standardizing the questionnaire data through the safety level matrix can greatly reduce the workload of calculating the safety assessment value, and all safety factors after processing can be measured by five levels (S1, S2, S3, S4, and S5). The proportion of each safety factor can be used to provide the necessary data for establishing a Bayesian network model. The statistical results of the safety factors involved are shown in Table 6.
Table 6.
Summary of safety level statistics.
where F indicates the safety factor of the chemical plant, A, B, C, D, and E represent the proportion of each of the five levels, respectively; A + B + C + D + E = 100%; and i indicates each safety factor, i = 1, 2, 3 … 37.
2.5.4. Bayesian Network Structure Learning
- (1)
- Background knowledge of the pre-edited Bayesian network structure
In theory, it is objective and feasible to construct a target network through sample data learning. As long as the evaluation function of evaluating the quality of the target network is properly defined, the network may be generated by running software. In order to make the topology simple and clear, the calculation is fast and makes full use of expert knowledge, report analysis, and other means, according to the reasons given before; thus, the results determine the order of variables and establish a causal network [35]. On this basis, the sample data were imported for learning, and the hidden relationship between nodes was further explored. The causal relationship between the constructed Bayesian network nodes was preliminarily judged and summarized, and the background learning structure knowledge was pre-edited, as shown in Figure 6.
Figure 6.
Structure background knowledge editing diagram based on expert knowledge.
- (2)
- Bayesian network structure learning
Commonly used Bayesian network structure learning methods are based on statistical test methods and search score-based methods. The representative algorithm based on search scores is the K2 algorithm. The main idea is to first define a measure function to evaluate the merits of the network model. Starting from an initial network, according to the predetermined node order, the node with the largest posterior probability was selected as the parent node of the node, all the nodes were sequentially traversed, and the best parent node was gradually added for each variable. In order to improve the network structure, N+1 evaluation samples were imported into the network as machine learning data.
2.5.5. Bayesian Network Structure Optimization
- (1)
- Causal correlation analysis
In order to further analyze the causal relationship between safety factors of various factors, this paper judged the correlation between various factors through expert knowledge and adjusts the causal relationship between each safety factor according to the judgment result. For the factors without causality, all are listed. Through sample data learning, potential causal relationships between nodes were revealed. It should be noted that the newly added wired arc was mined by sample data and expresses a certain relationship between the data; however, it does not necessarily have a logical relationship between the nodes in the true sense, so it is necessary to check and judge the connection relationship between the nodes. The results of causality analysis can be used to reduce the complexity of the network and optimize the network structure [36].
- (2)
- Background knowledge optimization editing of Bayesian network structure
According to the result of causal correlation analysis, we optimized the background knowledge editing, listed the unrelated factors in advance, and then imported the data to generate the optimized Bayesian network structure.
- (3)
- Optimized Bayesian network structure
According to the correlation analysis between each safety factor, and by importing the optimized background knowledge editing, the optimized Bayesian network structure was obtained.
2.6. Bayesian Network Parameters Learning for Chemical Plant Safety Analysis
Each safety factor includes five safety states: S1, S2, S3, S4, and S5. Before parameter learning, the probability of each network node variable needs to be initialized, that is, the initialization value was assigned to each node variable.
At present, there are two Bayesian network parameter learning methods commonly used: Bayesian estimation and maximum likelihood estimation. Estimation based on Bayesian statistics regards the parameters as random variables. The prior probability can be considered in the operation, and the maximum likelihood estimation is to treat the parameters as unknown quantification without considering the prior probability. In this paper, Bayesian statistics-based estimation was used for parameter learning, and the prior probability needs to be considered. The safety evaluation value was obtained for the coordinate value of the questionnaire data value of the influence degree and the state estimation, and the prior probability of all the root nodes was calculated by using the safety level matrix. After importing the sample learning database, parameter learning was performed, and the remaining root nodes were manually input by prior probability. After all probability parameters were input, the probability update was performed to realize the learning update of all node network parameters.
2.7. Bayesian Network Model for Chemical Plant Safety Analysis
Parameter learning is based on the optimization of the network topology; its purpose is to quantitatively describe the strength of the connection between existing network topology nodes. The final learning result is actually the Bayesian network structure constructed by the Bayesian network model of chemical plant safety analysis.
2.8. Sensitive Analysis
Sensitivity analysis is the identification of sensitive factors that have a significant impact on chemical plant safety among a number of uncertainties. On the basis of reverse reasoning, sensitivity analysis was used to obtain the influencing factors of chemical plant safety accidents when they were in an unsafe state, and they were marked with dark colors.
3. Case Analyses
3.1. Impact Valuation and State Valuation Survey of Various Factors in Chemical Plant Safety
- (1)
- Impact valuation survey
The 23 judges invited to complete the questionnaire all have a background in safety and chemical engineering. A total of 24 judges including the authors evaluated each human factor, and the evaluation data constituted a machine learning database. The database is shown in Table 4. The weights of all the judges were very close, with only a few cases where the standard deviation was greater than one [32]. The summary list of the questionnaire is shown in Appendix A.
- (2)
- State valuation survey
Twenty-three chemical industry experts were invited to investigate the status of chemical plants. The list of valuation surveys is shown in Appendix B.
3.2. Chemical Plant Safety Rating Factor Valuation
According to the safety level matrix calculation requirements, the factor estimation calculation can obtain the statistical results shown in Appendix C.
3.3. Bayesian Network Structure Learning
The 24 evaluation samples were imported into the network as machine learning data, and the resulting learning structure is shown in Figure 7. The network structure of machine learning has a close relationship with the accuracy of the number of learning samples: the more “real” data the network requires, the more sample data are needed. Since this study only provides 24 samples, the data used for training and learning are limited, and the real “correct” and concise network structure cannot be obtained. Therefore, further optimization is needed. The resulting learning structure is shown in Figure 7.
Figure 7.
Bayesian learning structure.
3.4. Bayesian Network Structure Optimization
- (1)
- Causal correlation analysis
According to the causal correlation analysis, the causal relationship between the safety factors of various factors can be obtained, as shown in Table 7.
Table 7.
Results of causal analysis.
- (2)
- Bayesian network structure background knowledge optimization editing
According to the result of the causal correlation analysis, the optimized background knowledge editing map can be obtained, as shown in Figure 8.
Figure 8.
Optimized background knowledge editing diagram.
- (3)
- Optimized Bayesian network structure
Based on the correlation analysis and optimized background knowledge editing, the final Bayesian network structure was optimized, as shown in Figure 9.
Figure 9.
Optimized Bayesian network structure.
3.5. Bayesian Network Parameter Learning and Final Model for Chemical Plant Safety Analysis
After importing the sample learning database, parameter learning was performed, and the remaining root nodes were manually input with prior probability. After all the probability parameters were input, the probability update was performed, and the learning and updating of the network parameters of all nodes could be realized. The result of the update is the final Bayesian network structure constructed by the chemical plant’s Bayesian network model, as shown in Figure 10.
Figure 10.
Bayesian network parameter learning results.
3.6. Sensitivity Analysis
The data use Bayesian sensitivity analysis was used to find all the sensitivities that affect the target node. Combined with the actual safety analysis of chemical plants, the target node can reflect to some extent the important factors affecting the safety of chemical plants. Based on the analysis of the sensitivity of the network on the basis of Figure 10, the analysis results were obtained, as shown in Figure 11.
Figure 11.
Bayesian network sensitivity analysis.
In the sensitivity analysis, the nodes with darker colors are the sensitive factors affecting the safety of the chemical plant. There are 18 factors such as organization, organizational culture, human factors and safety policy, information, communication, operator characteristics, skills and knowledge, human–system interface, job design, manual handling, noise, lighting/illumination, workstation configuration, control room, human–system interface, tools (hand), design of controls, and equipment and valves.
4. Results and Discussion
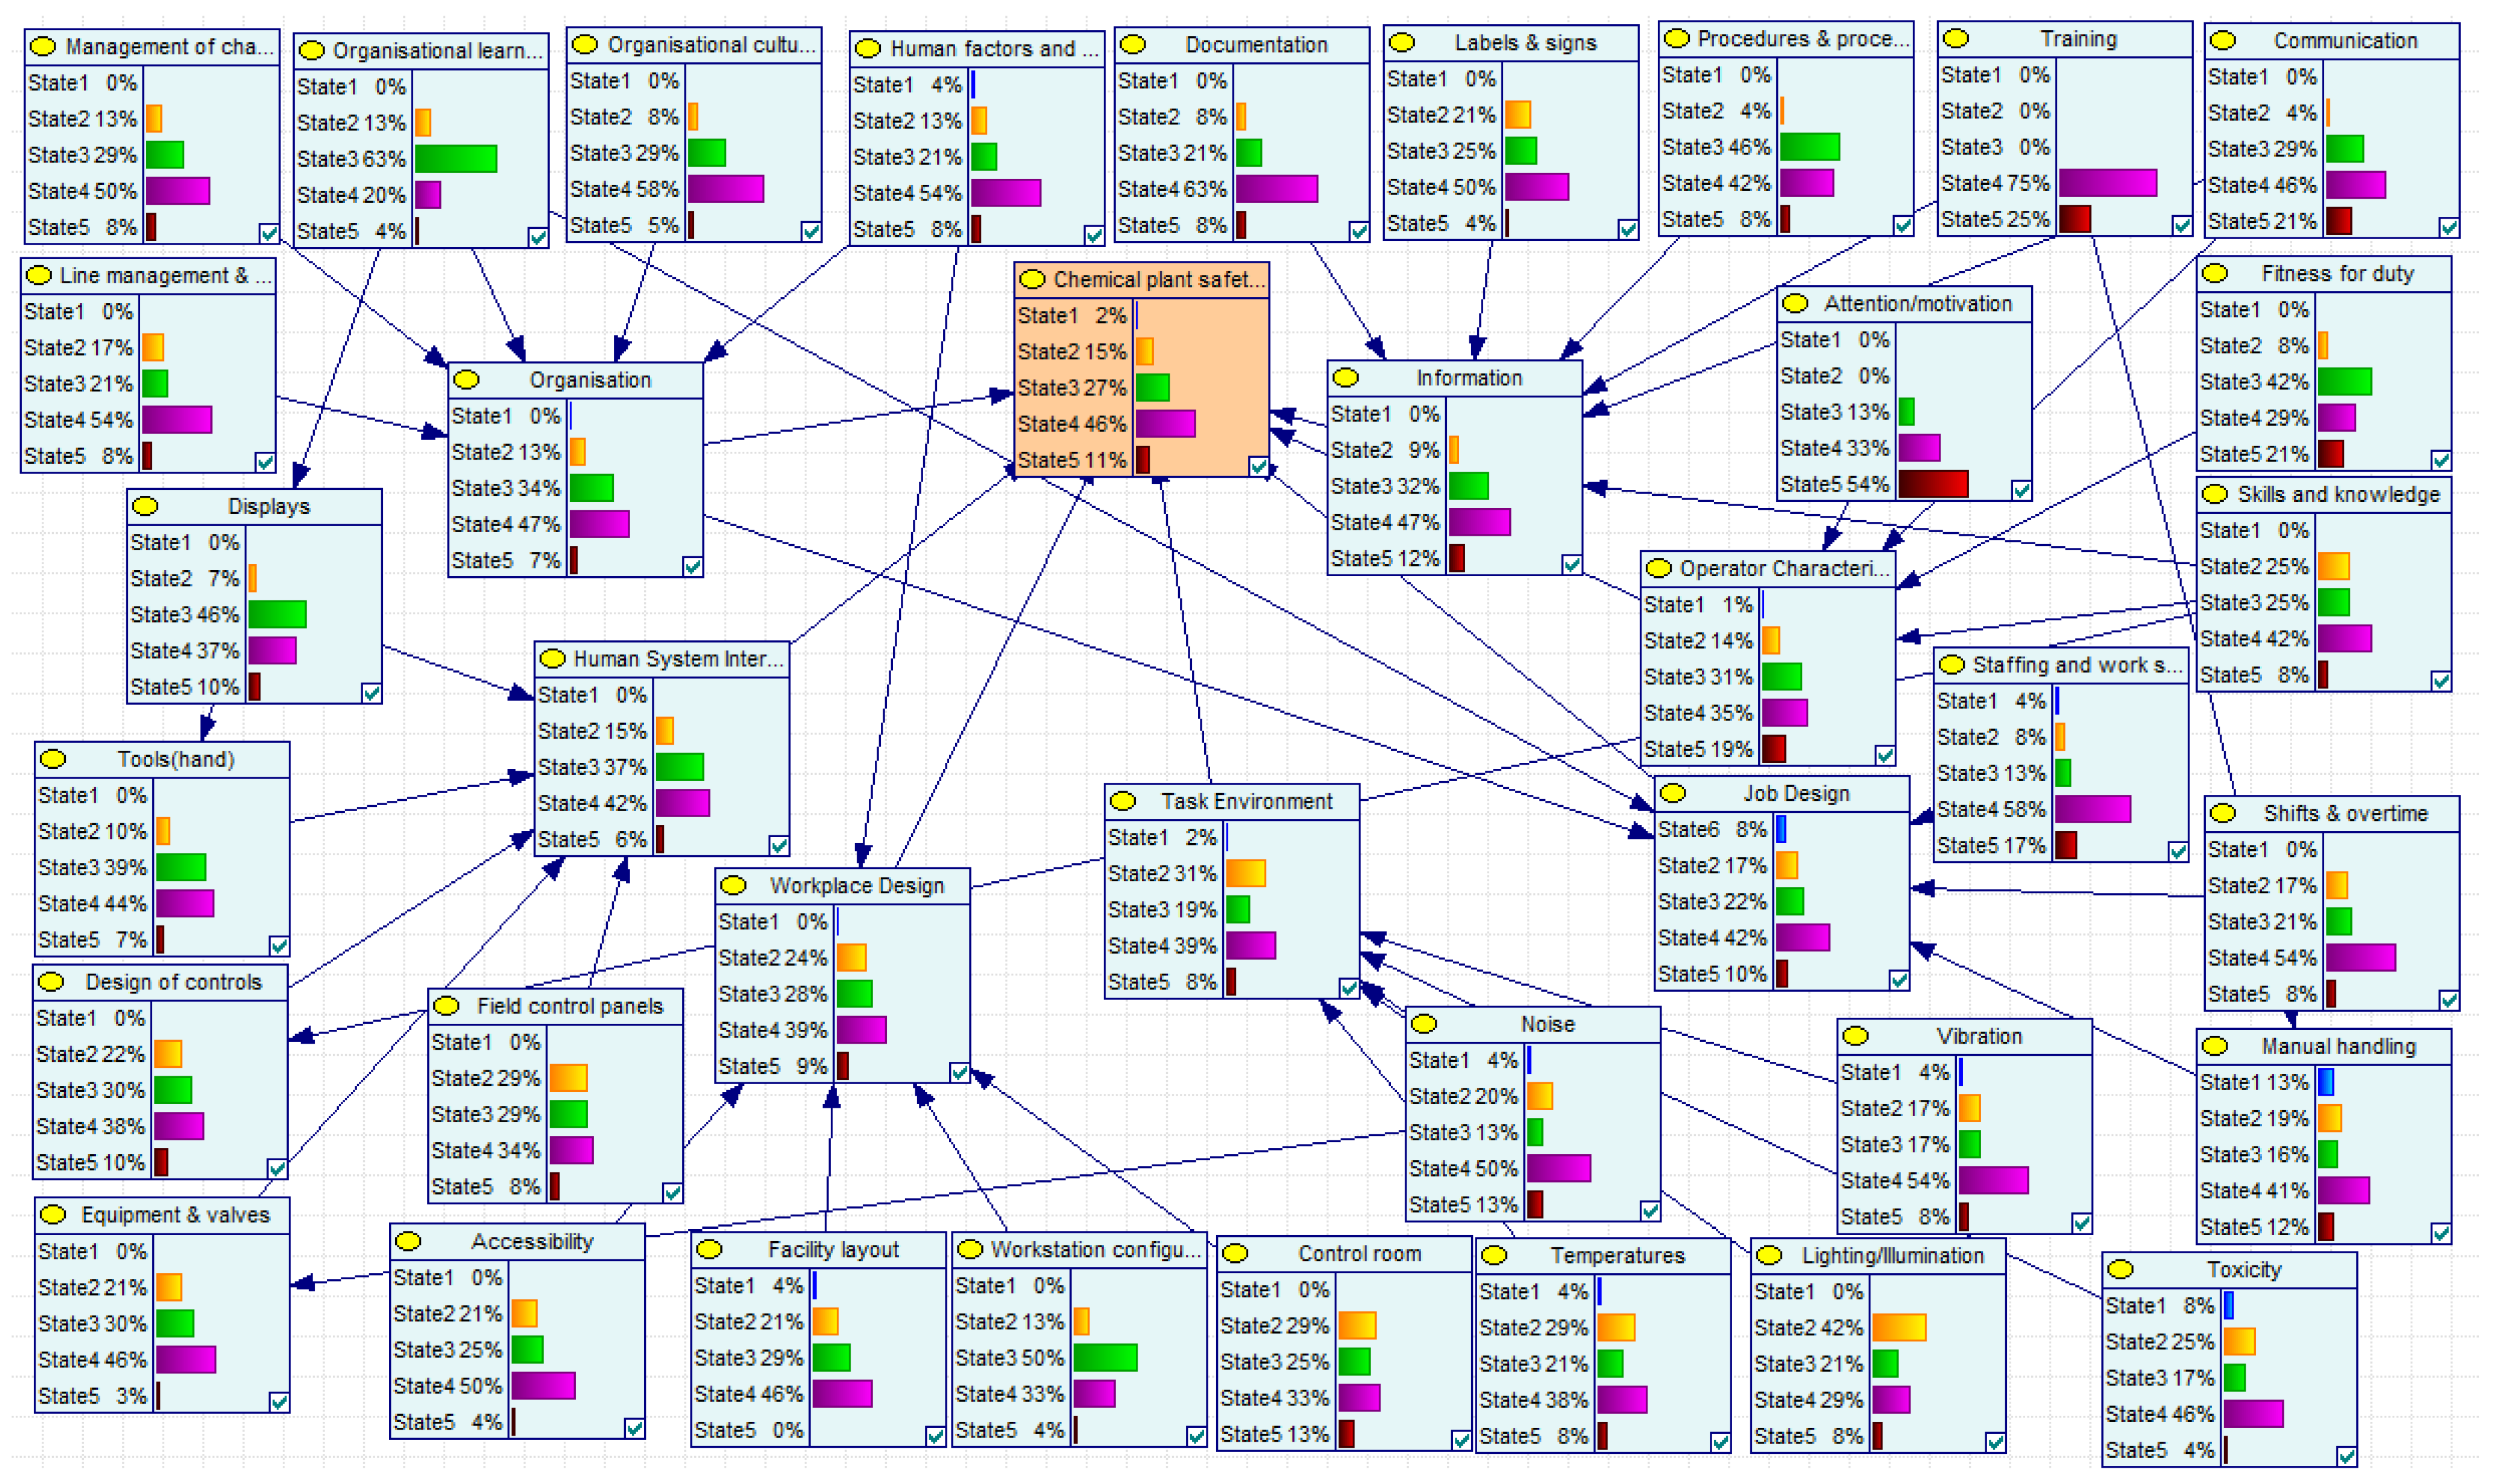
In this paper, the chemical plant safety level was divided into five levels, 1, 2, 3, 4, and 5, which, respectively, correspond to the five conditions of the overall status of the chemical plant: very unsafe, unsafe, general, safe, and very safe. As can be seen from Figure 10, the chemical plant safety levels correspond to a level 1 probability of 2%, a level 2 probability of 15%, a level 3 probability of 27%, a level 4 probability of 46%, and a level 5 probability of 11%.
The results of the abovementioned model calculations represent the safety probabilities of the various levels of the chemical plant in general. When carrying out safety warnings for specific chemical plants, it is first necessary to collect the relevant information of the chemical plants to understand their background. According to the facts and characteristics of a chemical plant, the safety level of each factor could be analyzed. The analysis results were then imported into the Bayesian network structure model, and the management risk of the chemical plant was assessed by calculating the grade value of the chemical plant safety. The chemical plant overall safety level expected value calculation is as follows: safety level 1 is 2%, safety level 2 is 15%, safety level 3 is 27%, safety level is 46%, and safety level is 11%. Taking the abovementioned model operation result as an example, the overall safety level of the chemical plant was 1 × 2% + 2 × 15% + 3 × 27% + 4 × 46% + 5 × 11% = 3.5, that is, the safety level of the chemical plant was between 3 and 4, which is close to a relatively safe range.
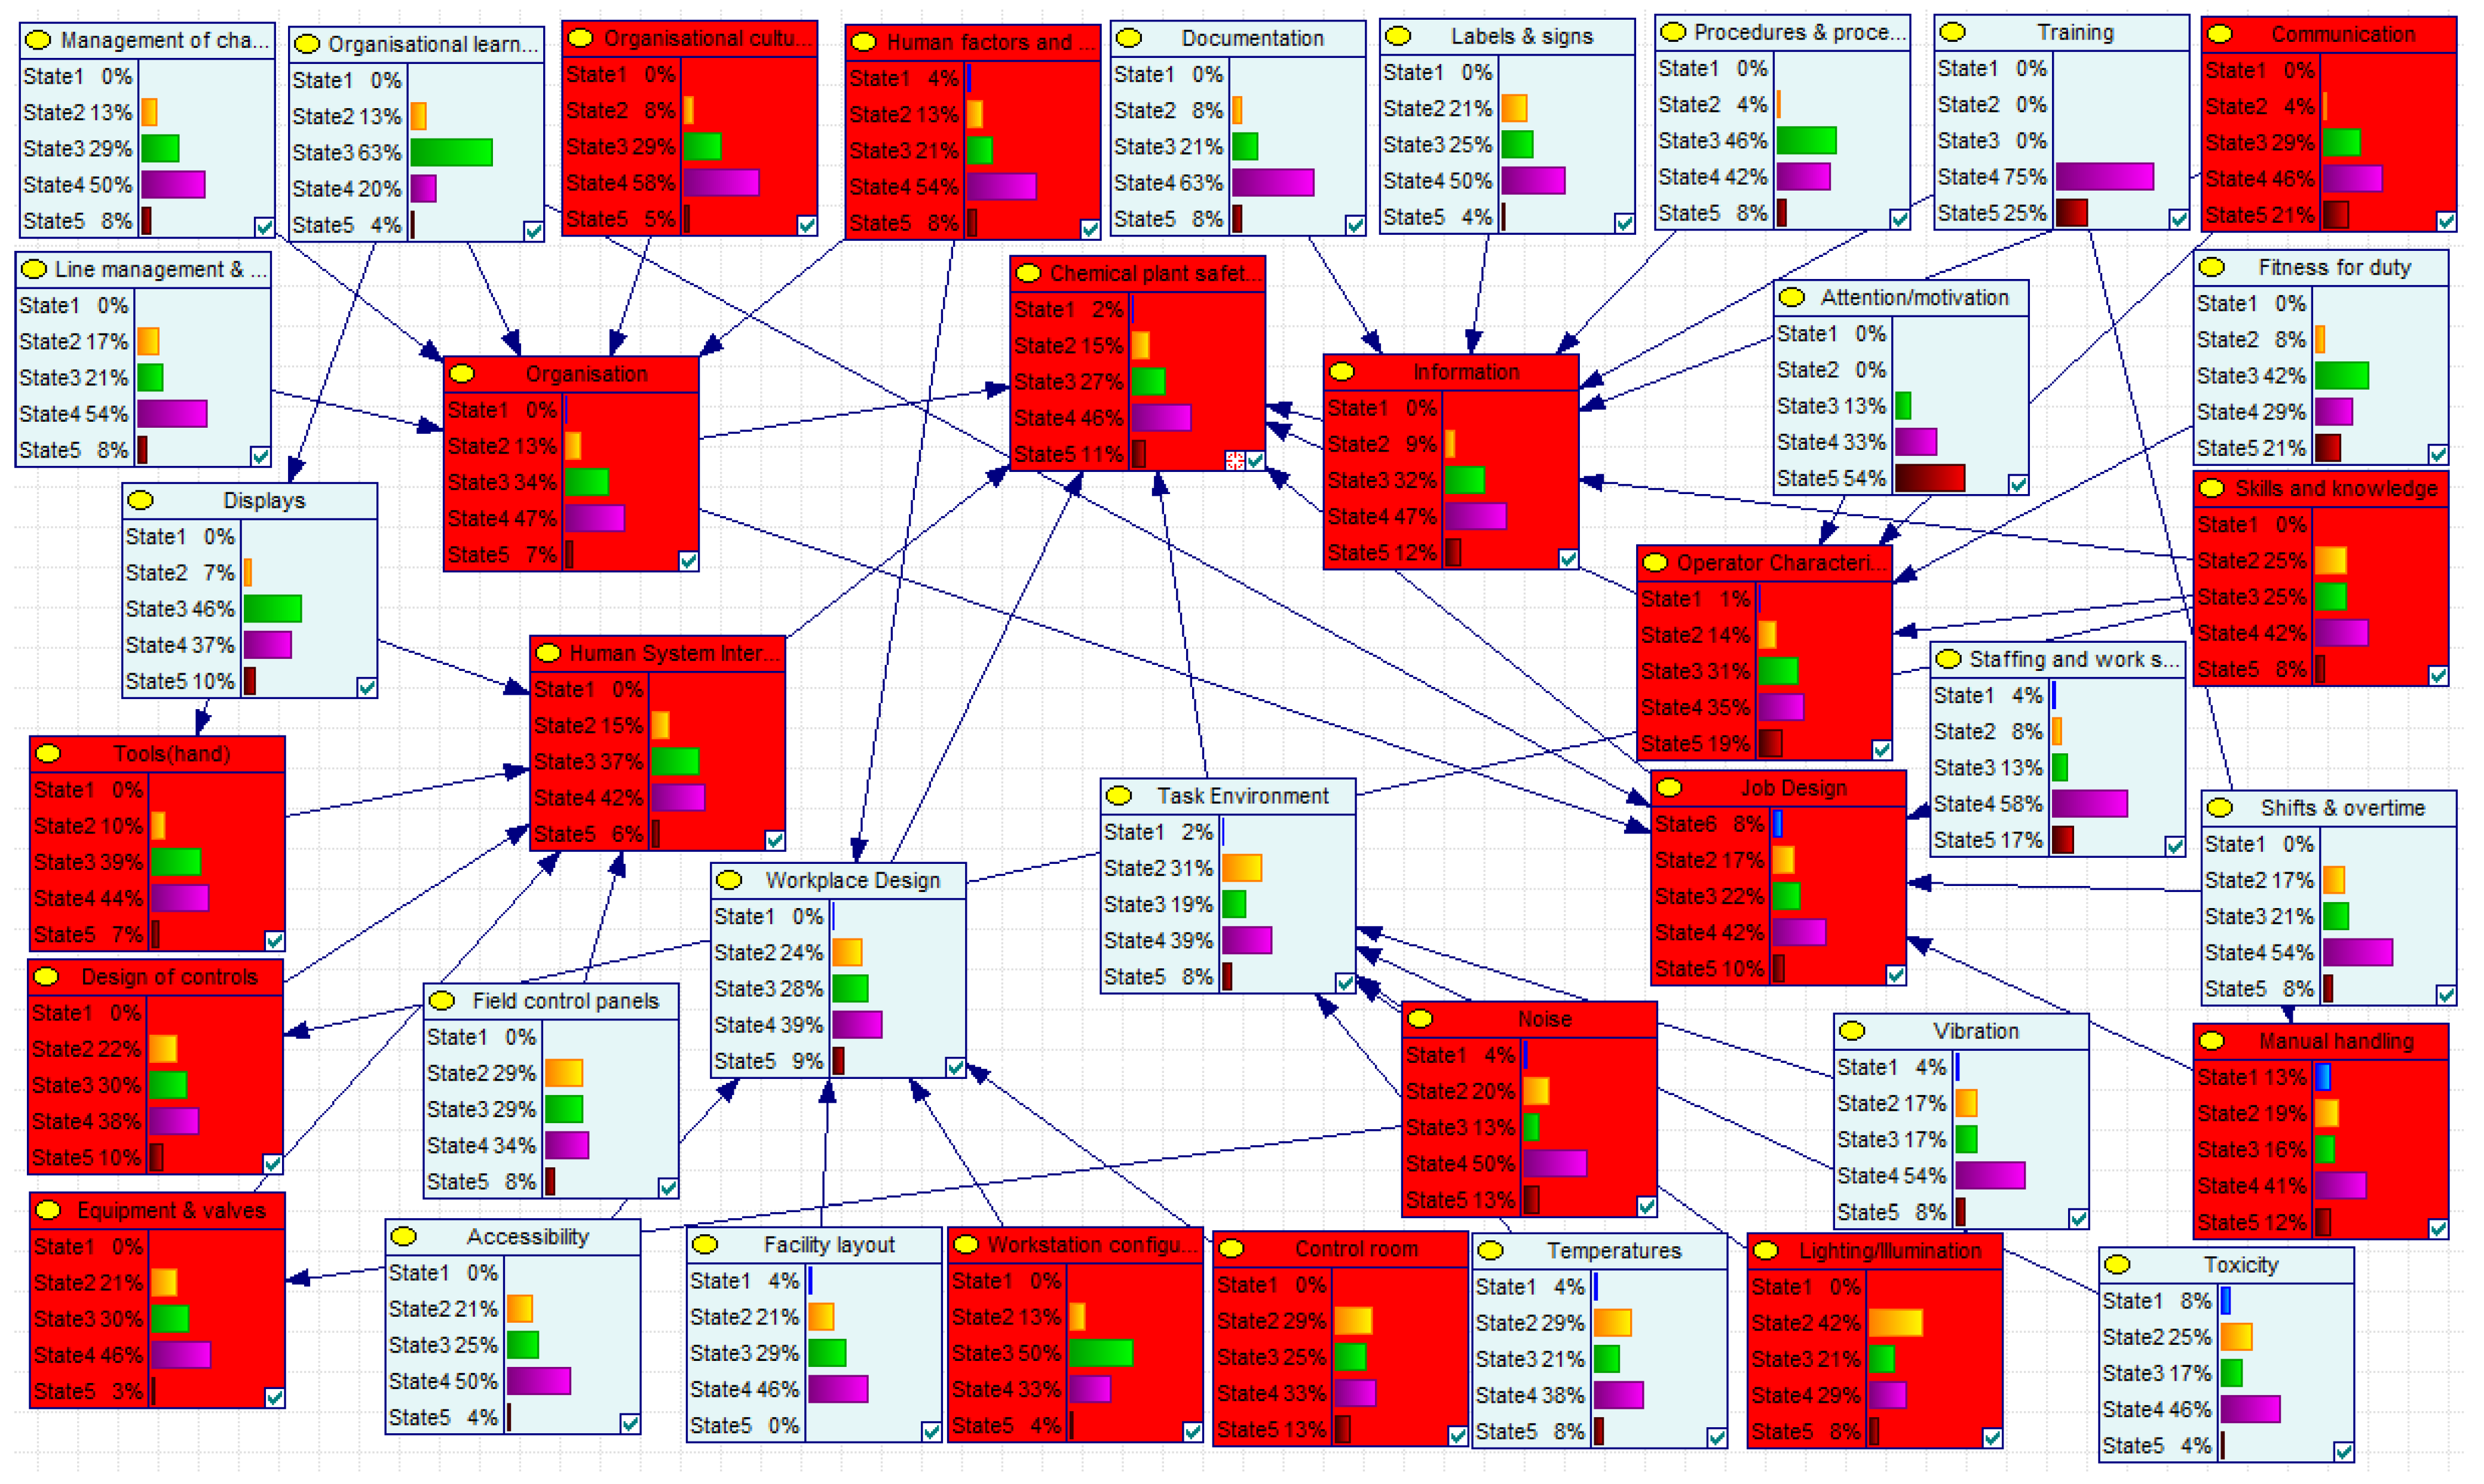
The Bayesian network also has a reasoning learning function. Through the abovementioned chemical plant safety Bayesian network analysis model, the safety level of the chemical plant can be inferred. When a chemical plant has a low level of safety, the sensitive sensitivity, reverse reasoning, and maximum causal chain analysis capabilities of the Bayesian network simulation can be used to identify the sensitive safety factors and key safety factors in the chemical plant safety impact factors. In order to improve the safety of chemical plants and provide a more scientific basis, we can also make targeted recommendations on the safety of chemical plants by using reasoning learning.
5. Conclusions
This study illustrated the application of Bayesian networks in chemical plant quantitative analysis and evaluation models. The application used questionnaires and expert judgment to conduct research and analysis based on the reliability of personnel factors in seven aspects: organization, information, job design, human system interface, task environment, workplace design, and operator characteristics. This process established a chemical plant safety indicator system: taking a chemical plant as an example, we used a Bayesian network for processing and modeling, predicted and estimated the safety value of the chemical plant, and judged the safety level of the chemical plant to carry out the comprehensive safety management of the chemical plant and its chemical park. By applying this model, chemical park managers can regularly audit and score each chemical plant in the park and use the model to calculate the safety level of each chemical plant. Then, they can focus on the monitoring and management of any chemical plants with a safety level of one. At the same time, through the sensitivity analysis in the model, key human factors affecting safety are found, and chemical plants are required to make targeted improvements, improve safety levels, and ensure that the safety equivalence of the chemical plants reaches at least level 3. Continuous regular inspection by managers can greatly reduce the occurrence of safety accidents in chemical plants.
For future research using this model, we mainly assume that increasing the number of training samples would help develop the model’s research to be more mature and accurate. Simultaneous use of the Bayesian network chemical plant safety analysis model’s reasoning and analysis functions can identify the sensitivity and key safety factors from the chemical plant safety’s influencing factors. By continuing to optimize the model, specific factors can be found to improve the safety of chemical plants, which can help with the management of chemical plants and reduce the occurrence of safety accidents.
Author Contributions
Writing—original draft preparation, Q.S.; investigation, L.S. All authors have read and agreed to the published version of the manuscript.
Funding
This research was funded by [the National Natural Science Foundation of China] grant number [62273126] and [the Zhejiang Provincial Natural Science Foundation of China] grant number [LQ21F030012].
Conflicts of Interest
The authors declare no conflict of interest.
Appendix A
List of results of impact valuation questionnaire.
| Safety Factor | Judges | |||||||||||||||||||||||
| Author | 1 | 2 | 3 | 4 | 5 | 6 | 7 | 8 | 9 | 10 | 11 | 12 | 13 | 14 | 15 | 16 | 17 | 18 | 19 | 20 | 21 | 22 | 23 | |
| Organization | 5 | 2 | 4 | 5 | 5 | 5 | 2 | 3 | 5 | 5 | 5 | 3 | 4 | 4 | 5 | 2 | 5 | 4 | 4 | 4 | 4 | 4 | 4 | 2 |
| Human factors and safety policy | 5 | 1 | 2 | 4 | 5 | 4 | 3 | 4 | 3 | 4 | 3 | 1 | 4 | 1 | 3 | 5 | 4 | 4 | 5 | 4 | 3 | 4 | 3 | 5 |
| Organizational culture | 3 | 2 | 4 | 5 | 5 | 5 | 4 | 3 | 4 | 5 | 5 | 4 | 2 | 4 | 5 | 3 | 3 | 3 | 3 | 4 | 3 | 4 | 4 | 5 |
| Management of change | 4 | 2 | 3 | 3 | 4 | 3 | 4 | 2 | 5 | 5 | 5 | 4 | 2 | 3 | 4 | 3 | 2 | 4 | 4 | 4 | 4 | 4 | 5 | 5 |
| Organizational learning (audit and reviews) | 4 | 2 | 4 | 4 | 4 | 4 | 4 | 3 | 3 | 4 | 4 | 2 | 4 | 3 | 4 | 3 | 3 | 3 | 4 | 3 | 3 | 4 | 3 | 5 |
| Line management and supervision | 3 | 3 | 3 | 3 | 5 | 4 | 4 | 5 | 1 | 4 | 4 | 3 | 4 | 4 | 4 | 4 | 4 | 4 | 5 | 3 | 4 | 4 | 4 | 5 |
| Information | 3 | 3 | 4 | 4 | 4 | 4 | 2 | 4 | 4 | 4 | 4 | 4 | 2 | 4 | 4 | 3 | 4 | 5 | 3 | 4 | 3 | 5 | 4 | 4 |
| Training | 4 | 3 | 3 | 4 | 4 | 5 | 4 | 4 | 4 | 4 | 4 | 4 | 5 | 4 | 5 | 4 | 3 | 5 | 5 | 3 | 4 | 5 | 5 | 3 |
| Procedures and procedure development | 3 | 3 | 3 | 5 | 4 | 3 | 3 | 4 | 3 | 4 | 3 | 4 | 4 | 3 | 4 | 5 | 4 | 4 | 3 | 3 | 3 | 5 | 3 | 3 |
| Communication | 4 | 3 | 5 | 4 | 5 | 4 | 4 | 4 | 4 | 4 | 4 | 4 | 4 | 4 | 4 | 4 | 5 | 5 | 3 | 4 | 4 | 5 | 4 | 4 |
| Labels and signs | 2 | 4 | 1 | 3 | 4 | 4 | 3 | 3 | 2 | 3 | 3 | 1 | 2 | 4 | 2 | 4 | 4 | 5 | 3 | 4 | 4 | 3 | 3 | 2 |
| Documentation | 2 | 3 | 2 | 3 | 4 | 3 | 3 | 2 | 3 | 4 | 4 | 1 | 5 | 4 | 3 | 4 | 2 | 4 | 2 | 4 | 4 | 4 | 4 | 2 |
| Job Design | 3 | 4 | 3 | 4 | 3 | 3 | 3 | 4 | 3 | 4 | 5 | 3 | 5 | 4 | 4 | 4 | 3 | 4 | 2 | 4 | 3 | 5 | 3 | 4 |
| Staffing and work schedules | 2 | 4 | 3 | 3 | 3 | 3 | 4 | 4 | 2 | 5 | 3 | 3 | 4 | 4 | 5 | 3 | 2 | 4 | 3 | 3 | 4 | 4 | 3 | 4 |
| Shifts and overtime | 2 | 4 | 3 | 3 | 3 | 4 | 4 | 4 | 2 | 3 | 4 | 4 | 5 | 2 | 2 | 3 | 3 | 5 | 2 | 3 | 3 | 4 | 4 | 4 |
| Manual handling | 2 | 3 | 1 | 3 | 4 | 3 | 4 | 4 | 1 | 3 | 3 | 1 | 4 | 3 | 1 | 3 | 2 | 3 | 1 | 2 | 4 | 5 | 2 | 2 |
| Human System Interface | 4 | 4 | 3 | 3 | 3 | 4 | 4 | 4 | 4 | 4 | 4 | 3 | 2 | 4 | 3 | 5 | 2 | 5 | 4 | 3 | 3 | 4 | 4 | 4 |
| Design of controls | 4 | 4 | 2 | 4 | 3 | 4 | 4 | 3 | 2 | 5 | 2 | 4 | 4 | 4 | 3 | 5 | 2 | 5 | 3 | 3 | 3 | 3 | 3 | 3 |
| Displays | 4 | 4 | 2 | 3 | 3 | 5 | 3 | 3 | 5 | 4 | 2 | 3 | 5 | 4 | 4 | 5 | 3 | 5 | 4 | 3 | 3 | 3 | 4 | 3 |
| Field control panels | 4 | 4 | 2 | 3 | 2 | 3 | 4 | 3 | 4 | 3 | 2 | 3 | 4 | 4 | 3 | 5 | 2 | 5 | 2 | 3 | 2 | 3 | 4 | 3 |
| Tools (hand) | 4 | 3 | 2 | 3 | 3 | 4 | 4 | 4 | 3 | 4 | 2 | 1 | 5 | 4 | 2 | 4 | 2 | 4 | 4 | 3 | 4 | 4 | 3 | 3 |
| Equipment & valves | 4 | 4 | 2 | 3 | 2 | 3 | 3 | 2 | 3 | 4 | 2 | 3 | 2 | 4 | 2 | 4 | 2 | 4 | 2 | 3 | 3 | 4 | 3 | 3 |
| Task Environment | 3 | 3 | 3 | 4 | 2 | 4 | 3 | 2 | 1 | 4 | 4 | 4 | 2 | 2 | 2 | 5 | 2 | 4 | 2 | 3 | 4 | 5 | 2 | 2 |
| Lighting/Illumination | 2 | 2 | 3 | 4 | 3 | 4 | 3 | 3 | 2 | 3 | 2 | 2 | 5 | 2 | 2 | 4 | 3 | 4 | 2 | 4 | 4 | 5 | 3 | 4 |
| Temperatures | 2 | 2 | 3 | 4 | 2 | 4 | 4 | 5 | 1 | 3 | 2 | 3 | 4 | 2 | 2 | 4 | 3 | 3 | 2 | 4 | 4 | 5 | 2 | 4 |
| Noise | 2 | 2 | 4 | 3 | 2 | 3 | 4 | 4 | 4 | 1 | 2 | 4 | 4 | 1 | 2 | 4 | 4 | 3 | 2 | 4 | 4 | 5 | 4 | 4 |
| Vibration | 2 | 2 | 4 | 3 | 2 | 3 | 4 | 4 | 4 | 1 | 2 | 4 | 4 | 1 | 2 | 4 | 4 | 3 | 2 | 4 | 4 | 5 | 4 | 4 |
| Toxicity | 2 | 1 | 3 | 3 | 2 | 3 | 3 | 5 | 5 | 3 | 4 | 1 | 5 | 3 | 2 | 4 | 2 | 4 | 1 | 5 | 5 | 5 | 2 | 4 |
| Workplace Design | 3 | 5 | 3 | 4 | 2 | 4 | 3 | 5 | 1 | 4 | 4 | 3 | 4 | 4 | 2 | 5 | 3 | 3 | 2 | 3 | 3 | 5 | 3 | 2 |
| Facility layout | 3 | 4 | 3 | 4 | 2 | 4 | 3 | 3 | 3 | 3 | 4 | 3 | 4 | 3 | 1 | 4 | 3 | 3 | 2 | 4 | 3 | 4 | 3 | 4 |
| Workstation configuration | 3 | 5 | 2 | 4 | 2 | 3 | 3 | 3 | 2 | 3 | 4 | 4 | 5 | 3 | 2 | 4 | 2 | 3 | 3 | 4 | 3 | 4 | 3 | 3 |
| Accessibility | 3 | 4 | 2 | 4 | 3 | 4 | 2 | 4 | 1 | 3 | 3 | 2 | 5 | 3 | 2 | 4 | 4 | 4 | 3 | 4 | 4 | 4 | 2 | 3 |
| Control room | 2 | 5 | 2 | 4 | 2 | 5 | 3 | 3 | 2 | 3 | 4 | 4 | 5 | 3 | 2 | 4 | 3 | 5 | 3 | 4 | 4 | 4 | 3 | 4 |
| Operator Characteristics | 2 | 2 | 5 | 3 | 4 | 5 | 4 | 4 | 3 | 4 | 4 | 2 | 3 | 5 | 4 | 4 | 1 | 3 | 2 | 5 | 5 | 5 | 5 | 4 |
| Attention/motivation | 2 | 4 | 5 | 3 | 5 | 5 | 3 | 5 | 5 | 5 | 4 | 4 | 4 | 5 | 4 | 4 | 4 | 4 | 5 | 4 | 5 | 5 | 5 | 5 |
| Fitness for duty | 4 | 4 | 3 | 3 | 4 | 2 | 4 | 3 | 3 | 4 | 4 | 3 | 5 | 3 | 3 | 5 | 3 | 3 | 3 | 3 | 5 | 5 | 4 | 5 |
| Skills and knowledge | 3 | 4 | 5 | 4 | 4 | 4 | 5 | 4 | 5 | 5 | 5 | 4 | 5 | 5 | 4 | 5 | 3 | 2 | 4 | 3 | 5 | 5 | 5 | 4 |
Appendix B
List of results of the state valuation questionnaire.
| Safety Factor | Judges | |||||||||||||||||||||||
| Author | 1 | 2 | 3 | 4 | 5 | 6 | 7 | 8 | 9 | 10 | 11 | 12 | 13 | 14 | 15 | 16 | 17 | 18 | 19 | 20 | 21 | 22 | 23 | |
| Organization | 3 | 2 | 3 | 3 | 5 | 3 | 2 | 3 | 3 | 3 | 3 | 3 | 4 | 3 | 3 | 2 | 3 | 3 | 3 | 3 | 3 | 3 | 5 | 2 |
| Human factors and safety policy | 3 | 2 | 4 | 4 | 4 | 3 | 1 | 3 | 3 | 3 | 3 | 3 | 5 | 3 | 3 | 3 | 4 | 4 | 3 | 3 | 3 | 4 | 3 | 3 |
| Organizational culture | 4 | 2 | 4 | 3 | 5 | 3 | 2 | 3 | 3 | 3 | 3 | 3 | 3 | 4 | 3 | 3 | 3 | 3 | 3 | 4 | 3 | 3 | 3 | 3 |
| Management of change | 3 | 3 | 3 | 3 | 5 | 3 | 3 | 3 | 3 | 3 | 3 | 3 | 4 | 3 | 3 | 3 | 3 | 3 | 3 | 3 | 3 | 3 | 5 | 1 |
| Organizational learning (audit and reviews) | 2 | 2 | 4 | 3 | 5 | 3 | 3 | 3 | 3 | 2 | 2 | 2 | 2 | 2 | 2 | 3 | 3 | 3 | 2 | 3 | 3 | 2 | 3 | 3 |
| Line management and supervision | 3 | 2 | 2 | 3 | 5 | 3 | 3 | 3 | 3 | 3 | 3 | 3 | 4 | 3 | 3 | 1 | 3 | 3 | 1 | 3 | 3 | 3 | 5 | 2 |
| Information | 4 | 4 | 4 | 4 | 4 | 4 | 2 | 4 | 4 | 4 | 4 | 4 | 5 | 4 | 4 | 1 | 4 | 5 | 3 | 4 | 3 | 5 | 4 | 3 |
| Training | 4 | 4 | 4 | 4 | 4 | 4 | 3 | 3 | 4 | 4 | 4 | 5 | 4 | 4 | 4 | 2 | 4 | 5 | 4 | 4 | 4 | 3 | 4 | 4 |
| Procedures and procedure development | 3 | 3 | 4 | 4 | 4 | 3 | 2 | 4 | 3 | 4 | 3 | 4 | 3 | 3 | 4 | 2 | 4 | 4 | 3 | 3 | 3 | 5 | 3 | 3 |
| Communication | 2 | 3 | 4 | 4 | 5 | 3 | 2 | 3 | 2 | 2 | 4 | 2 | 4 | 1 | 5 | 4 | 4 | 4 | 3 | 3 | 3 | 3 | 3 | 3 |
| Labels and signs | 4 | 4 | 4 | 3 | 4 | 4 | 1 | 4 | 3 | 3 | 3 | 4 | 5 | 4 | 4 | 2 | 4 | 5 | 4 | 3 | 4 | 4 | 4 | 3 |
| Documentation | 5 | 4 | 3 | 5 | 4 | 4 | 3 | 5 | 4 | 4 | 4 | 4 | 5 | 3 | 4 | 2 | 4 | 4 | 4 | 4 | 4 | 3 | 5 | 4 |
| Job Design | 5 | 4 | 5 | 4 | 4 | 3 | 3 | 4 | 3 | 4 | 5 | 3 | 5 | 4 | 4 | 4 | 3 | 4 | 2 | 4 | 3 | 5 | 3 | 4 |
| Staffing and work schedules | 5 | 1 | 5 | 3 | 4 | 5 | 4 | 4 | 4 | 4 | 5 | 4 | 4 | 4 | 4 | 5 | 1 | 5 | 2 | 5 | 4 | 5 | 3 | 5 |
| Shifts and overtime | 5 | 4 | 5 | 4 | 4 | 4 | 4 | 4 | 2 | 3 | 4 | 4 | 5 | 2 | 2 | 3 | 3 | 5 | 2 | 3 | 3 | 4 | 4 | 4 |
| Manual handling | 4 | 2 | 2 | 4 | 4 | 3 | 4 | 4 | 2 | 3 | 3 | 1 | 5 | 3 | 1 | 3 | 2 | 5 | 3 | 2 | 4 | 5 | 2 | 4 |
| Human System Interface | 3 | 4 | 4 | 3 | 4 | 4 | 1 | 4 | 4 | 4 | 4 | 3 | 2 | 4 | 3 | 5 | 2 | 5 | 4 | 3 | 3 | 4 | 4 | 4 |
| Design of controls | 3 | 1 | 4 | 4 | 4 | 4 | 1 | 3 | 2 | 5 | 2 | 4 | 4 | 4 | 3 | 5 | 2 | 5 | 5 | 3 | 3 | 4 | 3 | 3 |
| Displays | 3 | 2 | 4 | 3 | 3 | 3 | 1 | 4 | 5 | 4 | 4 | 3 | 2 | 4 | 4 | 5 | 3 | 5 | 4 | 3 | 3 | 4 | 4 | 5 |
| Field control panels | 3 | 1 | 3 | 3 | 5 | 3 | 1 | 3 | 4 | 3 | 5 | 2 | 2 | 4 | 3 | 5 | 2 | 5 | 2 | 3 | 2 | 4 | 4 | 5 |
| Tools (hand) | 3 | 5 | 4 | 2 | 3 | 4 | 2 | 4 | 4 | 4 | 5 | 5 | 1 | 4 | 2 | 4 | 2 | 4 | 5 | 3 | 4 | 4 | 3 | 3 |
| Equipment and valves | 4 | 4 | 4 | 1 | 4 | 3 | 3 | 4 | 4 | 4 | 5 | 3 | 2 | 4 | 2 | 4 | 2 | 4 | 2 | 3 | 3 | 4 | 3 | 3 |
| Task Environment | 4 | 3 | 4 | 4 | 4 | 4 | 3 | 2 | 1 | 4 | 4 | 4 | 2 | 2 | 2 | 5 | 2 | 4 | 2 | 3 | 4 | 5 | 2 | 2 |
| Lighting/Illumination | 3 | 3 | 3 | 3 | 5 | 4 | 3 | 2 | 2 | 3 | 2 | 3 | 5 | 2 | 2 | 4 | 2 | 4 | 2 | 4 | 4 | 4 | 3 | 2 |
| Temperatures | 3 | 3 | 3 | 3 | 5 | 4 | 4 | 2 | 1 | 3 | 5 | 3 | 1 | 2 | 2 | 5 | 3 | 3 | 2 | 4 | 4 | 5 | 2 | 3 |
| Noise | 3 | 3 | 3 | 3 | 5 | 3 | 4 | 3 | 3 | 4 | 5 | 4 | 4 | 1 | 2 | 5 | 5 | 3 | 2 | 3 | 4 | 5 | 3 | 3 |
| Vibration | 4 | 3 | 4 | 5 | 4 | 3 | 4 | 4 | 3 | 4 | 5 | 4 | 4 | 1 | 2 | 5 | 4 | 3 | 2 | 4 | 4 | 5 | 3 | 4 |
| Toxicity | 5 | 3 | 5 | 5 | 3 | 3 | 3 | 4 | 2 | 5 | 4 | 2 | 1 | 3 | 2 | 4 | 2 | 4 | 1 | 2 | 4 | 4 | 2 | 1 |
| Workplace Design | 3 | 5 | 3 | 3 | 4 | 4 | 3 | 5 | 1 | 4 | 4 | 3 | 4 | 4 | 2 | 5 | 3 | 3 | 2 | 3 | 3 | 5 | 3 | 2 |
| Facility layout | 2 | 3 | 3 | 4 | 3 | 4 | 3 | 5 | 2 | 4 | 4 | 3 | 4 | 5 | 1 | 4 | 3 | 3 | 2 | 4 | 3 | 4 | 3 | 1 |
| Workstation configuration | 3 | 3 | 2 | 2 | 5 | 3 | 3 | 3 | 2 | 5 | 4 | 4 | 5 | 3 | 2 | 4 | 4 | 3 | 3 | 4 | 3 | 4 | 3 | 3 |
| Accessibility | 5 | 4 | 3 | 4 | 5 | 4 | 2 | 4 | 5 | 5 | 3 | 2 | 5 | 3 | 2 | 4 | 4 | 4 | 3 | 4 | 2 | 3 | 3 | 3 |
| Control room | 2 | 4 | 2 | 4 | 4 | 5 | 3 | 3 | 2 | 4 | 4 | 4 | 5 | 3 | 2 | 5 | 2 | 3 | 2 | 2 | 4 | 4 | 3 | 1 |
| Operator Characteristics | 3 | 2 | 3 | 3 | 4 | 5 | 4 | 4 | 3 | 4 | 4 | 2 | 3 | 5 | 4 | 4 | 1 | 3 | 2 | 5 | 5 | 5 | 5 | 4 |
| Attention/motivation | 4 | 4 | 5 | 3 | 5 | 5 | 3 | 5 | 5 | 5 | 4 | 4 | 4 | 4 | 5 | 4 | 4 | 4 | 5 | 4 | 4 | 5 | 5 | 4 |
| Fitness for duty | 3 | 4 | 3 | 3 | 4 | 3 | 4 | 3 | 3 | 4 | 4 | 3 | 3 | 3 | 3 | 5 | 2 | 3 | 3 | 3 | 5 | 5 | 4 | 5 |
| Skills and knowledge | 1 | 1 | 3 | 2 | 2 | 3 | 5 | 2 | 2 | 3 | 3 | 1 | 2 | 4 | 2 | 2 | 1 | 2 | 2 | 2 | 2 | 2 | 2 | 2 |
| Chemical plant safety level valuation | 4 | 3 | 3 | 4 | 4 | 4 | 2 | 4 | 2 | 4 | 5 | 3 | 4 | 4 | 4 | 3 | 3 | 4 | 3 | 4 | 4 | 5 | 4 | 3 |
Appendix C
Actual safety level statistics.
| Safety Factor | The Level Proportion | Total | ||||
| S1 | S2 | S3 | S4 | S5 | ||
| Organization | 0% | 17% | 8% | 67% | 8% | 24 |
| Human factors and safety policy | 4% | 13% | 21% | 54% | 8% | 24 |
| Organizational culture | 0% | 8% | 29% | 58% | 4% | 24 |
| Management of change | 0% | 13% | 29% | 50% | 8% | 24 |
| Organizational learning (audit and reviews) | 0% | 13% | 63% | 21% | 4% | 24 |
| Line management and supervision | 0% | 17% | 21% | 54% | 8% | 24 |
| Information | 0% | 8% | 8% | 75% | 8% | 24 |
| Training | 0% | 0% | 0% | 75% | 25% | 24 |
| Procedures and procedure development | 0% | 4% | 46% | 42% | 8% | 24 |
| Communication | 0% | 4% | 29% | 46% | 21% | 24 |
| Labels and signs | 0% | 21% | 25% | 50% | 4% | 24 |
| Documentation | 0% | 8% | 21% | 63% | 8% | 24 |
| Job Design | 0% | 4% | 29% | 54% | 13% | 24 |
| Staffing and work schedules | 4% | 8% | 13% | 58% | 17% | 24 |
| Shifts and overtime | 0% | 17% | 21% | 54% | 8% | 24 |
| Manual handling | 17% | 25% | 21% | 29% | 8% | 24 |
| Human System Interface | 0% | 13% | 21% | 58% | 8% | 24 |
| Design of controls | 0% | 17% | 33% | 38% | 13% | 24 |
| Displays | 0% | 4% | 38% | 46% | 13% | 24 |
| Field control panels | 0% | 29% | 29% | 33% | 8% | 24 |
| Tools (hand) | 0% | 13% | 33% | 50% | 4% | 24 |
| Equipment and valves | 0% | 21% | 42% | 38% | 0% | 24 |
| Task Environment | 4% | 33% | 17% | 38% | 8% | 24 |
| Lighting/Illumination | 0% | 42% | 21% | 29% | 8% | 24 |
| Temperatures | 4% | 29% | 21% | 38% | 8% | 24 |
| Noise | 4% | 21% | 13% | 50% | 13% | 24 |
| Vibration | 4% | 17% | 17% | 54% | 8% | 24 |
| Toxicity | 8% | 25% | 17% | 46% | 4% | 24 |
| Workplace Design | 4% | 13% | 42% | 25% | 17% | 24 |
| Facility layout | 4% | 21% | 29% | 46% | 0% | 24 |
| Workstation configuration | 0% | 13% | 50% | 33% | 4% | 24 |
| Accessibility | 0% | 21% | 25% | 50% | 4% | 24 |
| Control room | 0% | 29% | 25% | 33% | 13% | 24 |
| Operator Characteristics | 4% | 17% | 17% | 38% | 25% | 24 |
| Attention/motivation | 0% | 0% | 13% | 33% | 54% | 24 |
| Fitness for duty | 0% | 8% | 42% | 29% | 21% | 24 |
| Skills and knowledge | 0% | 25% | 25% | 42% | 8% | 24 |
References
- Kwon, H.; Yoon, H.; Moon, I. Industrial applications of accident causation management system. Chem. Eng. Commun. 2006, 193, 1024–1037. [Google Scholar] [CrossRef]
- Mccafferty, D.B. Successful system design through integrating engineering and human factors. Process Saf. Prog. 1995, 14, 147–151. [Google Scholar] [CrossRef]
- Merten, H.; Johannesma, P.C.; Lubberding, S.; Zegers, M.; Langelaan, M.; Jukema, G.N.; Heetveld, M.J.; Wagner, C. High risk of adverse events in hospitalised hip fracture patients of 65 years and older: Results of a retrospective record review study. BMJ Open 2015, 5, e006663. [Google Scholar] [CrossRef]
- Martins, M.R.; Maturana, M.C. Human error contribution in collision and grounding of oil tankers. Risk Anal. 2010, 30, 674–698. [Google Scholar] [CrossRef]
- Williams, J.C. Data-Based Method for Assessing and Reducing Human Error to Improve Operational Performance; Human Factors and Power Plants: Monterey, CA, USA, 1988; pp. 436–450. [Google Scholar]
- Zhang, L.; He, X.; Dai, L.C.; Huang, X.R. The simulator experimental study on the operator reliability of qinshan nuclear power plant. Reliab. Eng. Syst. Saf. 2007, 92, 252–259. [Google Scholar] [CrossRef]
- Hollnagel, E. Cognitive Reliability and Error Analysis Method (Cream); Elsevier: Amsterdam, The Netherlands, 1998; pp. 262–275. [Google Scholar]
- Reer, B. Review of advances in human reliability analysis of errors of commission, part 1: Eoc identification. Reliab. Eng. Syst. Saf. 2008, 93, 1091–1104. [Google Scholar] [CrossRef]
- Woods, D.D.; Pople, H.E., Jr.; Roth, E.M. Cognitive environment simulation: A tool for modeling intention formation for human reliability analysis. Nucl. Eng. Des. 1992, 134, 371–380. [Google Scholar] [CrossRef]
- Chang, Y.H.J.; Mosleh, A. Cognitive modeling and dynamic probabilistic simulation of operating crew response to complex system accidents. Part 2: Idac performance influencing factors model. Reliab. Eng. Syst. Saf. 2007, 92, 1061–1075. [Google Scholar] [CrossRef]
- Moore, D.A. Security risk assessment methodology for the petroleum and petrochemical industries. J. Loss Prev. Process Ind. 2013, 26, 1685–1689. [Google Scholar] [CrossRef]
- Scott, D. Guidelines for analyzing and managing the security vulnerabilities of fixed chemical sites center for chemical process safety (ccps) of the american institute of chemical engineers. Process Saf. Environ. Prot. 2004, 82, 320. [Google Scholar] [CrossRef]
- Jaeger, C.D. Chemical facility vulnerability assessment project. J. Hazard. Mater. 2003, 104, 207–213. [Google Scholar] [CrossRef]
- America, L.U.S.O.; America, U.S.O. Method to assess the vulnerability of U.S. Chemical facilities. Bur. Justice Stat. 2002, 2, 2,1–27. [Google Scholar]
- Norman, T.L. Risk Analysis and Security Countermeasure Selection; CRC Press, Inc.: Boca Raton, FL, USA, 2015; pp. 412–420. [Google Scholar]
- Valérie, D.D.; Cécile, F. Aramis project: A more explicit demonstration of risk control through the use of bow-tie diagrams and the evaluation of safety barrier performance. J. Hazard. Mater. 2006, 130, 220–233. [Google Scholar]
- Christian, D.; Cécile, F.; Aurore, P.; Bruno, D. Aramis project: A comprehensive methodology for the identification of reference accident scenarios in process industries. J. Hazard. Mater. 2006, 130, 200–219. [Google Scholar]
- Cozzani, V.; Salzano, E. The quantitative assessment of domino effects caused by overpressure: Part i. Probit models. J. Hazard. Mater. 2004, 107, 67–80. [Google Scholar] [CrossRef]
- Clay, J.; Thompson, B. Issues in australian contaminated land risk assessment toxicology. J. Toxicol. Environ. Health Part A 2007, 70, 1635–1637. [Google Scholar] [CrossRef] [PubMed]
- Salvi, O.; Debray, B. A global view on aramis, a risk assessment methodology for industries in the framework of the seveso ii directive. J. Hazard. Mater. 2006, 130, 187–199. [Google Scholar] [CrossRef]
- Bruno, C. Implementation of new legislative measures on industrial risks prevention and control in urban areas. J. Hazard. Mater. 2006, 130, 293–299. [Google Scholar]
- Khakzad, N.; Khan, F.; Amyotte, P. Quantitative risk analysis of offshore drilling operations: A bayesian approach. Saf. Sci. 2013, 57, 108–117. [Google Scholar] [CrossRef]
- Argenti, F.; Landucci, G.; Reniers, G.; Cozzani, V. Vulnerability assessment of chemical facilities to intentional attacks based on bayesian network. Reliab. Eng. Syst. Saf. 2018, 169, 515–530. [Google Scholar] [CrossRef]
- Abimbola, M.; Khan, F.; Khakzad, N.; Butt, S. Safety and risk analysis of managed pressure drilling operation using bayesian network. Saf. Sci. 2015, 76, 133–144. [Google Scholar] [CrossRef]
- García-Herrero, S.; Mariscal, M.A.; García-Rodríguez, J.; Ritzel, D.O. Working conditions, psychological/physical symptoms and occupational accidents. Bayesian network models. Saf. Sci. 2012, 50, 1760–1774. [Google Scholar] [CrossRef]
- Zarei, E.; Azadeh, A.; Khakzad, N.; Aliabadi, M.M.; Mohammadfam, I. Dynamic safety assessment of natural gas stations using bayesian network. J. Hazard. Mater. 2017, 321, 830–840. [Google Scholar] [CrossRef]
- Khakzad, N.; Khan, F.; Amyotte, P. Dynamic safety analysis of process systems by mapping bow-tie into bayesian network. Process Saf. Environ. Prot. 2013, 91, 46–53. [Google Scholar] [CrossRef]
- MatAas, J.M.; Rivas, T.; MartAn, J.E.; Taboada, J. A machine learning methodology for the analysis of workplace accidents. Int. J. Comput. Math. 2008, 85, 559–578. [Google Scholar] [CrossRef]
- Lee, E.; Park, Y.; Shin, J.G. Large engineering project risk management using a bayesian belief network. Expert Syst. Appl. 2009, 36, 5880–5887. [Google Scholar] [CrossRef]
- Panopoulos, V.; Bougas, A.; Soto, B.D.; Adey, B.T. Using bayesian networks to estimate bridge characteristics in early road designs. Infrastruct. Asset Manag. 2022, 9, 40–56. [Google Scholar] [CrossRef]
- Ha, J.S.; Seong, P.H. A method for risk-informed safety significance categorization using the analytic hierarchy process and bayesian belief networks. Reliab. Eng. Syst. Saf. 2004, 83, 1–15. [Google Scholar] [CrossRef]
- Kariuki, S.G.; Vadillo, E.M.; Löwe, K. Human factors assessment technique for the chemical process industry. Chem. Eng. Technol. 2010, 30, 1319–1327. [Google Scholar] [CrossRef]
- Keshavarz, B.; Hecht, H. Validating an efficient method to quantify motion sickness. Hum. Factors 2011, 53, 415–426. [Google Scholar] [CrossRef]
- Kariuki, S.G.; Löwe, K. Increasing human reliability in the chemical process industry using human factors techniques. Process Saf. Environ. Prot. 2006, 84, 200–207. [Google Scholar] [CrossRef]
- Zelterman, D. Causality: Models, reasoning, and inference. Technometrics 2001, 43, 239–240. [Google Scholar] [CrossRef]
- Gopnik, A.; Schulz, L. Causal Learning: Psychology, Philosophy, and Computation; Oxford University Press: Oxford, UK, 2007; pp. 198–199. [Google Scholar]
Disclaimer/Publisher’s Note: The statements, opinions and data contained in all publications are solely those of the individual author(s) and contributor(s) and not of MDPI and/or the editor(s). MDPI and/or the editor(s) disclaim responsibility for any injury to people or property resulting from any ideas, methods, instructions or products referred to in the content. |
© 2023 by the authors. Licensee MDPI, Basel, Switzerland. This article is an open access article distributed under the terms and conditions of the Creative Commons Attribution (CC BY) license (https://creativecommons.org/licenses/by/4.0/).