Abstract
Traditional shaft-sealed centrifugal pumps exhibit problems, such as liquid leakage and reduced efficiency, due to mechanical seal failures. To address the issue, the bearingless direct-drive centrifugal pump system (BDDCPS) has been designed with bearingless motor technology. This may cause a new issue of rotor eccentricity displacement, which can lead to a reduction in pump performance. Compared to a stable state, the changes in characteristics, such as flow rate, head, and pressure, during the transient start-up process are more severe, increasing the likelihood of system failure and requiring greater attention. In order to ensure safety and reliable operation during the transient start-up process, this paper investigates the working principle of the BDDCPS and analyzes transient start-up characteristics with three different start-up methods. The external characteristics, pressure field distribution, velocity field distribution, and hydraulic losses analysis of the pump are determined for comparative analysis. Finally, it is found that the linear acceleration start-up method is the most suitable and efficient for the BDDCPS.
1. Introduction
The bearingless permanent magnet slice motor (BPMSM) is a new type of electric drive device, which not only has the advantages of magnetic bearings, including no mechanical contact, no wear, low noise, and a long life [1,2,3] but also the advantages of a permanent magnet motor, including a high power factor and a high-efficiency interval [4,5,6]. The structural design of a slice rotor effectively reduces the difficulties in controlling the system in the axial direction, and the system can successfully realize full suspension operation in 5-DOF [7,8]. The centrifugal pump system driven by this motor (named “BDDCPS”) can achieve leak-free and high-purity transportation of liquids, which meets the requirements for the sealing and handling of pure liquids in the fields of energy and chemicals, semiconductor manufacturing, biomedicine, etc. [9,10]. Therefore, the BDDCPS has great application value.
In today’s bearingless pump systems, which have successfully been launched on the market, a two-phase bearingless motor with a symmetrical configuration of the drive and bearing windings is used to actively control the impeller of the pump. In recent years, scholars from various countries have carried out some remarkable work in this field. Li et al. designed a highly integrated phase-power electronic digital controller and used it to control a 4 kW bearingless direct-drive centrifugal pump. The reliability of the constructed controller was verified with the results of operating parameters, such as speed, flow rate, and radial displacement, during the actual operation of the system [11]. Puentener et al. studied the effect of impeller geometry on the hydraulic performance and hemolysis performance of a bearingless direct-drive centrifugal pump. By increasing the radial clearance between the impeller and the pump head, the compatibility of the battery was improved [12]. Zhang et al. constructed a complete design guide for a bearingless direct-drive centrifugal pump. As the bearingless direct-drive centrifugal pump is a multivariable system, the system design should not only comprehensively consider the characteristics of the motor (torque output, passive control, active control) but also consider the output characteristics of the centrifugal pump. The authors constructed corresponding activity factors and evaluation functions as design indicators to provide a reference for other scholars to construct bearingless direct-drive centrifugal pumps [13]. Krishan et al. designed a bearingless built-in permanent magnet-slice motor for driving centrifugal pumps. Through finite element software, they explored the performance of various built-in rotors and sought the optimal rotor scheme with the goal of cogging torque and displacement fluctuation. Under the premise of maintaining the centrifugal pump specification unchanged, the magnetic stiffness of the system and the output capacity of both torque and suspension force were effectively improved [14]. Yang et al. proposed a novel centrifugal blood pump system driven by a homogeneous, bearingless switched reluctance slice motor. In this blood pump device, the permanent magnet on the pump head rotor was transferred to the stator of the motor, and the bias magnetic flux generated by the stator permanent magnet ring formed a closed vertical magnetic circuit with the pump head rotor; thus, it effectively improved the stiffness of the passive suspension and the radial positioning ability of the rotor [15].
Many such scholars have achieved great success in the aforementioned fields. However, there is relatively little research on the transient start-up process of the BDDCPS. This paper will discuss the three common acceleration methods for the motor start-up process: linear acceleration (constant acceleration), constant power acceleration, and soft start. It aims to find the most suitable and effective start-up method for the BDDCPS by examining and comparing the pump’s external characteristics, pressure field distribution, velocity field distribution, and hydraulic losses analysis under these three different start-up methods.
2. Methods
Figure 1 shows the structural system of the BDDCPS. The BDDCPS is composed of two parts: a bearingless permanent magnet slice motor and a centrifugal pump with an “L”-shaped vertical structure. There are two sets of windings on the stator, namely torque winding and suspension force winding. They are used to generate a suspension bias magnetic field. The rotor permanent magnet and centrifugal pump impeller are integrated and placed together in the rear chamber of the centrifugal pump, which is driven by the motor magnetic field for operation. A displacement sensor is installed in the air gap of the motor to detect the positional information of the impeller rotor. When the BDDCPS operates normally, the impeller rotor is in a magnetic levitation high-speed rotational state, which can realize shaftless rotation. The torque winding part of the BPMSM provides the power for pump rotation, and its torque winding part is equivalent to a regular permanent magnet synchronous motor. Therefore, the motion equation of BPMSM can be represented through the application of a permanent magnet synchronous motor, as follows:
where Te is electromagnetic torque; TL is load torque, which is the pump; J represents the moment of inertia; ωr represents rotor angular velocity; and pM is the torque winding’s pole pairs.

Figure 1.
System structure of the BDDCPS.
2.1. Axial Suspension Principle
When the permanent magnet thin rotor of the motor is flush with the center position of the stator teeth, the magnetic circuit in the air gap is shortest, and the magnetic resistance is at a minimum. When the permanent magnet rotor deviates or twists from the balance position due to external force interference, the air gap balance is broken, and the magnetic resistance increases. According to the “magnetic resistance minimum principle”, in order to minimize the magnetic resistance of the magnetic circuit, the magnetic field will generate a magnetic pulling force in the opposite direction of the external force, forcing the rotor to return to its equilibrium position.
As shown in Figure 2a, when the motor rotor deviates up and down at the equilibrium position, the electromagnetic force in the x direction after orthogonal decomposition is zero, the resultant force in the y direction is y0, and the magnetic force y0 pulls the rotor back to the equilibrium position.
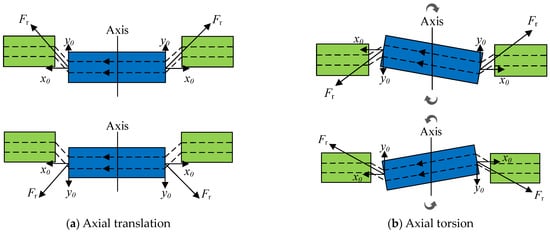
Figure 2.
Passive suspension principle of axial 3 degrees of freedom.
When the motor rotor occurs in the axial torsion, as shown in Figure 2b, the average air gap is changed; then, the electromagnetic force produces a torque in the opposite direction of motion to realize the return of the rotor. To sum up, it can be seen that the rotor can achieve passive suspension in the axial direction of 3 degrees of freedom based on the “magnetic resistance minimum principle”.
2.2. Radial Suspension Principle
Figure 3 shows the principle of radial suspension force production under the no-load condition. The motor combined 4-pole torque windings NMa, NMb and 2-pole suspension windings NBa, NBb in the same stator slots. The currents in the 4-pole torque windings generate 4-pole magnetic field ΨM, and the currents in the 2-pole suspension windings generate 2-pole magnetic fluxes ΨB. When the 4-pole magnetic field generated by torque windings and the 2-pole magnetic field generated by suspension windings interact with each other, the flux’s density in the negative direction of the x-axis increases, but the flux’s density in the direction of the x-axis decreases. Therefore, the unbalanced gap flux density results in the production of the radial force Fx in the negative x-direction. In addition, another 2-pole suspension winding, which is perpendicular to windings, can produce the radial force in the y-direction. Therefore, the size and direction of the radial suspension force can be controlled by controlling the size and direction of the current of the suspension windings, and the stable operation of the motor can also be realized [16,17].

Figure 3.
Principle of radial force generation. Red circles mean 2-pole suspension windings NBa, NBb. Black circles mean 4-pole torque windings NMa, NMb.
2.3. Three-Dimensional Model of the BDDCPS
In the BDDCPS, the impeller rotor mainly relies on the magnetic field of BPMSM for suspension. After the above verification, the BPMSM can control the movement of the impeller reliably and effectively. This is the usual situation when the system runs a stable operation after the start-up process. BDDCPS is a multivariable, nonlinear, and strongly coupled system. Realizing the dynamic equilibrium of the impeller rotor not only simplifies the difficulties of calculation and decoupling but is also the key to ensuring smooth operation of the system. Compared to stable operation, parameters such as flow rate, head, pressure field distribution and velocity field distribution will change dramatically in a short time during the start-up process. Because the BDDCPS adopts a special structure of magnetic suspension, the strong and dramatic changes mentioned above can cause excessive hydraulic impact, leading to significant displacement of the impeller rotor [18,19]. It is a fatal problem that can cause a severe collision between the impeller and the pump casing, unnecessary impeller wear, deteriorating system performance, and reductions in service life [20]. In particularly severe cases, there is a risk of device suspension failure, leading to system collapse. This is catastrophic for the semiconductor manufacturing industry, which aims for precision, and for the biomedical field, where safety comes first. Only by addressing these issues can BDDCPS make progress in the aforementioned fields. Therefore, it is crucial to maintain smooth changes in the BDDCPS during the start-up process within a short time. In other words, uniform changes in external characteristics, pressure fields and velocity fields are crucial during the start-up process. In order to ensure that the centrifugal pump can smoothly start the pump, this paper set three different start-up methods to discover the optimum operation of the pump start-up method.
The characteristic parameters of the pump are shown in Table 1. The model pump is a single-stage single-suction centrifugal pump, with clean water as the flow medium and a density of ρ = 1000 kg/m3.

Table 1.
Design parameters of centrifugal pump.
By referring to the relevant empirical design formulas in the “Modern Pump Theory and Design” [21], the reference external dimensions of each component of the pump can be calculated. The parameters are shown in Table 2.

Table 2.
Structural parameters of the pump.
According to the structural parameters described in Table 2, a three-dimensional model of the flow-field calculation domain of the centrifugal pump is constructed using the mechanical design software, UG 12.0. The main components include the impeller, volute, pump chamber, inlet and outlet, and its extension section. Considering that the permanent magnet rotor and centrifugal pump impeller of BPMSM are integrated structures, the rear chamber of the centrifugal pump has been redesigned. The rear chamber is slightly longer than the axial length of the permanent magnet rotor to facilitate the placement of the permanent magnet rotor. The model pump is equipped with an inlet extension section of 6 times the pipe diameter and an outlet extension section of 8 times the pipe diameter. The three-dimensional model of the entire centrifugal pump flow field is shown in Figure 4. The radial eccentric displacement of the rotor is shown in Figure 5. The black circle indicates that the rotor is in the center position. The red circles show the position of the rotor at the maximum displacement of the X-axis. The maximum radial eccentric displacement is 3 mm, the diameter of the spiral casing base circle is 78 mm, and the outlet diameter of the impeller is 70 mm. This means that the minimum gap between the impeller and pump head is 1 mm.
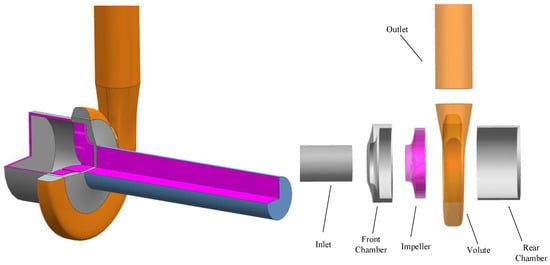
Figure 4.
Computational domain model for centrifugal pumps.

Figure 5.
Radial eccentric displacement of the rotor. The red circle shows the position of the rotor at the maximum displacement of the X-axis. The black line represents the center position of the rotor.
2.4. Numerical Calculation
Due to the non-uniform spatial distribution of the internal flow field of the pump, the turbulent and irregular flow characteristics may make it difficult to directly solve the N-S equation (the most basic fluid motion equation). Therefore, the turbulence model is introduced to study this issue.
According to the number of differential equations, turbulence models can be divided into two equation models, one equation model, and zero equation models. Among them, the series k-ε (standard k-ε, RNG k-ε, and realizable k-ε) and series k-ω (standard k-ω and SST k-ω) are widely used in the numerical calculation of fluid machinery.
Considering that the internal flow of the pump is three-dimensional and involves high Reynolds number turbulence, this study needs a stable and widely applicable turbulence model. The standard k-ε model can predict complex fluid length scale distributions and solve the turbulent stresses through the two equations of turbulent kinetic energy and dissipation rate [22]. At the same time, the standard k-ε is widely used for solving engineering flow field problems because of its good efficiency and economy. Therefore, the standard k-ε model is selected to simulate the transient start-up process of the pump.
Assuming that the flow inside the pump is the fully developed turbulent flow, ignoring the molecular viscosity characteristics, the turbulent viscosity μt is expressed as follows:
The turbulent kinetic energy k and dissipation rate ε can be expressed, respectively, as follows:
where Gk is the turbulent kinetic energy generated by the average velocity gradient; Gb is the turbulent kinetic energy generated by buoyancy; Ym is the effect of turbulent pulsation expansion on the total dissipation rate; uj is the velocity of flow; C1ε, C2ε, C3ε are 1.44, 1.92, and 0.09, respectively; Cμ, σk and σε are 0.09, 1.0 and 1.3, respectively [23].
The grid is the foundation of discretization of the control equation space, and grid independence verification is an effective way to test whether the number of grids affects the calculation results of the model. The ICEM-CFD module in ANSYS 2021R2 software was used to complete the grid division of each calculation domain of the model pump. Considering the significant degree of distortion in the blade structure and the complexity of the structure at the volute tongue, tetrahedral unstructured grids are selected for the two main flow components of the model pump, as shown in Figure 6. The mesh refinement is performed on the tongue area of the volute.
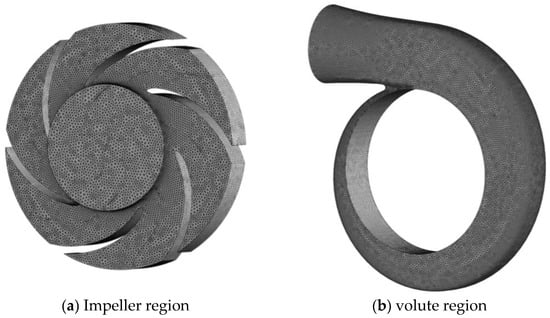
Figure 6.
Mesh of impeller and volute in centrifugal pump.
To verify the independence of the grid, this paper has established 5 sets of grid models with different numbers and has analyzed the calculation results of head and efficiency, as shown in Table 3. When the total number of grids is over 6.34 million, there is no significant difference in the efficiency calculation results. The amplitude of head change tends to stabilize with the increase in grid numbers; here, the amplitude of head change is less than 2%. The impact of grid differences on the calculation results can be ignored. Considering the limited computing resources, the total number of grids selected for the model pump in this study is 6.34 million.

Table 3.
Mesh independence verification.
ANSYS CFX 2021R2 software was used to conduct unsteady numerical simulations of the transient start-up process of the model pump. The pressure inlet p is set to 1 atm, and the mass flow outlet ms to 3.8888 kg/s. The surfaces of the blade and the front of the impeller, as well as the surfaces of the blade and the rear cover plates of the impeller, are designated as rotating wall surfaces. The wall surfaces of the stationary components are assigned non-sliding wall conditions. The dynamic and static interfaces are set at the intersection of the rotating and stationary domains, specifically between the impeller and the volute, the impeller and the rear chamber, and the impeller and the inlet section. The frozen rotor connection mode is utilized. For its wide applicability and high stability, the standard k-ε turbulence model is chosen for subsequent research. In the ‘Global Initialization’ module of the ANSYS CFX software, the initial speed and initial time were set to zero to define the initialization conditions. The residual convergence accuracy of the simulation is 10−4, with a time step of 4° rotation (i.e., 0.0001111 s). It simulates 22 rotation cycles, resulting in a total duration of 0.2199978 s.
3. Results and Discussion
During the start-up process of the centrifugal pump, the rotational speed accelerates rapidly from a standstill to its final speed; meanwhile, the flow rate and total dynamic pressure rise are boosted accordingly. Since a change in the speed of the pump is the transient cause leading to variation in the pressure and flow velocity [24], it is necessary to set different speed change strategies to explore the characteristics of the transient start-up process.
3.1. External Characteristic Analysis
The user-defined function CEL in ANSYS CFX software was used to write the speed variation pattern, achieving accurate descriptions of the impeller speed rise process. The function of speed is as follows:
where Nt is transient speed; n = 6000 r/min is the rated speed; Ttol is star-up time (i.e., the time when the impeller speed rises to the rated speed); t is the total calculation time. And step(x) is a piecewise function, when x > 0, step(x) = 1; when x = 0, step(x) = 0.5; when x < 0, step(x) = 0.
There are three common acceleration methods during the motor start-up process: linear acceleration (constant acceleration), constant power acceleration, and soft start. To simulate these three start-up methods, simple mathematical function models were established. The first type of speed–time curve is a straight line, the second type of speed–time curve is similar to a parabola that quadratically functions downwards along the opening, and the third type of speed–time curve is similar to a parabola that quadratically functions upwards along the opening. For the sake of facilitating a more intuitive comparison, this paper has simplified the quadratic function by setting the time required to reach the set speed from zero to be consistent with the linear equation. The CEL expressions for the three start-up methods are as follows:
where time = t/1[s] and ns =n · [revmin−1] are the dimensionless processing of time and speed variables.
According to the simulation results of the motor control system, it can be seen that under the load of a centrifugal pump, the time required for the motor speed to rise from zero to 6000 r/min was 0.07 s, so Ttol = 0.07 s.
Figure 7 shows the variation in the speed and head of the centrifugal pump with time under the three start-up methods. Figure 7a shows that at any time during the start-up process of the centrifugal pump, the speed of method 2 is higher than that of method 1 and method 3. What is more, the speed growth rate of method 2 is the highest among the three start-up methods. From Figure 7b, it can be seen that during the start-up process from 0 to 0.07 s, the transient head of both methods 1 and 2 show a gradually increasing trend, while the transient head of method 3 shows a slow decrease and then a rapid increase. Method 3 reaches the minimum head value at t = 0.05 s and then begins to rise sharply. The head growth rate of method 3 during the period from t = 0.05 s to t = 0.07 s is significantly faster than the other two methods. In addition, the curve of method 3 intersects with the curves of method 1 and method 2. Before t = 0.02 s, the transient head of method 3 is the largest among all the methods, and after t = 0.025 s, the transient head of method 3 is the smallest among all the methods. Method 2 first reaches the design value of the head, followed by method 1, then method 3. When the pump runs to the rated speed, the transient heads of all three methods are greater than the design value. The reason is that the transient head of the pump includes the head under stable operating conditions and the additional head generated by inertia during the acceleration process. Because the additional head has been taken into consideration, the calculated head during the transient start-up process of the centrifugal pump is slightly higher than the designed value.
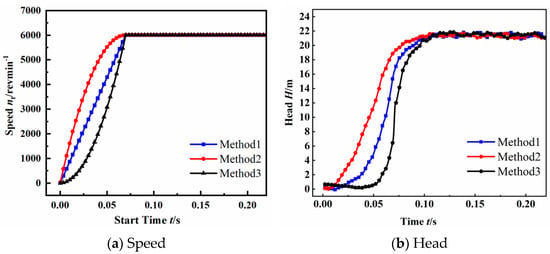
Figure 7.
Characteristic curves of speed and head in three types of start-up method.
According to references [25,26], it is both fundamental and necessary to clarify the relationship between the pump flow and head, as well as flow and efficiency, when specifying the pump of study. The relevant curves studied in this paper are shown in Figure 8.
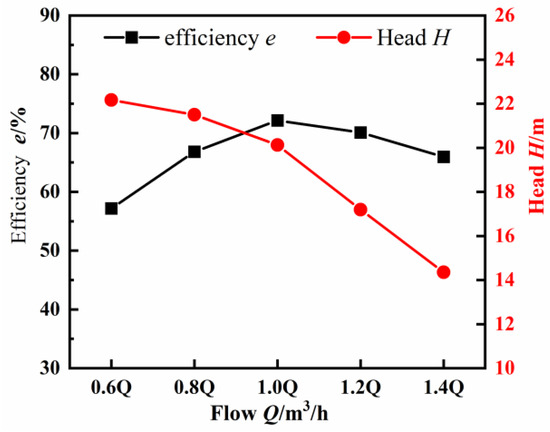
Figure 8.
Flow–head and flow–efficiency curves of centrifugal pump in different flow rates.
In Figure 8, the pump efficiency shows a pattern of initially increasing and then decreasing. The highest efficiency value is observed at the design flow rate (i.e., 1.0 Q), which is approximately 72.3%. There exists a linear relationship between the flow rate and the head, with the head showing a decreasing trend as the flow rate increases. By analyzing the differences in the head between different flow rates, it can be noted that the change in head between 0.6 Q and 1.0 Q is smaller than that between 1.0 Q and 1.4 Q. Consequently, it can be concluded that an increase in flow rate has a significant impact on the head.
3.2. Pressure Field Analysis
Pressure field analysis assesses the pressure distribution on the impeller and volute section at six moments during the transient start-up process. The six moments are: tA = 0.0199998 s, tB = 0.0399996 s, tC = 0.059994 s, tD = 0.0699993 s, tE = 0.07999992 s, and tF = 0.119988 s. The specific results of pressure distribution in three types of start-up method are shown in Figure 9a–f.
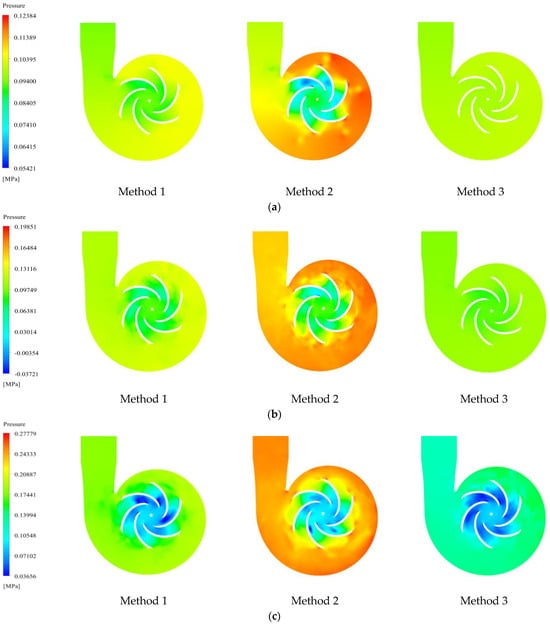

Figure 9.
Result of pressure distribution in three types of start-up method at different times. (a) The result of pressure distribution in three types of start-up method at tA time. (b) The result of pressure distribution in three types of start-up method at tB time. (c) The result of pressure distribution in three types of start-up method at tC time. (d) The result of pressure distribution in three types of start-up method at tD time. (e) The result of pressure distribution in three types of start-up method at tE time. (f) The result of pressure distribution in three types of start-up method at tF time.
At time tA of the start-up process, the section pressure of method 2 is the highest, and of method 3 is the lowest. The pressure distribution at the impeller and volute section of method 1 and method 3 is relatively uniform, and a clear pressure gradient appears in the section of method 2. The pressure on the impeller section of all methods gradually increases from the inlet to the outlet direction of the impeller, but method 2 shows a small area of low-pressure zone in the upper half of the impeller section. At time tB, the pressure distribution on the impeller and volute section of all methods is uniform in space. By comparison with the previous moment, it can be said that the pressure gradient of method 2 is less than that at time tA. There is no low-pressure zone in the upper half of the impeller section. The pressure value of method 3 has increased compared to time tA. At time tC, the pump is at the stage of the speed rising rapidly, and the pressure gradient of the impeller section in method 1 and method 2 has increased compared with tB time. However, at the same time, there is an uneven pressure distribution in the blade section of method 1, and a large low-pressure area appears at the impeller inlet, with a low-pressure area concentrated in the upper half of the impeller section. In method 2, the pressure distribution at the same radius is more uniform than in method 1, but there is still a small amount of low-pressure zone in the lower half of the impeller section. At time tD, the pump has completed the transient start-up process. It is evident that the cross-sectional pressure between the impeller and volute of the pump started in method 1 and method 3 increases significantly compared to the previous moment, while the cross-sectional pressure between the impeller and volute of method 2 does not change much compared to the previous moment. The trend of this change is mainly related to the start-up characteristics of method 2. In the early stage of the pump start-up process, the speed of method 2 increases rapidly, but the speed of increase gradually slows down near the start-up time. At time tE, the pump completes the transient start-up process, but its operation is not smooth, and the pressure distribution between the impeller and the volute section under the three methods is still different. The cross-sectional pressure of the volute in method 3 is the lowest among all, while the cross-sectional pressure of the volute in method 2 is the highest, and the outlet section of the volute had developed into a relatively high-pressure zone. At time tF, the pump completes the transient start-up process and realizes a smooth operation. The pressure distribution at the impeller and volute section under all methods is, in essence, consistent, and the outlet section of the volute develops into a high-pressure zone with little difference in pressure values. The pressure difference only exists in the area of the low-pressure zone at the blade inlet of the impeller section. Among them, method 3 has the largest low-pressure area, method 1 has the smallest low-pressure area, and method 2 is in between the two methods.
To further analyze the distinctions among the three start-up methods, a reference point was chosen at the impeller’s edge in the 12 o’clock direction. There is not much difference between the three methods from time tE to time tF. Meanwhile, before time tD, there were significant differences.
As shown in Table 4, the values of method 2 are higher than the other two methods at each stage. At time tC, the pressure changes are the most significant, each increasing by 55.5%, 56.4%, and 61.43% compared to the previous moment. It also confirms that method 1 possesses the smoothest changes. At time tD, when the pump has completed the transient start-up process, the pressure value of method 2 is 22.3% higher than method 1 and 25.9% higher than method 3.

Table 4.
Pressure in three methods at different times.
3.3. Velocity Field Analysis
The six time points which were described in Section 3.2 were selected to analyze the flow field velocity distribution characteristics of the pump under three start-up methods. The specific results are shown in Figure 10a–f.
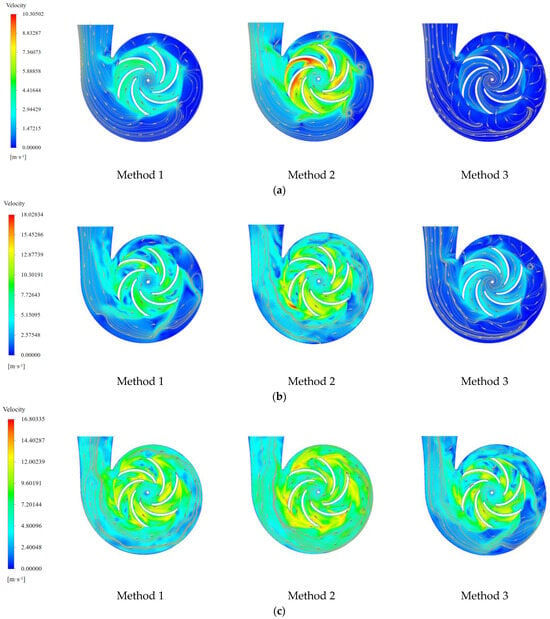

Figure 10.
Result of velocity distribution in three types of start-up method at different times. (a) The result of velocity distribution in three types of start-up method at tA time. (b) The result of velocity distribution in three types of start-up method at tB time. (c) The result of velocity distribution in three types of start-up method at tC time. (d) The result of velocity distribution in three types of start-up method at tD time. (e) The result of velocity distribution in three types of start-up method at tE time. (f) The result of velocity distribution in three types of start-up method at tF time.
At time tA of the start-up process, the velocity distribution of the three methods is quite different. The velocity on the impeller section of method 2 is the highest of the three, followed by method 1, and method 3 is the lowest. The reason is that method 2 is the quadratic function change law with the opening downwards. At the initial stage of the pump start-up, the head and flow increased rapidly, and a high speed would be achieved in a short time. Therefore, the relative velocity distribution at the impeller section of method 2 appeared obviously asymmetrical. The high-velocity area is concentrated at the position where the impeller section is near to the volute tongue. Due to the impeller at the relative velocity gradient being larger, a clear vortex is generated at the exit position of the blade. Compared with method 2, the velocity distribution at the impeller section of method 1 and method 3 is more uniform. At time tB, uneven velocity distribution begins to appear on the impeller section of method 1, and a relatively low-velocity zone appears in the blade region. A vortex is generated in the volute, and the flow state is poor. In contrast to the initial moments, the rate of speed and flow that increased during the start-up of method 2 gradually decreases over time. Therefore, the velocity of the impeller section presents a symmetrical distribution, with velocity increasing evenly from the inlet to the exit of the impeller channel. However, due to the unstable operation of the pump at this time, there is still a small amount of vortex in the outlet section of the volute. At time tC, the velocity distribution of the impeller and volute region in method 3 presents obvious asymmetry. Through the analysis of the characteristics of the start-up methods, it can be said that the pump that started with method 3 is in the situation of a slow growth in speed and flow in the first two stages; therefore, the velocity field distribution in the first two stages is not different. Then, it comes to time tC, where the pump is in a stage of rapid growth in speed and flow, resulting in a large velocity gradient at the impeller section. At time tD, in method 1, the velocity around the impeller starts to show a uniform increase compared with the previous time. The rate of velocity growth around the impeller during the start-up of method 2 is slightly slower compared to the previous instance. In contrast, the velocity growth rate around the impeller in method 3 experiences a sharp increase, resulting in a relatively high-velocity zone at the impeller blade outlet. Moreover, under the same radius scale, the velocity distribution at the blade position is uneven. This phenomenon corresponds to the speed curve in Figure 7. At 0.07 s, it is obvious that the speed increase rate of method 2 is the highest, followed by method 1, and method 3 is the lowest. After the time of tE, the pump completes the transient start-up process, and there is little difference in the velocity distribution between the impeller and volute region under the three start-up methods.
To further analyze the distinctions among the three start-up methods, a reference point was chosen at the impeller’s edge in the 12 o’clock direction. As in Section 3.2, there is no significant difference among the three methods at both time tE and time tF. Consequently, it is necessary to concentrate on the velocity field from tA to time tD.
As shown in Table 5, the values of method 2 are higher than the other two methods at each stage. While the drastic changes in velocity values for the three methods occur at different times, method 1 exhibits a relatively consistent pattern. Method 2 experiences the most significant variations at time tB, with a 7.0921 m/s increase compared to the previous moment, while method 3 displays the most significant changes at tD, with a 6.0794 m/s increase compared to the previous moment. At time tD, when the pump has completed the transient start-up process, the velocity value of method 2 is 21.4% higher than method 1 and 8.2% higher than method 3.

Table 5.
Velocity in three methods at different times.
3.4. Hydraulic Losses Analysis
Hydraulic losses not only reflect the efficiency of the pump but can also indirectly support the analysis presented earlier. The flow components of a centrifugal pump mainly include the inlet pipe, impeller, volute casing, pump chamber, and outlet pipe. Considering the special structure of BDDCPS used in this study, the combined analysis of the pump chamber structure and volute casing structure was conducted to determine the hydraulic losses situation.
As is well known, liquid encounters friction, turbulence, and other resistances inside the pump, resulting in energy losses, known as hydraulic losses. The higher the hydraulic losses, the lower the energy conversion efficiency of the liquid within the centrifugal pump and the corresponding decrease in the head. Under the conditions of constant liquid viscosity and flow rate, in a sense, the head losses are highly intuitively variable, reflecting the hydraulic losses. Moreover, this relationship is positively correlated. Therefore, this paper uses head losses as the criterion to explore the impact of different start-up methods on the transient hydraulic performance of the centrifugal pump.
Figure 11 shows the head losses of various components of the pump under three different start-up methods during the entire calculation period. The analysis reveals that the head losses of the pump are mainly concentrated in the volute casing and impeller regions. Among them, the head losses in the volute casing region are the highest, followed by the impeller region, then those in the outlet pipe region are the lowest. The highest head losses in the volute casing are not only due to the dynamic interference between the impeller and volute casing but are also closely related to the unique structure of the pump. The impeller and the permanent magnet rotor of the motor are integrated and suspended together in the rear chamber of the pump. Therefore, it is necessary to add a rear chamber to accommodate the permanent magnet rotor. Compared with the conventional centrifugal pump structure, the axial length of the rear chamber in this study is longer. After the fluid passes through the impeller, a small portion enters the rear chamber and accumulates inside. When the impeller rotates, it continuously collides with the pump chamber wall, resulting in chaotic flow and increasing hydraulic losses.
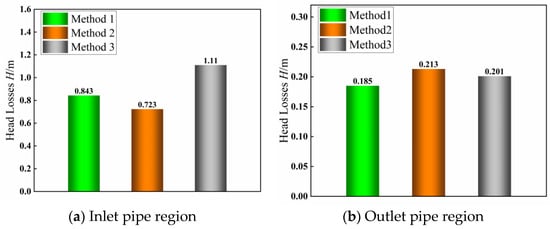
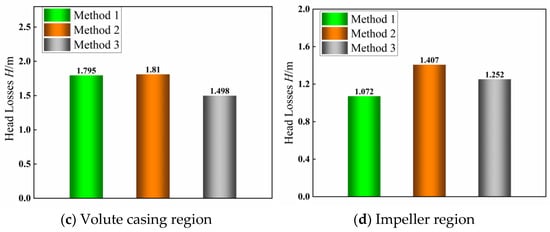
Figure 11.
Hydraulic losses of centrifugal pump in three types of start-up method.
Regarding the different start-up methods, in the volute casing region, method 2 has the highest head losses, followed by method 1, and method 3 has the lowest head losses. In the impeller region, method 2 has the highest head losses, followed by method 3, and method 1 has the lowest head losses. In summary, head losses of these three methods are 3.895 m, 4.153 m, and 4.061 m, respectively. Method 1 is still the lowest. To further analyze this phenomenon, this study calculates the head losses of all flow components of the pump and determines the percentage of loss in each region, as shown in Figure 12. Figure 12 shows that among the three transient start-up methods, both the impeller region and the outlet pipe region exhibit lower head losses in method 1 when compared to the other two start-up methods. Furthermore, the total head losses in method 1 are also lower than the other two methods. It indicates that the total hydraulic losses in method 1 are also the lowest, highlighting its superior efficiency. It is, therefore, obvious that method 1 stands out as the most efficient option.
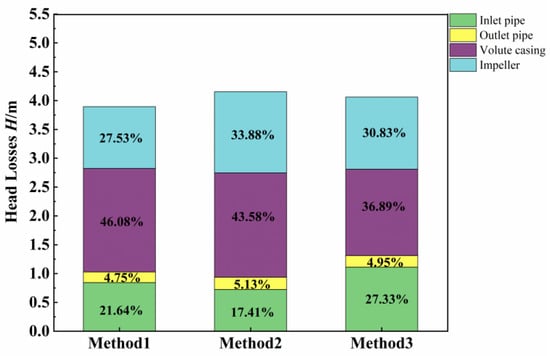
Figure 12.
Proportion of losses of each component in the pump.
4. Conclusions
The transient start-up process is in high demand in chemical engineering, nuclear energy, and other fields. The research content of this paper, especially the study of flow characteristics during the transient start-up process, may provide assistance for subsequent exploration.
In this paper, the 3D simulation model of the centrifugal pump was established, and the analysis of the transient start-up process of BDDCPS was completed. Non-constant numerical simulations were carried out for the pump in three transient start-up processes, and external characteristics, pressure field distribution, velocity field distribution, and hydraulic losses were obtained for comparative analysis. The conclusions were as follows:
- (a)
- External characteristic analysis showed that there was a strong correlation between the transient head changes and the speed. In the early stage of start-up, the transient head of method 1 and method 2 showed a gradually increasing trend, and the transient head growth rate of method 2 was greater than that of method 1. Method 3 experienced a phenomenon of the transient head slowly decreasing and then sharply increasing during the initial start-up process.
- (b)
- Pressure field analysis indicated that the pressure value of method 2 was the highest and that of method 3 was the lowest. With the three start-up methods, the internal pressure of the pump gradually increased with the duration of the operation, but the pressure change trends of the three were different. Method 2 developed into a high-pressure zone in a short period of time. Meanwhile, with method 3, the pressure was relatively low in the early stage of the start-up process, and then the pressure increased rapidly. Method 1 showed a uniform increase in the change pattern. At time tC, the pressure changes are the most significant, each increasing by 55.5%, 56.4%, and 61.43% compared to the previous moment. At time tD, when the pump has completed the transient start-up process, the pressure value of method 2 is 22.3% higher than method 1 and 25.9% higher than method 3. It was obvious that the pressure change trends of the three methods were related to the start-up characteristics.
- (c)
- Velocity field analysis expressed that at any time during the start-up process, the velocity distribution of the three start-up methods was quite different. The velocity on the impeller section of method 2 was the largest of the three, followed by method 1, and method 3 was the lowest. At the early stage of the start-up process, the speed and flow in the pump increased rapidly, and the velocity distribution of the impeller section showed obvious asymmetry. At the same radius scale, a high-velocity area appeared near the volute tongue, and the velocity gradient from the inlet section to the outlet section of the blade was steep. When the pump has completed the transient start-up process, the velocity value of method 2 is 21.4% higher than method 1 and 8.2% higher than method 3. When it finished the start-up process, the velocity distribution of the impeller section under the three start-up methods showed little difference, and the asymmetry of the velocity distribution was improved.
- (d)
- Hydraulic losses analysis revealed that during all three start-up processes, hydraulic losses were mainly concentrated in the volute casing and impeller regions. In summary, for method 1, the hydraulic losses were 0.258 m less than method 2 and 0.166 m less than method 3. Therefore, method 1 was the most efficient start-up method for the BDDCPS.
Above all, conclusions can be drawn, as shown in Table 6. It was obvious that method 1 exhibited uniform variations in all external characteristics, pressure field, and velocity field. It also had the lowest hydraulic losses. It indicated the most stable hydraulic performance impact and comfortable external environment. It was an ideal start-up process for BDDCPS. Taking all factors into consideration, method 1 (i.e., linear start-up method) was the most suitable for BDDCPS. Method 2 showed the most significant variations in all analyses, including external characteristics, velocity field, and pressure field. It also had the highest hydraulic losses. This was a terrible and fatal state for the BDDCPS. Therefore, it was not a suitable method for BDDCPS. Method 3 had the smallest velocity distribution, but the head and pressure field presented a trend of first decreasing and then sharply increasing. It led to system instability. It also resulted in relatively high hydraulic losses. Similarly, it was also not a suitable method for BDDCPS.

Table 6.
Performance of three different start-up methods.
Author Contributions
Conceptualization, E.X. and R.Z.; methodology, X.C.; software, X.C.; validation, E.X. and R.Z.; formal analysis, J.S and X.C.; investigation, J.S. and X.C.; resources, J.S.; data curation, J.S.; writing, original draft preparation, E.X.; writing, review and editing, R.Z.; visualization, J.S.; supervision, R.Z.; project administration, R.Z.; funding acquisition, R.Z. All authors have read and agreed to the published version of the manuscript.
Funding
This work was supported by the National Natural Science Foundation of China (Grant NO. 52176038), and Key R & D projects in Jiangsu Province (BE2021073).
Data Availability Statement
All data are available in the manuscript.
Conflicts of Interest
The authors declare no conflict of interest.
References
- Chiba, A.; Deido, T.; Fukao, T.; Rahman, M.A. An analysis of bearingless AC motors. IEEE Trans. Energy Convers. 1994, 9, 61–68. [Google Scholar] [CrossRef]
- Pei, T.; Li, D.; Liu, J.; Li, J.; Kong, W. Review of Bearingless Synchronous Motors: Principle and Topology. IEEE Trans. Transp. Electrif. 2022, 8, 3489–3502. [Google Scholar] [CrossRef]
- Wang, Z.; Cao, X.; Deng, Z.; Li, K. Modeling and Characteristic Investigation of Axial Reluctance Force for Bearingless Switched Reluctance Motor. IEEE Trans. Ind. Appl. 2021, 57, 5215–5226. [Google Scholar] [CrossRef]
- Garcia, C.; Rodriguez, J.; Odhano, S.; Zanchetta, P.; Davari, S.A. Modulated Model Predictive Speed Control for PMSM Drives. In Proceedings of the IEEE International Conference on Electrical Systems for Aircraft, Railway, Ship Propulsion and Road Vehicles (ESARS)/International Transportation Electrification Conference (ITEC), Nottingham, UK, 7–9 November 2018. [Google Scholar]
- Korpe, U.U.; Gokdag, M.; Koc, M.; Gulbudak, O. Modulated Model Predictive Control of Permanent Magnet Synchronous Motors with Improved Steady-State Performance. In Proceedings of the IEEE 3rd Global Power, Energy and Communication Conference (IEEE GPECOM), Electr Network, Antalya, Turkey, 5–8 October 2021; pp. 67–72. [Google Scholar]
- Morel, F.; Lin-Shi, X.; Retif, J.-M.; Allard, B.; Buttay, C. A Comparative Study of Predictive Current Control Schemes for a Permanent-Magnet Synchronous Machine Drive. IEEE Trans. Ind. Electron. 2009, 56, 2715–2728. [Google Scholar] [CrossRef]
- Decheng, F.; Huangqiu, Z.; Yukun, S. Decoupling control of 5 degree-of-freedom bearingless permanent magnet synchronous motor based on/spl alpha/-th order inverse system method. In Proceedings of the 2005 International Conference on Electrical Machines and Systems, Nanjing, China, 27–29 September 2005; Volume 301, pp. 300–305. [Google Scholar]
- Xiaodong, S.; Huangqiu, Z.; Tao, Z. Nonlinear decoupling control for 5 degrees-of-freedom bearingless permanent magnet synchronous motor. In Proceedings of the 2009 IEEE 6th International Power Electronics and Motion Control Conference, Wuhan, China, 17–20 May 2009; pp. 1842–1847. [Google Scholar]
- Song, X.; Jiancheng, F.; Bangcheng, H. High-precise Rotor Position Detection for High-speed Surface PMSM Drive based on Linear Hall-effect Sensors. IEEE Trans. Power Electron. 2015, 31, 4720–4731. [Google Scholar] [CrossRef]
- Takabi, J.; Khonsari, M.M. On the thermally-induced seizure in bearings: A review. Tribol. Int. 2015, 91, 118–130. [Google Scholar] [CrossRef]
- Qinan, L.; Boesch, P.; Haefliger, M.; Kolar, J.W.; Dehong, X. Basic characteristics of a 4kW permanent-magnet type bearingless slice motor for centrifugal pump system. In Proceedings of the 2008 International Conference on Electrical Machines and Systems, Wuhan, China, 17–20 October 2008; pp. 3037–3042. [Google Scholar]
- Puentener, P.; Schuck, M.; Kolar, J.W. The Influence of Impeller Geometries on Hemolysis in Bearingless Centrifugal Pumps. IEEE Open J. Eng. Med. Biol. 2020, 1, 316–323. [Google Scholar] [CrossRef] [PubMed]
- Zhang, Y.F.; Hu, L.; Su, R.; Ruan, X.D. Design Method of Bearingless Permanent Magnet Slice Motor for Maglev Centrifugal Pump Based on Performance Metric Cluster. Actuators 2021, 10, 153. [Google Scholar] [CrossRef]
- Kant, K.; Weinreb, B.S.; Hegy, M.; Gartner, M.; Trumper, D.L. A novel bearingless interior permanent magnet slice motor for pump. In Proceedings of the 9th IFAC Symposium on Mechatronic Systems (MECHATRONICS)/16th International Conference on Motion and Vibration Control (MoViC), University of California Los Angeles, Los Angeles, CA, USA, 6–9 September 2022; pp. 323–328. [Google Scholar]
- Yang, R.; He, Z.; Sugita, N.; Shinshi, T. Low-Cost and Compact Disposable Extracorporeal Centrifugal Blood Pump Utilizing a Homopolar Bearingless Switched Reluctance Slice Motor. IEEE Access 2023, 11, 24353–24366. [Google Scholar] [CrossRef]
- Noh, M.; Gruber, W.; Trumper, D.L. Hysteresis Bearingless Slice Motors with Homopolar Flux-Biasing. IEEE/ASME Trans. Mechatron. 2017, 22, 2308–2318. [Google Scholar] [CrossRef]
- Zhu, H.; Li, F. Optimization Design of Bearingless Permanent-Magnet Slice Motor. IEEE Trans. Appl. Supercond. 2016, 26, 5202804. [Google Scholar] [CrossRef]
- Tao, T. Direct Displacement Control of Bearingless Permanent Magnet Slice Motor Rotor. In Proceedings of the 2020 International Conference on Urban Engineering and Management Science (ICUEMS), Zhuhai, China, 24–26 April 2020; pp. 296–299. [Google Scholar]
- Tingting, Z.; Wenquan, Z.; Yanbo, L.; Xiaodong, S.; Huangqiu, Z. Direct control of rotor eccentric displacement for bearingless Permanent Magnet-type slice motor. In Proceedings of the 2012 24th Chinese Control and Decision Conference (CCDC), Taiyuan, China, 23–25 May 2012; pp. 3009–3011. [Google Scholar]
- Wang, L.; Tang, X.Y.; Yun, Z.; Xiang, C. Analysis of a Novel Magnetic-Hydrodynamic Double Levitated Motor for an Implantable Axial Flow Blood Pump. Shock Vib. 2020, 2020, 8833994. [Google Scholar] [CrossRef]
- Xingfan, G. Modern Pumps Theory and Design, 1st ed.; China Astronautic Publishing House: Beijing, China, 2011; pp. 241–302. ISBN 978-7-80218-942-3. [Google Scholar]
- Vera, S.; Cortés, M.; Rao, J.; Fazio, P.; Bustamante, W. Evaluación de modelos de turbulencia para predecir los flujos de masa de aire interzonas a través de una abertura de escalera para la convección natural y mixta en los edificios. Rev. Ing. Constr. 2015, 30, 85–97. [Google Scholar] [CrossRef]
- Kang, L.; Liu, D. Numerical investigation of particle velocity distributions in aeolian sand transport. Geomorphology 2010, 115, 156–171. [Google Scholar] [CrossRef][Green Version]
- Farhadi, K.; Bousbia-salah, A.; D’Auria, F. A model for the analysis of pump start-up transients in Tehran Research Reactor. Prog. Nucl. Energy 2007, 49, 499–510. [Google Scholar] [CrossRef]
- Banaszek, A. Methodology of flow rate assessment of submerged hydraulic ballast pumps on modern product and chemical tankers with use of neural network methods. Procedia Comput. Sci. 2021, 192, 1894–1903. [Google Scholar] [CrossRef]
- Banaszek, A.; Urbanski, T. The flow calculation algorithm of submerged hydraulic cargo pumps working with reduced pump speed on modern product and chemical tankers. Procedia Comput. Sci. 2020, 176, 2868–2877. [Google Scholar] [CrossRef]
Disclaimer/Publisher’s Note: The statements, opinions and data contained in all publications are solely those of the individual author(s) and contributor(s) and not of MDPI and/or the editor(s). MDPI and/or the editor(s) disclaim responsibility for any injury to people or property resulting from any ideas, methods, instructions or products referred to in the content. |
© 2023 by the authors. Licensee MDPI, Basel, Switzerland. This article is an open access article distributed under the terms and conditions of the Creative Commons Attribution (CC BY) license (https://creativecommons.org/licenses/by/4.0/).