Article

Enhancing Textile Wastewater Treatment Performance: Optimization and Troubleshooting (Decision Support) via GPS-X Model

by
Tilik Tena Wondim
1,2,*,
Rimuka Bloodless Dzwairo
2,3,
Dagnachew Aklog
1,
Eshetu Janka
4 and
Gamunu Samarakoon
4
1
Department of Water Supply and Sanitary Engineering, Bahir Dar Institute of Technology, Bahir Dar University, Bahir Dar P.O. Box 26, Ethiopia
2
Department of Civil Engineering, Durban University of Technology, Midlands, P.O. Box 101112, Imbali 3209, South Africa
3
Institute for Water and Wastewater Technology, Durban University of Technology, P.O. Box 1334, Durban 4001, South Africa
4
Department of Process, Energy and Environmental Technology, University of South-Eastern Norway, 3918 Porsgrunn, Norway
*
Author to whom correspondence should be addressed.
Processes 2023, 11(10), 2995; https://doi.org/10.3390/pr11102995
Submission received: 5 September 2023 / Revised: 19 September 2023 / Accepted: 22 September 2023 / Published: 17 October 2023
(This article belongs to the Special Issue Modeling, Simulation, Control, and Optimization of Processes)

Abstract

:
Textile factory water consumption could be optimized to minimize the generation of wastewater, reduce treatment costs, and promote resource recovery. However, downstream plant operation and management is a prime concern in the textile industry, particularly bringing treated wastewater effluent to an acceptable discharge limit. The aim of the study was to optimize key process control parameters to the observed operational challenges of existing processes and suggest an operational guide to the operators and decision makers to enhance the treatment performance in GPS-X. The formulated troubleshooting and decision support strategy, and the optimization results of waste-activated sludge in the primary and secondary clarifiers, was within the range of 15 ± 5 m3/d and 83 ± 7 m3/d, respectively, with a recycle-activated sludge flow of 150 ± 10 m3/d. The sludge retention time was 5 ± 1 d and 6.7 ± 0.5 d in the secondary and primary clarifiers, respectively. The addition of a carbon source in the form of molasses had a flow of 0.5 ± 0.05 m3/d, and the variation in the influent due to wastewater characteristics and rainfall was optimized to 600 ± 50 m3/d. The optimum air flow into the aeration tank was 550 ± 5 m3/hr and saved 91.5% of energy in the optimized process. Thus, the study is indispensable for the effective and efficient operation of the plant and serves as a good guide to the plant operators and decision makers for the best course of action.

1. Introduction

The operation of wastewater plants is indispensable for the abatement of pollution to the downstream environment and promoting a green economy for the industrial process [1]. The study by Flores-Alsina et al. [2] showed that a plant’s performance may change due to overloaded supernatant recycling to the upstream treatment units, shock loads, inconsistent monitoring, and poor sampling location. Controlling the internal treatment process parameters is the key challenge in the treatment of textile waste since the intrusion of toxic substances and/or inhibition of biological process leads to the deterioration of plant performance [3,4]. Conversely, poor operation protocols used by the operators pose a serious challenge in attaining a minimum required pollution control standard [5,6]. Furthermore, the technical capability of experts to devise the optimal solutions in a short time with higher quality is a big challenge in wastewater treatment plant operation [7].
The efficient operation of plants starts with identifying the key monitoring locations and process control parameters [8]. The study by Bhave et al. [9] showed that periodic plant monitoring at a specific location ensures that the operator checks the performance of each unit process. The key locations where the plant is monitored are at influent, clarifiers, aeration tank, internal recycles, and effluent [10,11]. Similarly, the key parameters at the specific monitoring location that should be measured and controlled are sludge retention time (SRT), food-to-microorganism ratio (F/M), sludge volume index (SVI), air flow, recycle-activated sludge (RAS), and waste-activated sludge (WAS) [12,13,14,15].
The comprehensive optimization of process control parameters is indispensable to enhance the performance of a plant within optimum costs and energy [11]. Optimization requires multiple attributes integrated together to find out the best solution to save time, and increase decision capacity and quality [16,17]. In the study by Latif [18] and Cao et al. [19], it was revealed that the GPS-X model can be used to design a wastewater treatment plant and its operation. However, the GPS-X model is a recent development in plant operation and the optimization of process control parameters for a specific challenge [20]. To optimize plant performance, it is best to change one parameter at a time and wait for an adequate period until the results of the change stabilize [10]. Thus, optimization in GPS-X bridges the gap between discrete decision-making processes and comprehensive simulation by adjusting the physical process control parameters.
The objective of this study was to optimize key process control parameters in textile wastewater treatment plants, to the observed operational challenges of existing processes, and to suggest an operational guide to the operators and decision makers to enhance the treatment performance in GPS-X. The process control parameters were simulated and optimized using GPS-X. The approach used in this study would provide fast and precise results to the operators (decision makers) by identifying and quantifying the key process control parameters for corresponding challenges. Thus, optimizing the process control parameters in this study is indispensable to devise strategic troubleshooting actions.

2. Materials and Methods

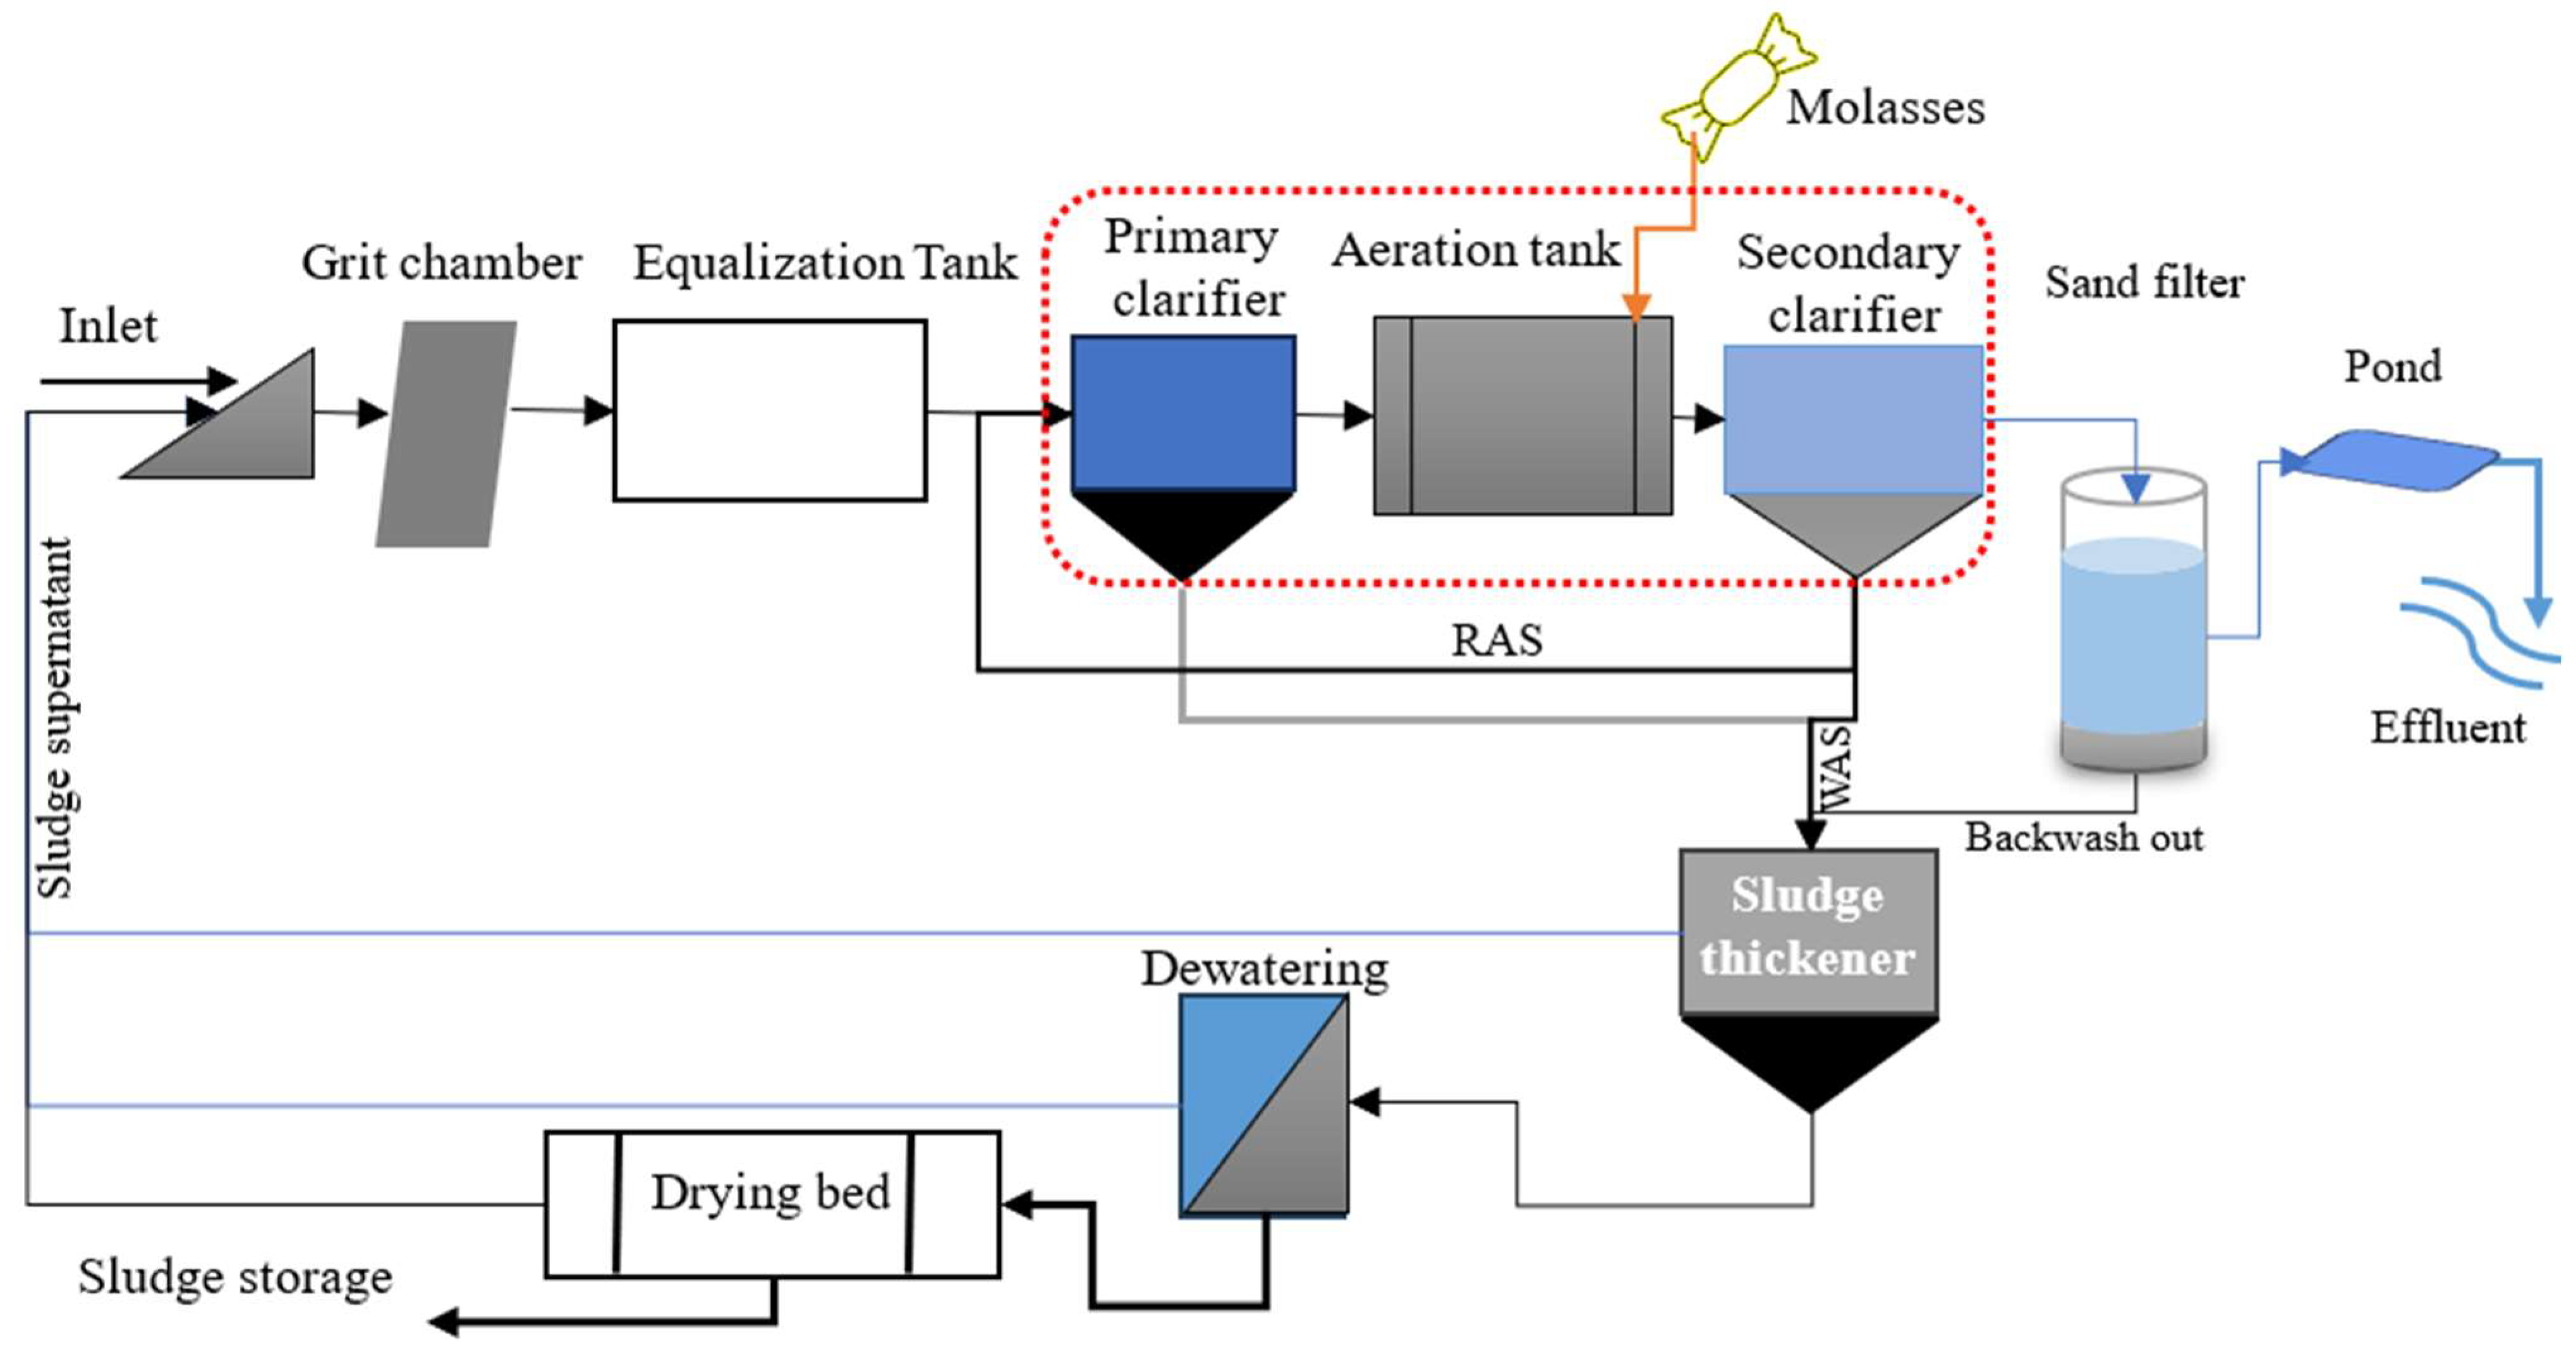
2.1. Description of the Wastewater Treatment Process

The treatment plant process has activated sludge with its full-scale sludge treatment configuration’s design flow set at 600 m3/d. Specifically, wastewater passes through the intake and into the grit chamber, equalization tank, pumping stations, primary clarifier (with coagulation and flocculation units), activated sludge process, secondary clarifier, multigrade filter, and guard pond, after which the final effluent is released into the nearby water body. In line with this, the factory has sludge treatment units, including a sludge thickener, dewatering filter press, and sludge drying beds. The primary and secondary waste sludge are collected, mixed with alum and pumped into the thickening tank, after which the sludge is dewatered and spread onto drying beds. Effluent from sludge treatment units is returned to the plant intake for further enhanced treatment. Moreover, 98% sulfuric acid is added at the equalization tank to balance the pH of the incoming flow, which commonly has an alkaline composition. Conversely, alum and poly aluminum chloride (PAC) coagulants are added into the primary clarifier to form the settleable flocs that can be removed easily. Specifically for this study, molasses was added at the aeration stage to boost the organic carbon content of the wastewater as this is a limiting factor for aerobic digestion. The treatment plant process flow diagram is presented in Figure 1.

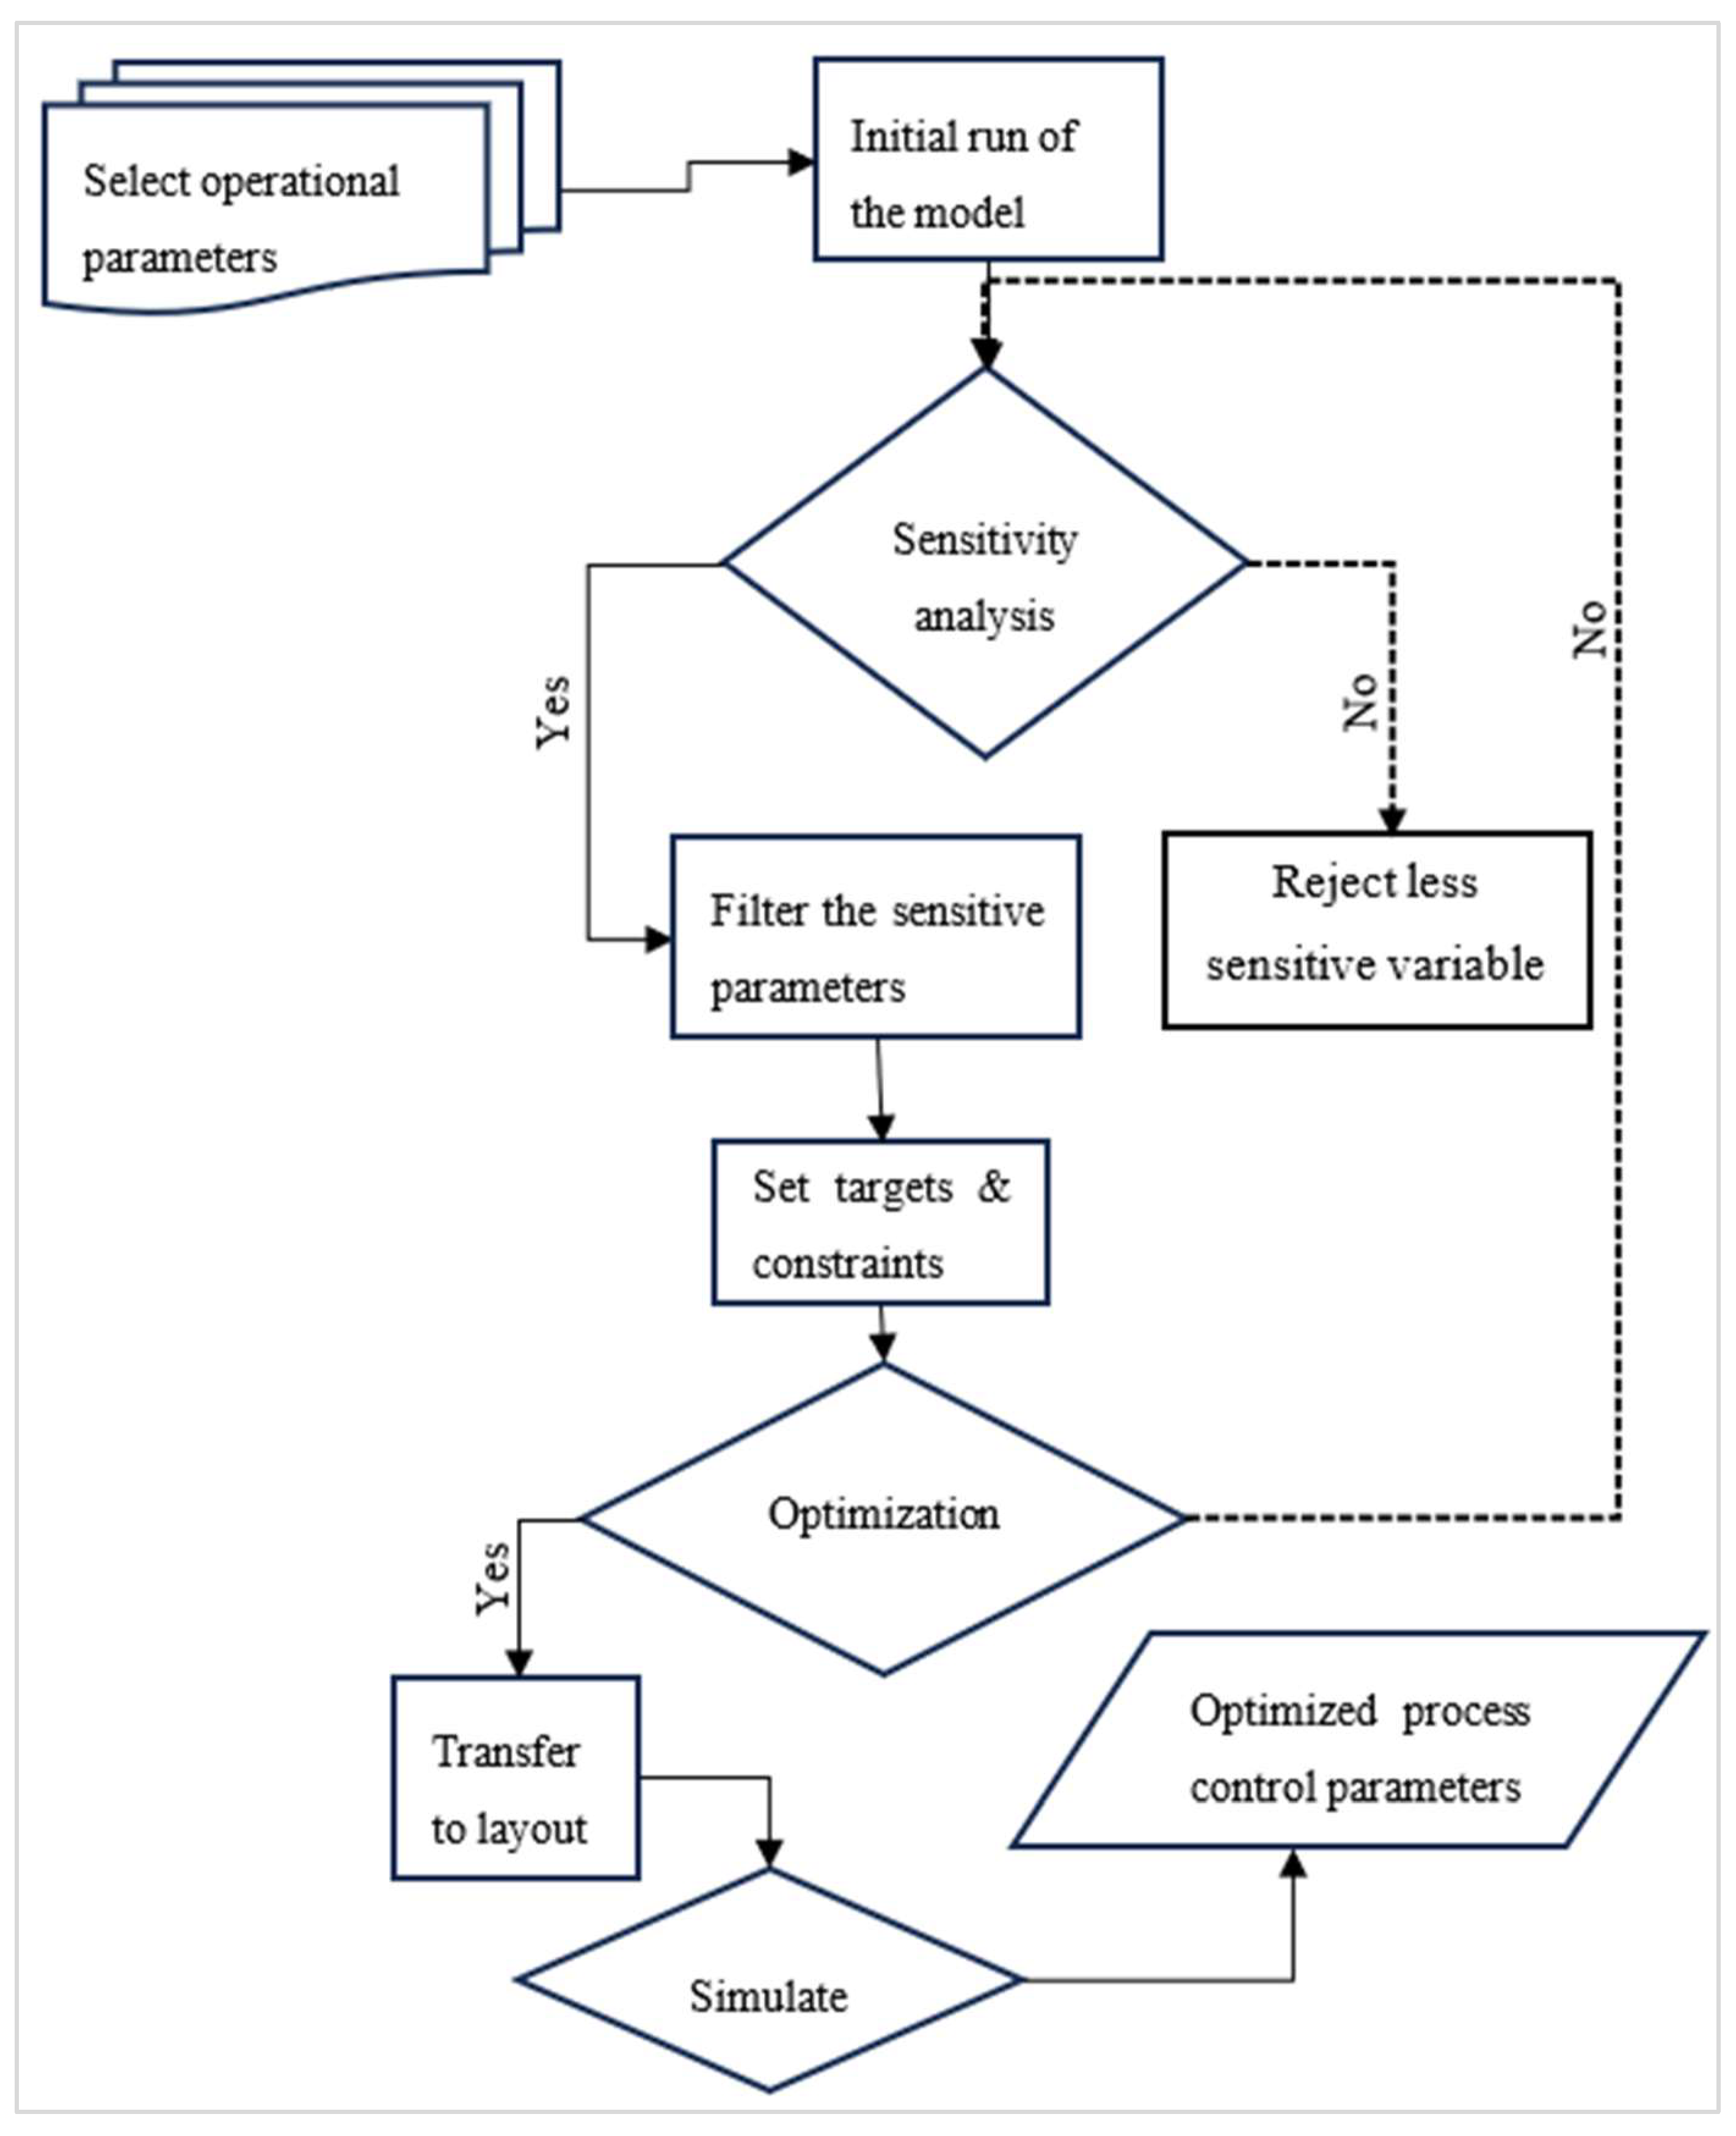
2.2. Research Instruments and Methods

In this research, secondary data were used as a tool including wastewater quality data, treatment plant design documents, and research outputs. Additional data were extracted from the plant’s hydraulic data and a questionnaire that was administered for this purpose. The GPS-X Hydromantis software version 8.5 (educational license No.9-1643) and MS Excel 2016 were the main software used in this research.
The data collection started with careful observation of key characteristics and behavior of the plant treatment system. The history of the plant was understood by engaging the operators and available documents on the pattern of operations, failure history, data record protocols, and troubleshooting strategies. The secondary data on wastewater quality analysis, similar study results, and design documents were collected, reviewed, and presented to the utility manager and operators to confirm the data quality. Further, based on the secondary information, physical measurements were conducted on the hydraulic dimensions and air flows in the treatment system. To assure the quality of data, the operators were interviewed on the hidden components of the treatment units due to design consideration. Thus, the data collection followed the standard quality assurance and control techniques.
The model was developed and sensitivity analysis was performed for process control parameters considering the critical monitoring locations in the GPS-X software version 8.5. The plant process control parameters including waste-activated sludge (WAS), recycle-activated sludge (RAS), sludge retention time (SRT), and air flow into the aeration tank were analyzed, simulated, and optimized under steady-state conditions in order to develop a monitoring framework. Furthermore, food to microorganism ratio (F/M), volumetric organic loading rate, and solid mass flow were analyzed. One-step sensitivity analysis was performed targeting optimization of the effluent quality, energy use, and sludge production. Finally, a 180-day simulation was carried out using the optimized process control parameters in GPS-X model for the existing and modified processes. The model methodological framework is shown in Figure 2, starting with selection of operational parameters and ending with the optimized process control parameters. There are two looped positions, the sensitivity analysis and optimization.

3. Results and Discussion

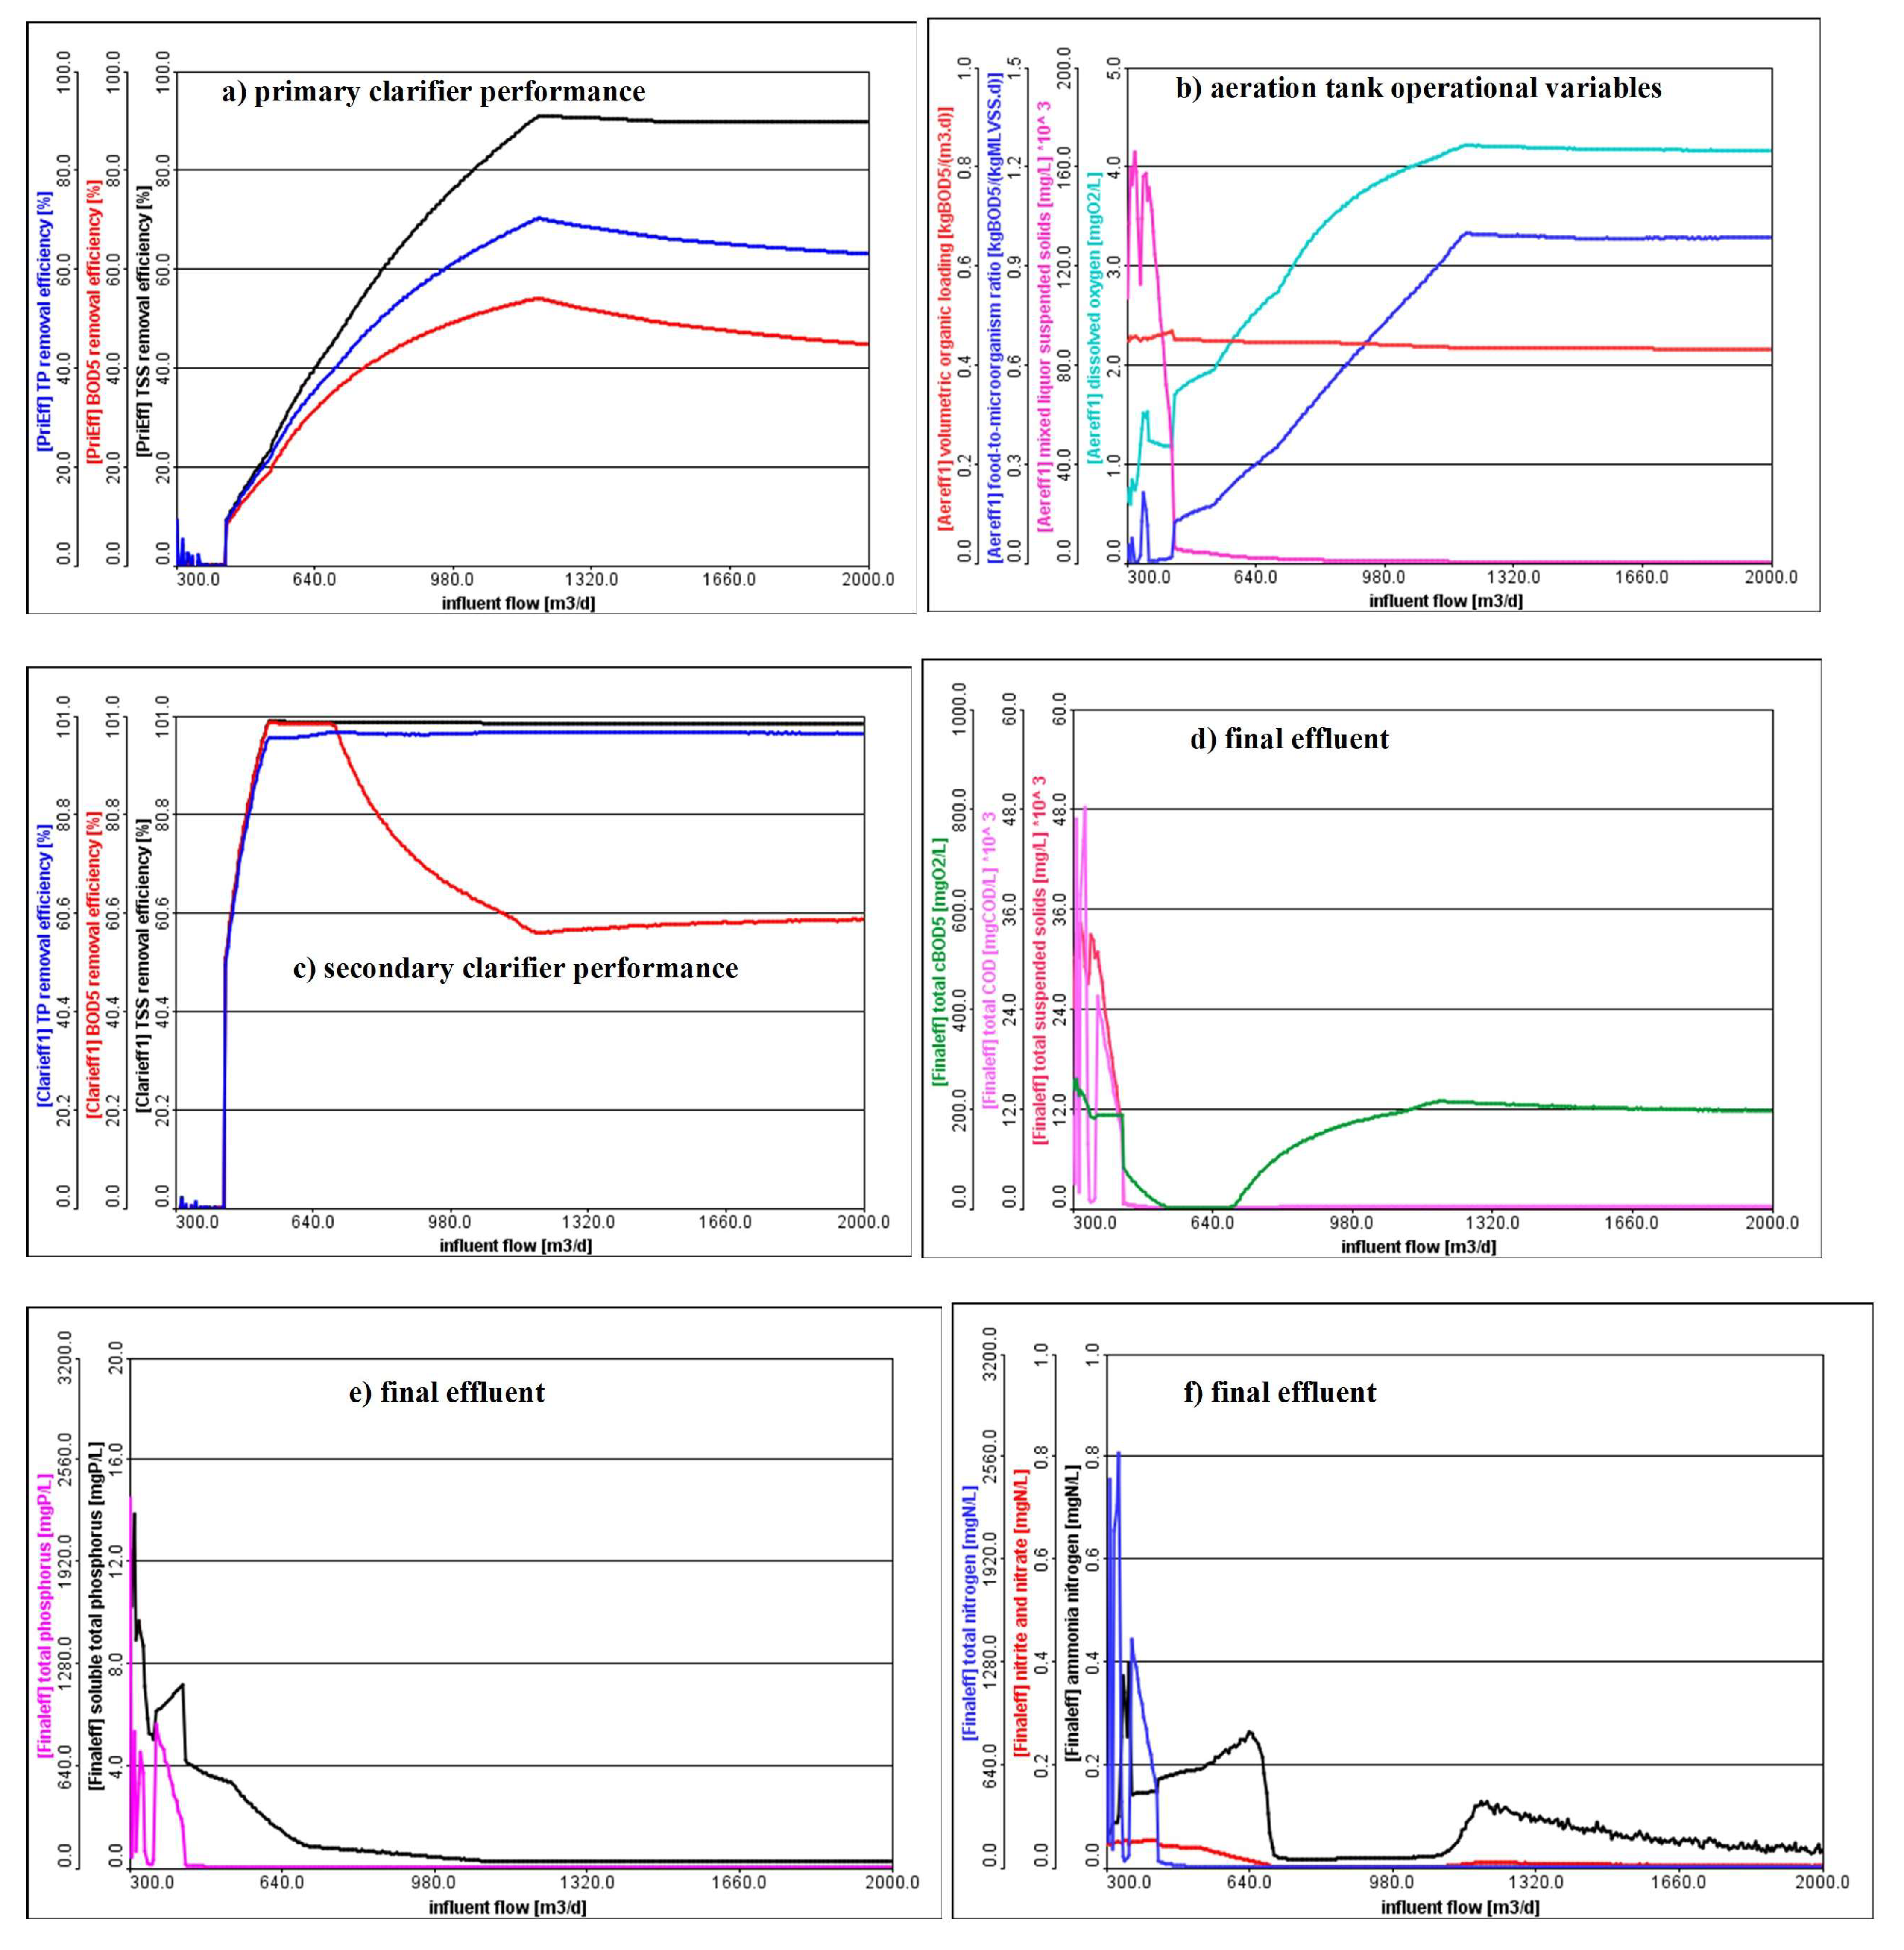
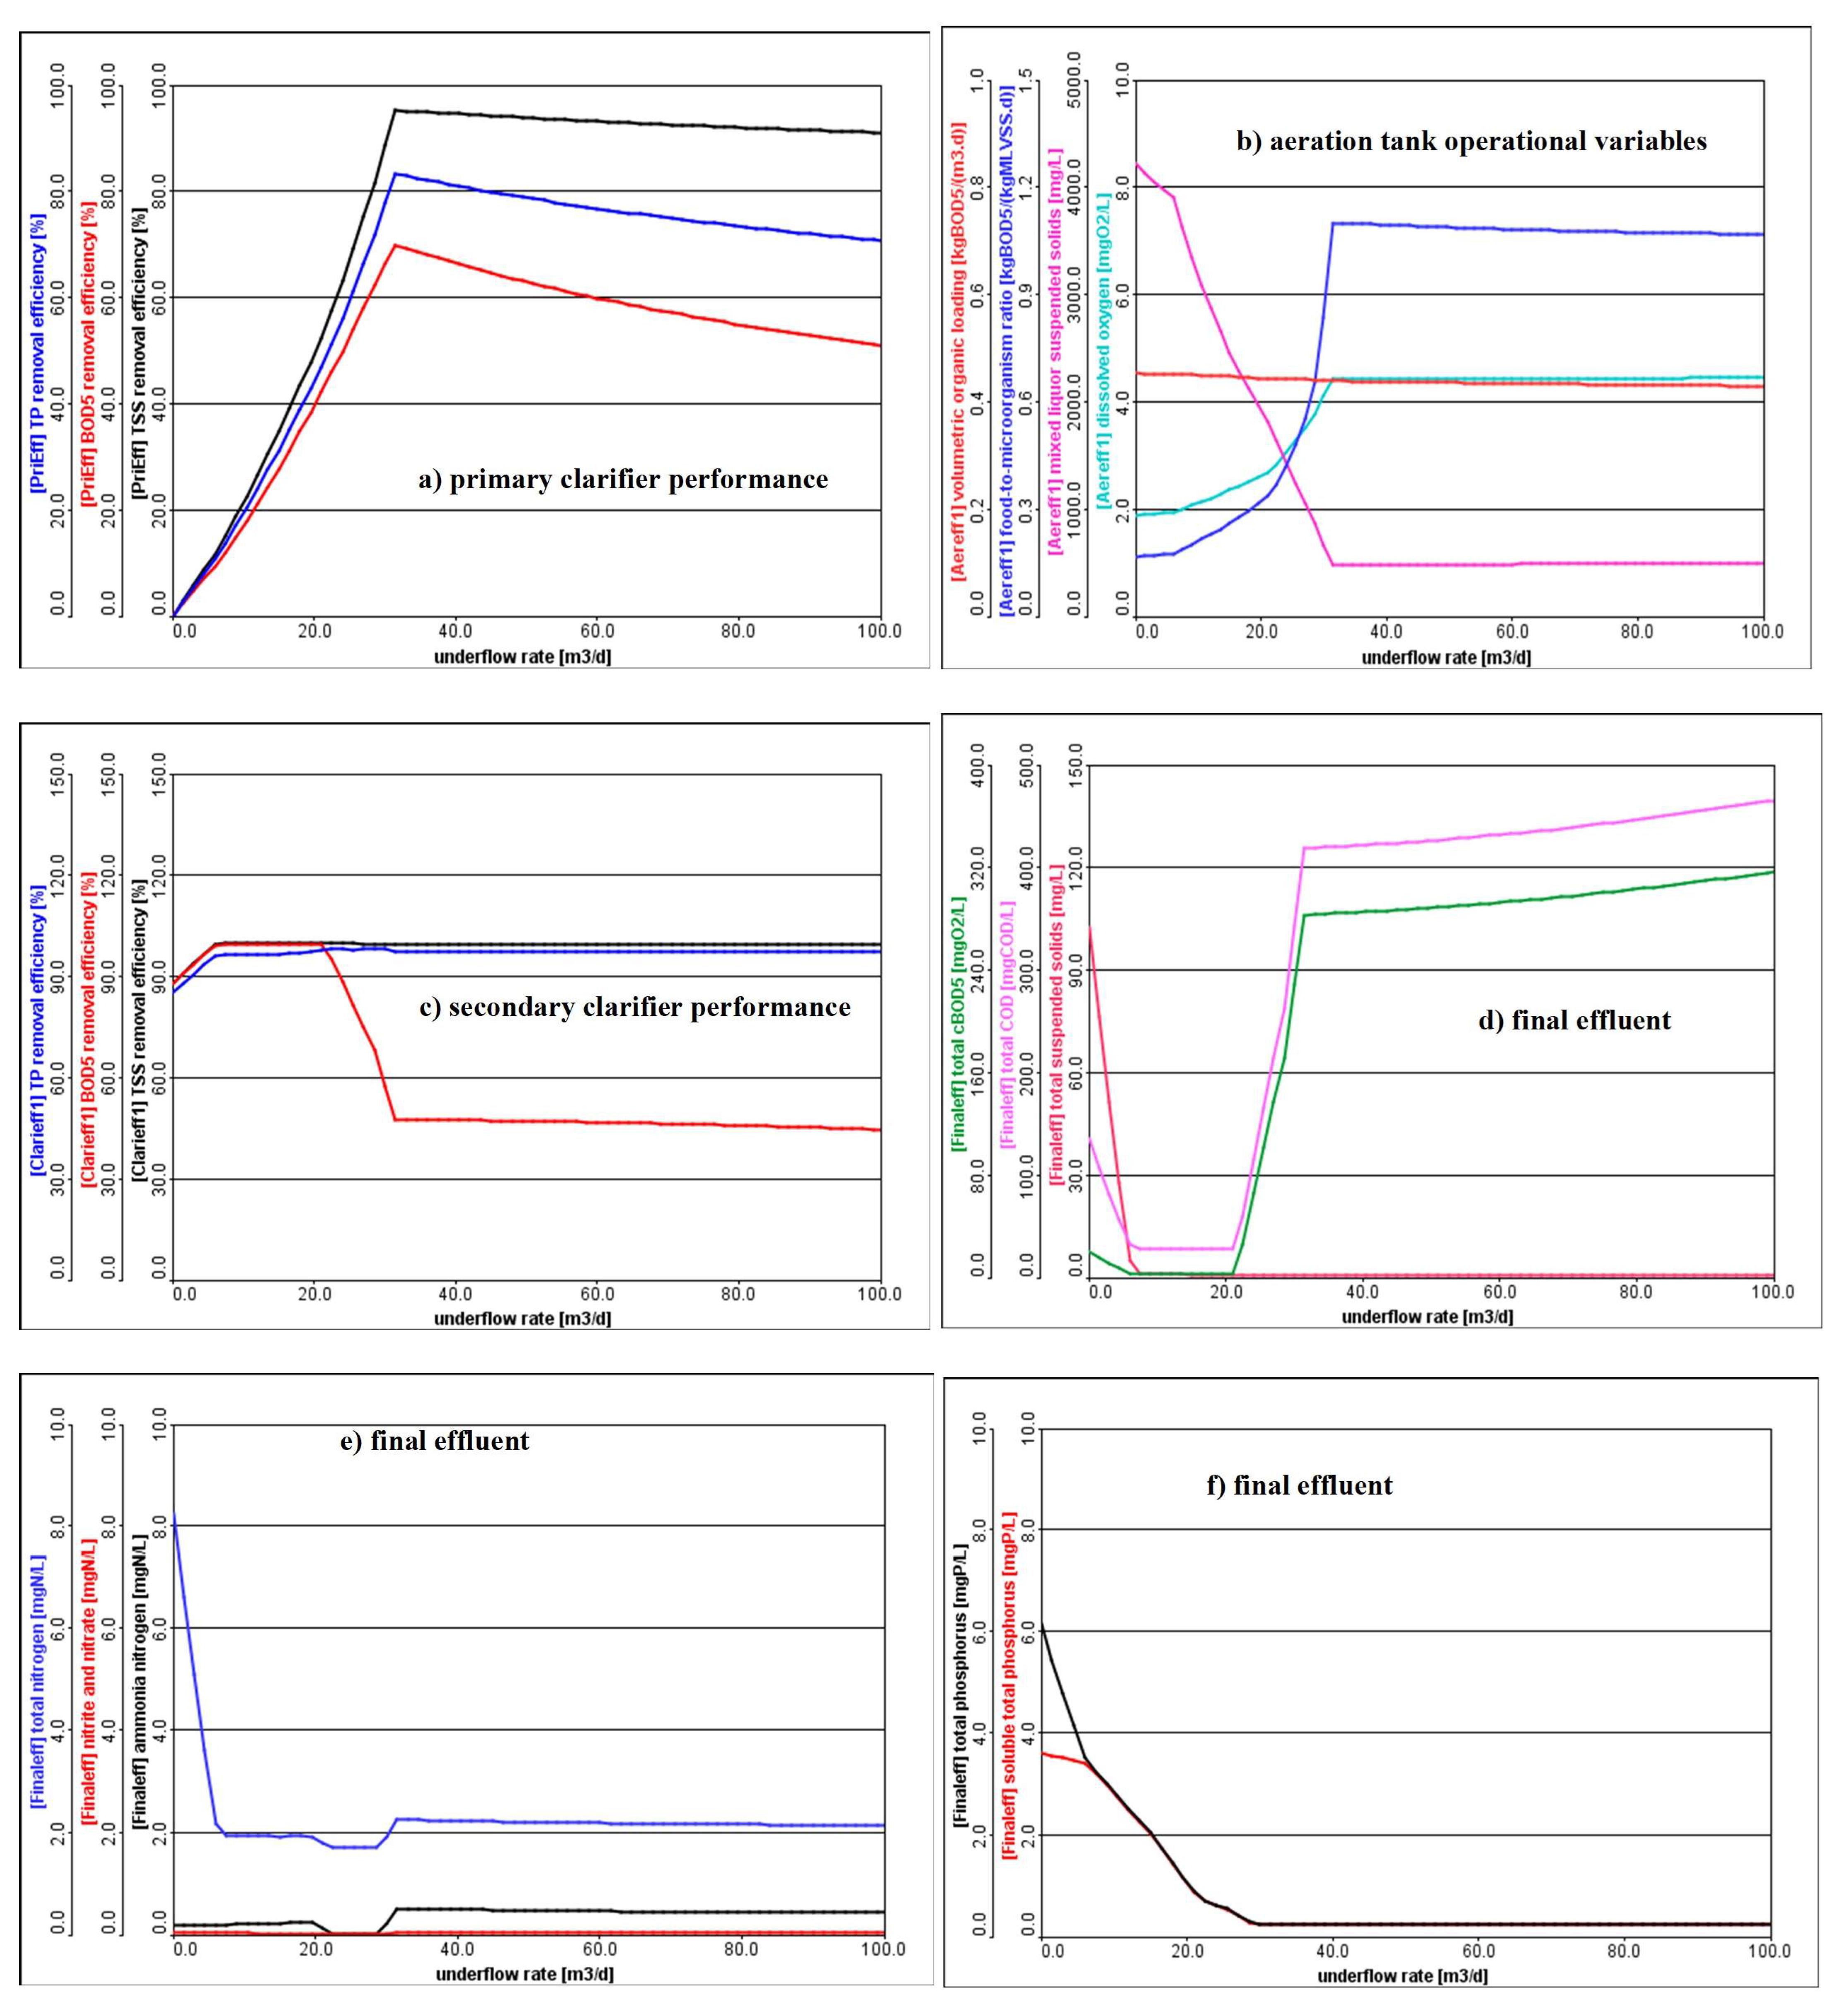
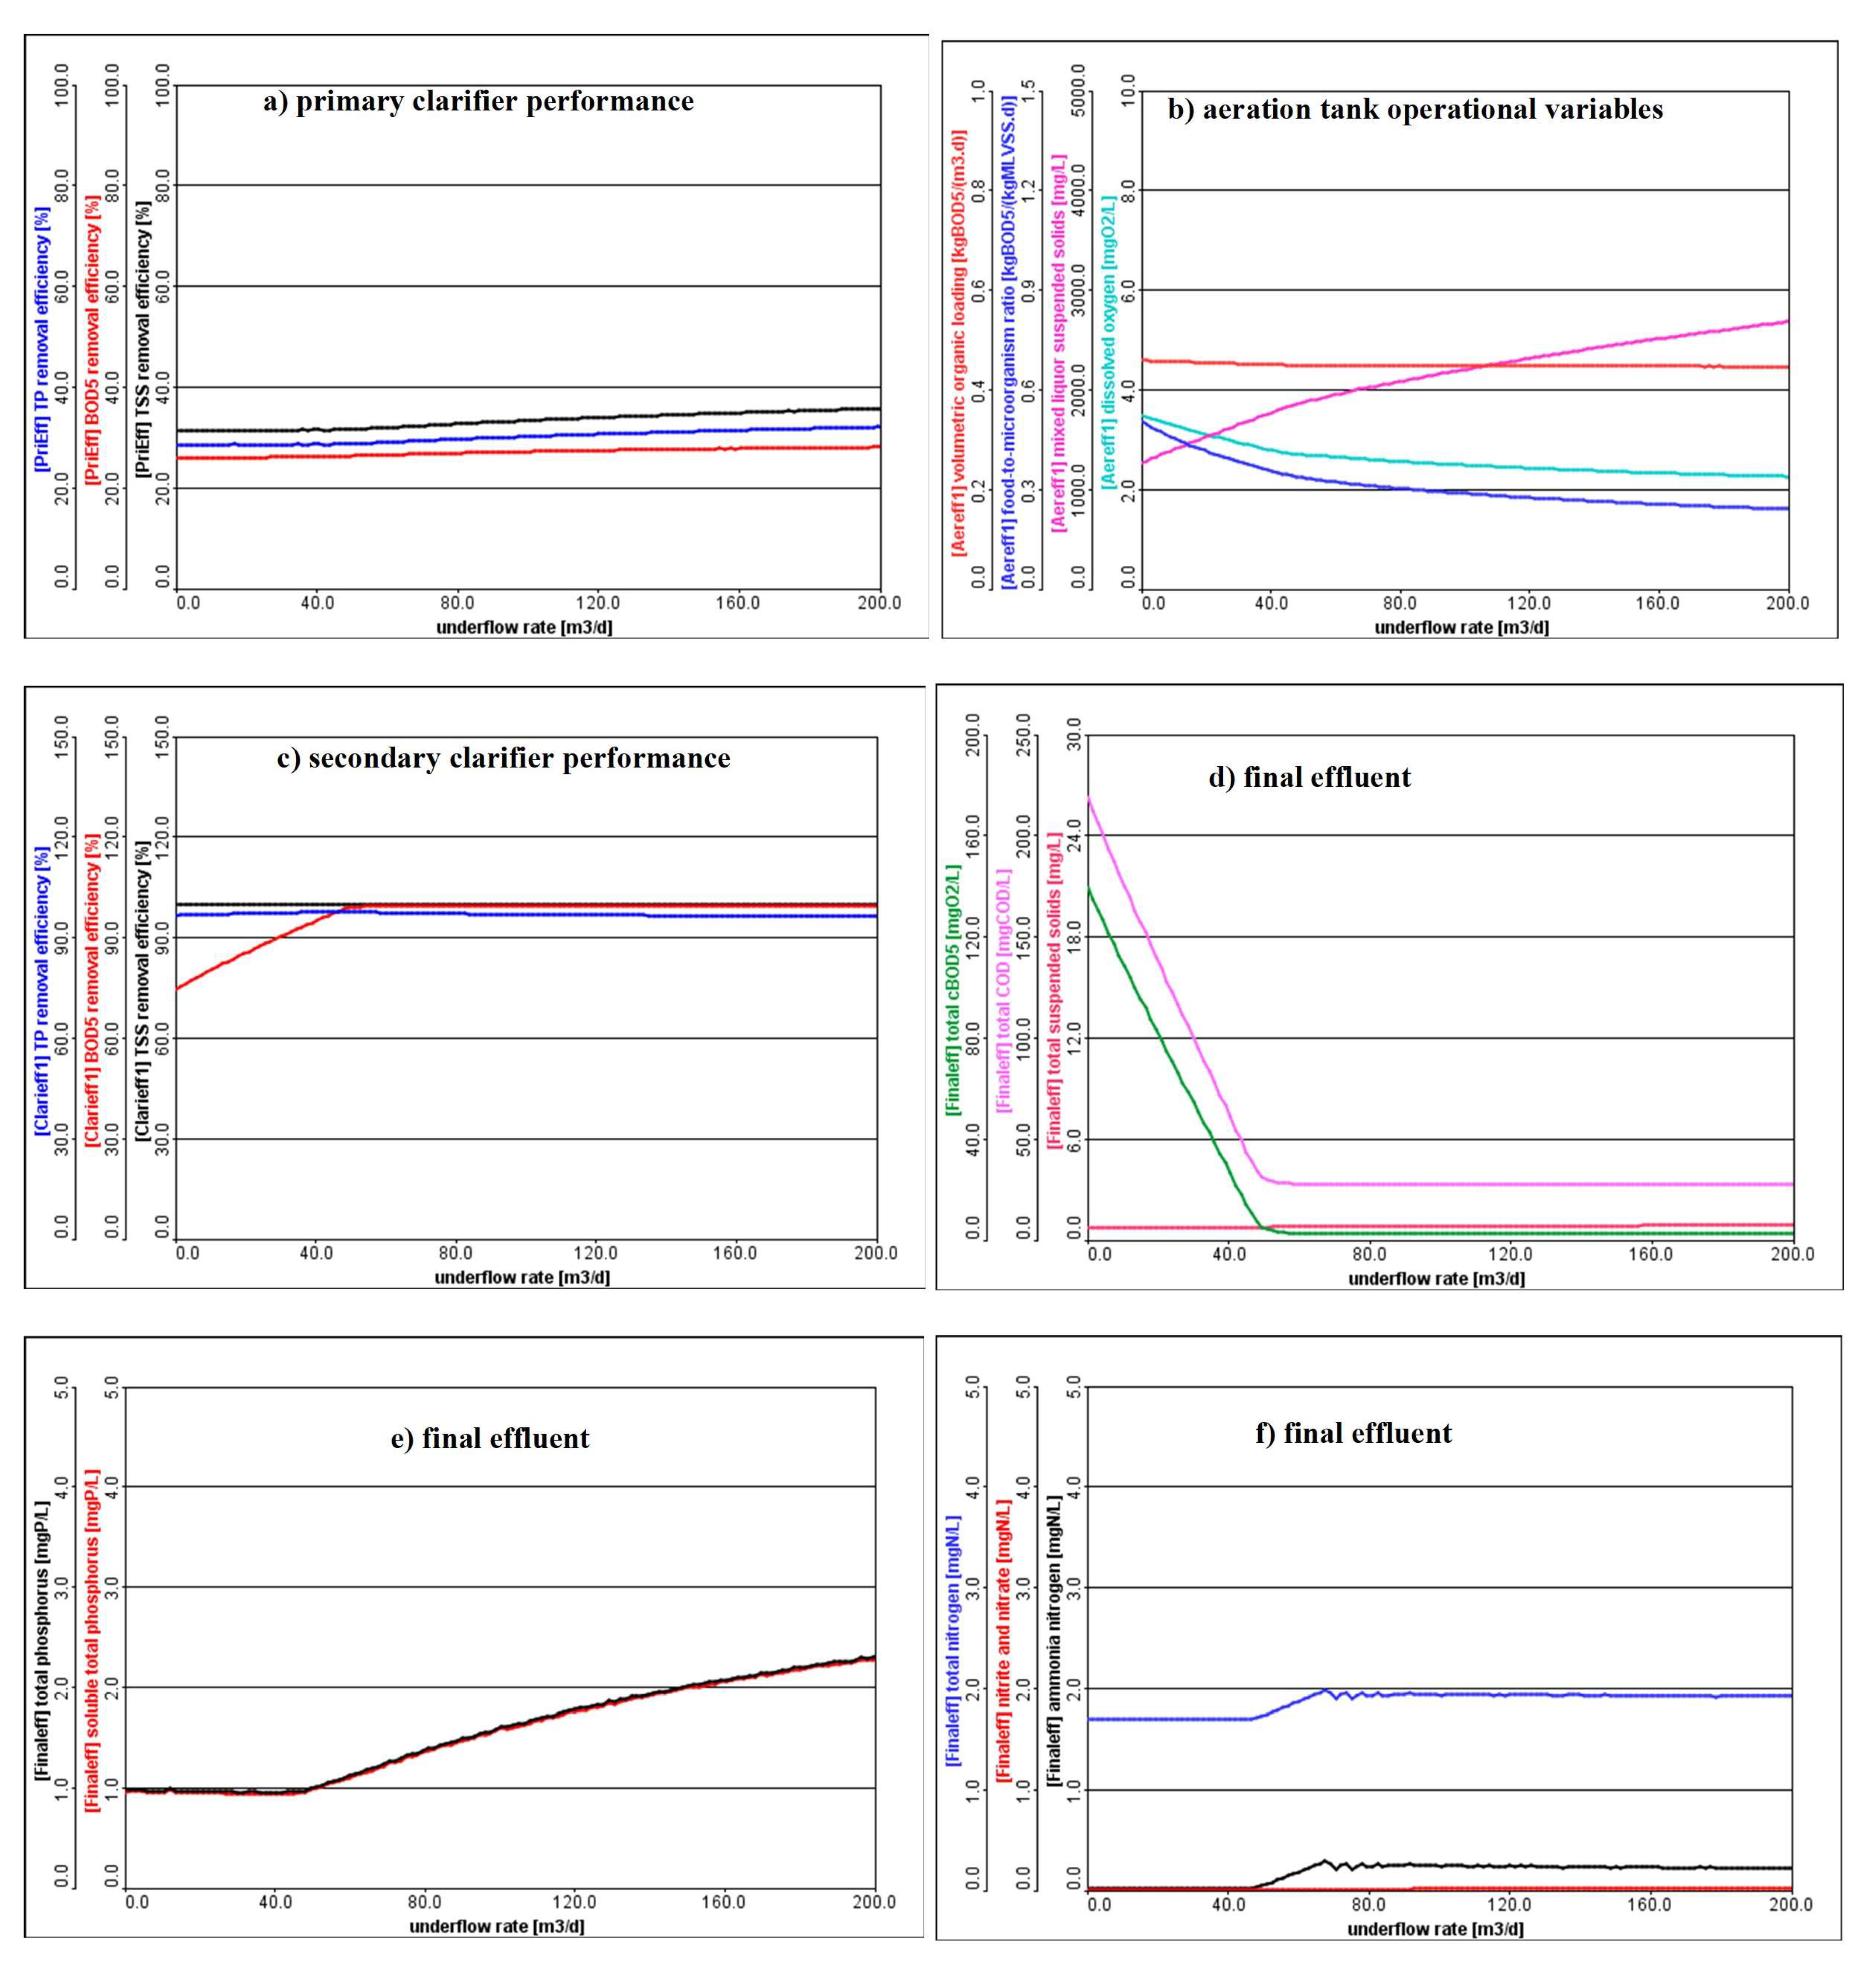
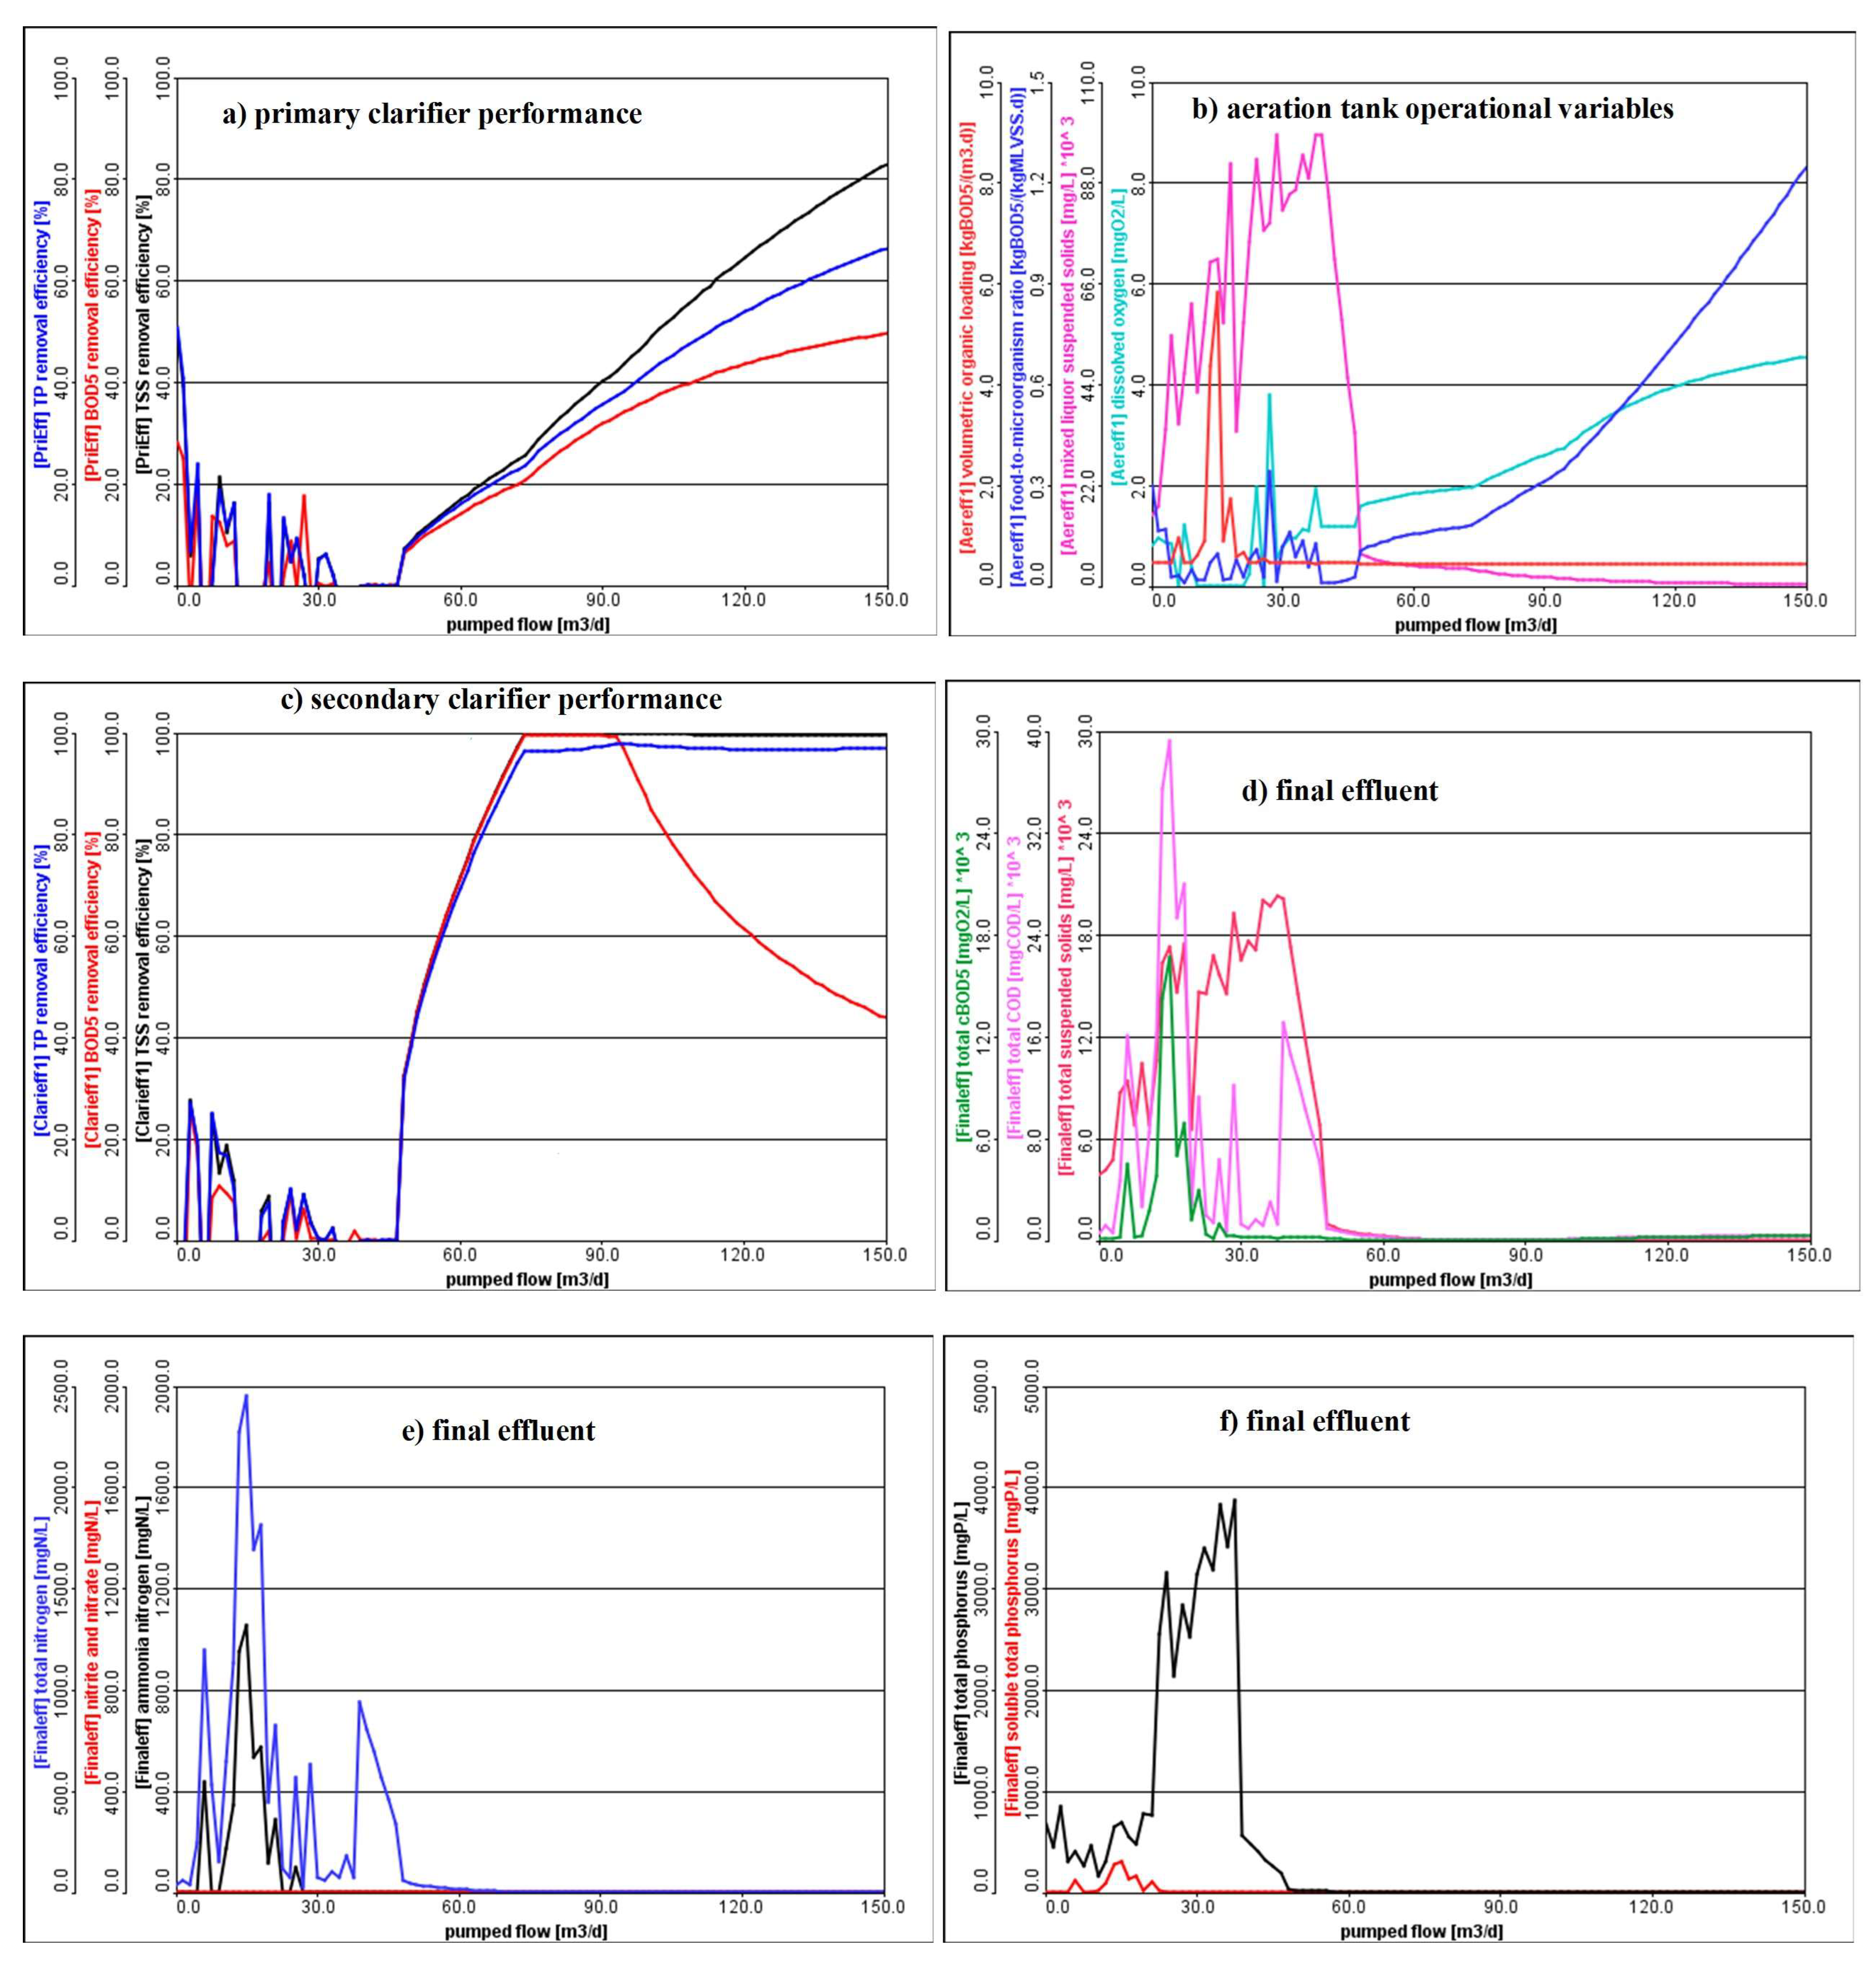
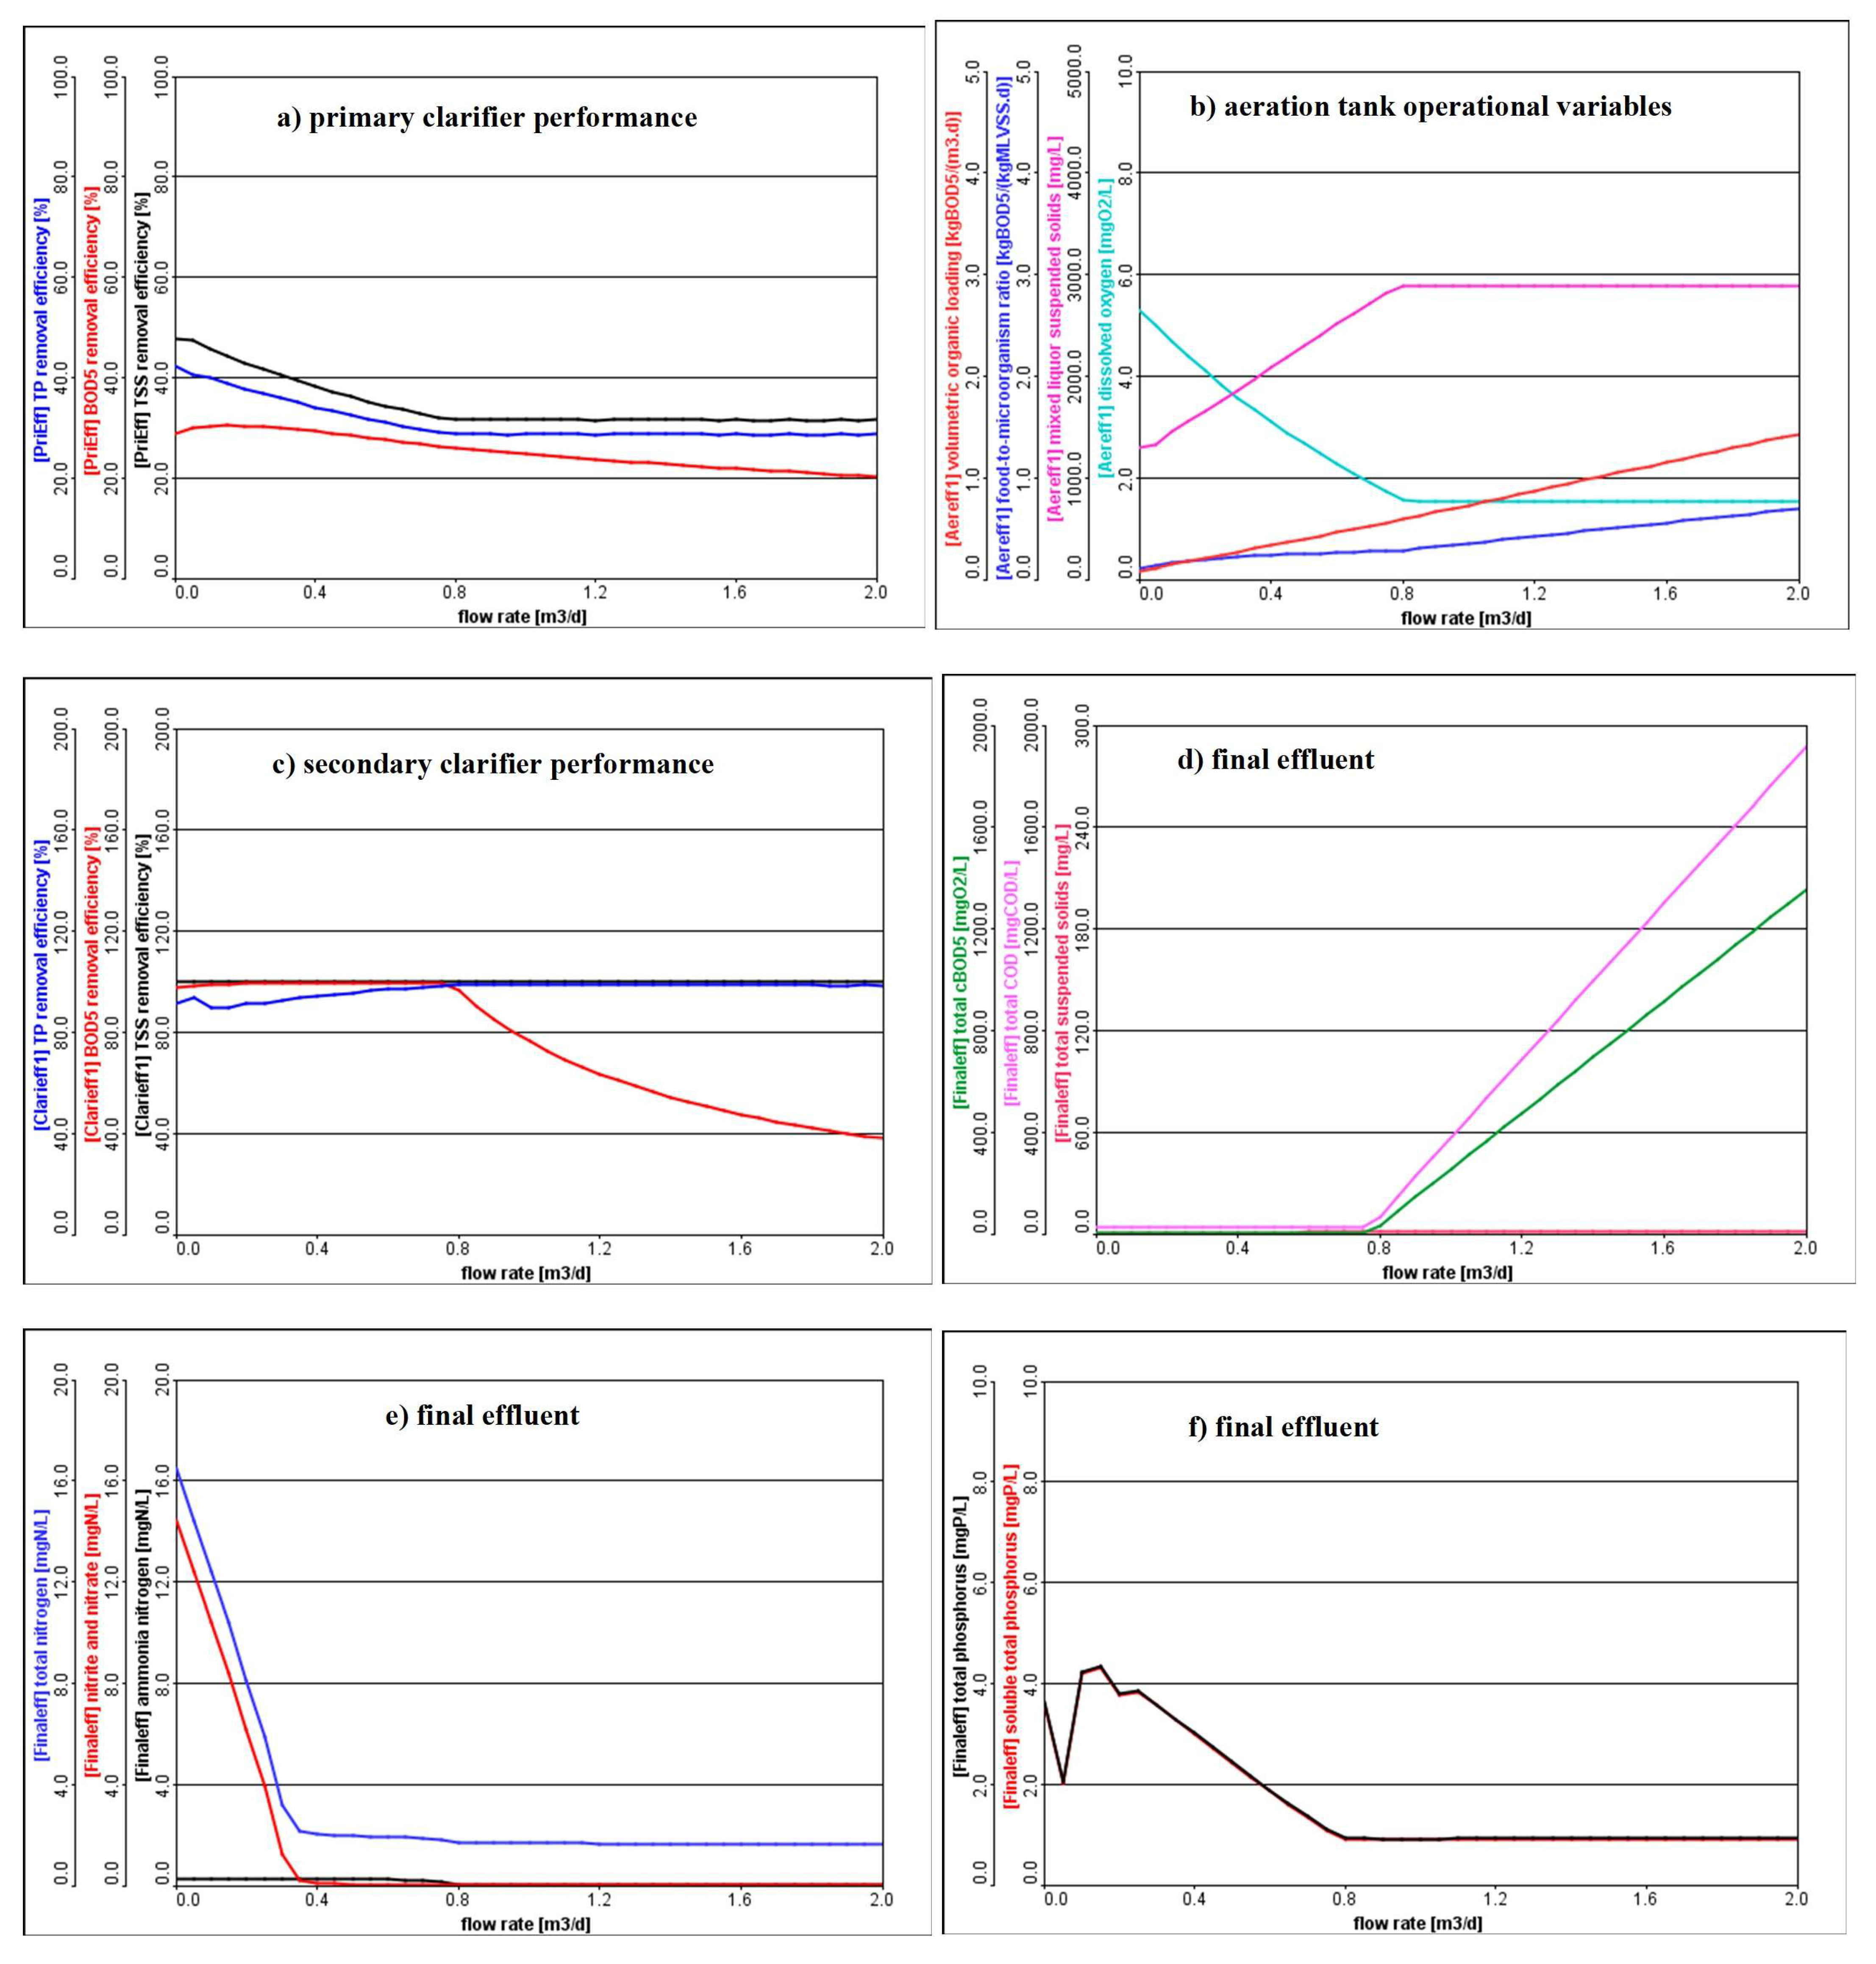
3.1. Analysis of the Influence of Influent Flow (Qinf), Primary WAS, Secondary WAS, and RAS on Plant Performance

The influent flow variation presented in Figure 3a and c shows that the ability of removing total suspended solid (TSS), 5-day biochemical oxygen demand (BOD5), and total phosphorous (TP) from the primary and secondary clarifiers was a negative performance because Qinf increased from 300 to 415 m3/d. The negative performance depicts the shock loading of the treatment plant at a low inflow of Qinf at a constant influent concentration of physicochemical parameters [21]. For the increment in Qinf from 550 to 650 m3/d, the performance of both clarifiers was increased. However, with the steady increase in Qinf from 1200 to 2000 m3/d, the removal efficiency of both clarifiers declined except for TSS and TP parameters in the secondary clarifier (Figure 3a and c). Meanwhile, the Qinf change from 550 to 2000 m3/d significantly increased the aeration operational variables of F/M and dissolved oxygen (DO) values from 0.15 to 0.93 and from 1.6 to 4.2 mg/L, respectively (Figure 3b). Moreover, the mixed liquor suspended solids (MLSS) declined slightly with the increase in Qinf. Conversely, the change in Qinf affected the effluent concentration of nitrite and nitrate. However, the effluent concentration of TSS, chemical oxygen demand (COD), total nitrogen (TN), and TP were not affected by the variation in Qinf (Figure 3d, e and f), respectively. However, for the higher influent flow greater than 650 m3/d for the effluent BOD5, and 1000 m3/d for NH3-N, their permissible limits were violated. The results from the sensitivity analysis of influent flow variation shows that the flow of 600 (±50) m3/d was the acceptable range for efficient plant operation to attain the desired effluent quality, and at the same time control the process parameters. The variation in flow was attributed to intrusion of rainfall and influent variations that could be controlled in the equalization tank.
Presented in Figure 4a,c for the primary clarifier raw WAS flow of 10 t-20 m3/d depicted that the primary and secondary clarifier pollutant removal efficiency were increased for the respective TSS, TP, and BOD5 parameters due to the reduction in the sludge blanket depth [2,22]. Meanwhile, the aeration process control variables also showed oscillations within the range of 0.2–0.3 for F/M, 1.98–2.2 mg/L for DO, and 2000–3800 mg/L for MLSS, (Figure 4b). In addition, the final effluent concentrations of BOD5 (10 mg/L), COD (40 mg/L), TSS (5 mg/L), and TP (1.45–3.5 mg/L) with insignificant changes for nitrite and nitrate, were observed for the primary clarifier WAS change from 10–20 m3/d (Figure 4d–f). However, the increase in WAS against a flow of 30 m3/d significantly affected the efficiency of the secondary clarifier for removal of BOD5 (from 93.41–48.7%) and decline in the quality of the final effluent by increasing BOD5 and COD. Moreover, the operational parameters in the aeration tank were also elevated over the allowable values. Further increase in primary clarifier WAS flow to greater than 30 m3/d, upset the subsequent treatment process [23] and the aeration parameters (F/M, DO, and MLSS) remained unchanged. In a study by Wang et al. [24] and another by Sid et al. [25], indicated that the MLSS is highly dependent on the organic loading from the primary clarifier, which in turn is maintained by controlling the wasting of raw sludge. Hence, the analysis result stated that the primary clarifier operation was effective when it operated in the raw WAS flow of 15 (±5) m3/d.
The results in Figure 5 and Figure 6 show that the small changes in secondary clarifier WAS has more influence than RAS on each unit operation and treatment process. Specifically, the RAS increment from 50 to 200 m3/d had a significant impact on the performance of primary and secondary clarifiers (Figure 5a,c). RAS and secondary clarifier WAS are the most critical process control parameters to maintain a proper F/M ratio for good operation and to prevent excessive solids building up in the aeration tank [26]. The final effluent BOD5, COD, and TSS remained unchanged while TP, TN, and NH3-N increased in concentration for a change in RAS (Figure 5d–f). However, there was a significant negative performance of primary and secondary clarifiers for the WAS flow of <50 m3/d (Figure 6a,c). In a study by Elawwad et al. [26] and Mu’azu et al. [27], it was revealed that withdrawal of an insufficient amount of waste-activated sludge from the clarifier leads to increased depth of sludge blanket and development of an unstable system. Conversely, the secondary clarifier WAS flow increased from 50 to 150 m3/d significantly improve the removal efficiency of primary and secondary clarifiers as well as produced effluent concentrations in the acceptable range (Figure 6d–f). This implied that the well-being of the active microbial population in the activated sludge process was controlled [27]. The optimum amount of secondary sludge wasting increases the treatment performance and effectively controls biomass population [28].
As shown in Figure 5b, for the change in RAS the aeration process control parameters varied for F/M (0.25–0.5), MLSS (1000 to 2800 mg/L), and DO (2.21–3.4 mg/L). In line with secondary sludge waste flow changes from 50 to 150 m3/d impacted the F/M (0.15–1.2), MLSS (800–5000 mg/L), and DO (1.7–4.3 mg/L) (Figure 6b). From the sensitivity analysis results, the impact of RAS on the performance of the plant and process control operational parameters was insignificant compared to secondary clarifier WAS. The previous study supports the current study by the microorganisms that sustained the biological population in the aeration tank and that the overall plant performance and system well-being was controlled through the optimized WAS and RAS flow [26,29]. Thus, to attain the required final acceptable effluent quality, the optimal plant operational RAS and secondary clarifier WAS flows were 150 (±10) and 83 (±7) m3/d, respectively.

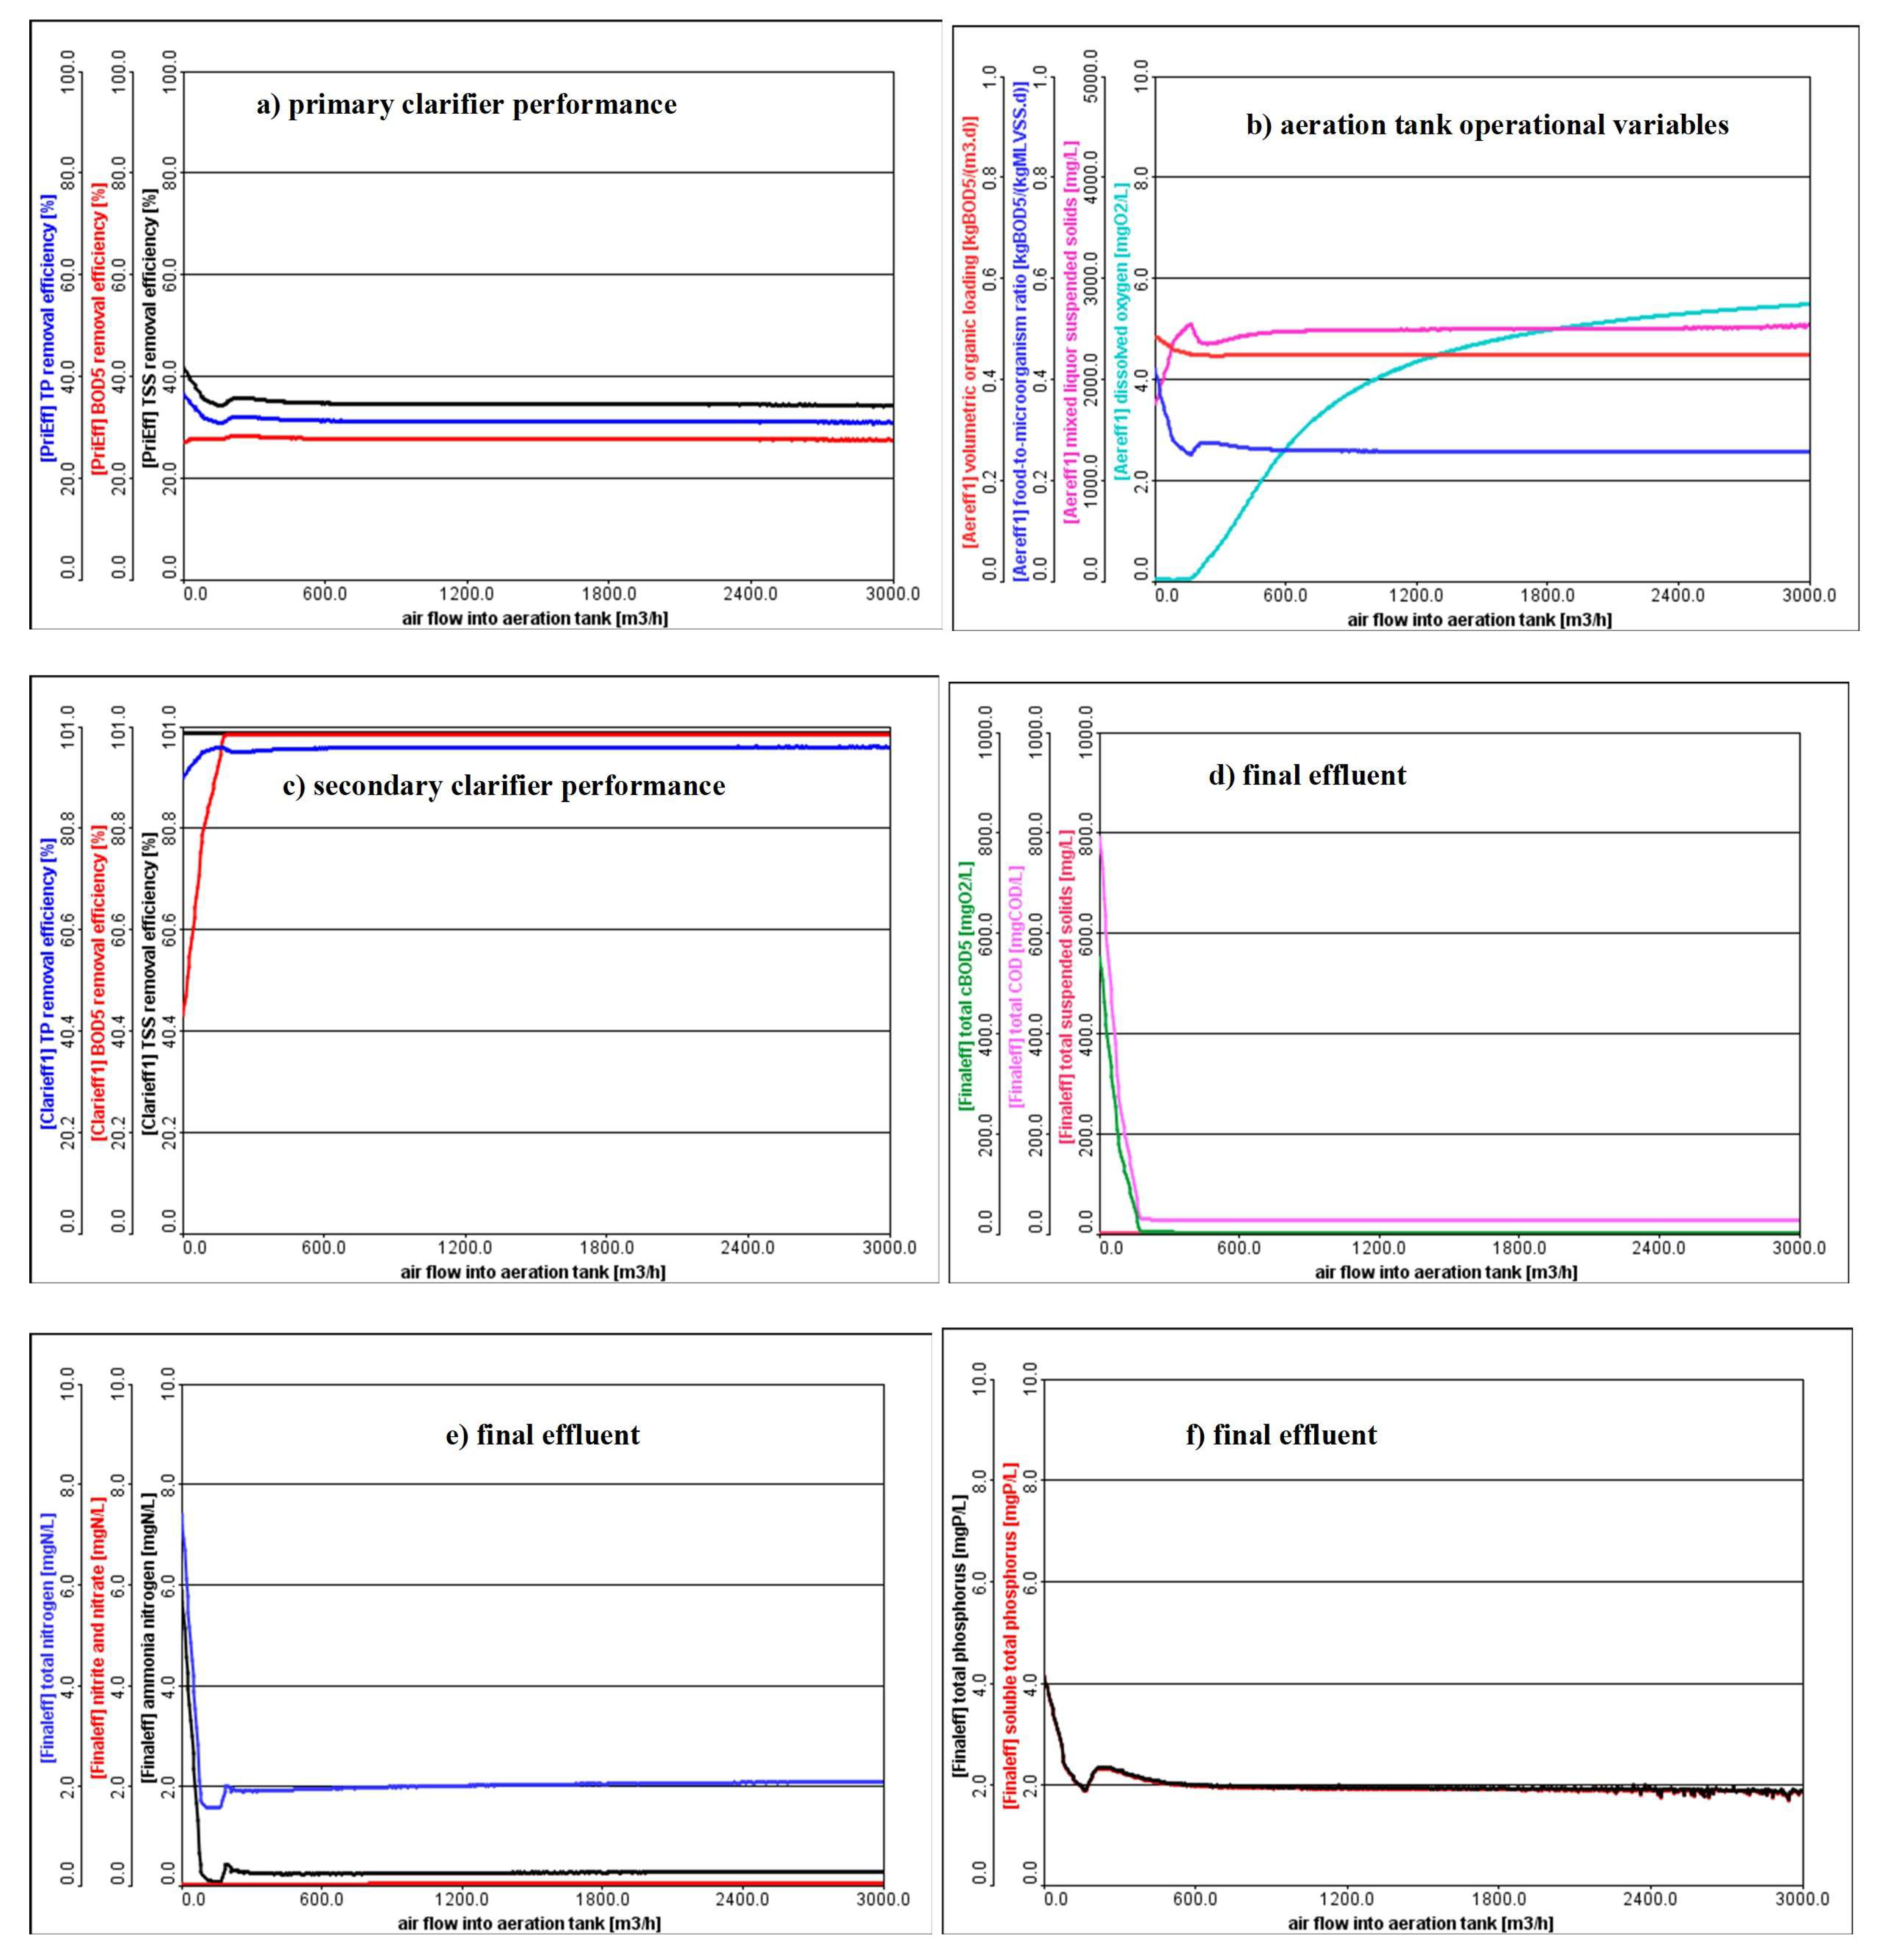
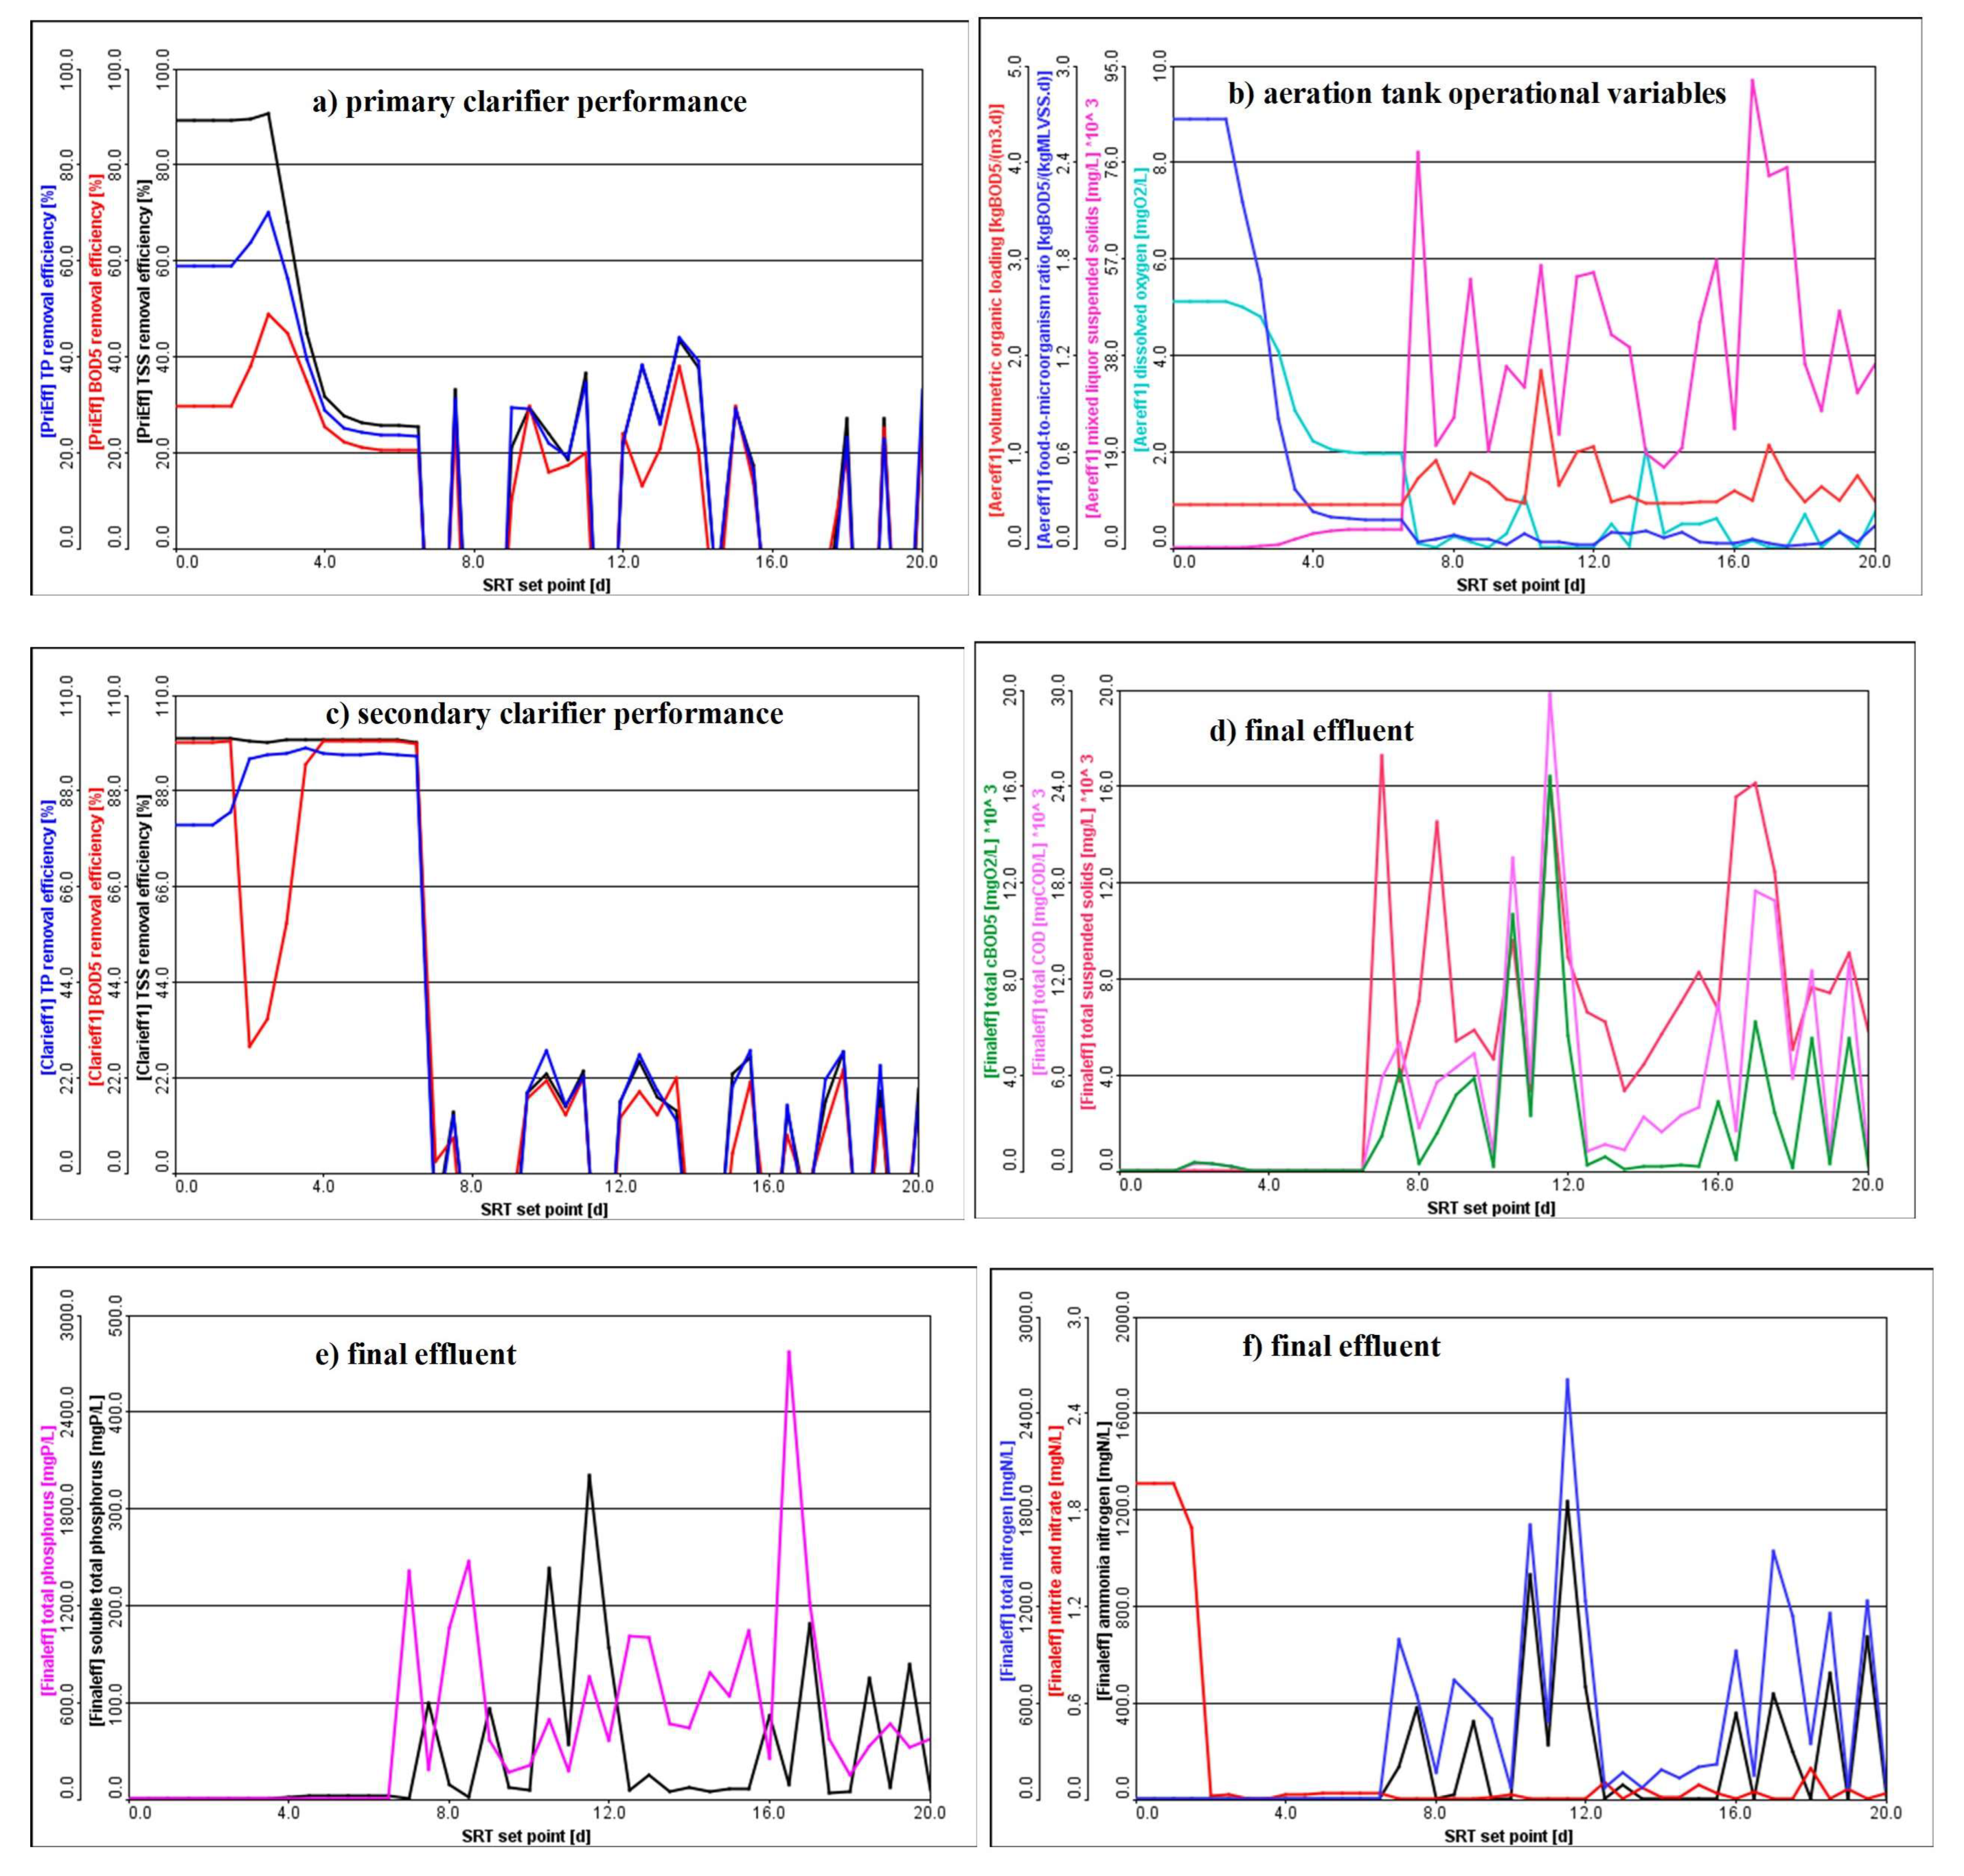
3.2. The Influence Analysis of Air Flow into the Aeration Tank, SRT, and Molasses Flow on the Performance of Plant

As shown in Figure 7a,c, the air flow into the aeration tank change had an insignificant impact on the performance of primary and secondary clarifiers. In addition, the effluent quality also did not directly affect the variation due to air flow of greater than 200 m3/hr (Figure 7d–f). However, the dissolved oxygen concentration was increased from 0.15 to 5.67 mg/L for the air flow changes from 200 to 3000 m3/hr, respectively. Meanwhile, the F/M, MLSS, and volumetric organic loading remained unchanged (Figure 7b). From this finding, it was depicted that the air flow in the aeration tank greater than the optimum level was not indispensable and economical for the biological treatment. The air supply into the aeration tank is responsible for the mixing of biomass and incoming pollutants and to attain a minimum DO requirement of 2–3 mg/L for biological degradation [30,31]. Due to the variable nature of biological activity in the aeration tank, dynamic simulation was used [30,32]. Thus, from the analysis results to maintain the minimum required DO concentration at the outlet of the aeration tank, 550 (±5) m3/hr of air flow was exerted into the aeration system and thus saved energy consumption.
The SRT value of >6.2 days significantly affected the performance of removal of pollutants from primary and secondary clarifiers (Figure 8a,c). The results revealed that the production of new solids and a longer life of old sludge in the system may deteriorate the performance of the clarifiers [33]. Meanwhile, at the SRT of 4–6.2 days, the secondary clarifier was stable and effectively removed the target contaminants with the discharge of optimum sludge flow.
The MLSS, F/M, and DO were significantly changed from 2500 to 3200 mg/L, 0.25 to 0.3, 2, and 2.3 mg/L, respectively, for the SRT changes from 4 to 6.2 days. In addition, for the higher SRT, the aeration performance variables fluctuated drastically and became unstable (Figure 8b). Moreover, within the optimum range of SRT, the model showed that the effluent concentrations of TSS, COD, BOD5, TN, TP, NO2, and NO3 were in the acceptable discharge limits. However, the higher SRT values significantly deteriorated the effluent quality (Figure 8d–f). The abrupt change in process parameters depicted that the life-cycle of biological organisms in the treatment system was affected and the microbes experienced variable operational conditions due to a long SRT [34,35]. The simulation results indicated that to attain the minimum required values of process control parameters and for better performance of the plant, the SRT should be set to 5 (±1) days. The SRT requirements in biological treatment processes are vital in order to determine the amount of sludge that must be removed [34,36]. The MLSS, WAS, and SRT are interlinked in the activated sludge process, to control the plant operation economically and efficiently [31,37,38].
Even though the oxygen concentration was sufficient to metabolize the waste, the available organic food was minimal (BOD5/COD ratio of 0.31) and, hence, additional carbon was introduced into the aeration tank in the form of molasses, to maintain the optimum F/M ratio [17,39]. For the change in molasses, the flow did not significantly alter the removal efficiency of primary and secondary clarifiers (Figure 9a,c). However, the variables in the aeration tank (DO, F/M, and MLSS) remained unchanged for the molasses flow of >0.8 m3/d. While the flow was set between 0.5 and 0.8 m3/d, the results were as follows: F/M (0.23), MLSS (2500–2800 mg/L), DO (1.7–2 mg/L), and organic loading (0.45 to 0.6 kg/m3/d) (Figure 9b). From the model analysis results, the higher molasses flow > 0.8 m3/d significantly deteriorated the BOD5 and COD quality with a slight increase in the removal performance of TP, TN, and other nutrients in the final effluent (Figure 9b,e,f). Hence, due to the introduction of molasses as an additional carbon source, the particulate and inorganic fractions were degraded by the microorganisms [5,40]. Thus, the simulation and sensitivity analysis results arising from optimum additional carbon source in the form of molasses flow were set to 0.5 (±0.05) m3/d.

3.3. Plant Troubleshooting and Decision Support Strategy

The simulation and optimization were fully considered using the existing infrastructure in order to reduce the additional capital cost for upgrading and renovating. The findings from this study identified the main challenges and problems in the existing infrastructure as well as devised the optimized troubleshooting and decision support strategy for ease of operations (Table 1). Although the piping and instrumentation diagram (PID) controller is inbuilt in the GPS-X model, however, the existing plant’s physical infrastructure lacks the PID controller. The PID controller is indispensable for the efficient plant operation [40,41,42,43]. In this regard, for the successful implementation of the model that was developed in this study, there should be RAS, WAS, airflow meters and controllers, settleometer apparatus for MLSS control, and a DO meter controller. Additionally, previous studies addressed the significance of monitoring and controlling parameters as well as relevant instrumentation for the purpose [44,45,46]. Thus, for the observed challenges in the treatment plant, the key process control parameters were optimized, the monitoring location and corresponding parameters were defined, and a decision support strategy was designed. The detailed troubleshooting and decision support framework are shown in Table 1.
All optimized parameters were fed into the model and a 180-day simulation was conducted using GPS-X. In Figure 10, the main existing process effluent concentration of COD (180 mg/L), and TSS (165 mg/L) were above the permissible limit of 120 mg/L, and 30 mg/L, respectively [47]. However, Figure 11 shows that the effluent concentrations of all performance indicator parameters for optimized process were within the permissible discharge limit. Conversely, the solid mass flow production was reduced from 1087 kg/d (existing process) to 760 kg/d (optimized process) while the overall pollution load in the effluent was reduced from 260 kg/d (existing process) to 20 kg/d (optimized process). Furthermore, the simulation results of optimized process depict that the variation within the simulation period was quite stable and smooth [48,49].
Table 1. Process control parameters and troubleshooting strategy.
No.Observed Challenges ObjectivesProcess Control
Parameters
Existing (Old) Process Operating Parameters Corrective Actions (Optimized)Monitoring Parameters Monitoring Locations
1High primary sludge blanket Optimize raw sludge wasting WAS flowWAS flow 4 m3/dIncrease WAS
15 ± 5 m3/d
SRT, effluent TSS, BOD5Primary clarifier
SRTSRT 3.4 daysDecrease SRT
6.7 ± 0.5 d
2High secondary sludge blanketOptimize sludge wasting Air flowDO 6.5 mg/LIncrease
(if DO < 2 mg/L, else reduce) air flow
DO * (2–3 mg/L), MLSS * (1000–3000) mg/L, F/M * (0.2–0.5), and volumetric loading
(0.3–1.6)
Aeration tank
RAS flowRAS 43 m3/dIncrease RAS
150 ± 10 m3/d
SVI * > 100Secondary clarifier
SRTSRT 4 daysDecrease SRT
5 ± 1 d
Secondary clarifier
WAS flowWAS 84 m3/dIncrease WAS
83 ± 7 m3/d
Secondary clarifier
3White foam formationOptimize
aeration control
WAS flowWAS 84 m3/dReduce WAS
83 ± 7 m3/d
MLSS Aeration tank
Dark foam formationAir flow6500 m3/hrIncrease air flow
550 ± 5 m3/hr
DO, NH3, NO2, NO3
5Low recycle sludge concentration (<8000)Optimize RAS solid massRAS flowRAS 43 m3/dReduce RAS flow
150 ± 10 m3/d
SVI, solid mass balanceSecondary clarifier
Air flow6500 m3/hrIncrease Air flow 550 ± 5 m3/hrDO (2–3 mg/L)Aeration tank
6Influent wastewater and storm flow handlingOptimize the inflow and storm flow Influent wastewater600 m3/dOptimize Qinf
600 ± 50 m3/d
Influent TN, TP, TSS, NH3Equalization tank
7Small BOD5/COD ratio (<0.3 *)Optimize carbon sourceAdditional carbon source (molasses)No carbon addition Increase molasses flow
0.5 ± 0.05 m3/d
F/M, Volumetric loading, MLSSAeration tank
* [5,30,37,38,50,51].

4. Conclusions

The critical operational parameters were identified through rigorous simulation and optimization in the GPS-X model. For the formulated troubleshooting and decision support strategy, the simulation results for WAS flow significantly reduced the sludge blanket depth in the primary and secondary clarifiers when operated within the range of 15 ± 5 m3/d and 83 ± 7 m3/d, respectively, while the RAS flow was 150 ± 10 m3/d. The SRT was optimized as 5 ± 1 d and 6.7 ± 0.5 d in the secondary and primary clarifiers, respectively. The addition of molasses in the aeration tank activated the microbial growth at a flow of Qflow as 0.5 ± 0.05 m3/d, and in turn the plant reduced the pollution load to 20 kg/d. Due to the variation in influent wastewater as a result of rainfall intrusion, Qinf was optimized to be 600 ± 50 m3/d. Finally, the optimum air flow into the aeration tank was 550 ± 5 m3/hr which saved 91.5% of energy than the existing process and enhanced the treatment performance. For the small variation in WAS, RAS, SRT, and air flow, the influence of process control parameters in the primary and secondary clarifier and the aeration tank were significant on the plant performance. The treatment plant was sensitive to a wide range of variations for each process control parameter. Furthermore, the troubleshooting and decision support strategy proposed based on the simulation results should be thoroughly implemented with the conscious monitoring of the key parameters at a specific location. Thus, from the results, we concluded that the optimized process control parameters tested under different troubleshooting strategies reduced energy consumption, increased effluent quality, and reduced the pollution load more than the existing processes of the plant.

Author Contributions

T.T.W.: formulating the concepts, methods, conducting field, laboratory work, analysis, and preparing the manuscript; R.B.D., D.A., E.J. and G.S.: acting as supervisors, contributing towards data interpretation, revising critically, and editing the manuscript. All authors have read and agreed to the published version of the manuscript.

Funding

Financial support for this study has been provided by Norwegian Directorate for Higher Education and Skills, University of South-Eastern Norway [Grant number WASH4ONEHEALTH/NORPART-2021/10070].

Data Availability Statement

All data generated during this study are included in this article. However, if any, additional information is required it will be shared in response to a reasonable request.

Ethical Approval

All authors have read, understood, and will keep the ethical responsibility of the authors’ guidelines.

Acknowledgments

The authors would like to thank the Bahir Dar Institute of Technology and Textile Factory for providing logistics support. The University of South-Eastern Norway is acknowledged for financial support of this work through the NORPART project and for hosting the first author for research exchange to write this manuscript. Durban University of Technology is acknowledged for hosting the student’s doctoral registration.

Conflicts of Interest

The authors declare no conflict of interest.

References

  1. Apollo, S.; Seretlo, M.; Kabuba, J. In-situ sludge degradation and kinetics of a full scale modified activated sludge system achieving near zero sludge production. J. Water Process Eng. 2023, 53, 7. [Google Scholar] [CrossRef]
  2. Flores-Alsina, X.; Arnell, M.; Amerlinck, Y.; Corominas, L.; Gernaey, K.V.; Guo, L.; Lindblom, E.; Nopens, I.; Porro, J.; Shaw, A.; et al. Balancing effluent quality, economic cost and greenhouse gas emissions during the evaluation of (plant-wide) control/operational strategies in WWTPs. Sci. Total Environ. 2014, 466, 616–624. [Google Scholar] [CrossRef]
  3. Santos, R.F.D.; Ramlow, H.; Dolzan, N.; Machado, R.A.F.; de Aguiar, C.R.L.; Marangoni, C. Influence of different textile fibers on characterization of dyeing wastewater and final effluent. Environ. Monit. Assess. 2018, 190, 12. [Google Scholar] [CrossRef]
  4. Drewnowski, J. The impact of slowly biodegradable organic compounds on the oxygen uptake rate in activated sludge systems. Water Sci. Technol. 2014, 69, 1136–1144. [Google Scholar] [CrossRef]
  5. Laizer, A.G.K.; Bidu, J.M.; Selemani, J.R.; Njau, K.N. Improving biological treatment of textile wastewater. Water Pract. Technol. 2022, 17, 456–468. [Google Scholar] [CrossRef]
  6. Flores-Alsina, X.; Comas, J.; Rodriguez-Roda, I.; Gernaey, K.V.; Rosen, C. Including the effects of filamentous bulking sludge during the simulation of wastewater treatment plants using a risk assessment model. Water Res. 2009, 43, 4527–4538. [Google Scholar] [CrossRef]
  7. Cossio, C.; Norrman, J.; McConville, J.; Mercado, A.; Rauch, S. Indicators for sustainability assessment of small-scale wastewater treatment plants in low and lower-middle income countries. Environ. Sustain. Indic. 2020, 6, 11. [Google Scholar] [CrossRef]
  8. Tran, N.H.; Ngo, H.H.; Urase, T.; Gin, K.Y.H. A critical review on characterization strategies of organic matter for wastewater and water treatment processes. Bioresour. Technol. 2015, 193, 523–533. [Google Scholar] [CrossRef]
  9. Bhave, P.P.; Naik, S.; Salunkhe, S.D. Performance Evaluation of Wastewater Treatment Plant. Water Conserv. Sci. Eng. 2020, 5, 23–29. [Google Scholar] [CrossRef]
  10. Deepnarain, N.; Nasr, M.; Kumari, S.; Stenström, T.A.; Reddy, P.; Pillay, K.; Bux, F. Decision tree for identification and prediction of filamentous bulking at full-scale activated sludge wastewater treatment plant. Process Saf. Environ. Prot. 2019, 126, 25–34. [Google Scholar] [CrossRef]
  11. De Ketele, J.; Davister, D.; Ikumi, D.S. Applying performance indices in plantwide modelling for a comparative study of wastewater treatment plant operational strategies. Water SA 2018, 44, 539–550. [Google Scholar] [CrossRef]
  12. Kumar, V.; Nakada, N.; Yamashita, N.; Johnson, A.C.; Tanaka, H. Influence of Hydraulic Retention Time, Sludge Retention Time, and Ozonation on the Removal of Free and Conjugated Estrogens in Japanese Activated Sludge Treatment Plants. Clean-Soil Air Water 2015, 43, 1289–1294. [Google Scholar] [CrossRef]
  13. Huang, M.H.; Li, Y.M.; Gu, G.W. The effects of hydraulic retention time and sludge retention time on the fate of di-(2-ethylhexyl) phthalate in a laboratory-scale anaerobic-anoxic-aerobic activated sludge system. Bioresour. Technol. 2008, 99, 8107–8111. [Google Scholar] [CrossRef]
  14. Sun, C.X.; Zhang, B.; Chen, Z.; Qin, W.T.; Wen, X.H. Sludge retention time affects the microbial community structure: A large-scale sampling of aeration tanks throughout China. Environ. Pollut. 2020, 261, 10. [Google Scholar] [CrossRef]
  15. Zinatizadeh, A.A.; Rahimi, Z.; Younesi, H. Sludge Blanket Height (SBH) as a Process Stability Indicator in UASFF Reactor: Relationship Between SBH and Sludge Concentration at Different Operating Conditions. Waste Biomass Valorization 2020, 11, 4003–4012. [Google Scholar] [CrossRef]
  16. Hakanen, J.; Sahlstedt, K.; Miettinen, K. Wastewater treatment plant design and operation under multiple conflicting objective functions. Environ. Model. Softw. 2013, 46, 240–249. [Google Scholar] [CrossRef]
  17. Dai, H.L.; Chen, W.L.; Lu, X.W. The application of multi-objective optimization method for activated sludge process: A review. Water Sci. Technol. 2016, 73, 223–235. [Google Scholar] [CrossRef]
  18. Latif, E.F. Applying novel methods in conventional activated sludge plants to treat low-strength wastewater. Environ. Monit. Assess. 2022, 194, 14. [Google Scholar] [CrossRef]
  19. Cao, J.; Yang, E.; Xu, C.; Zhang, T.; Xu, R.; Fu, B.; Feng, Q.; Fang, F.; Luo, J. Model-based strategy for nitrogen removal enhancement in full-scale wastewater treatment plants by GPS-X integrated with response surface methodology. Sci. Total Environ. 2021, 769, 10. [Google Scholar] [CrossRef]
  20. Pons, M.N.; Spanjers, H.; Jeppsson, U. Towards a benchmark for evaluating control strategies in wastewater treatment plants by simulation. Comput. Chem. Eng. 1999, 23, S403–S406. [Google Scholar] [CrossRef]
  21. Meier, M. Modeling and Simulation of Flows and Biological Reactions in an Activated Sludge Basin. Chem. Ing. Tech. 2016, 88, 1128–1137. (In German) [Google Scholar] [CrossRef]
  22. Jeppsson, U.; Pons, M.N.; Nopens, I.; Alex, J.; Copp, J.B.; Gernaey, K.V.; Rosen, C.; Steyer, J.P.; Vanrolleghem, P.A. Benchmark simulation model no 2: General protocol and exploratory case studies. Water Sci. Technol. 2007, 56, 67–78. [Google Scholar] [CrossRef] [PubMed]
  23. Wang, S.B. Effect of different sludge reduction methods on sludge reduction rates, performance of activated sludge process and urban planning. Desalination Water Treat. 2014, 52, 6363–6368. [Google Scholar] [CrossRef]
  24. Wang, R.; Yu, Y.; Chen, Y.; Pan, Z.; Li, X.; Tan, Z.; Zhang, J. Model construction and application for effluent prediction in wastewater treatment plant: Data processing method optimization and process parameters integration. J. Environ. Manag. 2022, 302, 7. [Google Scholar] [CrossRef] [PubMed]
  25. Sid, S.; Volant, A.; Lesage, G.; Heran, M. Cost minimization in a full-scale conventional wastewater treatment plant: Associated costs of biological energy consumption versus sludge production. Water Sci. Technol. 2017, 76, 2473–2481. [Google Scholar] [CrossRef] [PubMed]
  26. Elawwad, A.; Matta, M.; Abo-Zaid, M.; Abdel-Halim, H. Plant-wide modeling and optimization of a large-scale WWTP using BioWin’s ASDM model. J. Water Process Eng. 2019, 31, 8. [Google Scholar] [CrossRef]
  27. Silva, C.; Rosa, M.J. A Practical Methodology for Forecasting the Impact of Changes in Influent Loads and Discharge Consents on Average Energy Consumption and Sludge Production by Activated Sludge Wastewater Treatment. Sustainability 2021, 13, 12293. [Google Scholar] [CrossRef]
  28. Nelson, M.I.; Alqahtani, R.T.; Hai, F.I. Mathematical modelling of the removal of organic micropollutants in the activated sludge process: A linear biodegradation model. Anziam J. 2018, 60, 191–229. [Google Scholar] [CrossRef]
  29. Van Loosdrecht, M.C.M.; Lopez-Vazquez, C.M.; Meijer, S.C.F.; Hooijmans, C.M.; Brdjanovic, D. Twenty-five years of ASM1: Past, present and future of wastewater treatment modelling. J. Hydroinformatics 2015, 17, 697–718. [Google Scholar] [CrossRef]
  30. Smith, R.; Elger, S.; Mleziva, S. Wastewater Solids retention time control in wastewater treatment. Filtr. Sep. 2014, 51, 12–17. [Google Scholar] [CrossRef]
  31. Xiong, H.L.; Chen, J.L.; Wang, H.; Shi, H.C. Influences of volatile solid concentration, temperature and solid retention time for the hydrolysis of waste activated sludge to recover volatile fatty acids. Bioresour. Technol. 2012, 119, 285–292. [Google Scholar] [CrossRef] [PubMed]
  32. Cadet, C.; Guillet, A.; Aurousseau, M. Dynamic Modeling of an Activated Sludge Process: Case Study on Paper Mill Effluents. J. Environ. Eng. 2016, 142, 9. [Google Scholar] [CrossRef]
  33. Ni, B.J.; Yu, H.Q.; Sun, Y.J. Modeling simultaneous autotrophic and heterotrophic growth in aerobic granules. Water Res. 2008, 42, 1583–1594. [Google Scholar] [CrossRef] [PubMed]
  34. Muoio, R.; Palli, L.; Ducci, I.; Coppini, E.; Bettazzi, E.; Daddi, D.; Fibbi, D.; Gori, R. Optimization of a large industrial wastewater treatment plant using a modeling approach: A case study. J. Environ. Manag. 2019, 249, 9. [Google Scholar] [CrossRef]
  35. Revilla, M.; Galan, B.; Viguri, J.R. Analysis and modelling of predation on biofilm activated sludge process: Influence on microbial distribution, sludge production and nutrient dosage. Bioresour. Technol. 2016, 220, 572–583. [Google Scholar] [CrossRef] [PubMed]
  36. Nadeem, K.; Alliet, M.; Plana, Q.; Bernier, J.; Azimi, S.; Rocher, V.; Albasi, C. Modeling, simulation and control of biological and chemical P-removal processes for membrane bioreactors (MBRs) from lab to full-scale applications: State of the art. Sci. Total Environ. 2022, 809, 30. [Google Scholar] [CrossRef]
  37. Mu’azu, N.D.; Alagha, O.; Anil, I. Systematic Modeling of Municipal Wastewater Activated Sludge Process and Treatment Plant Capacity Analysis Using GPS-X. Sustainability 2020, 12, 8182. [Google Scholar] [CrossRef]
  38. Chen, Y.; Lan, S.; Wang, L.; Dong, S.; Zhou, H.; Tan, Z.; Li, X. A review: Driving factors and regulation strategies of microbial community structure and dynamics in wastewater treatment systems. Chemosphere 2017, 174, 173–182. [Google Scholar] [CrossRef]
  39. Araujo, S.; Damianovic, M.; Foresti, E.; Florencio, L.; Kato, M.T.; Gavazza, S. Biological treatment of real textile wastewater containing sulphate, salinity, and surfactant through an anaerobic-aerobic system. Water Sci. Technol. 2022, 85, 2882–2898. [Google Scholar] [CrossRef]
  40. Flores-Alsina, X.; Gallego, A.; Feijoo, G.; Rodriguez-Roda, I. Multiple-objective evaluation of wastewater treatment plant control alternatives. J. Environ. Manag. 2010, 91, 1193–1201. [Google Scholar] [CrossRef]
  41. Beltran, S.; Maiza, M.; de la Sota, A.; Villanueva, J.M.; Ayesa, E. Advanced data management for optimising the operation of a full-scale WWTP. Water Sci. Technol. 2012, 66, 314–320. [Google Scholar] [CrossRef]
  42. Rajaei, M.; Nazif, S. Improving wastewater treatment plant performance based on effluent quality, operational costs, and reliability using control strategies for water and sludge lines. Process Saf. Environ. Prot. 2022, 167, 398–411. [Google Scholar] [CrossRef]
  43. Tomperi, J.; Koivuranta, E.; Kuokkanen, A.; Juuso, E.; Leiviska, K. Real-time optical monitoring of the wastewater treatment process. Environ. Technol. 2016, 37, 344–351. [Google Scholar] [CrossRef]
  44. Li, M.H.; Hu, S.F.; Xia, J.W.; Wang, J.; Song, X.N.; Shen, H. Dissolved Oxygen Model Predictive Control for Activated Sludge Process Model Based on the Fuzzy C-means Cluster Algorithm. Int. J. Control Autom. Syst. 2020, 18, 2435–2444. [Google Scholar] [CrossRef]
  45. Vilanova, R.; Santin, I.; Pedret, C. Control and operation of wastewater treatment plants: Challenges and state of the art. Rev. Iberoam. De Autom. E Inform. Ind. 2017, 14, 329–345. [Google Scholar] [CrossRef]
  46. Wei, T.; Ban, Z.; Ke, X.; Chen, A.; Guan, X.; Gan, H.; Pan, J.; Li, Z.; Wei, C.; Qiu, G.; et al. A combined process model for wastewater treatment based on hydraulic retention time and toxicity inhibition. Chemosphere 2023, 329, 11. [Google Scholar] [CrossRef] [PubMed]
  47. US EPA. 3 May 2023. Available online: https://www.epa.gov/home (accessed on 18 May 2023).
  48. Odegaard, H.; Skrovseth, A.F. An evaluation of performance and process stability of different processes for small wastewater treatment plants. Water Sci. Technol. 1997, 35, 119–127. [Google Scholar] [CrossRef]
  49. Diehl, S.; Zambrano, J.; Carlsson, B. Steady-state analysis of activated sludge processes with a settler model including sludge compression. Water Res. 2016, 88, 104–116. [Google Scholar] [CrossRef]
  50. Cadet, C.; Guillet, A.; Aurousseau, M. An efficient activated sludge model for operator support in paper mill wastewater treatment plants. Environ. Eng. Manag. J. 2015, 14, 1111–1123. [Google Scholar] [CrossRef]
  51. Liwarska-Bizukojc, E.; Andrzejczak, O.; Solecka, M. Study on activated sludge flocs morphology and composition in a full-scale wastewater treatment plant in poland. Environ. Prot. Eng. 2019, 45, 69–82. [Google Scholar] [CrossRef]
Figure 1. Textile wastewater treatment plant process flow diagram.
Processes 11 02995 g001
Figure 2. Plant process control parameters optimization methodology framework.
Processes 11 02995 g002
Figure 3. Influent wastewater flow (Qinf) variation influence on plant operation and performance.
Processes 11 02995 g003
Figure 4. Primary clarifier underflow rate or waste-activated sludge (WAS) flow influence on plant operation.
Processes 11 02995 g004
Figure 5. Secondary clarifier underflow rate or recycle-activated sludge (RAS) flow influence on plant operation.
Processes 11 02995 g005
Figure 6. Secondary clarifier pumped flow or waste-activated sludge (WAS) flow influence on plant operation.
Processes 11 02995 g006
Figure 7. Influence of air flow (m3/h) into the aeration tank on plant performance.
Processes 11 02995 g007
Figure 8. Influence of secondary clarifier sludge retention time (SRT) on plant performance.
Processes 11 02995 g008
Figure 9. Influence of additional molasses flow on plant performance.
Processes 11 02995 g009
Figure 10. The simulation results of final effluent concentration of treatment process for existing (old) process.
Processes 11 02995 g010
Figure 11. The simulation results of final effluent concentration of treatment process using troubleshooting strategy.
Processes 11 02995 g011
Disclaimer/Publisher’s Note: The statements, opinions and data contained in all publications are solely those of the individual author(s) and contributor(s) and not of MDPI and/or the editor(s). MDPI and/or the editor(s) disclaim responsibility for any injury to people or property resulting from any ideas, methods, instructions or products referred to in the content.

