Abstract
Aqueous solutions of glycerol are widely used as model fluids in flow phenomena experiments. The design of these experiments involves the description of the physical properties of liquids and the refractive index matching using a salt, i.e., calcium chloride. The first part of this paper describes the physical properties of aqueous solutions of glycerol. Refractive index, viscosity, and density were measured for a mass fraction of glycerol in a range from 0 to 1 and compared to the data in the literature. In the second part, calcium chloride was added to aqueous solutions of glycerol, and the variations of density, viscosity, and refractive index with the mass fraction of calcium chloride were reported, which is a new contribution to literature. The main novelties of this work are (1) the development and validation of a set of equations to predict the rheological and physical properties of model fluids for flow studies involving dissimilar fluids; (2) the introduction of an algorithm to match the refractive index of fluids using calcium chloride. The model fluids are designed for large throughput experiments of industrial units, and low-cost solutions were considered. A Matlab script is provided that enables the easy implementation of this method in other works.
1. Introduction
Glycerol–water systems provide a wide range of Newtonian liquids with viscosities by over three orders of magnitude. Accordingly, glycerol solutions are widely used to tune the physical properties of fluids, such as viscosity, in order to be applied in dissimilar fluids flow studies [1,2,3,4]. The use of glycerol solutions as working fluids in flow phenomena enables work at a wide range of Reynolds number and so at distinct working conditions. The accurate determination of the physical properties (density and viscosity) of aqueous glycerol solutions facilitates the modeling of fluids in order to achieve the desired physical properties [5].
The main drawbacks of using water–glycerol systems in fluid mechanics studies are mainly associated with highly concentrated solutions. The three main problems are the presence of free air bubbles enclosed in the highly viscous solutions; the hygroscopic features of these solutions mean that fluid changes its composition and viscosity easily over time, and the strong viscosity dependence requires tight control on temperature. For more diluted concentrations, most of these problems are dimmed. For example, at 22 °C, in pure glycerol, the viscosity varies 23% with 1% increase in water fraction, and 8% with a 1 °C difference. For an aqueous glycerol solution with 77.5% mass fraction, the viscosity varies 8% with 1% increase in water fraction, and 4% with a 1 °C difference. Furthermore, the air bubbles escape velocity is twenty-fold faster. A full discussion on the hurdles of using pure glycerol as a working fluid is thoroughly discussed in Herzog [6]. Based on this, it is strongly recommended to use water–glycerol systems as working fluids at viscosity ranges below 40 mPa·s whenever possible.
Flow visualization experiments usually involve the mixing of fluids with different physical properties, such as viscosity and density [7,8,9,10,11,12,13,14,15,16,17,18,19,20,21,22,23,24,25,26,27]. Different visualization techniques in flow phenomena studies have been used to track the flow of dissimilar streams. The performance of these techniques is compromised by the differences in the refractive indices of the two dissimilar liquid streams. Figure 1 shows two photographs of mixing of two dissimilar fluids in confined impinging jets mixers using the planar laser-induced fluorescence (PLIF) technique. In Figure 1a, the two liquid streams have a viscosity ratio of 4, and the respective refractive indices were not matched. In Figure 1b, the streams have a viscosity ratio of 2 and calcium chloride was added to the less viscous fluids to match both refractive indices. In order to overcome this problem, salts can be added to the aqueous solutions of glycerol for the refractive index matching (RIM) of both liquid streams.
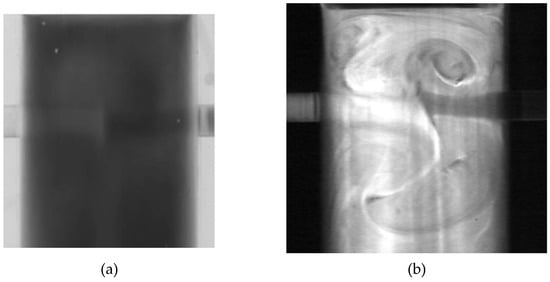
Figure 1.
Flow visualization in confined impinging jets of mixing of two dissimilar fluids (a) with a viscosity ratio of 4 and without refractive index matching and (b) with a viscosity ratio of 2 and with refractive index matching.
Liquid–liquid and solid–liquid systems and their respective RIM methods have been widely proposed in the literature [28,29,30,31,32,33,34]. Table 1 is a list of some RIM works, which are divided into two groups:

Table 1.
List of works on refractive index matching.
- RIM of fluids and the walls of the flow geometry;
- RIM of two fluids in the same flow.
Regarding RIM studies of liquid–liquid systems, they are mostly related to miscible fluids with low viscosity and, therefore, experiments are usually conducted under turbulent flow regimes. For instance, Borrero-Echeverry and Morrison [30] proposed the aqueous ammonium thiocyanate (NH4SCN) as a working fluid with a viscosity range between that corresponds to a mass fraction of NH4SCN range between 49.8% and 62.8%. Bai and Katz [29] proposed the sodium iodide solution for RIM, and reported the respective equations of viscosity and density for a concentration range of sodium iodide solution of 10–63% and temperatures between 10 and 90 °C. For multiphase systems, double-binary mixtures for both immiscible phases, such as n-hexane/sunflower oil and water/glycerol, were established for RIM [33].
Regarding the effect of RIM salts on physical properties, Chenlo, et al. [35] reported the variation of viscosity of glycerol solutions using NaCl. In the concentration range of NaCl from 0 to 5 mol/kg of solution, the viscosity always increased less than 50%.
Although there is extensive knowledge on the refractive index matching, this study proposes miscible model fluids, aqueous solution of glycerol, with a wide range of viscosity, between 1 and 1000 mPa·s, for fundamental studies applications under laminar flow regimes. The results of this work extend the application of glycerol solutions for a wide range of flow conditions due to the viscosity range. A particular aspect is the low cost of viscous model fluids to enable large scale industrial studies. Low-cost model fluids have been covered, for example, in Daviero, et al. [36] (Table 1), but for typical fluids with low viscosity in ocean flow.
In this work, experimental results were compared with empirical correlations for the calculation of viscosity, density, and refractive index. Measurements using industrial and analytical glycerol were performed at temperatures in a range from to . The differences between the two glycerol grades (industrial and analytical glycerol) stem from the purity of the solution, which is approximately 0.4%. The analytical glycerol has higher purity than the industrial glycerol. A particular objective of this study is to report the influence of purity of glycerol on the physical properties.
The second part of this work involved the preparation of aqueous solutions of glycerol with different mass fractions of calcium chloride, which is the salt used to RIM. The refractive index was measured in a refractometer for a temperature range between and . The density and viscosity of aqueous solutions of glycerol and calcium chloride were reported at and , respectively. Expressions based on the experimental results were demonstrated to describe viscosity, density, and refractive indices.
This work proposes and validates a set of equations to determine model fluids’ rheological and physical properties for flow studies involving dissimilar fluids. A Matlab script is then provided as Supplementary Material, enabling its implementation in other scientific works.
2. Experimental Section
2.1. Materials
The chemicals used in this work, the respective suppliers, the physical properties, and their purity are listed in Table 2. The aqueous solutions of glycerol were prepared using industrial or analytical glycerol and tap water. The analytical glycerol was purchased in a pharmacy while the industrial glycerol was supplied by a local company that trades raw materials and chemicals for the manufacturing industry, Sociedade Portuense de Drogas. The analytical glycerol was a pharmaceutical grade with a reported purity ≥99.9 wt/wt%, while the industrial glycerol, which is of animal source, has a reported purity of ≥99.5 wt/wt%, according to the technical datasheet. The remaining fractions are reported in the respective datasheet as other fatty acids.
Table 2.
Information for used chemicals in this work.
Aqueous solutions of glycerol and calcium chloride were prepared, adding the salt to the aqueous solutions of glycerol. The calcium chloride dihydrate, CaCl22H2O, was purchased in VWR (VWRC22322.466). This compound has a limit of solubility in water of at .
2.2. Methods
The aqueous solutions of glycerol were prepared in glass vials, measuring the mass of glycerol and then the total mass of solution. The densities of aqueous glycerol solutions were measured using a pycnometer of . An analytical balance with an accuracy of ±0.001 g was used in the preparation of solutions and for the density calculations. The experiments were performed at , , and .
The viscosity of solutions was measured using a rheometer Anton Paar MCR 92 SN82478971. The geometry used for these measurements was a plate/plate system whose diameter is 50 mm. The gap between the two parallel plates was 0.5 mm. The rheological tests were performed at , , and .
The refractive indices of solutions were measured using a digital Optic Ivymen system ABBE Refractometer (AB-R-100D) with an accuracy of ±0.0001. The refractometer is connected to a water bath in order to control the operating temperature. The measurements of the refractive index were performed at , , and .
The pycnometer, rheometer, and refractometer were calibrated using standard liquids, for instance, oils. The reproducibility of measurements presented in this work was checked from the triplicates.
3. Results and Discussion
Density of Glycerol Solutions
The first study addresses the variation of density with the mass fraction of glycerol using analytical and industrial glycerol. The mass fraction of glycerol is defined as , where is the glycerol mass in solution and is the total mass of solution.
Figure 2 shows the variation of density with the mass fraction of glycerol at for an aqueous solution of analytical glycerol and an aqueous solution of industrial glycerol. The density increases linearly with and no significant differences in the density are reported for solutions of analytical and industrial glycerol. This means that the purity of glycerol does not influence the density of the mixture.
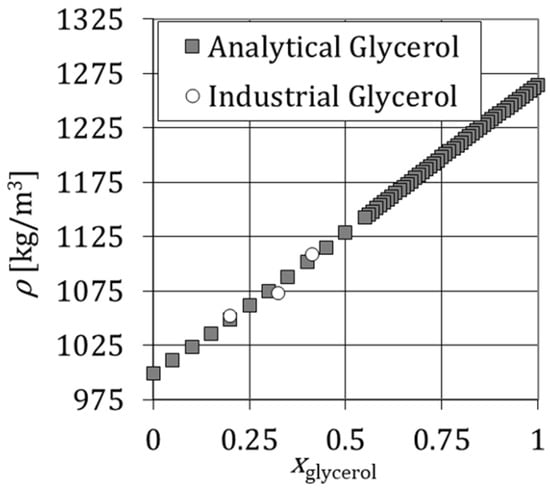
Figure 2.
Variation of density of glycerol solutions versus the mass fraction of analytical and industrial glycerol, xglycerol, at θ = 288.16 K.
The density also depends on the operating temperature, and thus the density of aqueous solutions of analytical glycerol was reported for three distinct temperatures. Figure 3 shows the variation of density for at , and and the respective trendlines. The trendlines, i.e., the lines that best fit the points, presented in this work were determined from the method of least squares in Microsoft Excel. Figure 3 shows that the density of aqueous solutions of glycerol can be obtained from Takamura, et al. [42]
where is the density of glycerol in kg/m3 and is the density of water in kg/m3, which depend on the operating temperatures according to
where θ is the temperature in Kelvin [43].
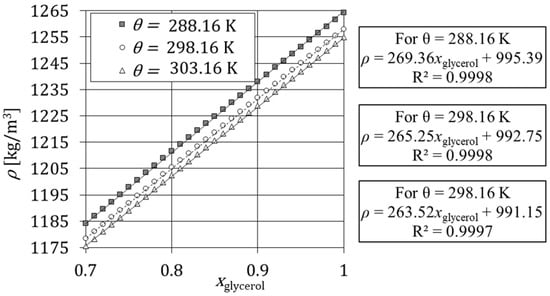
Figure 3.
Variation of density of glycerol solutions versus the mass fraction of analytical glycerol between 0.7 and 1 and the respective trendlines.
The experimental results and the respective expressions were compared to data in the literature [42,44]. In the temperature range between and , the maximum deviation of the experimental results and literature data is 0.55% for Perry and Chilton [44] and 0.22% for Takamura, Fischer and Morrow [42].
Volk and Kähler [5] also proposed a comprehensive model to describe the density of aqueous solutions of glycerol. This model considers the volume contraction, κ, which occurs in most liquid mixtures. This means that the final volume of the mixture is smaller than the sum of each component volume. Thus, the density expression for aqueous solutions of glycerol is given by
where is the volume fraction of glycerol.
The volume contraction, κ, in Equation (3) can be estimated by
where is the temperature-dependent coefficient;
where in θ is the temperature in Kelvin. The variable Q is dimensionless, according to Equations (3) and (4).
The determination of water and glycerol densities (kg/m3) in Equation (3) is proposed by Volk and Kähler [5] as
The previous model for water density works well enough in the range of temperatures for most experimental work, 288 K to 300 K. A more general model providing the best fit can be obtained in the NIST Chemistry Webbook [45], which would be preferable to obtain the water density over wide ranges of temperature. However, for the working temperature ranges in this work, Equation (6) gives a good estimation of water density.
It is quite useful to make an explicit relationship between the mass fraction and the volume fraction to determine the mixture density in Equation (3). This relationship is given by
If the solution contraction is less than 1.6%, the following simplification can be made: .
Note that Equations (2) and (6) both describe the same quantities, such as the water and glycerol density; however, Equation (2) is used to determine the density of the water–glycerol system described by Equation (1). Equation (6) is proposed by Volk and Kähler [5] to determine the density of pure liquids and is only considered for sake of comparison and as entry values for Equation (7).
The accurate determination of the density of mixtures of glycerol and water from the model proposed by Volk and Kähler [5] was verified using experimental data. Table 3 shows the comparison between models of Equations (1) and (3) and the experimental data at , , and and the respective deviation, δ. The model of Volk and Kähler [5] that takes into account the volume contraction gives the best description of the density of fluids in the temperature range studied since smaller values of δ were reported.
Table 3.
The maximum deviation between models described by Equations (1) and (3) and experimental data.
4. Viscosity of Glycerol Solution
The variation of viscosity with was studied using industrial and analytical glycerol. Figure 4 and Figure 5 show the viscosity versus the mass fraction of glycerol at and at , respectively. These rheological tests were measured for a shear rate range from 10 to 100 s−1. Figure 5 compares the viscosity of industrial and analytical glycerol at . Measurements plotted in Figure 4 and Figure 5 show that the viscosity grows by orders of magnitude with ; this is particularly striking for .
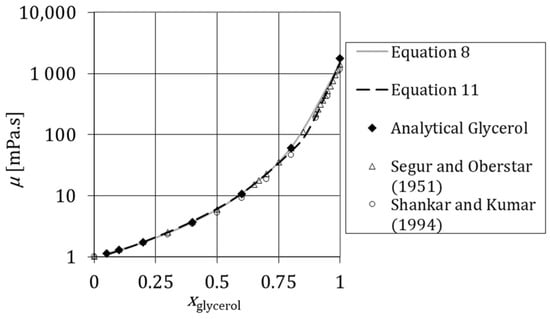
Figure 4.
Variation of viscosity of aqueous solutions of glycerol with the mass fraction of glycerol at θ = 293.15 K measured experimentally (Analytical Glycerol) and the respective comparison with Equation (8), Equation (10) and the data in the literature [46,47].
Figure 5.
Variation of viscosity of aqueous solutions of glycerol with the mass fraction of glycerol at θ = 298.15 K measured experimentally (Analytical Glycerol and Industrial Glycerol) and the respective comparison with Equation (8), Equation (10) and the data in the literature [47].
Figure 4 shows that the viscosity of solution prepared with industrial and analytical glycerol is very similar. Figure 4 also shows that there is a good agreement between measured data and data in the literature [46,47]. The experimental results are also compared to data in Weast and Astte [48]. In the temperature range between and , the maximum deviation of the experimental results and literature data is 3.6% for Weast and Astte [48].
Figure 5 shows that no significant differences between industrial and analytical glycerol are reported at . This means that the purity of glycerol does not have a considerable effect on the viscosity of aqueous solutions of glycerol. Figure 5 also shows that there is a good agreement between experimental data and data in the literature [47].
In the last decades, authors have suggested expressions for the viscosity of aqueous solutions of glycerol. Cheng [49] proposed an empirical formula to describe the viscosity of a glycerol–water mixture for a mass fraction of glycerol in the range between 0 and 1,
where and are the viscosities of glycerol and water, respectively, and is the weighting factor varying from 0 and 1, which is defined by
where coefficients c and d are and , where is the temperature in Kelvin.
Cheng [49] determined two expressions to calculate the viscosity of water and glycerol: and where is the temperature in Kelvin.
Santos, Erkoç, Dias, Teixeira and Lopes [43] also proposed an expression that describes the viscosity of a glycerol–water system obtained from experimental data in the ranges of and . The expression is given by
where μ is viscosity in mPa·s, θ is the temperature at Kelvin, and the constants are , , , and Other methods were also considered in the preparation of this work, such as the models proposed byReid, et al. [50], Van de Ven [51], and Takamura and Van De Ven [52]. However, these models are not presented in this discussion because the maximum deviation of experiments from models is over 50%.
5. Refractive Index of Glycerol Solution
The variation of the refractive index was studied for a range of between 0.6 and 1. Samples of industrial and analytical glycerol solutions are used to study the refractive index, which is defined as
where and are the speed of light in vacuum () and in a specific medium, respectively [42].
Figure 6 shows the variation of the refractive index versus the mass fraction of analytical and industrial glycerol at , and the respective error bars. Figure 6 also shows that there is a difference of 0.009 between the analytical glycerol and Equation (11) and 0.003 between the industrial glycerol and Equation (11). These differences are quite significant for rigorous laboratory work. However, for flow visualization, the prediction of refractive index from Equation (11) guarantees the error up to 0.007, which enables the clear visualization of liquid streams. PLIF images of different aqueous solutions of glycerol are reported successfully in Brito, Esteves, Fonte, Dias, Lopes and Santos [9] and Brito, et al. [53].
Figure 6.
Variation of refractive index of analytical and industrial glycerol solutions with the mass fraction of glycerol at θ = 298.15 K measured experimentally (Analytical Glycerol and Industrial Glycerol) and determined from Equation (12).
Figure 6 also shows that the refractive index increases with the mass fraction of glycerol. These results are described by the expression
where and are the refractive indices of water and glycerol, respectively Takamura, Fischer and Morrow [42]. Literature reports that Larin, et al. [54] and at Polyanskiy [41].
The refractive index also depends on temperature. The increase in temperature causes a decrease of density, promoting the rising of the light speed in that liquid. According to Equation (12), the increase of light speed in a medium causes the decrease of the refractive index. Therefore, the refractive index decreases with temperature. Table 4 reports the refractive index of two aqueous solutions of industrial glycerol, and , at and . For an increase of 10 K, the refraction index decreases 0.0009 for and 0.0002 for an aqueous solution of . As expected, the temperature rising promotes a decrease in the refractive index; however, only the fourth decimal place of the refractive index is affected by this increase in temperature, which is not significant in the experiments based on optical techniques performed at room temperature, i.e., in a temperature range from 293.15 K and 303.15 K.
Table 4.
Refractive index of two aqueous solutions of industrial glycerol, and , at and .
Figure 2, Figure 5 and Figure 6 show that the differences in density, viscosity, and refractive indices for aqueous solutions of industrial and analytical glycerol are not significant for the purpose of this work. Thus, the physical properties analyzed in this work are not affected by the purity of glycerol. The same viscosity, density, and refractive index results were achieved for analytical and industrial glycerol. The main advantage of this issue concerns the purchase cost of both liquids. The analytical glycerol is sold in a pharmacy for approximately EUR 24/L, while the industrial glycerol was purchased in a local company for EUR 1.8/L. Since fundamental studies require large quantities of aqueous solutions of glycerol, it would be more affordable to use industrial glycerol.
6. Refractive Index of Aqueous Solutions of Glycerol and Calcium Chloride Dihydrate
The refractive index can be manipulated using salts, such as calcium chloride or sodium chloride. In this work, calcium chloride dihydrate (CaCl2·2H2O) was used to test the effect on the physical properties of aqueous solutions of glycerol. From the arguments presented in this work, viscosity, density, and refractive index are not affected by the glycerol grade. Therefore, industrial glycerol will be the working fluid in the study of physical properties of aqueous solutions of glycerol and CaCl2·2H2O.
Mixing calcium chloride and water is an exothermic process. Thus, the released heat can promote the sample evaporation during the preparation of the aqueous solution of glycerol and CaCl2·2H2O. In order to avoid an abrupt rise in temperature, calcium chloride was slowly added to water and then to glycerol under intensive agitation. The refractive indices were reported for two aqueous solutions of industrial glycerol with and , where is the mass fraction of glycerol before adding calcium chloride dehydrate. The mass fraction of calcium chloride dihydrate is defined as , where is the mass of calcium chloride dihydrate and is the total mass of an aqueous solution of glycerol and calcium chloride.
Figure 7 shows the variation of refractive index with the mass fraction of CaCl2·2H2O for an aqueous solution with at three distinct temperatures, , , and . The refractive index increases linearly with the mass fraction of CaCl2·2H2O and an increase of temperature in 10 K does not have a significant impact on the refractive indices.
Figure 7.
Variation of refractive index of aqueous solutions with the mass fraction of CaCl2·2H2O.
Figure 8 shows the variation of refractive indices with the mass fraction of calcium chloride dihydrate for a solution of glycerol with at , , and .
Figure 8.
Variation of refractive index of aqueous solutions with the mass fraction of CaCl2·2H2O.
The expression that describes the variation of refraction index as a function of the mass fraction of CaCl2·2H2O can be obtained from the trendlines drawn in Figure 7 and Figure 8:
where is the refractive index of the mixture of an aqueous solution of glycerol and calcium chloride dihydrate, is the mass fraction of calcium chloride dihydrate, is a factor that depends on the initial mass fraction of glycerol, , and is the refractive index of a glycerol–water system when . Figure 7 and Figure 8 show that Equation (13) is valid for any operating temperature.
The variation of h as a function of can be determined by the trendline of the slopes for , , , and . The h expression is linear (), Considering this expression, Equation (13) results in
The experimental results were compared with Equation (14), where is determined by the equation that describes the refractive index of a glycerol–water system, Equation (12). At θ = 298.15 K, the maximum deviation for is 1.32%, and for is 1.98%.
The validation of Equation (14) as empirical correlation provides a tool for the design of aqueous solutions of glycerol at room temperature, i.e., in the range from 293.15 K and 303.15 K. This expression calculates the refractive index of an aqueous solution of glycerol and calcium chloride for RIM of two dissimilar fluids. This expression is a design tool for model fluids in the flow phenomena.
7. Density of Aqueous Solutions of Glycerol and Calcium Chloride Dihydrate
The adding of calcium chloride dihydrate to aqueous solutions of glycerol could also affect other physical properties, such as the density of solutions.
The density of aqueous solution of glycerol and calcium chloride dihydrate was checked using a ROTA-Yokogawa Coriolis flow meter (model RCCS33 M01A1SH). This flow meter measures the mass of fluid in a unit of time flowing through a pipe. Moreover, these devices measure the density of fluids. For that, these devices have incorporated a U-shaped tube wherein the fluid flow inside and the Coriolis forces are generated at outlet and inlet of the tube. The vibration frequency in the U-shaped tube depends on the mass of the tube and the mass of fluid. The mass of fluid can be calculated from the vibration frequency and the known mass of the tube. From this, the density is obtained, dividing the mass of fluid and the known volume of fluid.
Table 5 shows the density of aqueous solutions of glycerol and calcium chloride dihydrate measured in Coriolis flow meter at .
Table 5.
Densities of aqueous solutions of glycerol and calcium chloride dihydrate and the respective deviation at measured using a ROTA-Yokogawa Coriolis flow meter.
The experimental results were compared with the expression
where is the mass fraction of CaCl2·2H2O and is the density of CaCl2·2H2O. The volume contraction was not considered in the estimation of the density of aqueous solutions of glycerol and calcium chloride.
The densities of solutions listed in Table 5 were determined by Equation (15). For the solution , the deviation is 3.16% and for , the deviation is 1.91%.
8. Viscosity of Glycerol Solution and Calcium Chloride Dihydrate
The viscosity is also changed by adding calcium chloride dihydrate to aqueous solutions of glycerol. Three different aqueous solutions of glycerol were prepared with an initial mass fraction of glycerol of , , and . The initial viscosity of each solution can be calculated from Equation (10), , , and . For each aqueous solution of glycerol, solutions with different mass fractions of CaCl2·2H2O were prepared, and the respective viscosities were measured at .
The variation of viscosity with the mass fraction of CaCl2·2H2O is in Figure 9. These rheological tests were measured for a shear rate range from 10 to 100 s−1. The viscosity increases exponentially with the mass fraction of calcium chloride dehydrate.
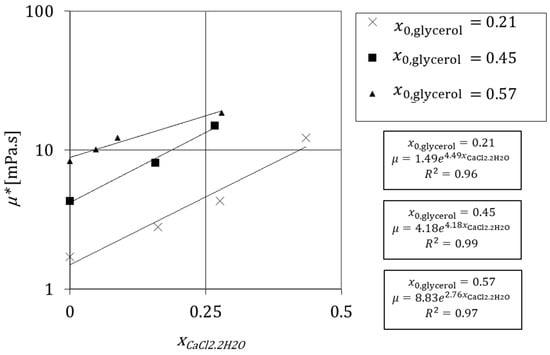
Figure 9.
Variation of viscosity of aqueous solutions of glycerol with the mass fraction of CaCl2·2H2O at θ = 295.15 K measured experimentally.
Figure 9 shows that the general expression that describes the viscosity of aqueous solutions of glycerol as a function of the mass fraction of CaCl2·2H2O is given by
where is the viscosity of the aqueous solution of glycerol for in mPa·s, is the mass fraction of CaCl2·2H2O, and f is a factor that depends on the initial viscosity, . Figure 10 displays the variation of f and for three aqueous solutions, , , and , according to the experimental data. The expression of versus the initial viscosity is described by a second-order polynomial expression, and the respective trendline of the curve is a good approximation of f. From Figure 10, the factor f is given by
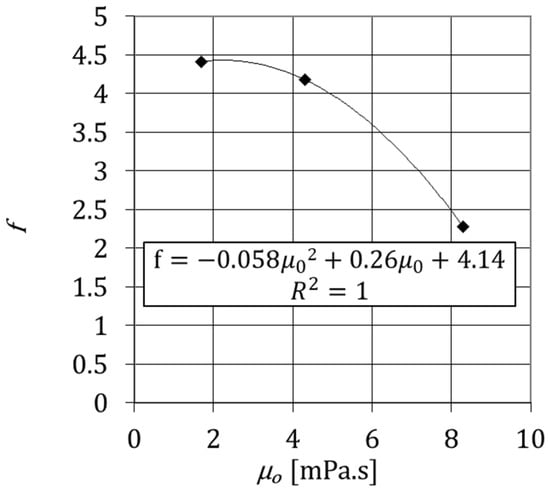
Figure 10.
Constant f as a function of the initial viscosity of aqueous solutions of glycerol at θ = 292.15 K.
Therefore, the expression that describes the viscosity of an aqueous solution of glycerol and calcium chloride dihydrate results from the combination of Equations (16) and (18):
Equation (18) is temperature-dependent because the term μ0 is a function of temperature.
9. Results Analysis
Empirical correlations that describe the physical properties of a glycerol–water system or aqueous solutions of glycerol and calcium chloride are proposed in this work. These expressions can be used for the design of model fluids in flow phenomena studies. The role of glycerol is typically to tune the viscosity of fluids. The flow dynamics are characterized from visualization techniques such as PLIF. The performance of these techniques is compromised by the unmatched refractive indices of the two dissimilar liquids. This problem is overcome by RIM using calcium chloride.
Figure 11 illustrates a flowchart for the preparation of model fluids with a specified viscosity ratio, which could be applied in PLIF studies. In this particular case study, liquids must have the same refractive indices and different viscosities according to the predefined viscosity ratio. MV means the more viscous fluid and LV means the less viscous fluid. This block diagram could be applied as a method to achieve the desired physical properties. The empirical expressions demonstrated in the last sections are referred in Figure 11, each one having a specific contribution to the design of model fluids.
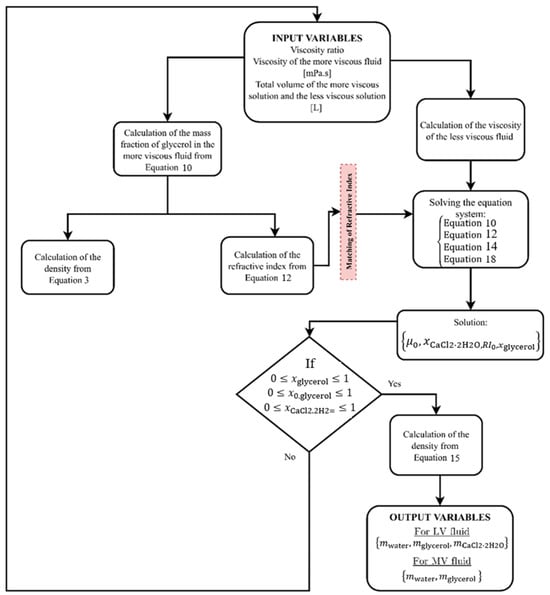
Figure 11.
Flowchart for the design of two fluids with different viscosities for multiphase flow studies using PLIF technique.
From the flowchart of Figure 11, a Matlab algorithm was developed to easily model the physical properties of aqueous glycerol solutions for flow studies involving dissimilar fluids. The Matlab script is Supplementary Material for future implementation in other scientific works. The main objective of this algorithm is to predict the mass of glycerol, water, and CaCl2·2H2O required to prepare two dissimilar fluids. It was considered that the flow visualizations are conducted at room temperature (θ = 293.15 K), and the calcium chloride was added to the less viscous fluid.
10. Conclusions
This work proposes a methodology to design model fluids with different physical properties (refractive index, viscosity, and density) for flow visualization. The successful imaging of both fluids requires the refractive index matching. The example given in this paper was the mixing of fluids with different viscosities visualized using PLIF. However, many other applications also require refractive index matching, such as oil–water emulsification or biodiesel transesterification.
The adding of salts for the refractive index matching changes the viscosity and density of fluids simultaneously. Therefore, a Matlab script is provided, defining a fixed viscosity ratio and determining the mass of salt for the refractive index matching and the respective density of fluids.
The refractive index, density, and viscosity were first reported for glycerol–water systems. The refractive index and density increase linearly with the mass fraction of glycerol. Moreover, the experimental results show that the viscosity increases with the mass fraction of glycerol. These results were well fitted by the expressions and data presented in the literature.
Physical properties were also calculated for aqueous solutions of glycerol and calcium chloride dehydrate. It was also reported that the increase in the mass fraction of calcium chloride dihydrate is related to an increase in the refractive index, density, and viscosity. The refractive index increases linearly with the mass fraction of calcium chloride dihydrate and no significant differences are reported for an increase of 10 K in temperature. On the other hand, the viscosity increases exponentially with the mass fraction of calcium chloride. Expressions based on the experimental data are proposed for the calculation of the physical properties of aqueous solutions of glycerol and calcium chloride dihydrate.
A flowchart was drawn to describe the refractive index matching of two dissimilar fluids in flow phenomena studies at θ = 293.15 K, and the respective Matlab script is provided for its implementation in future works.
Supplementary Materials
The following are available online at https://www.mdpi.com/article/10.3390/pr10071260/s1, Descripton of Matlab Script.
Funding
This work was financially supported by LA/P/0045/2020 (ALiCE); UIDB/50020/2020 and UIDP/50020/2020 (LSRE-LCM) funded by national funds through FCT/MCTES (PIDDAC); POCI-01-0145-FEDER-016851 and POCI-01-0145-FEDER-030445—funded by FEDER funds: Programa Operacional Competitividade e Internacionalização (POCI); by national funds through FCT-Fundação para a Ciência e a Tecnologia I.P.; and by FCT scholarship PD/BD/135060/2017.
Conflicts of Interest
The authors declare no conflict of interest.
Nomenclature
| c | Parameter for weighting factor calculation |
| cL | Speed of light in vacuum (m s−1) |
| d | Parameter for weighting factor calculation |
| f | Factor that depends on (mPa2·s−4) |
| h | Factor that depends on |
| Mass of calcium chloride (kg) | |
| Mass of glycerol in solution (kg) | |
| Total mass in solution (kg) | |
| Parameter for the calculation of water’s viscosity (mPa·s) | |
| Parameter for the calculation of glycerol’s viscosity (mPa·s) | |
| Parameter for the calculation of water’s viscosity (K) | |
| Q | The temperature dependent coefficient |
| Parameter for the calculation of glycerol’s viscosity (K) | |
| RI | Refractive index of a system water–glycerol |
| Refractive index of water | |
| Refractive index of glycerol | |
| RI* | Refractive index of the mixture of an aqueous solution of glycerol and calcium chloride dihydrate |
| RI0 | Refractive index of a glycerol–water system where the concentration of calcium chloride is 0 |
| V | Volume of an aqueous solution of glycerol and calcium chloride [m3] |
| Mass fraction of glycerol | |
| Initial mass fraction of a glycerol–water system where the concentration of calcium chloride is 0 | |
| Mass fraction of calcium chloride in a glycerol–water system | |
| mass fraction of glycerol in the more viscous fluid | |
| Greek Letters | |
| α | Weighting factor |
| θ | Temperature (K) |
| κ | Volume contraction |
| μ | Viscosity (mPa·s) |
| μi | Viscosity of i component (mPa·s) |
| μj | Viscosity of j component (mPa·s) |
| μ* | Viscosity of the mixture of an aqueous solution of glycerol and calcium chloride dehydrate (mPa·s) |
| μ0 | Initial viscosity of a glycerol–water system where the concentration of calcium chloride is 0 (mPa·s) |
| Speed in a specific medium (m s−1) | |
| ρ | Density of mixture (kg m−3) |
| Density of glycerol (kg m−3) | |
| Density of water (kg m−3) | |
| ρ* | Density of the mixture of an aqueous solution of glycerol and calcium chloride dehydrate (kg m−3) |
| Density of calcium chloride (kg m−3) | |
| Volume fraction | |
| Volume fraction of the dispersed particles at which the viscosity reaches an infinite value |
References
- Chen, Y.; Xu, W.; Zeng, G.; Liu, W. Shear-thickening behavior of precipitated Calcium Carbonate particles suspensions in glycerine. Appl. Rheol. 2015, 25, 1–8. [Google Scholar]
- Laurent, J.L.; Janmey, P.A.; Ferry, J.D. Dynamic Viscoelastic Properties of Gelatin Gels in Glycerol-Water Mixtures. J. Rheol. 1980, 24, 87–97. [Google Scholar] [CrossRef]
- Laven, J.; Stein, H.N. The Einstein coefficient of suspensions in generalized Newtonian liquids. J. Rheol. 1991, 35, 1523–1549. [Google Scholar] [CrossRef]
- Sato, A.C.K.; Perrechil, F.A.; Cunha, R.L. Rheological Behavior of Suspensions Dispersed in Non-Newtonian Matrix. Appl. Rheol. 2013, 23, 24–33. [Google Scholar]
- Volk, A.; Kähler, C. Density model for aqueous glycerol solutions. Exp. Fluids 2018, 59, 75. [Google Scholar] [CrossRef]
- Herzog, S. The Large Scale Structure in the Near-Wall Region of turBulent Pipe Flow; Cornell University: Ithaca, NY, USA, 1986. [Google Scholar]
- Azimi, N.; Rahimi, M.; Abdollahi, N. Using magnetically excited nanoparticles for liquid–liquid two-phase mass transfer enhancement in a Y-type micromixer. Chem. Eng. Process. 2015, 97, 12–22. [Google Scholar] [CrossRef]
- Barthès-Biesel, D. Motion and Deformation of Elastic Capsules and Vesicles in Flow. Annu. Rev. Fluid Mech. 2016, 48, 25–52. [Google Scholar] [CrossRef]
- Brito, M.S.C.A.; Esteves, L.P.; Fonte, C.P.; Dias, M.M.; Lopes, J.C.B.; Santos, R.J. Mixing of fluids with dissimilar viscosities in Confined Impinging Jets. Chem. Eng. Res. Des. 2018, 134, 392–404. [Google Scholar] [CrossRef]
- Chen, J.; Wang, Y.; Zheng, W.; Qiu, L.; Zhang, X. Theoretical Prediction of Flooding Velocity in an Inclined Tube Based on Viscous Kelvin-Helmholtz Instability. Chem. Eng. Sci. 2016, 144, 395–403. [Google Scholar] [CrossRef]
- Forte, G.; Brunazzi, E.; Alberini, F. Effect of residence time and energy dissipation on drop size distribution for the dispersion of oil in water using KMS and SMX+ static mixer. Chem. Eng. Res. Des. 2019, 148, 417–428. [Google Scholar] [CrossRef]
- Fradette, L.; Tanguy, P.; Li, H.Z.; Choplin, L. Liquid/Liquid Viscous Dispersions with a SMX Static Mixer. Chem. Eng. Res. Des. 2007, 85, 395–405. [Google Scholar] [CrossRef]
- Galletti, C.; Arcolini, G.; Mauri, R. Mixing of binary fluids with composition-dependent viscosity in a T-shaped micro-device. Chem. Eng. Sci. 2015, 123, 300–310. [Google Scholar] [CrossRef]
- Galletti, C.; Brunazzi, E.; Mauri, R. Unsteady mixing of binary liquid mixtures with composition-dependent viscosity. Chem. Eng. Sci. 2017, 164, 333–343. [Google Scholar] [CrossRef]
- Grecco Zanotti, M.A.; Gonçalves dos Santos, R. Thixotropic Behavior of Oil-in-Water Emulsions Stabilized with Ethoxylated Amines at Low Shear Rates. Chem. Eng. Technol. 2019, 42, 432–443. [Google Scholar] [CrossRef]
- Häfeli, R.; Rüegg, O.; Altheimer, M.; Rudolf von Rohr, P. Investigation of emulsification in static mixers by optical measurement techniques using refractive index matching. Chem. Eng. Sci. 2016, 143, 86–98. [Google Scholar] [CrossRef]
- Håkansson, A.; Chaudhry, Z.; Innings, F. Model emulsions to study the mechanism of industrial mayonnaise emulsification. Food Bioprod. Process. 2016, 98, 189–195. [Google Scholar] [CrossRef]
- Liu, G.; Wang, X.; Wang, K.; Tostado, C.P.; Luo, G. Effect of surface wettability on internal velocity profile during droplet formation process in microfluidic devices. Int. J. Multiph. Flow 2016, 80, 188–193. [Google Scholar] [CrossRef]
- Marcos, S.; Santos, R.J.; Kilzer, A.; Petermann, M. On the experimental investigation and numerical fluid dynamic simulation of L-L water-in-oil dispersions in Y-junctions under the presence of dissolved CO2. J. Supercrit. Fluids 2019, 146, 65–77. [Google Scholar] [CrossRef]
- Mori, Y.H. Dynamic interfacial tension in water/n-pentane system: An experimental study using the oscillating-jet method. Chem. Eng. Sci. 2016, 143, 130–138. [Google Scholar] [CrossRef]
- Piroozian, A.; Hemmati, M.; Ismail, I.; Manan, M.A.; Rashidi, M.M.; Mohsin, R. An experimental study of flow patterns pertinent to waxy crude oil-water two-phase flows. Chem. Eng. Sci. 2017, 164, 313–332. [Google Scholar] [CrossRef]
- Ramsay, J.; Simmons, M.J.H.; Ingram, A.; Stitt, E.H. Mixing of Newtonian and viscoelastic fluids using “butterfly” impellers. Chem. Eng. Sci. 2016, 139, 125–141. [Google Scholar] [CrossRef]
- Renardy, Y. Instabilities in steady flows of two fluids. Rocky Mt. J. Math. 1988, 18, 455–478. [Google Scholar] [CrossRef]
- Sarbanha, A.; Sobhanian, F.; Movahedirad, S. Mixing of the Immiscible Liquids in the Entrance Region of a T-Type Chamber Using Laser Induced Fluorescence (LIF) Method. Iran. J. Chem. Chem. Eng. 2016, 13, 32–42. [Google Scholar]
- Tsaoulidis, D.; Angeli, P. Liquid-liquid dispersions in intensified impinging-jets cells. Chem. Eng. Sci. 2017, 171, 149–159. [Google Scholar] [CrossRef]
- Yang, L.; Dietrich, N.; Loubière, K.; Gourdon, C.; Hébrard, G. Visualization and characterization of gas–liquid mass transfer around a Taylor bubble right after the formation stage in microreactors. Chem. Eng. Sci. 2016, 143, 364–368. [Google Scholar] [CrossRef]
- Zhang, D.F.; Zumbrunnen, D.A. Chaotic mixing of two similar fluids in the presence of a third dissimilar fluid. AIChE J. 1996, 42, 3301–3309. [Google Scholar] [CrossRef]
- Amini, N.; Hassan, Y.A. An investigation of matched index of refraction technique and its application in optical measurements of fluid flow. Exp. Fluids 2012, 53, 2011–2020. [Google Scholar] [CrossRef]
- Bai, K.; Katz, J. On the refractive index of sodium iodide solutions for index matching in PIV. Exp. Fluids 2014, 55, 1704. [Google Scholar] [CrossRef]
- Borrero-Echeverry, D.; Morrison, B.C.A. Aqueous ammonium thiocyanate solutions as refractive index-matching fluids with low density and viscosity. Exp. Fluids 2016, 57, 123. [Google Scholar] [CrossRef]
- Budwig, R. Refractive index matching methods for liquid flow investigations. Exp. Fluids 1994, 17, 350–355. [Google Scholar] [CrossRef]
- Clément, S.A.; Guillemain, A.; McCleney, A.B.; Bardet, P.M. Options for refractive index and viscosity matching to study variable density flows. Exp. Fluids 2018, 59, 32. [Google Scholar] [CrossRef]
- Helmers, T.; Kemper, P.; Mießner, U.; Thöming, J. Refractive index matching (RIM) using double-binary liquid–liquid mixtures. Exp. Fluids 2020, 61, 64. [Google Scholar] [CrossRef]
- Wright, S.F.; Zadrazil, I.; Markides, C.N. A review of solid–fluid selection options for optical-based measurements in single-phase liquid, two-phase liquid–liquid and multiphase solid–liquid flows. Exp. Fluids 2017, 58, 108. [Google Scholar] [CrossRef]
- Chenlo, F.; Moreira, R.; Pereira, G.; Bello, B. Kinematic viscosity and water activity of aqueous solutions of glycerol and sodium chloride. Eur. Food Res. Technol. 2004, 219, 403–408. [Google Scholar] [CrossRef]
- Daviero, G.J.; Roberts, P.J.W.; Maile, K. Refractive index matching in large-scale stratified experiments. Exp. Fluids 2001, 31, 119–126. [Google Scholar] [CrossRef]
- Saksena, R.; Christensen, K.T.; Pearlstein, A.J. Surrogate immiscible liquid pairs with refractive indexes matchable over a wide range of density and viscosity ratios. Phys. Fluids 2015, 27, 087103. [Google Scholar] [CrossRef]
- Cadillon, J.; Saksena, R.; Pearlstein, A.J. Transparent, immiscible, surrogate liquids with matchable refractive indexes: Increased range of density and viscosity ratios. Phys. Fluids 2016, 28, 127102. [Google Scholar] [CrossRef]
- Najjari, M.R.; Hinke, J.A.; Bulusu, K.V.; Plesniak, M.W. On the rheology of refractive-index-matched, non-Newtonian blood-analog fluids for PIV experiments. Exp. Fluids 2016, 57, 96. [Google Scholar] [CrossRef]
- Glycerine Producers, A. Physical Properties of Glycerine and Its Solutions; Glycerine Producers’ Association: New York, NY, USA, 1963. [Google Scholar]
- Polyanskiy, M. Refractive Index Database. 2008. Available online: https://refractiveindex.info/ (accessed on 14 January 2020).
- Takamura, K.; Fischer, H.; Morrow, N.R. Physical properties of aqueous glycerol solutions. J. Pet. Sci. Eng. 2012, 98–99, 50–60. [Google Scholar] [CrossRef]
- Santos, R.J.; Erkoç, E.; Dias, M.M.; Teixeira, A.M.; Lopes, J.C.B. Hydrodynamics of the mixing chamber in RIM: PIV flow-field characterization. AIChE J. 2008, 54, 1153–1163. [Google Scholar] [CrossRef]
- Perry, R.H.; Chilton, C.H. Chemical Engineer's Handbook; McGraw-Hill: New York, NY, USA, 1973. [Google Scholar]
- Lemmon, E.W.; McLinden, M.O.; Friend, D.G. Thermophysical Properties of Fluid Systems. In NIST Chemistry WebBook, NIST Standard Reference Database Number 69; Linstrom, P.J., Mallard, W.G., Eds.; National Institute of Standards and Technology: Gaithersburg, MD, USA, 2021. [Google Scholar]
- Segur, J.B.; Oberstar, H.E. Viscosity of Glycerol and Its Aqueous Solutions. Ind. Eng. Chem. 1951, 43, 2117–2120. [Google Scholar] [CrossRef]
- Shankar, P.N.; Kumar, M. Experimental determination of the kinematic viscosity of glycerol-water mixtures. Proc. R. Soc. 1994, A444, 573–581. [Google Scholar]
- Weast, R.C.; Astte, M.J. CRC Handbook of Chemistry and Physics: A Ready-Reference Book of Physical and Chemical Data; CRC Press: Boca Raton, FL, USA, 1974. [Google Scholar]
- Cheng, N.-S. Formula for the Viscosity of a Glycerol−Water Mixture. Ind. Eng. Chem. Res. 2008, 47, 3285–3288. [Google Scholar] [CrossRef]
- Reid, R.C.; Prausnitz, J.M.; Poling, B.E. The Properties of Gases and Liquids, 4th ed.; McGraw-Hill: New York, NY, USA, 1987. [Google Scholar]
- Van de Ven, T.G.M. Colloidal Hydrodynamics; Colloid science; Academic Press: London, UK, 1989. [Google Scholar]
- Takamura, K.; Van De Ven, T.G.M. Comparisons of modified effective medium theory with experimental data on shear thinning of concentrated latex dispersions. J. Rheol. 2010, 54, 1–26. [Google Scholar] [CrossRef]
- Brito, M.S.C.A.; Barbosa, I.S.O.; Fonte, C.P.; Dias, M.M.; Lopes, J.C.B.; Santos, R.J. Effective mixing of dissimilar fluids in asymmetric Confined Impinging Jets mixers. Chem. Eng. Sci. 2022, 258, 117756. [Google Scholar] [CrossRef]
- Larin, K.; Akkin, T.; Esenaliev, R.; Motamedi, M.; Milner, T. Phase-Sensitive Optical Low-Coherence Reflectometry for the Detection of Analyte Concentrations. Appl. Opt. 2004, 43, 3408–3414. [Google Scholar] [CrossRef]
Publisher’s Note: MDPI stays neutral with regard to jurisdictional claims in published maps and institutional affiliations. |
© 2022 by the author. Licensee MDPI, Basel, Switzerland. This article is an open access article distributed under the terms and conditions of the Creative Commons Attribution (CC BY) license (https://creativecommons.org/licenses/by/4.0/).