1. Introduction
Risk is a concept that indicates a potentially negative influence to an asset or some feature of value that may augment from some present process or future event. According to
Lopes (
1987), “risk refers to situations in which a decision is made whose consequences depend on the outcomes of future events having known probabilities.” Thus, it can be expressed as follows:
Risk perception is a personalized ideal that people hold about features and the severity of a risk. Risk perception analyses the opinions of people when they are asked to evaluate hazardous or risky activities, substances, and technologies (
Slovic 1987). Risk perception involves peoples’ beliefs, attitudes, judgments, and feelings as well as their values—both social and cultural—and dispositions. It plays a prominent role in peoples’ decision-making process and thus in the case with the decision to invest in equity shares (
Pidgeon et al. 1992). According to
Bernstein (
1995), the perception of risk throughout the history of any society has reflected the temper of the times of each society, as the emphasis has swung from the instinct to measurements and back. As long as people perceive that they have no control over their characteristics, chance can explain the entire outcome of risk-taking. Then, the experimentation, exploration, and demonstration of that choice are a valid human activity and the aforementioned risk is something to be borne. It is well known that investors do not have control over the return from equity shares and, hence, investments into equity shares are perceived to be risky.
Risk perception is a vital constituent in several assessments and, hence, psychologists are continuously attempting to find out the best way of measuring risk perception.
Singh and Bhowal (
2008) established that the risk perception of an individual can be controlled provided that a person is aware of the different aspects of his/her risk perception, as well as the reason for the given risk perception. Therefore, authorities entrusted with the job of framing policies should strive to measure the risk perception of the individuals who manage it and implement the policies (
Singh and Bhowal 2006).
Thus, there is a need to manage the risk perception of people (
Singh 2009,
2011), which is only possible if it can be measured. Equity-related risk perception among the retail investors is different in economically advanced regions compared to economically backward and geographically remote regions (
Deb and Singh 2018). The levels of literacy, income, and available infrastructure in economically backward regions are relatively low compared to those of economically advanced regions (
Deb and Singh 2017). For the purposes of this study, the South Assam region of India, consisting of the Cachar, Karimganj, and Hailakandi Districts are chosen as a representative of the economically backward and geographically remote regions. The per capita income and the life expectancy of this region are also lower than the national averages of India (
Registrar General, India 2011).
Southern Assam or Barak Valley (22,244 km
2), which covers almost 30% of Assam’s area, is geographically isolated from the main area of the country. Due to infrastructural issues, it is even isolated from Brahmaputra Valley, i.e., the main part of Assam. Up to date, there are no large industries in this valley except for the Cachar Paper Mill (which is on the verge of shutting down), a medium scale cement industry (viz Barak Valley Cement) and some tea estates. There are only two industrial estates in this valley, out of which only one is operational. According to the 2011 census, the literacy rate of this valley is around 77%, which is higher than the state literacy rate of 72.19% and the national literacy rate of 74.04%. Despite the high literacy rate, the per capita income of this valley is much lower in comparison to the state and the national income. According to the 2013–2014 figures, the per capita income of this valley was around Rs. 19,612 (NSDP capita, INR at current prices) compared to the state per capita income of Rs. 44,263 and the national per capita income of Rs. 44,263. People in this valley have faith only in traditional investment avenues such as bank deposits, post office savings, insurances, etc. Their low income does not allow them to invest in risky ventures such as equity. A few years back, a number of share broking houses, as well as a few banks started their operation and, hence, the equity investment culture entered the developing phase in the area. However, due to the poor response from the investors, these broking houses had to close down permanently. Although some banks and the Stock Holding Corporation of India Limited are able to continue their operation due to the compulsory dematerialization of physical shares, there may be certain factors which do not encourage the investors to invest in equity shares, influencing them towards traditional investment avenues instead. Only 0.2% of the populations of this valley have a Demat account (
NSDL 2011) compared to the national figure of 1.81%.
Therefore, a study on measuring the risk perception level of investors’ in equity shares and the factors influencing the aforementioned risk perception will not only be important but also contemporary in order to understand the current equity investment scenario in this region. In order to measure the risk perception of equity investors, a survey on the basis of a structured questionnaire was given to the retail equity investors. The questionnaire was framed using the variables identified by
Singh and Bhowal (
2011),
Singh (
2012), and
Deb and Singh (
2018) with a five-point scale.
The rest of the paper is organized as follows:
Section 2 explains several theories of risk perception,
Section 3 discusses the review of the relevant literature,
Section 4 states the objectives of the study,
Section 5 states the research question of the study,
Section 6 deals with the research methodology used in the study,
Section 7 describes the analysis and the findings of the study,
Section 8 presents the conclusions and policy implications of the study and, finally,
Section 9 presents the scope for future research.
2. Theories of Risk Perception
There are various theories of risk perception which have been evolved over a period of time and propounded by various scholars. Some of the theories are briefly mentioned here:
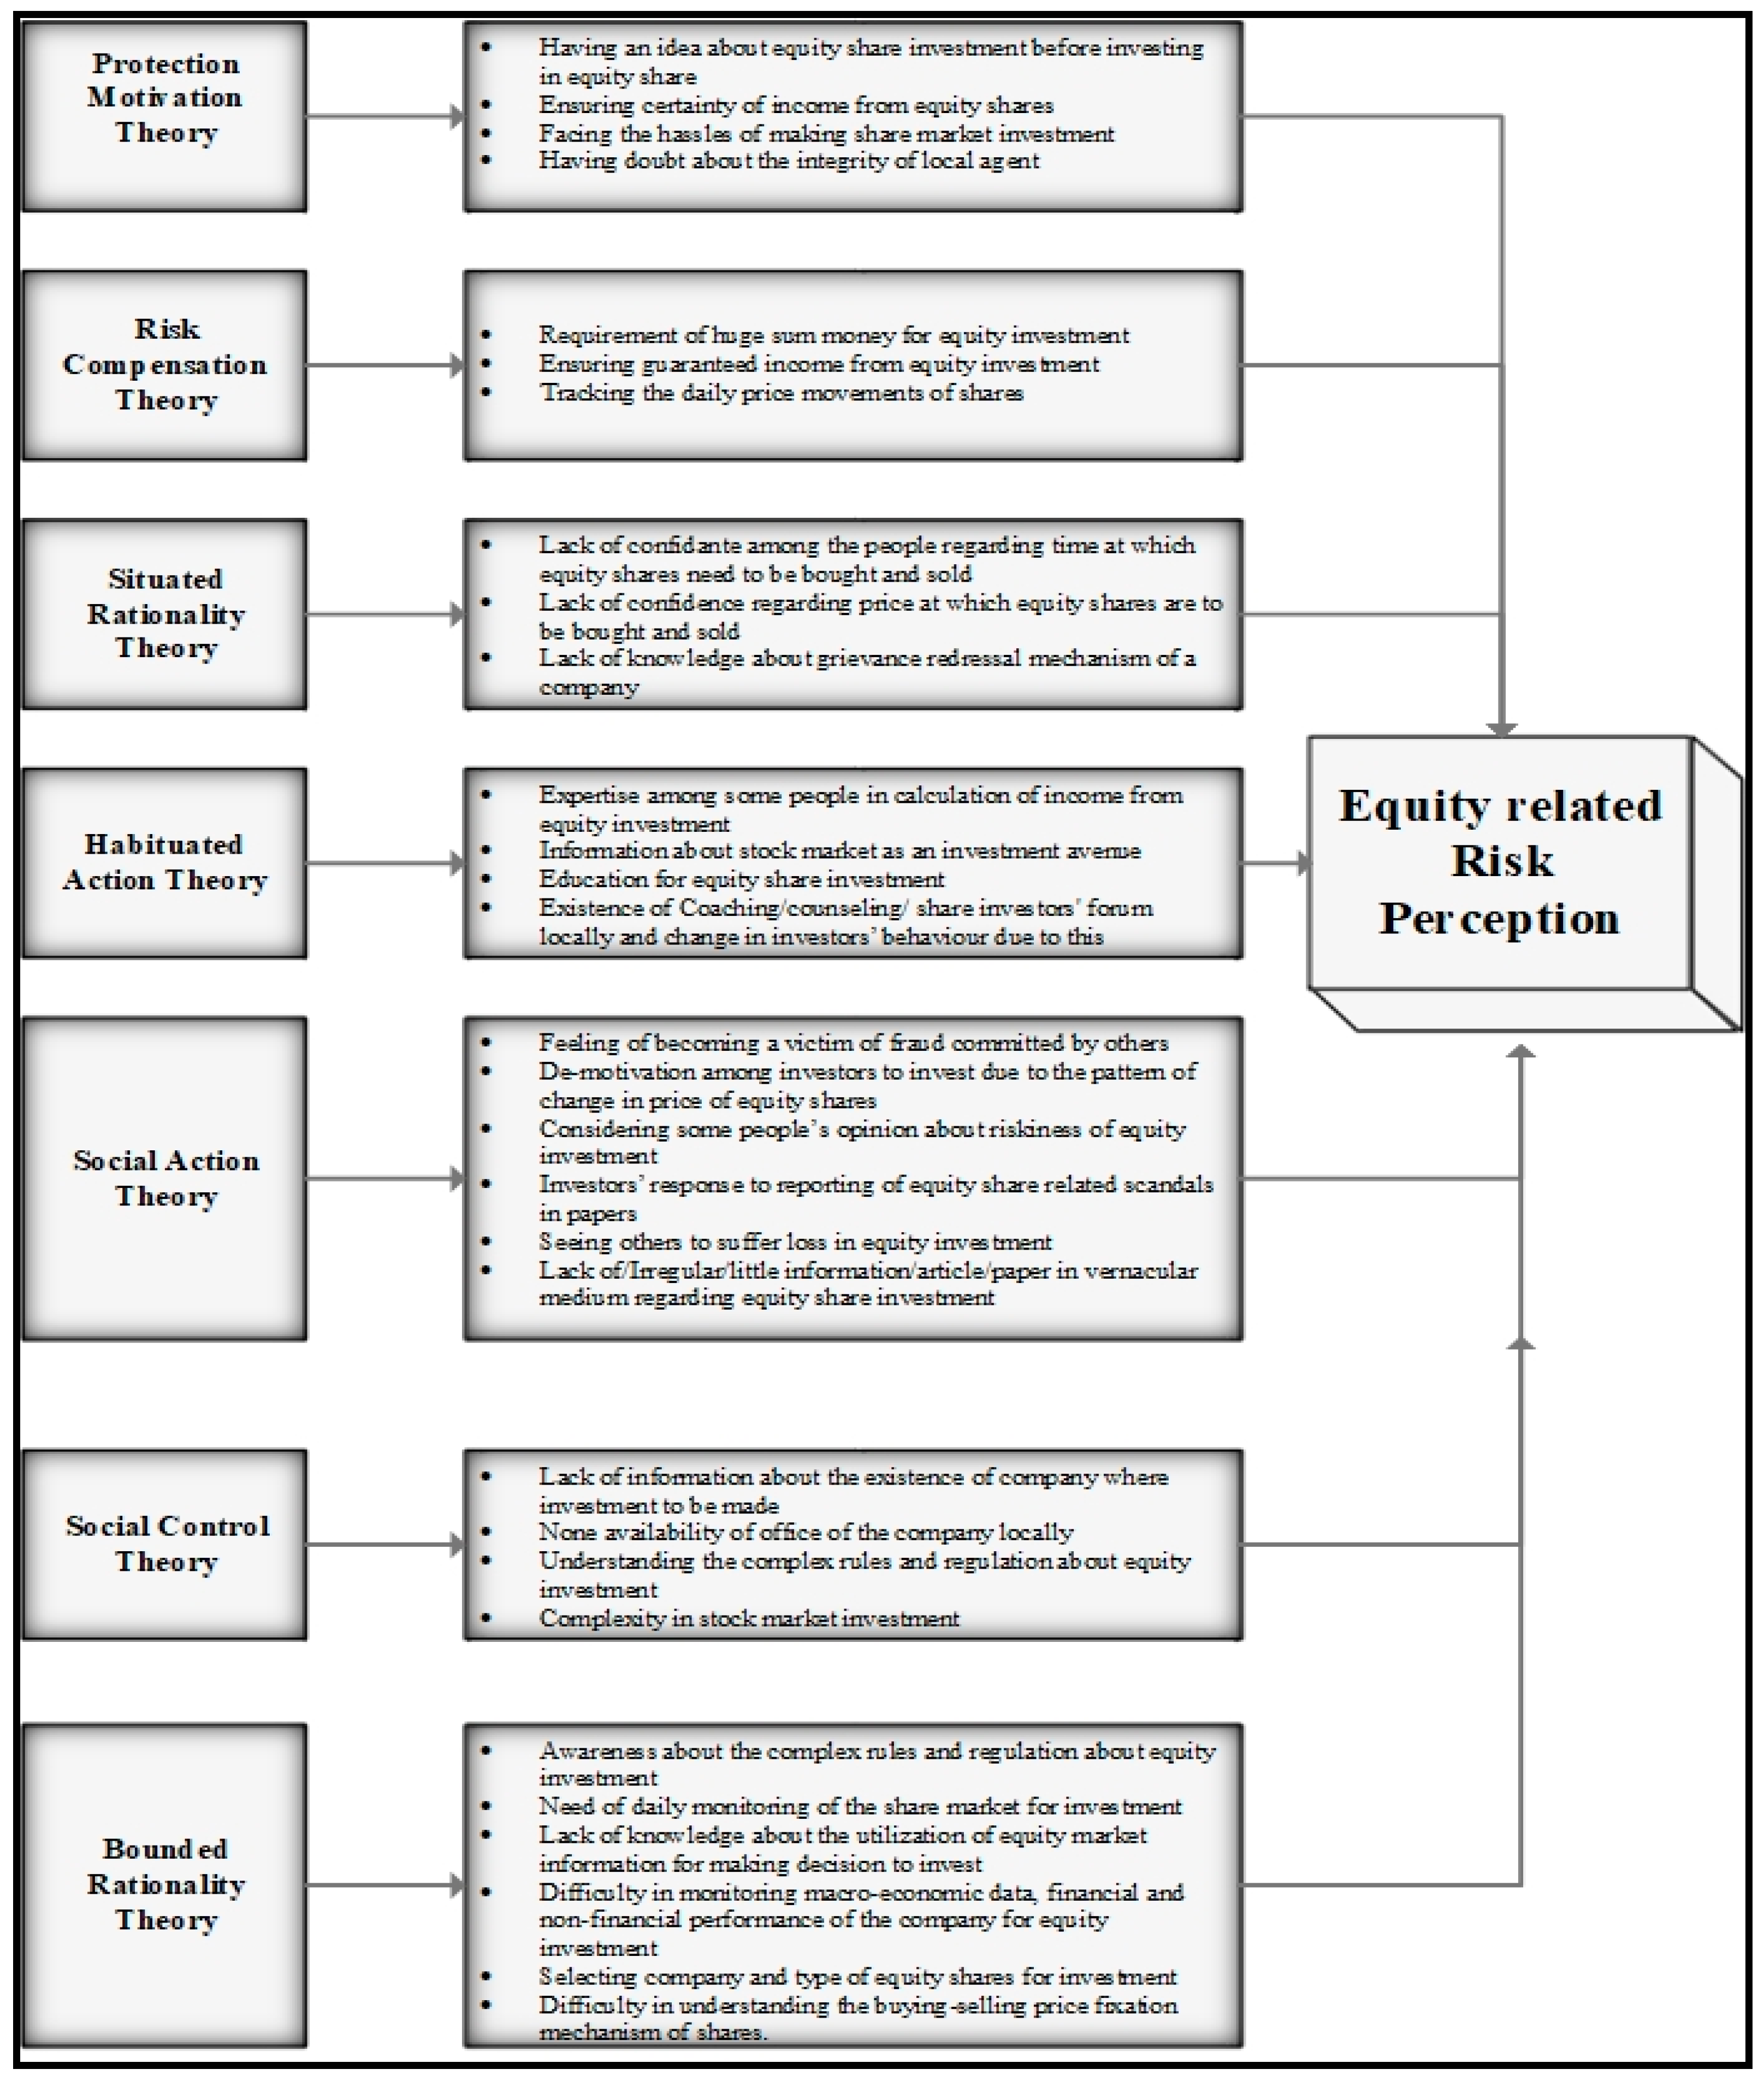
Protection Motivation Theory: According to protection motivation theory, people are more likely to protect themselves when they anticipate negative consequences, have the desire to avoid them, and feel they have the ability to take preventive measures.
Sheeran et al. (
2014) found that enhancing the elements of risk appraisal (such as risk perception and perceived security) has a combined positive effect on changing intentions and behavior towards safety. In the context of equity investment, the practices of putting ‘stop-loss’ by the equity traders/investors can be explained by this theory. Stop loss order is an order where a trader can make important decisions about cutting losses. Having an idea about equity share investment before investing in equity share (
Deb and Singh 2016; Ensuring certainty of income from equity shares (
Deb and Singh 2016;
Singh and Bhowal 2011;
Powers 2009); Facing the hassles of making share market investment (
Singh and Bhowal 2011) and Having doubt about the integrity of local agent (
Deb and Singh 2016;
Singh and Bhowal 2011) are some of the dimensions in equity share investment which are identified from literature review and supports the Protection Motivation Theory.
Risk Compensation/Risk Homeostasis Theory: Risk Compensation or Risk Homeostasis Theory states that people tend to take more risks when they feel a greater sense of security. In other words, individuals adjust their level of risk-taking behavior depending on the safety measures that are in place (
Wilde 1994). It is observed in the stock market that the financial advisors’ advice young people who have a secure family background to have more equity exposure. Requirement of huge sum money for equity investment (
Singh and Bhowal 2011;
Powers 2009); Ensuring guaranteed income from equity investment (
Singh and Bhowal 2011); and Tracking the daily price movements of shares (
Deb and Singh 2016;
Singh and Bhowal 2011) are a few of the phenomena identified from literature that can be explained by Risk Compensation Theory.
Situated Rationality Theory: Situated rationality theory makes the argument that it is erroneous to presume that safe behavior is inherently rational and high-risk behaviors are inherently irrational. In other words, there is likely a rational justification for why people choose to take risks that are more explanatory than assuming that a risk taker is simply crazy or thrill seeking. If the reward of risk-taking is too great, it is often considered rational to take risks. As
Finucane et al. (
2000) note, the greater the perceived benefit of activity, the lower the perceived risk. The fact that a vast majority of Indian households prefer to invest their money in bank deposits, while less than 10 per cent choose to invest in mutual funds or stocks (Security Exchange Board of India (SEBI), Survey Report, 2017) is testifying of this theory. Lack of confidence among the people regarding time at which equity shares need to be bought and sold (
Deb and Singh 2016;
Singh and Bhowal 2011;
MacCrimmon and Wehrung 1990); Lack of confidence regarding price at which equity shares are to be bought and sold (
Singh and Bhowal 2011;
MacCrimmon and Wehrung 1990), and Lack of knowledge about grievance redressal mechanism of a company (
Deb and Singh 2016;
Singh and Bhowal 2011) are some of the facts which testify this theory.
Habituated Action Theory: Habituated Action theory argues that engaging in high-risk behavior many times without a negative outcome often decreases the perceived risk associated with this behavior. Those who repeatedly perform a high-risk action without an adverse consequence eventually become desensitized to the risk (
Kasperson et al. 1988;
Weyman and Kelly 1999). For example, it is observed that people who play on margins in equity investments and have not faced any loss will keep on increasing their margin. Expertise among some people in calculation of income from equity investment (
Deb and Singh 2016;
Singh and Bhowal 2011;
Powers 2009); Information about stock market as an investment avenue (
Singh and Bhowal 2011) Education for equity share investment (
Deb and Singh 2016;
Singh and Bhowal 2010b,
2011), and Existence of coaching/counseling/share investors’ forum locally and change in investors’ behavior due to this (
Singh and Bhowal 2011), etc., testify this theory.
Social Action Theory: Social Action theory states that people take a risk because of peer pressure or a general community perception that activity is of low risk. The propensity towards risk can be affected by coworkers’ expectations. Individuals confirm to group norms to avoid sanctions (e.g., teasing, bullying) and start to identify with the group and accept group perceptions and behavior (
Harding and Eiser 1984). For example, a Muslim community follows Shariah law for investment. Certain actions confirm the social action theory such as the Feeling of becoming a victim of fraud committed by others; De-motivation among investors to invest due to the pattern of change in the price of equity shares (
Deb and Singh 2016;
Singh and Bhowal 2011); Considering some people’s opinion about riskiness of equity investment (
Singh and Bhowal 2011); Investors’ response to reporting of equity share related scandals in papers (
Deb and Singh 2016;
Singh and Bhowal 2011;
Kahneman and Tversky 1979); Seeing others suffer loss in equity investment (
Singh and Bhowal 2011); Lack of/irregular/little information/article/paper in vernacular medium regarding equity share investment (
Singh and Bhowal 2011).
Social Control Theory: Social Action Theory was first introduced by
Hirschi (
1969) and states that the connectedness to organizations promotes behavior conformity, which can reduce the probability of high-risk behavior. For example, it is often viewed that people prefer to buy stocks of the companies where they work. (ONGC employees prefer to buy ONGC shares, OIL employees prefer to buy OIL shares and so on). Investors’ reaction towards lack of information about the existence of company where investment to be made (
Singh and Bhowal 2011); No availability of office of the company locally (
Singh and Bhowal 2010a,
2011); Understanding the complex rules and regulation about equity investment (
Deb and Singh 2016;
Singh and Bhowal 2011;
Bhattacharjee and Singh 2017); Complexity in stock market investment (
Deb and Singh 2016;
Singh and Bhowal 2011), etc., confirm to this theory.
Bounded Rational Theory: Bounded rational theory was coined by
Simon (
1950) and is the idea that in decision making, the rationality of individuals is limited by the information they have, the cognitive limitations of their minds and the finite amount of time they have to make a decision. For example, an investor needs to sell off his stocks immediately due to immediate financial requirement. So, it might not be possible for him to wait for the stock price to be conducive enough to yield him optimum results due to time constraint. Awareness about the complex rules and regulation about equity investment (
Singh and Bhowal 2011;
Bhattacharjee and Singh 2017); Need of daily monitoring of the share market for investment (
Singh and Bhowal 2011); Lack of knowledge about the utilization of equity market information for making decision to invest (
Singh and Bhowal 2010b,
2011); Difficulty in monitoring macroeconomic data, financial, and non-financial performance of the company for equity investment (
Singh and Bhowal 2011;
Fischer and Jordan 2006), Selecting company and type of equity shares for investment (
Singh and Bhowal 2011;
Fischer and Jordan 2006); and Difficulty in understanding the buying-selling price fixation mechanism of shares (
Singh and Bhowal 2011) are some of the aspects of equity investment which can be explained by bounded rationality theory.
Risk perception of a person is the function of his/her internal as well as external environment such as the person’s attitude, heredity, environment, upbringings, etc., and therefore, all the theories work collectively in influencing the risk perception of the individual in a mixed way. They are acting collectively and not in isolation; therefore, the scale to measure risk perception is constructed by extracting the variables from each of the theories.
3. Review of the Existing Literature and Research Gap
A detailed and comprehensive literature review was undertaken to understand the facets of the area. The literature relevant to risk perception was studied to know the factors studied by other researchers.
Karmakar (
2001) opined that the people are in general risk-averse and safety is given the highest priority while taking an investing decision.
Purkayastha (
2008) revealed that age, salary, and designation do impact the risk appetite of an investor. In reality, investors tend to invest in average-risk mutual funds, irrespective of their demographics and risk tolerance.
Singh and Bhowal (
2010a) highlighted that the risk perception of the employees for the shares of their own company share is relatively lower than the risk perception for the shares of other companies.
Singh (
2009) found that investors perceive mutual funds as relatively less risky than that of direct investment in equity.
Roszkowski (
2010) stated that the economic crisis of 2008 was said to lower the risk tolerance of the investors.
MacCrimmon and Wehrung (
1990) conducted a study among the executives to know the characteristics of risk-taking by them and it was found that the most successful executives are the biggest risk takers and most mature executives are the most risk-averse.
Lion and Meertens (
2005) suggested that risk avoiders and risk takers differ in the extent to which they focus on the worst and best outcomes of the risky activity.
Veeramani and Karthikeyan (
2014) concluded that investors’ perception of the total investment risk and return determines the capacity of investors and investors prefer less risky investment avenues.
Risk perception can be managed and in order to achieve this, there is a need to measure risk perception (
Singh and Bhowal 2008).
Sitkin and Pablo (
1992) published a paper re-conceptualizing the determinants of risky behavior.
Sitkin and Weingart (
1995) highlighted the determinants of risky decision-making behavior and the role of risk perceptions. There were studies conducted to design the appropriate measure of risk and to establish a relation between risks and return (
Powers 2009).
Palmer (
1996) and
Weber (
2001) have focused on the way where people subjectively convert objective risk information (i.e., possible consequences of risky choice options such as mortality rates or financial returns and their likelihood of occurrence) in ways that reflect the impact that these events have on their lives.
MacGregor et al. (
1999) and
Koonce et al. (
2005) in their studies asked financial experts to rate the risks involved in various types of investments. The results of these two studies were comparable, in line with each other, and found that quantitative aspects (probability of loss and volatility) and qualitative aspects (such as worry and anxiety, and knowledge) were both significant predictors of perceived risk.
Singh and Bhowal (
2011) measured investors risk perception from the perspective of the marketing mix.
Singh (
2012) studied the risk perception of general investors in respect of their investment in Initial Public Offer (IPO) of shares.
Deb and Singh (
2018) have used the scale of
Singh and Bhowal (
2011) to study the risk perception of investors in respect of mutual funds.
From the above discussion, it is seen that there have been many studies on measuring risk and risk perception in several situations and markets, but no attempt has been made to measure the risk perception of retail equity investors from a geographically isolated area such as South Assam. Therefore, in this study, the risk perception of retail equity investors from economically backward region is measured using the parameters used by
Singh and Bhowal (
2011);
Singh (
2012); and
Deb and Singh (
2018).
Based on the above background and gap areas, the present study bridges the gap between the existing literatures to measure the risk perception of retail investors in equity shares belonging to South Assam of India which is relatively isolated from the mainstream of the country. The investigation on the risk perception of the investors from this region will help in knowing the level of risk perception of the investors from a relatively economically backward area. The study is also helpful in framing policy with respect to investment education in the region so that misperception, if any, can be eliminated or reduced.
This paper contributes to the existing literature on risk perception in respect of equity shares in several aspects, for example, the data cover very recent years, up to 2017, which have not been covered in previous studies, and the study is conducted on a geographically and economically isolated area, which has also not been done in the previous studies.
Based on the literature review on risk perception about equity investment, measurement of risk perception and theories of risk perception the following research framework has been proposed as given in
Figure 1.
4. Objectives of the Study
The objectives of the present study are as follows:
5. Research Questions
The following research questions are attempted to be answered in this paper:
What is the level of risk perception of the equity investors in India?
What are the variables that affect towards building risk perception of the investors?
Which of the variables are least important in framing the overall level of risk perception of the investors?
What are the factors that affect the risk perception of the investors?
6. Research Methodology
The study was conducted using the following research methodology.
Type of Research: The study is descriptive in nature.
The Universe of the Study: For the purpose of the study, the universe consists of the entire individual having demat a/c with National Securities Depository Limited (NSDL) in three districts of Assam, i.e., Cachar, Karimganj, and Hailakandi. There were 7148 demat account holders (as on 31st March 2015) in these three districts.
Sample and Sample unit: The sampling design for this study is stratified sampling. Therefore, at 5% level of significance and 95% confidence level, a sample of 365 investors was obtained. However, seven (7) of them were excluded from the analysis due to incomplete information. Thus, a sample of 358 investors was finally taken into consideration for the study.
The numbers of investors’ with demat account holders in Cachar, Karimganj, and Hailakandi districts are 4730, 601, and 1817, respectively. Now with proportional allocation method under stratified sampling technique, a sample of 245, 38, and 75 from Cachar, Karimganj, and Hailakandi districts, respectively, were taken to accomplish the total number of sample size 358.
- iv.
Data Collection: The study was based on primary data and a structured questionnaire was used to collect the necessary information relevant for our study. However, secondary data was also obtained from relevant sources such as journals, official reports, newspaper, etc., for providing necessary background information of the study area.
- v.
Development of the Questionnaire: To measure the risk perception, a scale was framed by considering 35 items as mentioned in the research framework given in
Figure 1 and
Table 1, which are identified from the review of the literature and theories related to risk perception. The details of the items and their source are given in the
Table 1.
By applying item–total correlation on the above items, it was found that the item–total correlation value of Item No. 6, Item No. 11, Item No 23, Item No 32, and Item No. 34 was less than 0.2, which means that these items does not correlate very well with the overall score and thus may be dropped. So, a total of 30 items were used for analysis purpose.
For measuring risk perception, the responses to the above-mentioned items were obtained on a five-point Likert scale, where a response of strongly disagree was given a score of 1, which consequently denotes a very low level of risk perception, and response of 5 was given for strongly agree, which denotes a very high level of risk perception. Besides these, there were questions on the demographic and socio-economic profile of the respondents.
- vi.
Profile of the Respondents
The profile of the respondents is given in
Table 2.
- vii.
Data Analysis
To assess the risk perception of equity investors, statistical tests such as mean, standard deviation, etc., are used. Reliability of the scale constructed to measure the equity share related risk perception is tested using Cronbach’s alpha. Cronbach’s alpha is a measure of internal consistency. A high value of Cronbach’s alpha means, the scale is a reliable one and the items are collectively measuring the latent variable. In the considered scale, some of the items were on reverse scaling so as to ensure the accuracy of response (
Tavakol and Dennick 2011). The formula for the Cronbach’s alpha is given below:
Here,
N is equal to the number of items,
c-bar is the average inter-item covariance among the items and
v-bar equals the average variance.
Factors affecting the risk perception of equity investors are extracted using factor analysis. To identify the number of factors that significantly relate to the original variables, the Rotation Sum of Squared Loadings is used that shows the variance and Eigenvalue after rotation. Eigenvalue is the sum of squared factor loadings pertaining to that particular factor and the process uses rotated Eigenvalue to decide the number of significant factors. Each of the components has an Eigenvalue of total variance explained and it explains the variance of that particular component. The same is also expressed in percentage of variance. The method used to get the output is the Varimax rotation.
7. Findings of the Study
The findings of the study are presented in the following paragraphs.
i. Reliability of the Scale
The reliability of the scale prepared to measure risk perception of equity investors was tested using Cronbach’s alpha. The value of Cronbach’s alpha is 0.881. Cronbach’s alpha of more than 0.70 is considered to be a good measure of the reliability of scale (
Nunnaly 1978). Thus, in the present study, it can be inferred that the scale is a reliable one and it is actually measuring the latent variable namely risk perception.
ii. Item Statistics
Item statistics of 30 items considered for the scale to measure risk perception in respect of equity shares is given in
Table 3.
iii. Scale Construction
The scale considered for this study contains 30 items. Since a score of 5,4,3,2, and 1 was given to the respondents for their response of strongly agree, agree, moderately agree, disagree, and strongly disagree, respectively, the maximum one respondent can score in each of the items is 5. Therefore, the maximum possible score is 150 (30 × 5). Similarly, the minimum one respondent can score in each of the items is 1 and, therefore, the minimum possible score is 30 (30 × 1). The difference between maximum and minimum possible score is 120 (150 − 30). In order to ascertain the risk perception at five levels, this range (120) is divided by 5. It is found to be 24. Adding 24 with 30 (lowest possible score), the very low level of risk perception range (30 − 54) is obtained. Similarly, adding 24 with subsequent value, next higher range is obtained. In
Table 4, risk perception score is interpreted.
The mean value of the scale statistics is found to be 90.90 as shown in
Table 5, which lies in the interval 78–102, representing a moderate level of risk perception.
iv. Overall Risk Perception
The overall risk perceptions of the respondents are calculated by adding their score in the Likert scale, and then its value was interpreted using
Table 4. The overall level of risk perception is then presented in
Table 6.
From
Table 6, it is clear that the majority on the investors of Barak Valley has a moderate level of risk perception towards equity investment.
v. Factor analysis
In order to perform factor analysis, the first thing to be done is to test the adequacy of the sample considered for the study. To test the adequacy of the collected data from the samples, the Kaiser–Meyer–Olkin (KMO) measure of sample adequacy and Bartlett’s test were done on the 358 responses. The KMO and Bartlett’s test of sphericity check the redundancy among the variables and whether the variables can be summarized with a small number of factors. Both tests have the same objective of ensuring if the factor analysis can be done efficiently with the original variables. Bartlett’s test of sphericity uses the following formula:
In the above equation,
represents the determinants of correlation matrix and is computed to measure the overall relation with the variables. The value of KMO should be more than 0.5 for a satisfactory factor analysis (
Kaiser 1974).
Table 7 shows that the KMO value for this study is 0.737, which means sample size is adequate enough to carry out the factor analysis.
Again,
Table 7 shows that the p-value for Bartlett’s test of sphericity is 0.000 (which is less than 0.05). This also confirms the data considered for factor analysis is appropriate.
The number of factors is identified on the basis of Eigenvalue. The Eigenvalue for a given factor measures the variance in all the variables which are accounted for by that factor. If the factor has Eigenvalue less than unity, then it is contributing little to the explanation of variances and may be ignored as redundant with more important factors.
From
Table 8, it is evident that nine factors have Eigen value more than 1 and these nine factors can explain 73.29% of the total variability. Thus, there are nine components for Principal Component Analysis.
The Principal component analysis is used to find that which variables are most strongly correlated with each component, i.e., which of these numbers are large in magnitude. This process helps in identifying the low correlation variables with the component.
Table 9 shows the Rotated Component Matrix, where larger correlations are in boldface.
Table 10 shows all the components thus identified.
8. Conclusions and Policy Implication
It is seen that the overall level of risk perception of the investors towards equity share investment is of moderate level. This is different from the findings of
Singh and Bhowal (
2010a), where the risk perception level of employees of a large Public Sector Unit was found to be of high level. This shows that the risk perception of people from an economically backward region is relatively lesser than that of people who have very secured source of income. However, this is not reflected in their equity investment. The items such as difficulty in selecting the type of equity shares for equity investment, lack of education for equity share investment, awareness about the complex rules and regulation about equity investment have a relatively high contribution in building the overall level of risk perception towards equity investment. All these variables are directly related to the exposure of the people to the equity market. Exposure to a risky situation influences a person to make an investment in a risky asset (
Krueger 1993). It means their risk perception is relatively favorable for making equity investment (
Singh and Bhowal 2009b) but they do not have the necessary exposure to the equity market and hence they are not making an equity investment. Given their moderate level of risk perception, if they are given exposure to the equity market, the equity investment culture in the region can be improved and, consequently, entrepreneurial activities can be accelerated.
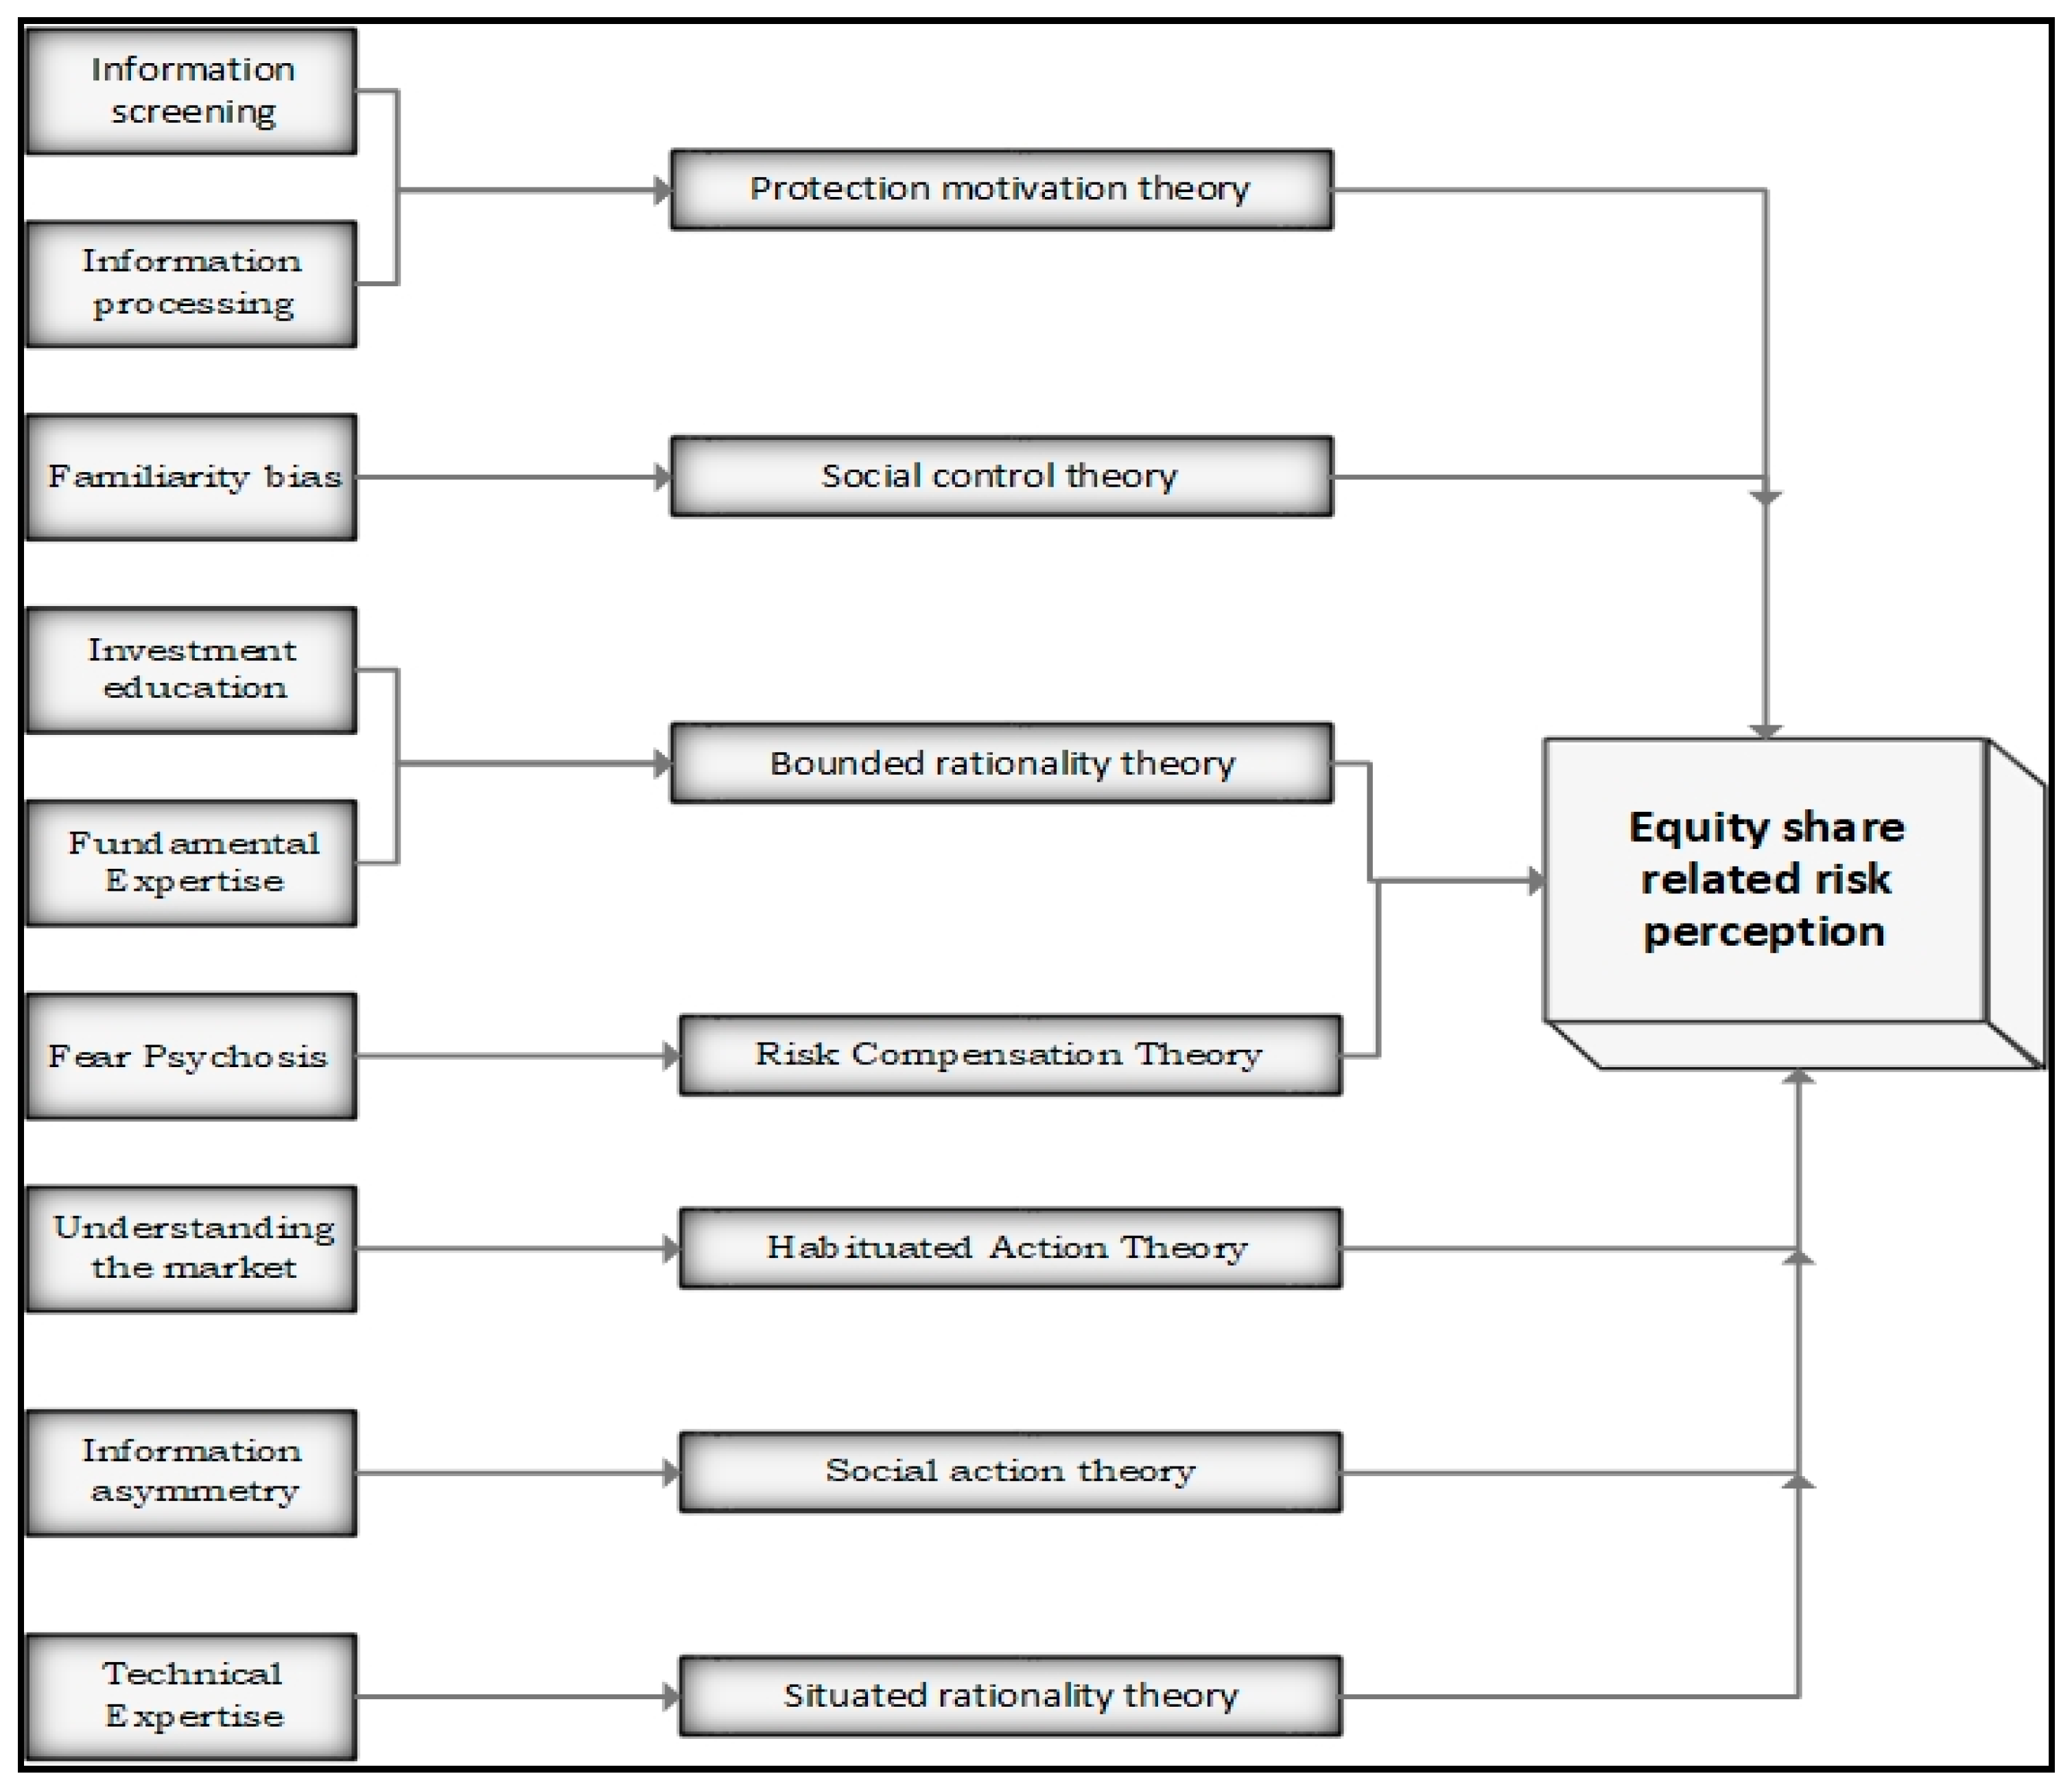
The study identifies nine factors which have an impact on investors’ risk perception. These are Difficulty in the screening of information, inadequate investment education, inadequate information, Return-related suspicions, Fundamental expertise, and Technical expertise, Familiarity with the company, Information asymmetry, and Inadequate understanding of market.
Thus, it is evident from the findings that most important factor that has an impact on investors’ risk perception is difficulty in the screening of information, which is similar with the findings of
Fischhoff et al. (
1978).
Risk perceptions are exaggerated when vulnerable investors believe that they have difficulty in screening the available information. In such cases, the difficulty is experienced not only by the retail investors but also in the experts, regulators and Government officials who monitor the activity or market.
Sachsea et al. (
2012) focused on the effects of individual characteristics on financial risk perception.
Ricciardi (
2004) stated that difficulty in the screening of information might influence an investment professional’s risk perception.
Pellinen et al. (
2011) stated that risk perception increases when investors have more information but they are unable to screen it. Thus, there is a need for proper investment education and training (
Singh and Bhowal 2010b).
Perceived risk determines not only the sources of information conferred but also the type of information that has been used by the investor. The same behavior could be observed in the stock market as well because information is a means which allows limiting the uncertainty surrounding the investment situation.
Nwezeaku and Okpara (
2010) indicates that the level of information asymmetry can be featured by the risk of investing with a privately informed investor. Thus, the less the investors share the same information, the higher will be the level of risk perception towards their decisions in the stock market (
Mahmood et al. 2011). Moreover,
Wang et al. (
2006) specified that good quality of information disclosure could substantially reduce investors’ risk perception. Social action theory of risk perception confirms to this behavior.
Information is the first component of protection motivation theory (
Rogers 1983). Based on information, an individual identifies prospective threats and potential opportunities. The individual then must assess this information to determine whether or not to engage with that potential opportunity to a given threat.
Social Control theory also stated that connectedness or familiarity to an organization reduces the probability of high risk behavior (
Hirschi 1969).
Hodder et al. (
2001) and
Koonce et al. (
2005) documented that changes in the level of investment education can result in an adjustment to their risk perception for a specific activity or situation. Therefore, there is a need for imparting investment education (
Singh and Bhowal 2010b) and make them expert in dealing with their own investment decision.
According to
Dreyfus (
2005), though experts are rational, they have not been able to defend their own actions rationally all the time. Expertise in doing fundamental analysis for making equity investment is also one of the important components of rationality. Rationality is one of the important components of Bounded Rationality theory. However, possessing technical expertise is one of the most essential elements to manage risk as per situated rationality theory. It says that considering the situation in hand, a risk needs to be managed and technical analysis attempt to do the same.
Return-related suspicions can influence the risk perception where investors tend to worry that their investment could be lost (
Hira and Mugenda 1999).
MacGregor et al. (
1999) studied the relationship between fear psychosis and risk perception and found that fear psychosis is a significant indicator of risk perception, and Risk Compensation theory also states that people used to take more risk when they feel more secured.
An investor who has understood the market through his prior experience is likely to use his/her expertise in handling the risk and Habituated Action Theory says the same thing.
Thus, it is seen that the factors affecting risk perception as identified in this study are also linked with the existing theories of risk perception and all the theories are having an influence in building the equity related risk perception of an investors. This finding can be explained with the help of
Figure 2 of this paper.
Thus, looking at
Figure 2, it is evident that several factors affecting risk perception of equity investors are ultimately related to the several theories of risk perception developed over period of time.
Thus, keeping in mind on the above-mentioned factors, efforts should be made to bring the people with high risk perception to low risk perception category by imparting them training to handle or manage high-risk scenarios (
Singh and Bhowal 2009,
2010c). Once they are brought to low risk perception category or trained to handle and manage the high-risk scenario, then it will be easier for the government to promote equity investment culture amongst the people as well as the same people will act as entrepreneurship–culture initiator and adaptor (
Singh 2011). Understanding the risk perception of individuals, policy makers can take steps to improve their risk perception and it will in turn promote better investment culture.
9. Scope for Future Research
The present study is confined into the retail equity investors of Barak Valley of Assam only. So, there is a scope that a large-scale research work can be carried out for the entire state of Assam. To know their risk perception level with respect to the different demographic variables and also to find out the impact of risk perception level on actual equity investment, an exploratory study can be carried out.


