1. Introduction
By assessing the likelihood of debt issuers making proper payments, as per the terms mentioned in the contract (
S&P Global Rating 2012), Credit Rating Agencies (CRAs) help to evaluate whether the assessed entities are credible enough to meet their financial obligations (
Standard and Poor’s 2002). Given the substantial number of issuers, speculators and financial intermediaries use credit ratings to base their financial decisions. Credit ratings are therefore a relatively important tool for many issuers to transmit their financial trustworthiness and soundness independently.
Among other factors and financial variables, in their credit assessment rating agencies weigh the lean management revealed by the rated entity (
Bendig et al. 2017). Under operational leanness, a company uses the least number of resources to produce goods and services. The purpose of leanness is to increase the efficiency and profits of the firm and generate greater customer satisfaction. Lean management is then an operational process based upon the concept of consistent improvement by making safe and constant changes in production to achieve efficiency and proficiency of the product. Correspondingly, lean creation is a production practice that does not allow the firm to produce any waste at the end of production. Thus, inventory levels can measure a firm’s leanness.
According to Sanjay and Peter (
Sanjay and Peter 2006), many companies have started applying lean production, but only 10% successfully run their production based on lean concepts. In operations management, two dissimilar perspectives developed on firm leanness and its employment in the production process provide an outline (
Modi and Mishra 2011). The incorporation of leanness in production might improve the firm overall growth and performance as expenses are lessened. On the other hand, despite predominant manufacturing abilities enhancing a company’s upper hand, this might be unfavorable for business growth, as it stimulates companies to react to market adjustments. Due to its effect on firms’ financial performance, lean management is expected to influence credit ratings, as confirmed in previous literature focusing on evidence from western economies (
Bendig et al. 2017). Given the specificities of Islamic economic systems (economic activities exercised according to the Shari’a, which delimits what is accepted in the Islamic tradition), our study extends the knowledge of the relationship between operational leanness and credit ratings in Islamic countries by analyzing the case of Pakistan.
For manufacturing firms, lean practices are used to create value and reduce waste. The leanness positively impacts the firm, which helps to evaluate the credit ratings of the firm. This study can help to demonstrate the performance of firms via leanness management. The study will provide insight that will improve the overall manufacturing sector of Pakistan by employing inventory leanness in their production process. The effect of leanness management on credit ratings is reported in this study.
The credit rating system of Pakistan is in its initial stages, with two high-profile credit rating agencies assigning ratings, Pakistan Credit Rating Agency (PACRA) and JCR-VIS Credit Rating Co., Ltd. (JCR-VIS). The ratings help to differentiate firms according to their capacity for payment, namely strong, weak, and defaulters. The purpose of rating agencies is to provide honest and fair ratings to market participants and stakeholders so that they can make effective investment decisions. This may also promote healthy competition among the rating agencies. After the global financial crisis of 2007–2008, firms diverted their focus to the creditworthiness of the instruments they were investing in. The significance of credit ratings and their relationship with inventory leanness is yet to be explored and has not been studied in Pakistan. Prior studies explain the relationship between operational leanness and equity performance, but they were unable to explain the relationship with credit ratings. The main focus of this study is to examine the relationship between inventory leanness and credit ratings. Our research fills this academic research gap by addressing the following questions: Is there any link between inventory leanness and credit ratings? Do firm characteristics play a major role in determining the leanness of a firm?
To answer the above questions, we carry out research on 38 manufacturers over a sample period from 2008 to 2017. This study examines the impact of inventory weakness on the credit ratings of a firm by controlling for the effects of several variables, including the firm’s size, leverage, capital intensity, net income, and type of debt. The research also provides an overall understanding of the impact of inventory leanness on a company’s financial performance. The results confirm that firms employing lean inventory measures in their production are likely to have a higher credit rating, as these measures minimize the cost of waste and hence are likely to provide a strong financial position. The size of the firm, its levels of leverage and capital intensity also influence ratings, though in different ways.
These results are useful to managers, investors, debtholders, and all parties interested in companies’ credit risk assessment. The study provides useful insights to determine the creditworthiness of manufacturing firms and the credibility of rating agencies in Pakistan. Pakistani firms use external financing in the form of debt more often than equity; so it appears pertinent to look at how credit ratings are affected by inventory leanness. The research content and results provide a guideline for future research with an extended sample and variables. The efforts by regulatory bodies should be to promote the rating agency “PACRA” and the private agency “JCR-VIS” to help grow the rating sector and promote effective decisions by investors.
2. Literature Review and Construction of Hypothesis
In their investment decisions, investors bear in mind CRAs appraisals, with a low rating signaling potential financial fragility, such as a weak capital structure, disruption in supply-chain relationships, and other pervasive financial issues (
Graham and Harvey 2001). In general terms, ratings represent the risk associated with investing in a particular security, corporation, or country (
Ryan 2012). Among the reasons for which credit ratings are important, Brigham and Daves (
Brigham and Daves 2018) underline that ratings: (i) have an immediate quantifiable effect on the firm’s securities’ financing costs, i.e., bond interest rates and, as a rule, the cost of debt; (ii) provide a future outlook on the rated firm, among other factors based on past financial statements, including operational potential, substantiality, and growth of the firm.
As credit ratings depend on inventory management (
Bendig et al. 2017), companies’ managers believe that smoother management and performance will likely result in positive credit ratings for the firm, improving the firm’s market performance and attracting investors. The excess inventory is viewed as the wastage of resources and cash, which could have been invested in other firm operations. By influencing working capital, the inventory, if mismanaged, may lead a firm to depart from its optimal working capital levels, negatively affecting its credit ratings (
Abuhommous et al. 2022).
Operational flexibility has led to efficient and time-based manufacturing. It has also increased firms’ production and improved the supply-chain relationship. Consequently, managing inventories through an efficient system provides advantages to the firm. However, Shi and Yu (
Shi and Yu 2013) have provided evidence that little research has been conducted related to a firm’s operations and growth.
The lean generation rationality argues that inventory is a waste structure that ought to be limited or minimized. It acts as a cushion against uncertainty, and efforts should be made to minimize it. This is a technique that implements other techniques and tools, such as Kanban, Total Quality Management (TQM), and Just in Time (JIT), to restrict the misuse of inventory (
Womack et al. 1990). Therefore, operations must seek to minimize misuse of inventory and improve the overall firm performance.
Inventory leanness is characterized by a company’s stock dimensions concerning the size-adjusted normal stock dimension within the firm (
Eroglu and Hofer 2011a). Independent stakeholders, for example, utilize lean stock dimensions as an intermediary for a firm’s profitable operational capacities that may result in feasible upper hands (
Lai 2006). The past inventory leanness fails to ignore the size of the inventories held by the firm. The results of inventory estimation were thought to be biased, leading to the incorporation of economies of scale in inventory management, where an empirical leanness indicator was introduced (
Eroglu and Hofer 2011b).
Econometric investigations on this theme consider different measures and dimensions as a means of inventory leanness. These dimensions can be divided into three groups: (1) overall measures, including normal inventory size and maximum inventory size (
King and Lenox 2001); (2) standardized measures, for example, inventory turnover, inventory-to-sales ratio, and days of supply (
Koumanakos 2008); and (3) complex measures, such as those that depend on the fuzzy set hypothesis (
Bayou and De Korvin 2008) and information on envelopment investigation (
Wan and Chen 2008).
As previously stated, measures of inventory leanness have drawbacks and limitations, stimulating the development of other tools to measure such information. A new measure is known as the Empirical Leanness Indicator (
Ballou 1981,
2000,
2005), or ELI, which assesses the leanness of a firm with respect to firms of equivalent size in a particular industry. This measure explains the relationship between sales and inventory in different storage areas of a company, thus distinguishing economies of scale in stock holding.
ELI is presented as an appropriate measure to check for size differences between relatively homogeneous firms, though barely characterized, and recognizes predominant industry-explicit stock practices. Accordingly, the sales curve is evaluated for each branch with little characterization. This curve reflects normal inventory turns in a size-balanced industry. A firm’s deviation from this bend is the reason for assessing the firm’s inventory scarcity. Firms below the curve are said to be lean as they dominate fewer stocks. We then determine the ELI as the studentized residuals and evaluate guaranteed turnover curve fitting.
The link between inventory and firm value has also been investigated, as estimated by financial statements and return on inventory measurements (
Mor et al. 2021). The relationship between inventory leanness and the firm’s likelihood of survival has been confirmed as well (
Wang et al. 2019). It seems reasonable that credit ratings value cost efficiency and support high inventory leanness corresponding to industry rivals. CRAs usually examine favorable circumstances and disservices of inventory leanness. We postulate a relationship in line with Eroglu and Hofer (
Eroglu and Hofer 2011a) and thus define the following hypothesis:
Hypothesis 1. There is a significant relationship between inventory leanness and credit ratings.
As mentioned, we find a lack of evidence in past empirical research to deduce the relationship between inventory and firms’ performance, be it a positive direct relationship, nonlinear relationship, or no relationship. Consistent with the previous studies (
Ashbaugh-Skaife et al. 2006), higher growth sales are likely to increase the profitability of firms, promoting better credit ratings. Following the theoretical reasoning above, a relationship between firm size and credit ratings is expected. Thus, we control for firm size.
As higher credit ratings are beneficial for the rated firm, managers are stimulated to pursue rating upgrades by adjusting the firm’s capital structure through a reduction of leverage, given that high leverage levels reflect a greater default risk (
Kisgen 2009;
Shah 2006). Kolias, Dimelis, and Filios (
Kolias et al. 2011) suggest that capital intensity has a positive relationship with credit ratings. The variable is used to control the differences in a firm’s asset structure, where firms with greater capital intensity present a lower risk to debt providers and, thus, are expected to have higher credit ratings. Firms reporting a negative net income (loss) are not generating financial resources to be capitalized to reach greater financial autonomy. Therefore, their credit ratings are likely to be unfavorably affected. Artha and Hertikasari (
Artha and Hertikasari 2022) assert that the value of the firm can be improved by issuing secured debt, even if corporate taxes are not present. Because of different claims to debt providers, firms with subordinated debt listed in their capital structure are considered riskier. Firms with a riskier capital structure and a high ratio of subordinated debt are likely to be more affected in their credit ratings. Accordingly, we control for leverage, capital intensity, negative net income (loss), and subordinated debt structure to assess the relationship between inventory leanness and credit ratings.
3. Materials and Methods
3.1. Data Collection
In our study, we examine the association between leanness and rating indicators. The sample we analyse is based on PACRA credit ratings and financial accounting data from each company’s annual report. For regressors, the missing observations were excluded. The sample period from 2008 to 2017 has been selected. As for the sector concerned, the research is tested on the manufacturing firms of Pakistan. A total of 599 firms from 35 sectors are listed on the Pakistan Stock Exchange, and among those firms, PACRA provides its services to 176 firms, including both listed and unlisted. The regression analysis requires observations without missing values, so we have selected only listed firms for the sample. After the segregation, we further categorized the firms according to their rating provided by PACRA. Hence, we learned that sixty listed firms were rated by PACRA. According to our sample data, only the firms rated from 2008 to 2017 are considered, reducing the number of firms from sixty to thirty-eight.
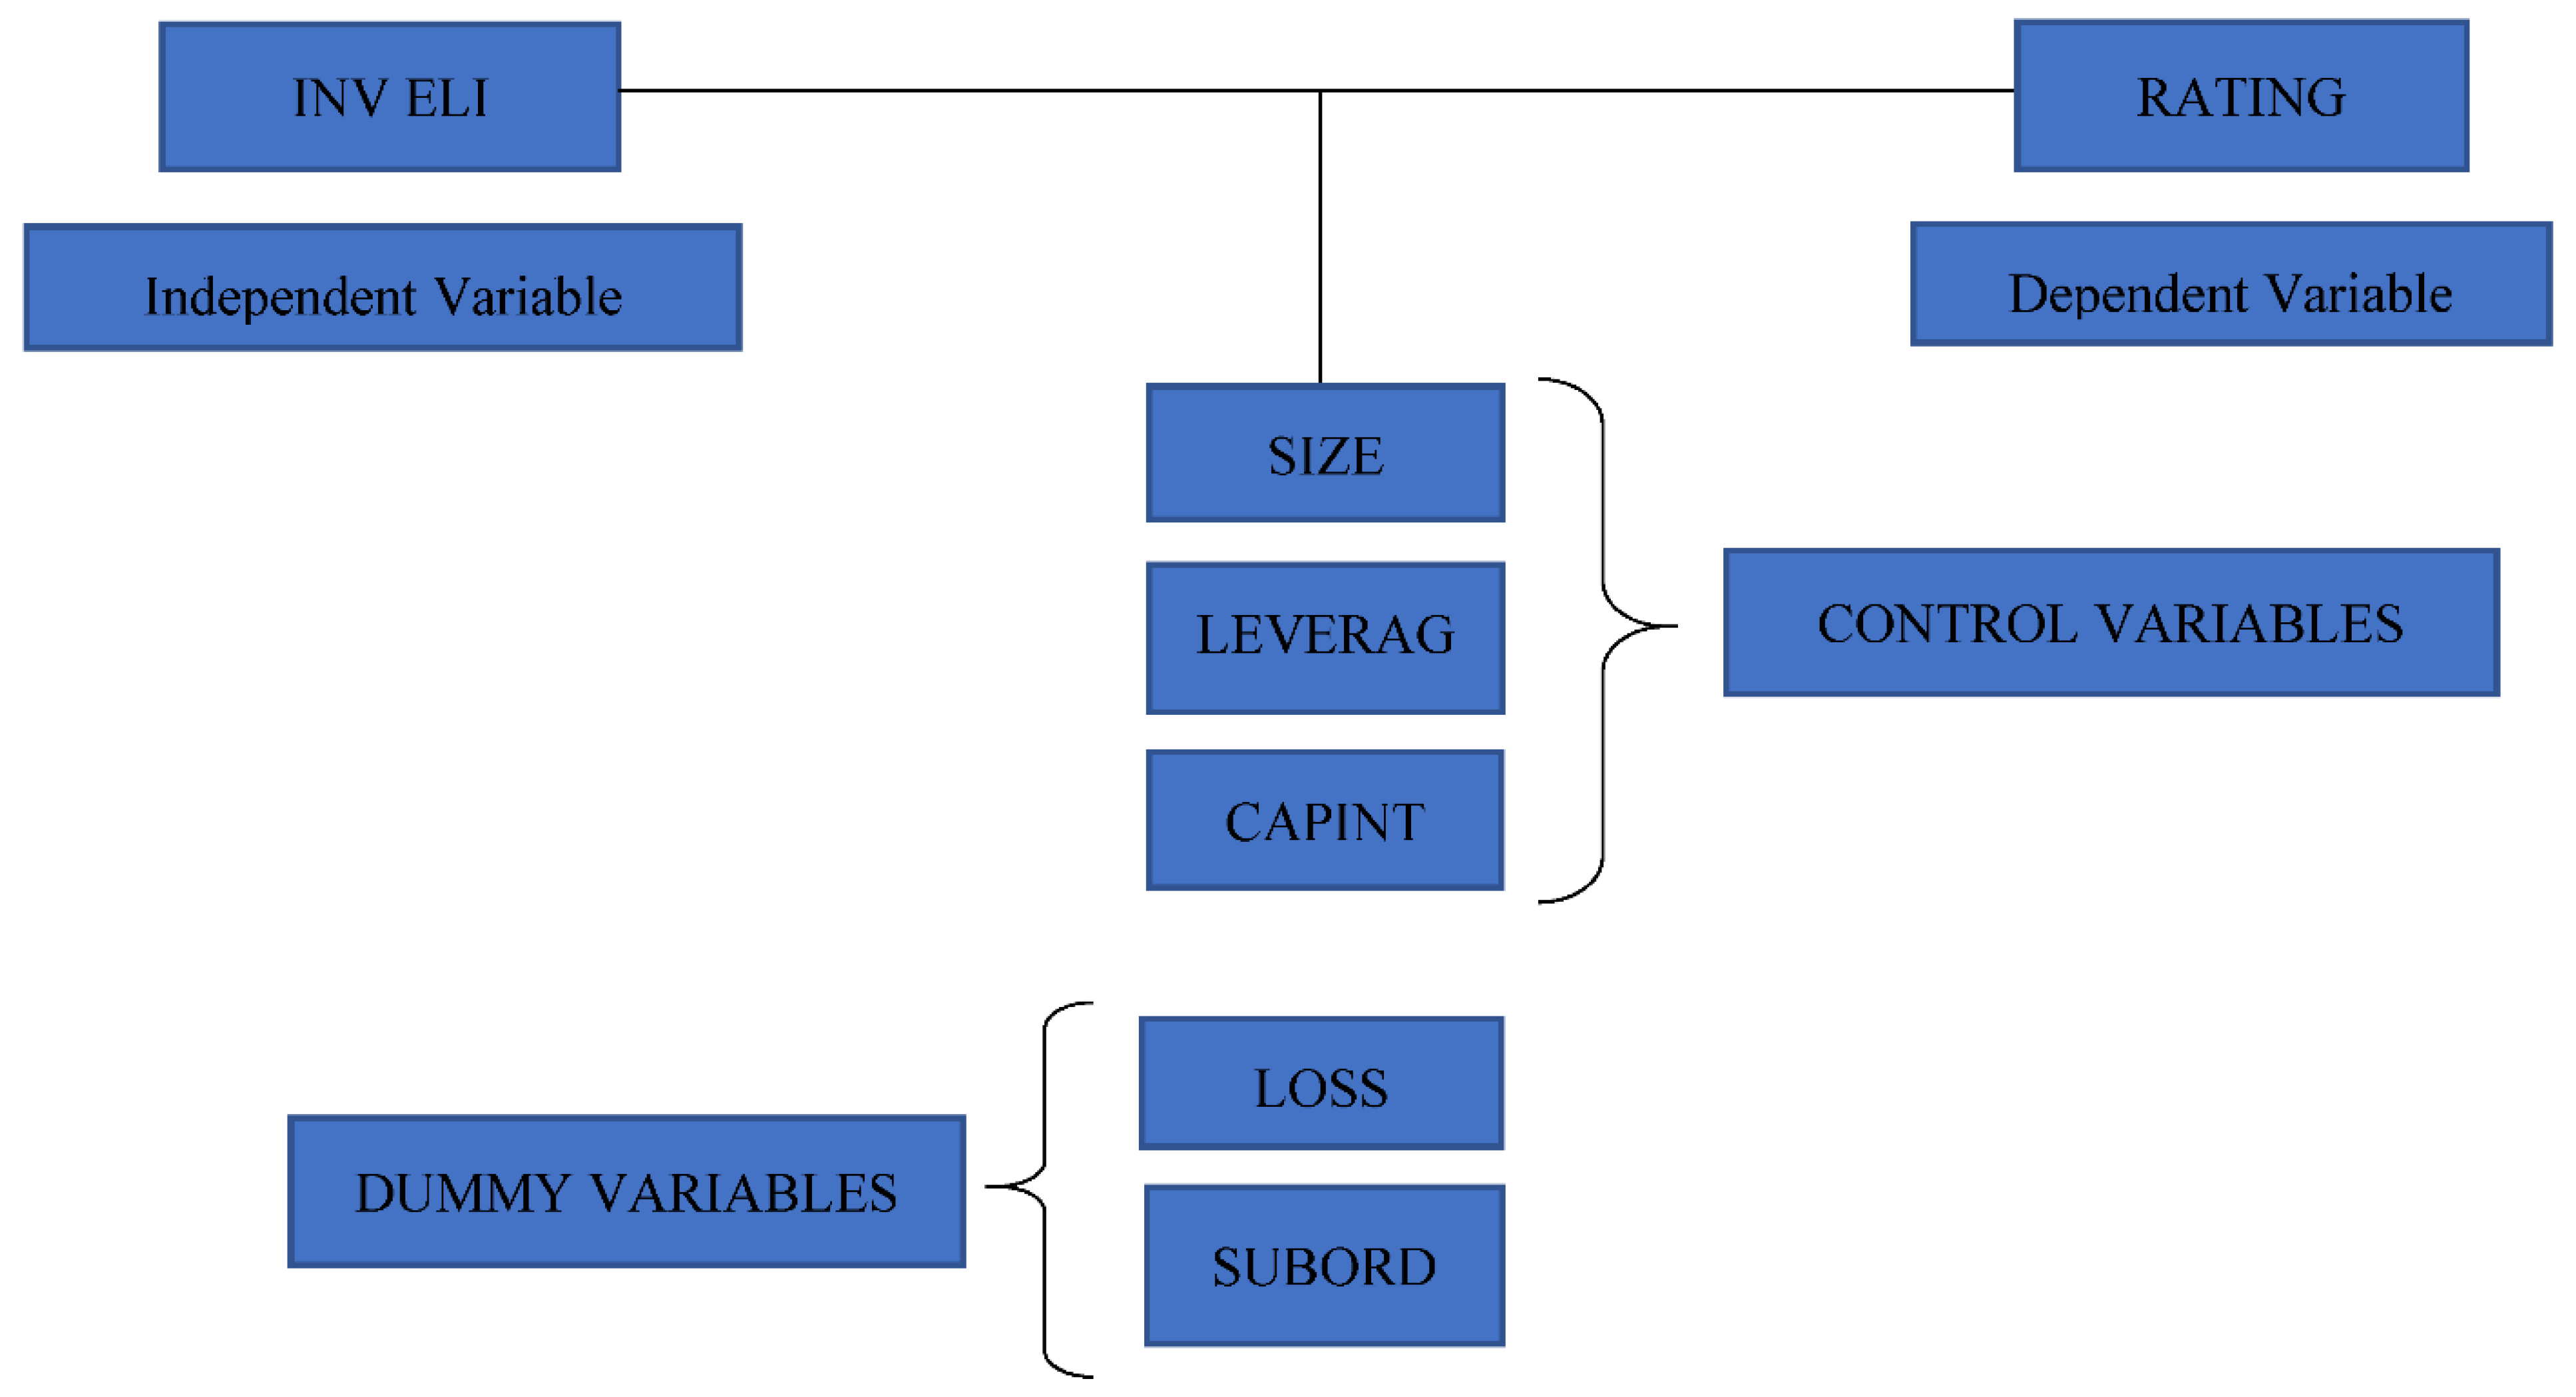
For the financial analysis, data is collected from the company’s annual report and two main financial statements. Thus, the income statement and balance sheet were considered to evaluate the link between financial performance and credit ratings. For this purpose, the inventory ELI is considered an independent variable, with SIZE, CAPINT, and LEVERAGE used as control variables, and LOSS and SUBORD are the dummy variable in the study. For the dependent variable, the PACRA website was of immense help. The PACRA site provided a historical record of companies’ ratings. The regression is conducted via ordinal regression, whereas we used Pearson’s correlation for the collinearity analysis.
Figure 1 summarizes our conceptual framework of analysis.
3.2. Econometric Model
To examine the overall effect of inventory leanness, we estimate a model in line with previous studies (
Alissa et al. 2013;
Ashbaugh-Skaife et al. 2006). Our approach has two different variations. First, we examine the overall effect of inventory leanness on credit ratings by applying the empirical leanness indicator model. Second, we incorporated the control and dummy variables in the model to identify the effect higher or weaker credit ratings would have on firms’ financial performance. Hence, we estimate the following model:
A detailed explanation of the variables, the applicable literature and sources are provided in
Table 1 below:
3.2.1. RATING—Credit Rating
In our study, the credit ratings (denoted as RATING) of the individual firms are those issued by the Pakistan Credit Rating Agency (PACRA). PACRA divides credit ratings into two categories: long-term ratings and short-term ratings. We use long-term ratings, which reflect the firm’s long-term prospects, and are displayed by an ordinal scale from AAA (extraordinarily strong obligors) to D (defaulting obligors). Consistent with (
Attig et al. 2013), we assign eight values, from 1 (CC) to 8 (AAA), to each main rating level. We exclude C and D-rated companies because they are almost in default or already in default.
Table 2 defines the correspondence of credit notations to a numerical scale (score) that will be used in our analysis.
3.2.2. INV ELI
The Empirical Leanness Indicator—ELI—is a new way to measure a company’s inventory waste. A detailed description can be found in Eroglu and Hofer (
Eroglu and Hofer 2011a). It extends the turnover curve idea introduced by Ballou (
Ballou 1981). While inventory turns simply compare a company’s inventory levels to its sales figures, ELI compares inventory levels to benchmark inventory levels that are dependent on the company’s size (sales) and industry. To calculate the ELI, we evaluate company sales and inventory data for a specific industry and period. We then compute the natural logarithms of sales and inventory and the regression sales from the logarithmic scale to the logarithmic total inventory. We obtain the INV ELI (Eli) for each firm-year by keeping the studentized residual
and multiplying by −1. The model to estimate ELI is as follows:
3.2.3. SIZE
Firm size (denoted by SIZE) in our study is taken as a control variable. The variable is calculated by taking the natural logarithm of total assets, as shown below. A firm’s assets are the resources owned by the firm and have a future economic value that can be calculated in a dollar amount. They are comprised of non-current assets (which have a life of more than a year) and current assets (with a useful life of less than a year).
3.2.4. LEVERAGE
According to Alissa et al. (
Alissa et al. 2013), large credit rating companies can operate with greater leverage due to better access to debt markets and greater transparency, which helps them to achieve higher credit ratings. Kisgen (
Kisgen 2009) found that a firm’s leverage ratio and investment activity are related to incentives to maintain or improve its rating. The leverage is measured by the non-current liabilities, also known as long-term debt, scaled by total assets, as follows:
3.2.5. CAPINT
Capital intensity is presented as CAPINT. This variable is used to identify the different capital structures. Highly capital-intensive firms tend to have less risky creditors and thus have higher credit ratings. In this research, the CAPINT is calculated by dividing gross property, plant, and equipment by total assets. The gross PPE is the value of an asset taken before any depreciation has been carried upon it
3.2.6. LOSS
Negative net income loss is presented as LOSS in our study. A firm’s net income is the residual amount of earnings after all the expenses have been deducted from the sales. In simple language, it is the profit of the firm. A firm is said to have a negative net income when its expenses exceed its sales, generally known as a loss. In our study, our LOSS calculation is based on prior research works (
Ashbaugh-Skaife et al. 2006). If the company has negative net income in the current and previous year, then it should be reported as 1, otherwise is 0.
3.2.7. SUBORD
Subordinated debt, SUBORD, is loans or securities subordinated to other loans or securities in terms of property or income eligibility. Companies with subordinated debt structures are at higher risk due to different claims on assets by debt providers (
Scott 1977;
Ziebart and Reiter 1992). For this study, subordinate debt is used as a dummy variable, as presented below:
3.3. Estimation Technique
To estimate the relationship between RATING and all other variables of the model, we use the ordered logistic model as proposed in prior research (
Ashbaugh-Skaife et al. 2006). The ordinal regression model, also known as the ordered logit model, uses the dependent variable based on the numbers, scale, or a specific order. The model’s dependent variable, i.e., RATING, is categorized into two or more categories, and against each category, a specific number is assigned.
The ordinal logit states that the next value should be higher than the previous one. The model selection has been made on the basis that it is applied to dependent variables which are discrete or ordinal, in our study reflecting credit ratings. The category interval of the dependent variable should remain the same in the model. Whenever the value is higher than the previous, we assume that OLS will consider the same difference in categorization between consecutive categories. For example, if the scale is from 0 to 5, in OLS, the difference between categories 0 and 1 will be the same as that of categories 3 and 4. In the rating experiment, the rating category defines a specific quality of the obligator, so if we had applied OLS, then there might be a chance that the risk of the obligator might remain the same in each category. To avoid such implications, we estimate our data by applying the ordinal model as used in prior research too (
McKelvey and Zavoina 1975)
Suppose the ordered response model is defined as y* = X*β + ε, where y* is the definite dependent variable, X represents the independent variables, ε is the error term, and β is the vector of regression coefficients. In the ordered model, we cannot estimate y* but we can use categories for the dependent variable; 0 if y* ≤ µ1, 1 if µ1 < y* ≤ µ2, 2 if µ2 ˂ y* ≤ µ3, …, N if µN < y*, where µ denotes the restricted parameters for categorical variables, and y* is the dependent category variable. Thus, the model represented in Equation (1) can be used to estimate the coefficient values.
3.4. Research Design
A secondary study has been carried out to empirically examine the relationship between inventory leanness and credit rating. Numerous studies have been conducted globally with a credit rating as a response outcome (
Boyer and Lewis 2002;
Holweg 2007). With context to Pakistan, little research has been done on this topic, and no research until now has been carried out using the leanness measure as the predictor variable. Credit ratings in developed countries have significant importance as they are a valuable tool to determine the creditworthiness of a prospective debtor. For this purpose, the inventory Eli, a measure to evaluate inventory leanness, is taken as an independent variable, whereas SIZE, CAPINT, and LEVERAGE are the control variables, and LOSS and SUBORD are the dummy variables in the study.
3.5. Target Population
The target population of our study is the manufacturing sector of Pakistan. Approximately five hundred and ninety-nine companies are listed on Pakistan Stock Exchange and comprise thirty-five sectors. This includes manufacturing, financial and non-financial companies. The Pakistan Credit Rating Agency (PACRA) provides services to one hundred and seventy-six firms, including listed and unlisted firms from all sectors.
3.6. Sampling
The study included only the listed companies for which PACRA provides its credit rating services. According to the statement mentioned above, there are sixty listed companies to whom PACRA is providing the rating service. Among those sixty companies, the companies that did not lie between our sample period, i.e., from 2008 to 2017, were excluded from the count. Thus, the research is based on the remaining thirty eight companies.
3.7. Data Sources
The variables estimation is based on financial records provided by the company via their financial statements from 2008 to 2017. The study included only those firms whose ratings were provided for the fiscal years within this period. The rating for the latest year was not included in this research. The balance sheet and income statement were studied to obtain the desired values needed to carry out the independent, control, and dummy variable calculations. For the dependent variable, the PACRA website was of great help. The PACRA website provides a historical record of the company’s ratings. The report consists of comments by rating analysts, the rating criteria, and the current position in terms of the rating score of the company. The missing observations were not incorporated into the research, thus making our data imbalanced.
4. Results
We analyze the overall impact of inventory leanness on credit ratings. Our model first represents the relationship of inventory leanness with credit rating, and then we include control variables as they are identified as influencing credit ratings. For the analysis, we estimate a generalized ordered logistic regression model as proposed by McKelvey and Zavoina (
McKelvey and Zavoina 1975).
Table 3 shows descriptive statistics for the control, independent, dummy, and dependent variable. The table shows the minimum and maximum values, the mean and standard deviation of RATING, INV ELI (Eli), SIZE, LEVERAGE, CAPINT, LOSS, and SUBORD. From the mean and standard deviation values as well as the sample distribution, we can conclude that the data is normally distributed. The mean value of the rating is generally in line with previous studies.
Multicollinearity is the occurrence of high intercorrelation among independent variables in a multiple regression model. To verify the assumption of multicollinearity, we carry out a correlation test. The correlation among variables is presented in
Table 4. Pearson’s correlation test was applied to the variables. Multicollinearity does not seem to be an issue based on these correlations. The association among the dependent variables: RATING, the control variables, and dummy variable(s), SIZE, LEVERAGE, CAPINT, and LOSS, are tested at a significance level of 0.01. The correlation value of ELI-RATING is 0.047, meaning there is a positive but weak relation. The dependent variable, RATING, has a positively strong relationship with the control variable, SIZE, with a correlation coefficient of 0.448. Regarding LEVERAGE, as expected, there is a negative association with RATING (correlation equals −0.374). The relation between RATING and CAPINT is significantly strong but negative, with a correlation coefficient of −0.522. The relation between RATING and SUBORD is negative, the same being observed for the correlation between RATING and LOSS.
The model fit, which explains the prediction of the outcome variable, is conducted before taking any explanatory variables into account. First, we estimate the intercept model with the independent variables model. Then we evaluate the final model with the baseline model. This test helps to determine whether the data is fit or not to be used for further analysis. The outcome of the model fit test is shown in
Table 5. It shows the 2-log likelihood of the intercept and the final model, as well as the chi-square value of the final model, i.e., the difference between the intercept only and the final model. The significant chi-square statistics indicate that the final model gives convincing information regarding the model fit, as the significance value
p < 0.05. This results in our model being fit to predict the outcome variable.
Table 5 presents the results of the model fit test. The significant chi-square statistic indicates that the final model gives convincing information regarding the model fit. The
p-value is 0.000, less than the significance level of 0.05, which means that our data is fit to predict the outcome variable. The difference between the final model and the intercept model (Baseline 41 Model) is 111.313, which results from the 2-Log Likelihood of both models.
The goodness of fit test indicates whether our model is fit for the assumption testing or not. For the null hypothesis, our
p-value should be greater than 0.05 to allow accaeptable conclusions. The results in
Table 6 indicate that the Pearson and deviance statistics both have a
p-value much greater than 0.05, hence satisfying our null hypothesis. As our dependent variable is ordinal, we use McFadden’s R
2 to assess the goodness of fit. As per our results, the value is 0.356 (
Table 7), indicating it is a good fit.
The variance in the dependent variable is associated with the independent variable and is explained by the pseudo-R-square in the ordinal regression. The ordinal model considers the likelihood ratio. All the raw residuals are excluded from the calculations. The tests used to measure R-square are Cox and Snell’s, Nagelkerke and McFadden (
Cox and Snell 1968;
McFadden 1974;
Nagelkerke 1991).
Table 7 shows that Cox and Snell’s R-square is 0.522; hence we may conclude that a reasonable model fit exists, which can be used for regression analysis. The Nagelkerke R-square is 0.597 reinforcing our assumption of model fit data. Lastly, McFadden’s R-square states the acceptable range of the R-square from 0.2 to 0.4, with our results showing a value of 0.356, which means that the model is fit. We can conclude therefore that we can use our independent variables to predict the dependent variable results.
Our hypothesis indicates that low levels of inventory are linked with better credit ratings.
Table 8 shows a positive and significant association between ELI and credit ratings. As for the control variables, all variables are significantly related, but SIZE has a positive relation, whereas LEVERAGE and CAPINT have a negative relationship. For the dummy variables, LOSS and SUBORD form a positive but insignificant relationship with the rating variable. The thresholds appear at the top tier of the estimation parameter table and show the latent variable that is cut to dispose of the five groups studied in the data. The latent variable is continuous and the estimates are not normally used for interpreting results. In our model, the estimates for the intercepts would be between 11.507 and 22.773.
From the table, we conclude that against the threshold RATING 4, we have an estimated coefficient of 11.507, whereas RATING 7 reaches an estimated value of 22.773, and the coefficients of the intermediate rating thresholds falling in-between these two values. RATING 8 was excluded because it was evaluated as a baseline model.
As for the location estimates, the following interpretation can be formed. The estimated coefficient of ELI (β1) is 0.942, with the respective p-value (0.000) confirming that ELI has a significant relation with RATING. Accordingly, a one unit increase in ELI will tend to bring a 0.942 change in RATING, corresponding to an upgrade of approximately one rating level. The estimated coefficient of SIZE is 0.898, which denotes the change in RATING related to a one unit increase in SIZE. The estimated coefficient value of LEVERAGE is −3.770, which represents the change in RATING as a reflection of a one-unit increase in LEVERAGE. Regarding CAPINT, we also detect a significant but negative association with RATING. In this case, RATING decreases by 4.428 when CAPINT increases one unit. Both dummy variables, SUBORD and LOSS, show nonsignificant associations with RATING, though revealing opposite signs.
5. Discussion
Credit rating agencies play a major role in corporate default risk assessment. Based on publicly available information, CRAs evaluate firms. Credit ratings convey then the credit rating agency’s view of the creditworthiness or ability of an issuer to pay its financial obligations. The credit rating industry in Pakistan is duopolistic. The rating industry of Pakistan is not much developed, and little effort is being made for this. PACRA and JC-VIRS are the only two dominant rating agencies in Pakistan. It has been argued that it is quite difficult for firms to enter the market because of high barriers and dominant agencies have a “heritage of reputation” (
Kamran and Siddiqui 2015). For the corporate sector of Pakistan, the assessment of risk has gained importance after the global financial crisis of 2007. Though several steps have been taken to issue regular ratings of corporations, the sector still needs some improvements.
This study strives to capture the impact of inventory leanness and credit ratings. Prior research (
Eroglu and Hofer 2011b) has explained the relationship between Inventory management and its discrete components, i.e., raw material, work-in-process, and finished goods with firm performance, but little research has been done with the inventory empirical leanness indicator. Other than that, prior research has not discussed the corporation’s performance on its inventory and credit ratings (
Anderson and Mansi 2009;
Denis and Mihov 2003).
We analyze the relationship between inventory performance, ELI, and credit ratings using a sample study of Pakistan-based manufacturing companies for the period from 2008 to 2017. The main idea of the study was to examine the effect on credit ratings resulting from inventory leanness. From our results, we conclude that inventory leanness has a significantly positive impact on credit ratings (
Eroglu and Hofer 2011a), quantified in 0.942 additional units of RATING per additional unit of ELI. This represents a significantly strong effect of ELI on the credit ratings of a firm. The correlation matrix has also shown a strong relationship between dependent and independent variables, namely RATING and ELI.
Our results indicate that the relatively lean firm tends to have better credit ratings than those firms which are not lean. Lean inventory management benefits cost flows, meaning that positive inventory leanness will benefit present as well as future cash flows. Positive inventory can be measured as a signal of growth in terms of profitability for firms that practice lean inventory management. Inventory leanness suggests that the turnover curve will help the management of the firm to predict a reasonable inventory policy that the firm can apply to its item control. The other control and dummy measures used to evaluate firms’ financial performance in the context of credit ratings show that most of our results are per the previous findings (
Ashbaugh-Skaife et al. 2006;
Attig et al. 2013;
Kim et al. 2013). SIZE shows positive effects on credit ratings, suggesting that the firms with greater profitability and larger firms with high leverage capacity can easily have access to financial markets, especially the debt markets. As a result, those firms would have higher credit ratings. LEVERAGE and credit rating depict a negative relation, implying that firms with higher leverage ratios and greater debt burden are related to lower ratings and thus have more difficulty in accessing debt markets. Capital intensity for capital-intensive firms is higher than that of labor-intensive firms. The fixed cost is a must for capital-intensive firms, and the firm has to bear it even if its production process is out-of-order. Capital-intensive firms use high levels of financial and operational leverage; though they may use the property and other fixed assets as collateral in return, it affects their sales level, and hence a downgrade of ratings may occur. In or sample subordinated debt and the occurrence of losses do not seem to have a statistically significant effect on ratings.
6. Conclusions and Limitations
This research explores the association between inventory leanness and the credit ratings of a firm. For this, we carried out an ordered logit regression. The results are explained in
Section 4. The statistically significant results are evidence of a link between inventory leanness and firms’ credit ratings.
As per our research capabilities, we were able to evaluate that the manufacturing firms use the inventory curve to measure inventory leanness, but it is argued that this unit of measurement might not provide accurate results. Thus, we examine inventory leanness using ELI. The lean study will help in the growth of the manufacturing sector of the country. The data would be helpful for rigorously evaluating creditworthiness and improving the firm’s credit risk status.
The study included firms listed on the Pakistan Stock Exchange and rated by PACRA. The firm characteristics such as firm size, leverage, subordinated debt structure, loss (negative net income), and capital intensity were also included in the model to evaluate whether they affected our response and outcome variable or not. To estimate the model, we carried out the ordered logit regression. The statistically significant results are evidence that there is a link between inventory leanness and credit ratings of firms listed on PSX and rated by PACRA.
In our study, we presented the credit rating literature in the context of Pakistan. There are two dominating credit rating agencies in Pakistan; PACRA and JCR-VIS. In this, firms rated by PACRA were included, so our results only justify the effect and relationship for these firms.
Kamran and Siddiqui (
2015) state that as the concept of credit ratings is in its initial stages in Pakistan, in context with our study, most of the firms have stable ratings. If any change in ratings was reported, it was reported every month. The study helped determine the current situation of credit rating agencies and the practice of credit ratings in Pakistan. As per our research capabilities, we were able to identify that little research was done on this topic in Pakistan. Most manufacturing firms use inventory curves to measure inventory leanness which might not provide an accurate picture, and results could be misleading. For this, we conducted research that helps to examine the measure of inventory leanness using ELI (
Eroglu and Hofer 2011b) so that results are not misleading. The results obtained encourage the growth of Pakistan’s manufacturing sector in leanness measures. The results are also helpful for firms, as they can evaluate their creditworthiness and improve the firm’s credit risk (credit default) status.
This empirically based research has many practical implementations, but certain limitations and unobserved factors exist. Firstly, the study only considers the firms rated by PACRA from 2008 to 2017. We analyzed a limited number of firms. Secondly, we had assumed that all firms employ ELI as a leanness indicator. Our measuring techniques have been limited as per this assumption. Thirdly, this type of research is being conducted for the first time in Pakistan. To support our research concerning Pakistani authors, we did not find enough reference articles. Finally, the data for the outcome variable RATING was taken from data available on the PACRA website. We excluded ratings of JCR-VIS as it is a privately owned rating agency. It is believed that PACRA is duopolistic and is paid to provide strong ratings. This has limited inaccurate results.
The firms’ characteristics are not restricted to SIZE, LEVERAGE, CAPINT, LOSS, and SUBORD. For the study, we can use the coverage ratio to analyze the firm financial performance (
Ashbaugh-Skaife et al. 2006;
Attig et al. 2013;
Kisgen 2009). The firm’s performance can also be measured by return on assets and Tobin’s Q. Other than this, our study was based only on inventory leanness and credit rating. We can do a comparative study by defining the relationship between inventory leanness and equity performance (
Isaksson and Seifert 2014;
Koumanakos 2008;
Swamidass 2007). Due to a lack of data availability, our research was limited to a specific sector and period. If PACRA and other official sites provide complete data to users, it can be conducted on a large sample size. Data availability can also help us extend our research on unlisted firms. Regulatory bodies such as SECP and the State Bank of Pakistan should make it mandatory for all firms to issue their credit ratings regularly.
Kamran and Siddiqui (
2015) suggest that PACRA ratings are usually based on firms’ suggestions. The firm usually pays additional fees to PACRA, so their ratings are shown as a strong obligator on the official sites of the firm as well as on the PACRA website. Such practices should be monitored, and a complete check and balance should be maintained so that authentic information may reach investors, debt holders, shareholders, and other related parties. This research is based on manufacturing firms in Pakistan only. For the supporting literature, the base of this study was a US-based research paper (
Bendig et al. 2017). No other literature evidence was found related to this topic, so based on this statement, we can recommend that other countries could research this topic too. The countries that fall in the same category as Pakistan could use this study as evidence. In the future, further research and innovation could be made on this topic in Pakistan.


 ,
, 


