Abstract
Hemp, flax and canola seed cakes are byproducts of the plant oil extraction industry that have not received much attention in terms of their potential use for human food instead of animal feed. Thus, the bioactivity profiling of these oilseed cakes is of interest. For their effect-directed analysis, planar chromatography was combined with several (bio)assays, namely 2,2-diphenyl-1-picrylhydrazyl scavenging, acetylcholine esterase inhibition, planar yeast estrogen screen, antimicrobial Bacillus subtilis and Aliivibrio fischeri assays. The streamlined high-performance thin-layer chromatography (HPTLC)-bioassay method allowed the discovery of previously unknown bioactive compounds present in these oilseed cake extracts. In contrast to target analysis, the direct link to the effective compounds allowed comprehensive information with regard to selected effects. HPTLC-electrospray ionization-mass spectrometry via the elution-head based TLC-MS Interface was used for a first characterization of the unknown effective compounds. The demonstrated bioactivity profiling on the feed/food intake side may guide the isolation of active compounds for production of functional food or for justified motivation of functional feed/food supplements.
Keywords:
oilseeds; hemp; flax; canola; polyphenols; planar chromatography; effect-directed analysis; HPTLC-MS; bioassays 1. Introduction
Oilseed cakes refer to the byproducts after the oil extraction from the oilseed. The global demand of oilseeds is increasing every year as the world production of oilseed cakes increased 2.3% of average every year over the last decade to 2010. According to FAO, the global production of oilseed cakes was 118 million tons in 2010/2011 and it is expected to increase to 120 million tons in 2012/2013 [1,2,3,4]. The oilseed cakes are usually further processed into animal feed by oil mill factories due to their high protein and energy contents, as well as their economic value. The nutritional values of oilseed cakes as animal feed and the feed performance has been studied extensively on animal models. A similar live weigh gain occurred in calves fed with either seed cakes or mixture of soybean meal and barley [5]. Employment of hempseed cake into fish feed improved the texture of fish fillet and the growth rate of fish compared with soybean meal and soybean isolate [6].
The oilseed cakes contain secondary metabolites, namely phenolic acids and flavonoids. There are only few reports on the quantity of these phytochemicals in the oilseed cake extracts (total phenolics content and total flavonoids content) and their total antioxidative activities (via 2,2-diphenyl-1-picrylhydrazyl (DPPH˙) scavenging activity, oxygen radical absorbance capacity (ORAC), ferric reducing antioxidant power (FRAP), iron chelating capacity and β-carotene bleaching test) [7,8]. As the polyphenol extracts of seed cakes of hemp (Cannabis sativa), flax (Linum usitatissimum) and canola (Brassica napus) have not been studied in detail yet, information on single effective compounds would be of interest, since the polyphenols that exhibit functional and nutraceutical properties could also be used in functional food, additionally to its use in feed. Previous studies showed the improvement of human health by antioxidant compounds, such as healing human chronic ulceration, inhibition of cancer cells, improving the condition of cardiovascular diseases and diabetes, anti-inflammatory, anti-microbial, antiviral, anti-allergenic, anti-artherogenic, antioxidant, anti-thrombotic, cardioprotective and vasodilatory effects [9,10,11].
High-performance thin-layer chromatography (HPTLC)-direct bioautography is a simple and rapid technique to discover and characterize single bioactive compounds that are present in crude and complex extracts. This technique is suitable for a bioactivity screening of active components in natural products [12]. HPTLC has advantages, such as simplified sample preparation, low operating costs, short analysis time and simultaneous analysis of several samples. HPTLC has been employed in the study of anthocyanins and bioactivities of extracts from grape pomace, wine, fruit juices, bilberries, cranberries, and blueberries powders [13,14]. In addition, there are several HPTLC reports on the determination of polyphenols and their bioactivities from plant materials, such as Citrullus lanatus (Thunb.) seed, Rosa hybrida cultivar ‘Jardin de Granville’, and vegetable fern Diplazium esculentum Retz [15,16,17]. It could be claimed that HPTLC is a universal technique to detect bioactive compounds in complex samples due to its option for multi-detection, its matrix-tolerance and especially its compatibility to biological assays. Nevertheless, light-sensitive, oxidation-prone and volatile bioactive components might be discriminated by the open planar technique. So far, neither TLC/HPTLC literature has been available that detects single bioactive phytochemicals in hemp, flax and canola seed cake extracts nor the oilseed cakes have been extensively explored for human usage. It is worth to investigate the possible usage of oilseed cakes for human use in the aspect of health benefit and economic value, as oilseed cakes are low price available byproducts that are produced in large volume.
In this present study, the bioactive compounds that can be recovered from the oilseed cakes are explored by HPTLC. Mobile phase development was conducted for the extracts of hemp, flax and canola seed cakes. The best mobile phase that provided good separation of compounds in the extracts was used and the chromatogram was subjected to further assays, namely DPPH˙ scavenging assay, acetylcholinesterease (AChE) inhibition assay, planar yeast estrogen screen (pYES) bioassay, antimicrobial Aliivibrio fischeri and Bacillus subtilis bioassays. HPTLC-electrospray ionization mass spectrometry (ESI-MS) was used to characterize effective compounds by eluting the zones of interest with the TLC-MS Interface directly into the mass spectrometer.
2. Experimental Section
2.1. Materials
Cold-pressed hemp (Cannabis sativa) and flax (Linum usitatissimum) seed cakes were given by Oil Seed Extractions Limited, Ashburton, New Zealand. Cold-pressed canola (Brassica napus L.) seed cake was supplied by New Zealand Vegetable Oils Limited, Canterbury, New Zealand. Methanol, ethanol, acetone, toluene, n-hexane, ethyl acetate, formic acid, glacial acetic acid, glycine, sodium hydroxide, 4-methylumbelliferyl-β-d-galactopyranoside (MUG, all HPLC grade), 3-(4,5-dimethylthiazol-2-yl)-2,5-diphenyl-tetrazolium bromide (MTT, ≥98%) and natural product reagent (99.9%) were purchased from Roth (Karlsruhe, Germany). Saccharomyces cerevisiae BJ3505 (protease-deficient, MATα PEP4::HIS3 PRb1-Δ1.6R his3 lys2-208, trpl-Δ101 ura3-52, [18]) were obtained from W. Schwack, University of Hohenheim, Stuttgart, Germany who received it from S. Buchinger, German Federal Institute of Hydrology, Koblenz, Germany. Luminescent marine Aliivibrio fischeri bacteria (DSM no. 5171) were bought from the German Collection of Microorganisms and Cell Cultures (Deutsche Sammlung von Mikroorganismen und Zellkulturen, DSMZ, Leibniz Institute, Braunschweig, Germany). Acetylcholinesterase (AChE) lyophylisate (Electrophorus electricus, electric eel), potassium hydroxide pellets, 2,2,-diphenyl-1-picrylhydrazyl (DPPH˙), hydrochloric acid (HCl) 37%, α-naphthyl acetate, Fast Blue Salt B, bovine serum albumin (BSA) and polyethylenglycol (PEG)-400 (all of analytical grade) were obtained from Fluka Sigma Aldrich, Steinheim, Germany. Bacillus subtilis (BGA, ATCC 6633) spores as well as HPTLC plates silica gel 60 (also with F254) were used, except for HPTLC plates RP-18 W F254s for the pYES bioassay and HPTLC plates silica gel 60 F254 MS-grade for MS recordings (all Merck, Darmstadt, Germany). Bidistilled water was generated by a Heraeus Destamat Bi-18E (Thermo Fisher Scientific, Schwerte, Germany).
2.2. Extraction of Polyphenols from Oilseed Cakes
Grinding and defattening was performed at the Department of Food Science, University of Otago, Dunedin, New Zealand, as follows. The cold-pressed oilseed cakes were milled in powder form using a Cemotec Sample Mill 1090 (FOSS Tecator, Hoganas, Sweden) and sieved through an 80 µm test sieve with a Retsch AS200 vibrator sieve shaker (Retsch, Haan, Germany). The resultant seed cake powders (<450 nm) were defatted with n-hexane in a Soxhlet extraction apparatus for 3 h.
Extraction of polyphenols from defatted seed cake flours were performed according to the optimum polyphenols extraction that had been studied previously [8]. Briefly, defatted seed cake flours were extracted with a mixed solvent of methanol–acetone–water (7:7:6, V/V/V) using an ultrasonic bath (Elma, Singen, Germany) with a fixed power (200 W) at 70 °C for 20 min. The sample to solvent ratio was 1:10 (g/mL). The slurries were centrifuged at 13.000× g for 15 min to remove the solid materials and the supernatants were stored at 4 °C prior to analysis. After 1:2 dilution with methanol, this extract (5%) was subjected to analysis.
2.3. HPTLC Method
The HPTLC plate size was cut to smaller pieces (TLC Plate Cutter, CAMAG) depending on the number of samples sprayed-on. The extracts were applied as 8-mm bands using the Automatic TLC Sampler 4 (ATS 4, CAMAG, Muttenz, Switzerland). The dosage speed was 150 nL/s. The track distance was 20 mm (first sample application at X = 15 mm and Y = 8 mm). For mobile phase selection, 15 µL extract solution (except 30 µL for flax seed extract) were sprayed-on. Depending on the detectability of the (bio)assay, application volumes ranged from 5 to 30 µL/band.
For the normal phase HPTLC development, the mobile phase optimization using various mobile phases of different solvent combinations and ratios (Table 1) was performed using the Twin Trough Chamber (10 × 10 cm, CAMAG). The best mobile phase mixture was employed for the different (bio)assay detections (Table 1, #4 for hemp and canola and #13 for flax). Alternatively to the Twin Trough Chamber (20 × 10 cm, CAMAG), the Automatic Development Chamber (ADC 2, CAMAG) was employed, which allowed a highly reproducible separation by use of the plate activity control and the fully automated operation. Before the bioassay, the 20 × 10 cm plate was cut into identical pieces subjected to the different (bio)assays. The pYES bioassay was performed on the HPTLC plate RP-18 W F254s with a mixed solvent of n-hexane, toluene and ethyl acetate (8:3:2, V/V/V) [19]. The plates were dried for 5 min using a stream of cold air (hair dryer) and documented at UV 254 nm and 366 nm with the TLC Visualizer or DigiStore2 Documentation System (both CAMAG).
Optionally, derivatization was performed by immersion into a solution of 0.005 g/mL natural product reagent in methanol, followed by immersion into a 5% methanolic PEG-400 solution (V/V) using the TLC Immersion Device III (CAMAG; vertical speed 3.5 cm/s; immersion time 0 s). After each immersion, the plate was dried for 5 min using a stream of cold air (hair dryer). Before the performance of bioassays or enzymatic assays, the plate was neutralized due to the residual acid traces of the mobile phase remained on the adsorbent. Therefore, the plate was placed in the twin trough chamber with the potassium hydroxide pellets in the opposite trough of the Twin Trough Chamber for 30 min, followed by drying for 5 min using a stream of cold air (hair dryer).
2.4. DPPH˙ Scavenging Assay
The developed, optionally neutralized and dried plate was dipped into a methanolic solution of 0.2 mg/mL DPPH˙ using the TLC Immersion Device III (CAMAG; vertical speed 2 cm/s; immersion time 5 s), followed by drying for 90 s at ambient temperature in the dark. The plate was heated at 60 °C for 30 s on the TLC Plate Heater (CAMAG) and documented under white light illumination (reflectance mode) using the TLC Visualizer.
2.5. Antimicrobial Aliivibrio Fischeri Bioassay
The Aliivibrio fischeri bioassay was performed according to previous studies [13]. Briefly, the developed, neutralized and dried plate was immersed into a A. fischeri suspension that was prepared according to DIN EN ISO 11348-1, Section 5 [20] for 2 s at an immersion speed of 2 cm/s. The luminescent plate image was captured with an exposure time of 50 s instantaneously and in time intervals of 3 min until 30 min using the BioLuminizer (CAMAG).
2.6. Enzymatic AChE Inhibitory Assay
The AChE assay was prepared according to previous studies [21,22]. Briefly, the developed, neutralized and dried plate was immersed in the prepared enzyme solution for 5 s at the immersion speed of 1 cm/s using the TLC Immersion Device (CAMAG). The plate was placed in a horizontal position on a Teflon block spacer in a damp plastic box (ID 22 cm × 13.5 cm, Obi, Giessen, Germany) lined with filter paper, wetted with water and incubated at 50 °C for 30 min. After incubation, the plate was immersed analogously, but for 1 s, into the 1:1 mixed substrate solution consisting of an ethanolic α-naphthyl acetate solution (175 mg in 70 mL) and aqueous Fast Blue Salt B solution (350 mg in 140 mL). The plate was heated at 50 °C for 2 s on the TLC Plate Heater and documented under white light illumination (reflectance mode) using the TLC Visualizer (CAMAG).
2.7. Antimicrobial Bacillus Subtilis Bioassay
The Bacillus subtilis bioassay was prepared according to a recently optimized workflow [23]. Briefly, the developed, neutralized and dried plate was immersed into the B. subtilis suspension for 5 s using the TLC Immersion Device (CAMAG) at an immersion speed of 3.5 cm/s. The plate (placed in a horizontal position in a moistened plastic box lined with filter paper wetted with water) was incubated at 37 °C for 2 h. After incubation, the plate was immersed analogously, but for 2 s into a MTT solution (0.2% in BSA-buffer). The plate heating at 50 °C was done on the TLC Plate Heater (CAMAG) for 10 min. Documentation under white light illumination (reflectance mode) was carried out by the TLC Visualizer (CAMAG).
2.8. pYES Bioassay
The pYES bioassay was performed according to a substantially optimized method based on HPTLC plates RP-18 W F254s [19,24]. Briefly, 20 mL of growth medium was inoculated with one yeast cell colony and cultured at 30 °C with shaking at 100 rpm for 18 h. It was diluted with growth medium to reach 2.5 × 10⁸ cells per 50 mL. The developed, neutralized and dried RP-18 W F254s plate was dipped into the yeast cells suspension for 5 s at an immersion speed of 3.5 cm/s using the TLC Immersion Device (CAMAG). The plate (placed in a horizontal position in a moistened plastic box lined with filter paper wetted with water) was incubated at 30 °C for 3 h. The incubated plate was dried for 2 min and analogously dipped into the MUG substrate solution (pH 12) [19]. After incubation at 37 °C for 1 h, the plate was immersed into a 0.1 M glycine solution (adjusted to pH 12 by sodium hydroxide). Documentation at UV 366 nm was performed using the DigiStore 2 documentation system (CAMAG).
2.9. Characterization of Bioactive Compounds Using Mass Spectrometry
The elution head-based TLC-MS Interface (CAMAG) was connected to a single quadrupole mass spectrometer (ExpressIon CMS, Advion, Ithaca, NY, USA) equipped with an ESI interface. The bioactive zones on the HPTLC plates were marked with a soft pencil and eluted by the oval elution head (4 × 2 mm) of the TLC-MS Interface (CAMAG) with 100% methanol at the flow rate of 0.1 mL/min using a HP 1100 ChemStation pump (Agilent, Waldbronn, Germany). Mass spectra were recorded in the full scan mode (total ion current (TIC) chronogram) between m/z 50 and 1200. The settings in the negative ionization mode were: capillary voltage −170 V, source voltage −30 V, capillary temperature and source gas temperature 250 °C, ESI voltage −3 kV, and detector offset 1200. A representative plate background at a migration position comparable to the analyte zone (same migration distance) was subtracted from the analyte spectrum. Data processing was performed using Mass Express 1.1.22.15 and Data Express 1.1.22.15 (both Advion).
3. Results and Discussion
3.1. Selection of the Mobile Phase on Silica Gel Phases
3.1.1. Hemp and Canola Seed Cakes
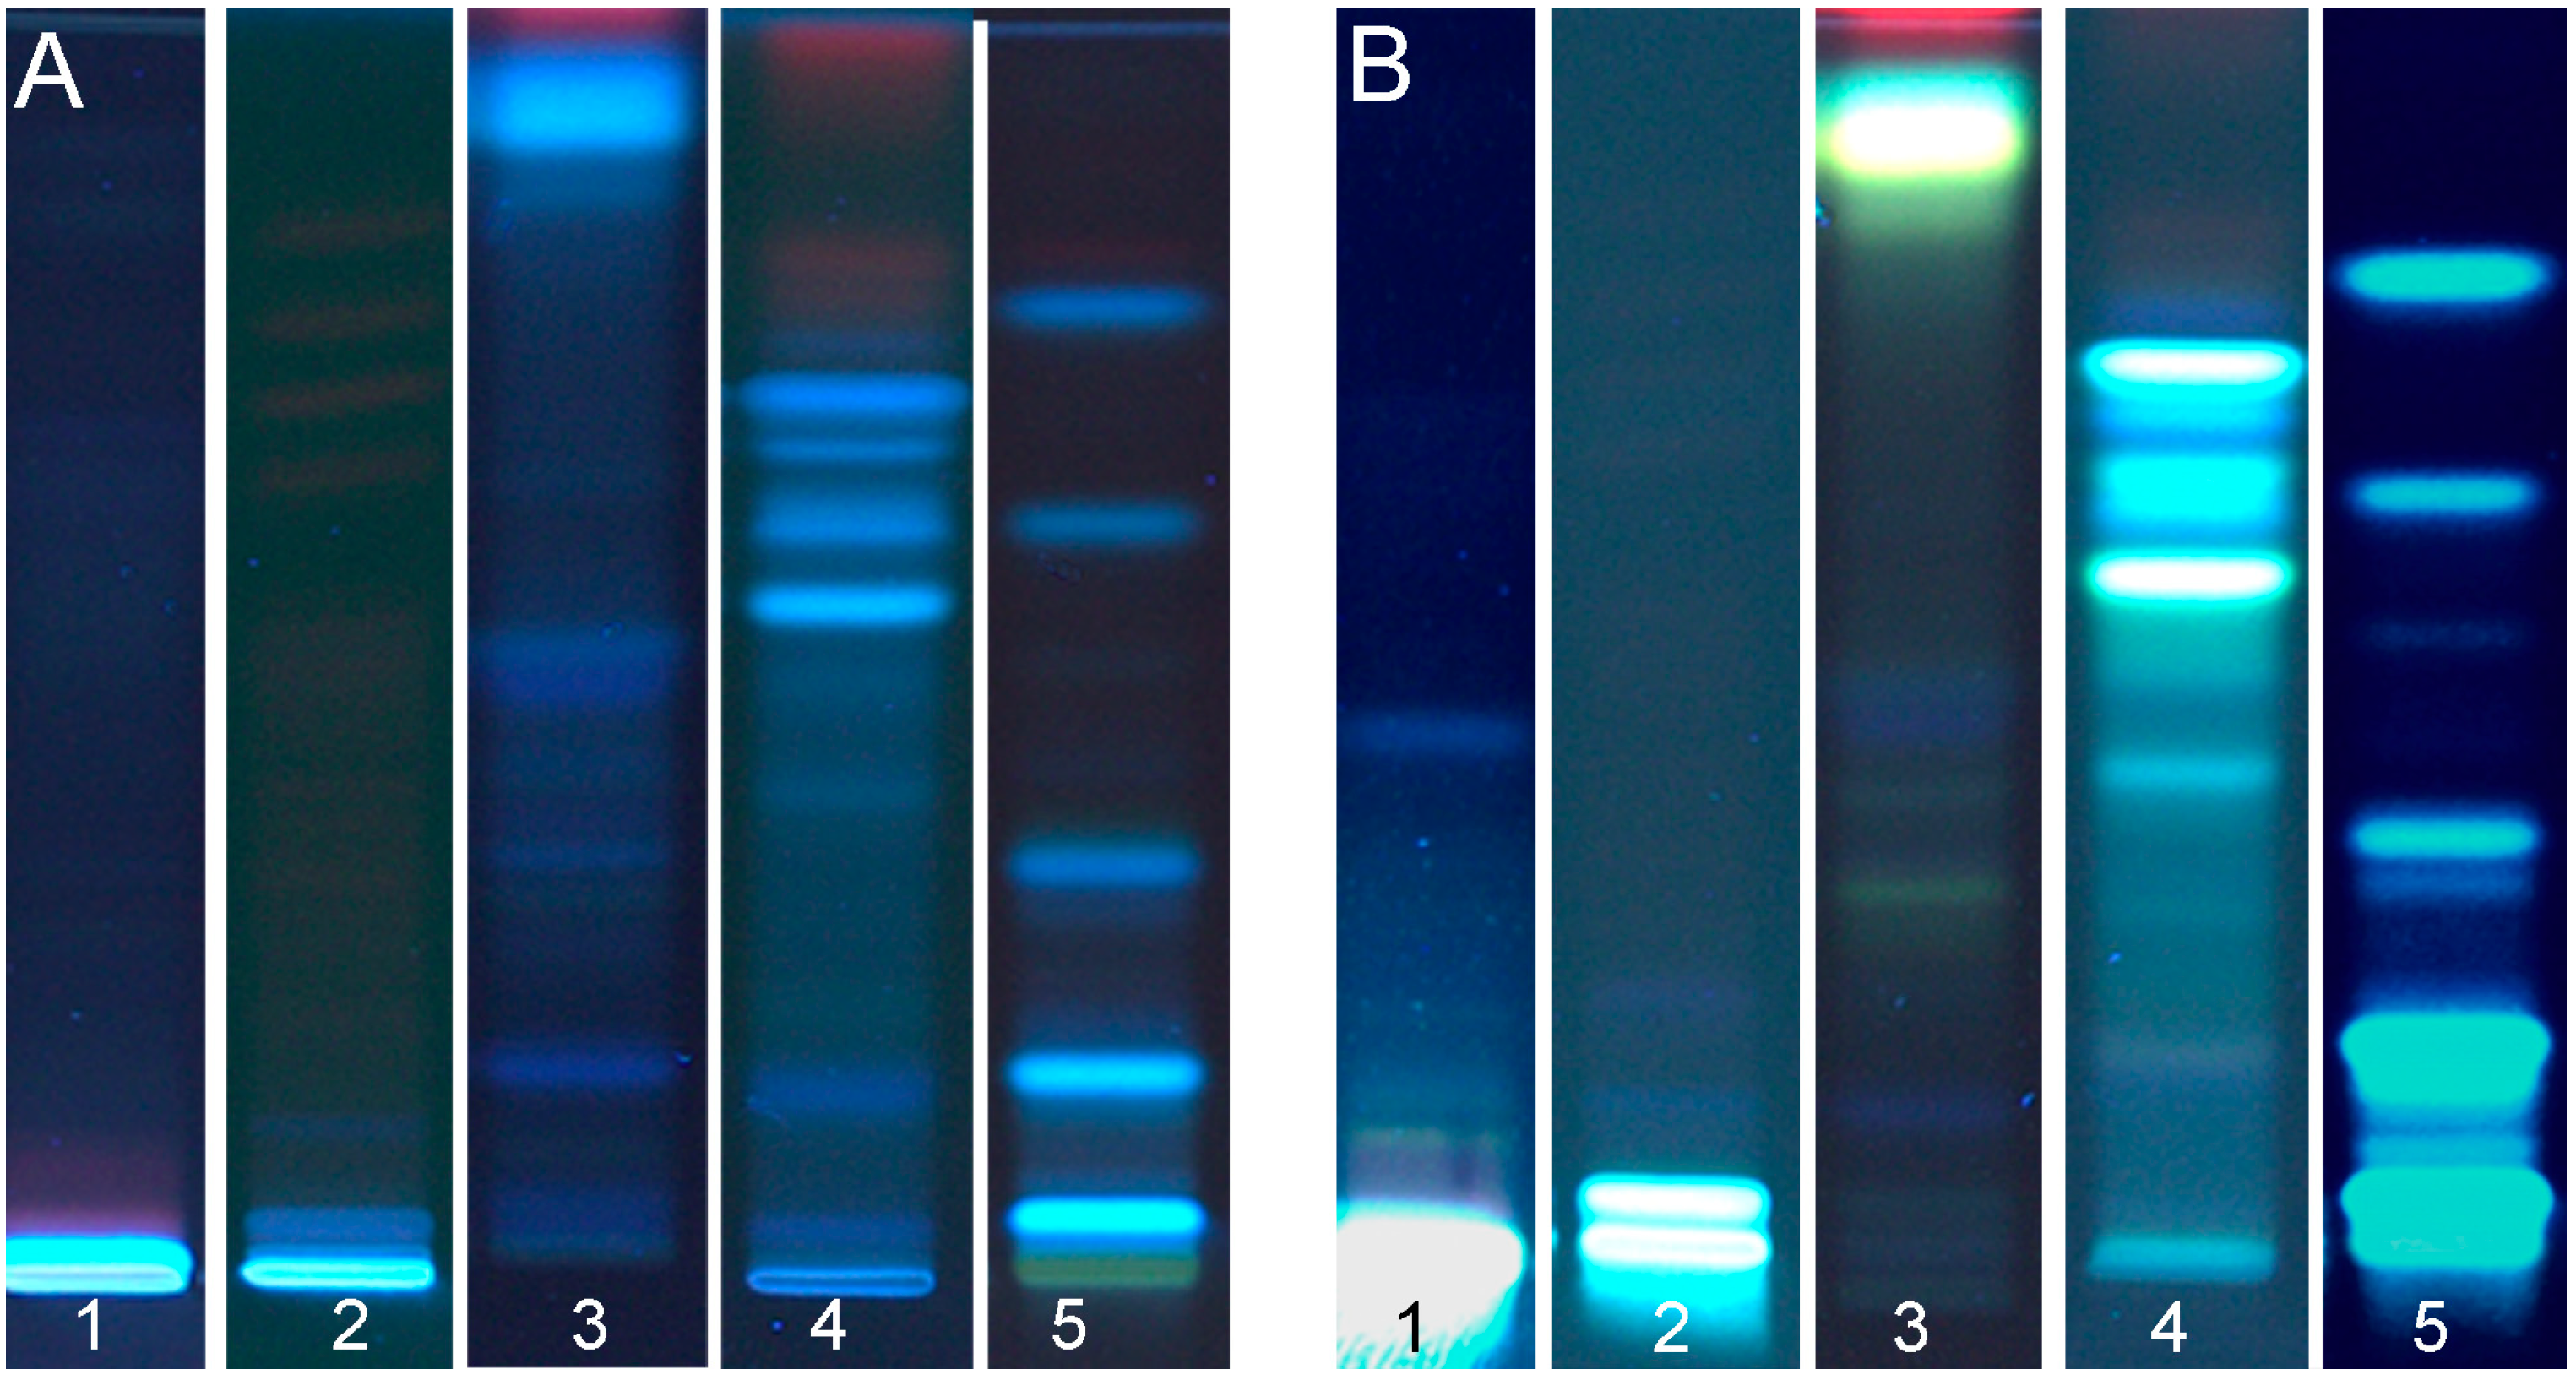
For extraction of polyphenols from the seed cakes, a solvent mixture recently optimized [8] was used. As TLC/HPTLC literature for analysis of flax, hemp and canola seed cakes was not existent, a mobile phase composed of n-hexane, ethyl acetate and acetic acid was tested first, which was previously used for analysis of polyphenols in propolis (Table 1, #1 [25]). However, this mobile phase was too weak in the elution power and did not show any compounds separation for the hemp seed cake polyphenols’ extract (Figure 1, #1). This was the same situation with another mixed solvent of slightly higher polarity (n-hexane was substituted by toluene, Table 1, #2 and Figure 1, #2). The conclusion was drawn that polyphenols of a much higher polarity were present in the hemp seed cake extract that required a higher polarity and elution power of the mobile phase if compared to polyphenols of propolis. The mixed solvent of ethyl acetate, formic acid, acetic acid and water (Table 1, #3) was investigated next. It showed a too high polarity for the hemp seed cake polyphenols and did not separate moderate polar polyphenols. Most of the compounds were eluted together, almost with the solvent front (Figure 1, #3). Hence, the elution power of the previous solvent mixture #2 was increased by addition of water (Table 1, #4). The chromatogram (Figure 1, #4) showed a good separation of the compounds. The migration time lasted 30 min for a migration distance of 65 mm. This solvent mixture was also applied for the development of polyphenol extracts from flax and canola seed cakes. It showed well-separated compounds for canola seed cake extract (Figure 1, #5), but no satisfying separation was observed for the flax seed cake extract. Obviously, hemp and canola seed cake extracts had polyphenols of a similar polarity.

Table 1.
Selection of the mobile phase for hemp, canola and flax seed cake extracts.
| # | Solvent mixture | Ratio (V/V) | Elution power |
|---|---|---|---|
| Hemp seed cake extract (also for canola seed cake extract) | |||
| 1 | n-hexane, ethyl acetate and acetic acid (6 mL HCl, 37%applied on a filter paper in the opposite trough) | 5:3:1 | Too weak |
| 2 | toluene, ethyl acetate and acetic acid | 80:25:4 | |
| 3 | ethyl acetate, formic acid, acetic acid and water | 100:11:11:26 | Too high |
| 4 | toluene, ethyl acetate, formic acid and water | 15:30:5:3 | Medium |
| Flax seed cake extract | |||
| 5 | ethyl acetate, formic acid, acetic acid and water | 40:10:10:13 | |
| 6 | ethyl acetate, formic acid, acetic acid and water | 40:20:20:13 | |
| 7 | ethyl acetate, methanol, water and acetic acid | 9:6:3:2 | |
| 8 | ethyl acetate, methanol and ammonia 25% | 10:7:3 | |
| 9 | ethyl acetate and ethanol | 1:19 | |
| 10 | ethyl acetate, ethanol, formic acid and water | 77:13:5:10 | |
| 11 | propanol, ammonia 25% and water | 8:1:1 | |
| 12 | ethyl acetate, methanol and water | 4:3:3 | Too high |
| 13 | ethyl acetate, methanol, formic acid and water | 14:3:1:2 | Medium |

Figure 1.
Chromatograms of hemp (1–4) and canola (5) seed cakes extracts (all 15 µL) obtained for different mobile phases (track 1–4 according to Table 1, #1–4; track 5 with #4); documented at UV 366 nm illumination before (A; native fluorescence) and after derivatization with natural product reagent and PEG (B).
3.1.2. Flax Seed Cake
For flax seed cake extracts, the initial solvent mixture (Table 1, #1) was too weak in elution power (Figure 2, #1). The solvent mixture #3 (Table 1) resulted in some compounds’ separation (Figure 2, #2), but still the main portion remained at the starting zone. Different ratios with an increased elution power (Table 1, #5 and 6) did not improve the separation (Figure 2, #3 and 4). Neither an acidic mobile phase (Table 1, #7) nor an alkaline mobile phase (Table 1, #8) led to any substantial compound migration (Figure 2, #5 and 6). Also, a solvent mixture mainly based on ethanol (Table 1, #9) led to poor compound separation of the flax seed cake extract (Figure 2, #7). Acidic and alkaline mobile phases of increased polarity (Table 1, #10 and 11) were still too low in elution power, but the alkaline mobile phase already showed an intense blue fluorescent band at hRF 55 (Figure 2, #8 and 9). A mobile phase mixture of significantly increased elution power containing a 30% water portion (Table 1, #12) was too high in elution power (Figure 2, #10). Finally, a moderate polarity of the mobile phase mixture composed of ethyl acetate, methanol, formic acid and a 10% water portion (Table 1, #13) led to well-separated compounds with intense bands (Figure 2, #11). For further effect-directed analysis, this mobile phase was used for flax seed cake extracts. The migration time lasted 30 min for the migration distance of 65 mm.
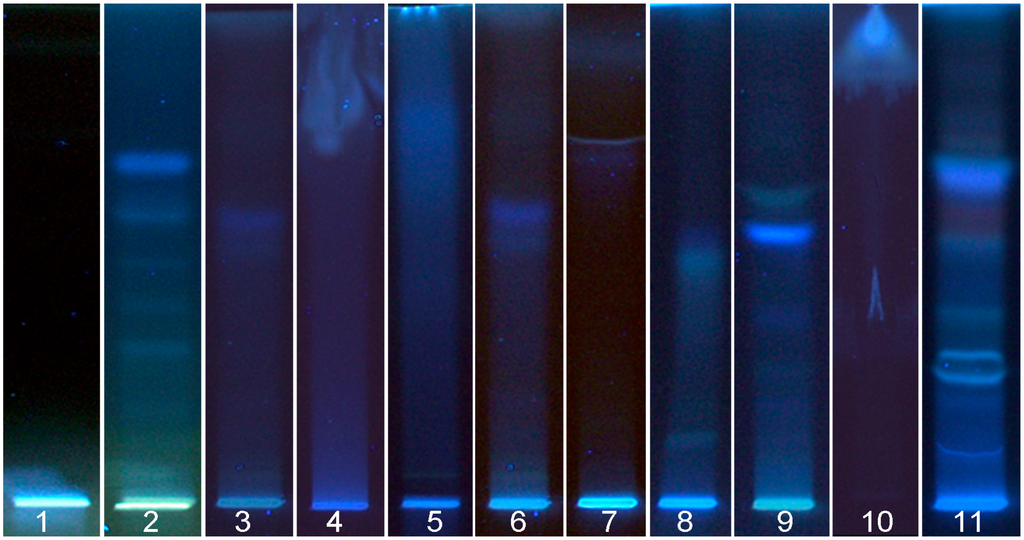
Figure 2.
Chromatograms of flax seed cake extract (30 µL) obtained for different mobile phases; for track assignment see text and Table 1; documented at UV 366 nm illumination.
Figure 2.
Chromatograms of flax seed cake extract (30 µL) obtained for different mobile phases; for track assignment see text and Table 1; documented at UV 366 nm illumination.

3.2. Detection of DPPH˙ Scavenging Activity
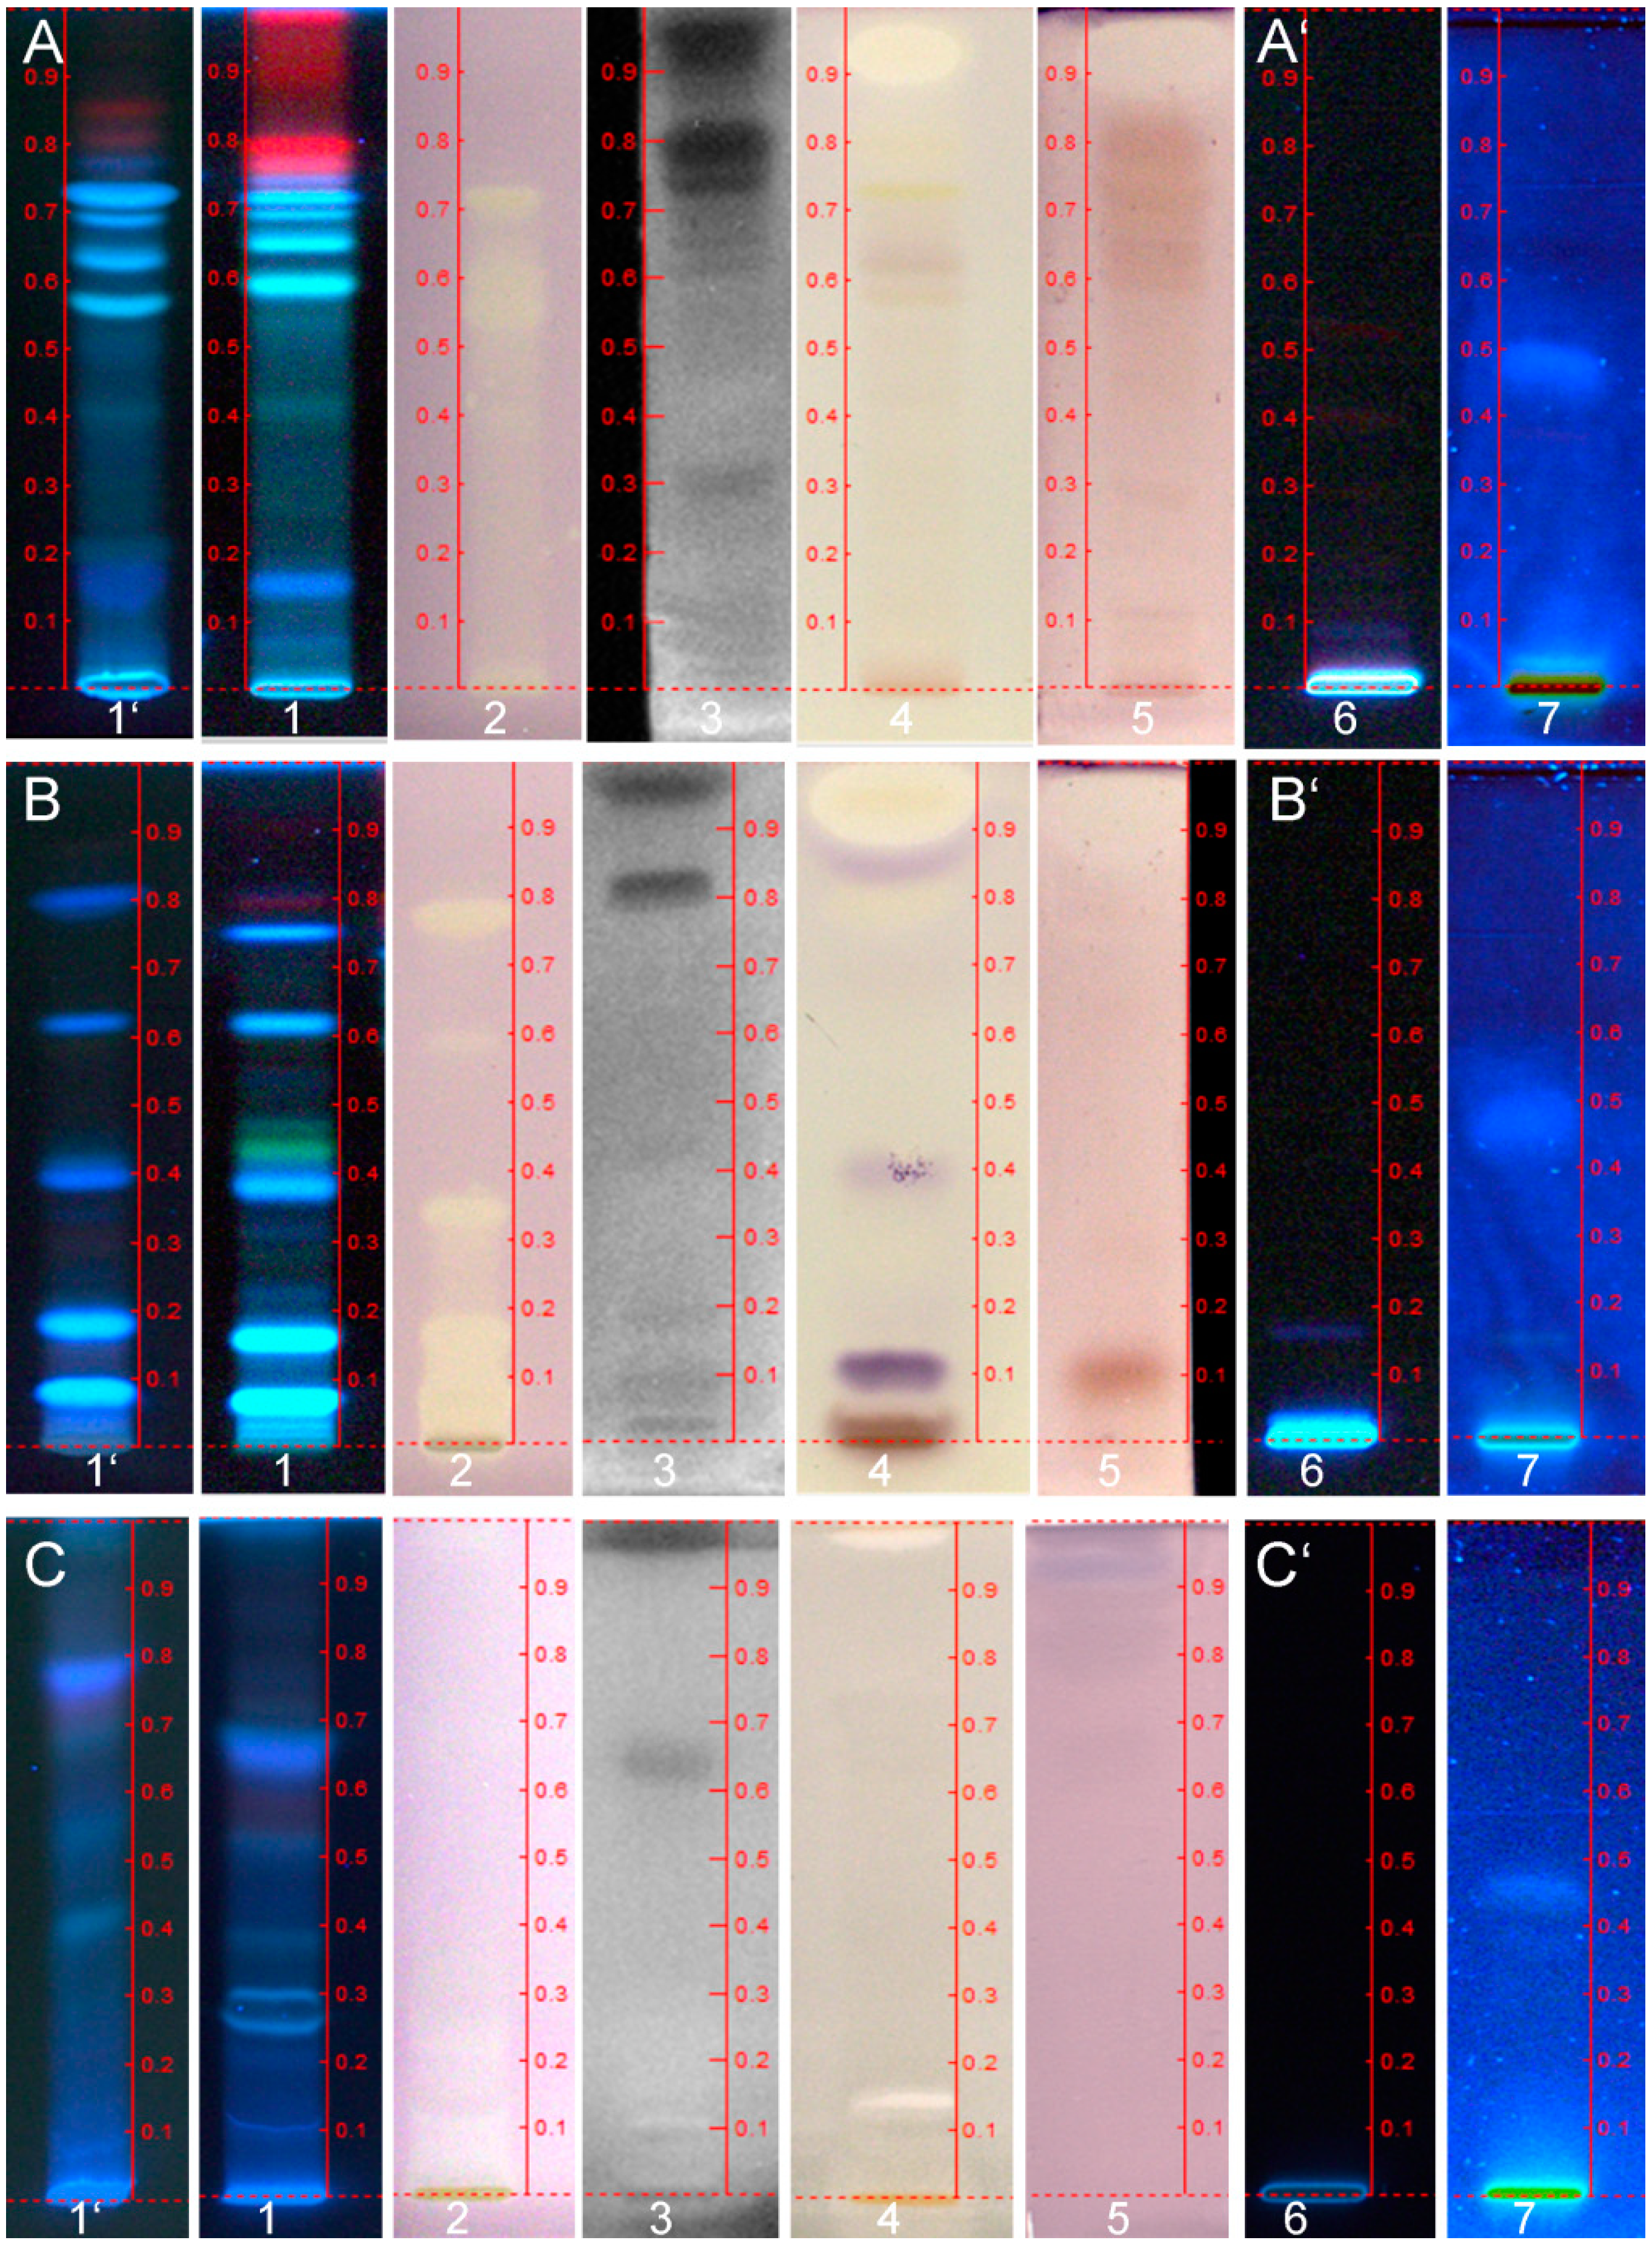
White zones on a violet plate background represented the bioactive compounds that exert DPPH˙ scavenging activity. In HPTLC, the DPPH˙ assay is performed in parallel for all samples on a plate. Hence, any time-dependent factors of influence are the same for all samples and the results can directly be compared on the image. It was found that hemp (30 µL), canola (5 µL) and flax (30 µL) seed cake extracts possessed DPPH˙ scavenging activity (Figure 3, #2 A–C), whereby the canola seed cake extract was the most active (six-times less applied). The main DPPH˙-active zones of hemp seed cake extract were observed at hRF values 0, 55, 61 and 71 (Figure 3, A2). Most intense DPPH˙-active compounds of canola seed cake extract revealed at hRF values 0, 8 and 18, further active compounds were at hRF 34 and 78 (Figure 3, B2). The DPPH˙-active zones of flax seed cake extract remained at the starting zone (need for a more polar mobile phase); some very weak effective zones were detected up to hRF 30 (Figure 3, C2).
3.3. Detection of Antimicrobial Aliivibrio Fischeri-Effective Compounds
Antimicrobial compounds present in the seed cake extracts affected the luminescence of A. fischeri bacteria and resulted in dark zones on a green-bluish luminescent background (depicted as grey scale image in Figure 3, #3 A–C). The first image recorded was depicted, as the further images taken were already overloaded due to the increase in the bioactive response. The major antimicrobial compounds were observed at the hRF 74, 80 and 95 for hemp seed cake extract (30 µL, Figure 3, A3). Two major antimicrobial compounds revealed at hRF 82 and 97 for canola seed cake extract at a six-times lower application volume (5 µL; Figure 3, B3). For flax seed cake extract, a moderate antimicrobial compound was observed at hRF 65 and a stronger antimicrobial compound (hRF 97) migrated almost with the front (30 µL, Figure 3, C3).

Figure 3.
Chromatograms of seed cake extracts of hemp (A, 30 µL), canola (B, 5 µL) and flax (C, 30 µL) on HPTLC plates silica gel 60 at UV 366 nm (native fluorescence) (1) in comparison to HPTLC plates silica gel 60 F254 MS grade (1’), after DPPH˙ assay (2), antimicrobial A. fischeri bioassay (3), AChE inhibitory assay (4), antimicrobial Bacillus subtilis bioassay (5) as well as on HPTLC plates RP-18 W F254s at UV 366 nm before (6) and after the pYES bioassay (7); 2, 4 and 5 detected under white light illumination and 3 via bioluminescence (recorded instantly).
3.4. Detection of AChE Inhibitory Compounds
AChE is mainly present in the human central nervous system, neuromuscular junctions, erythrocytes and cholinergic brain synapses and involved in terminating synaptic transmission activity [26]. Neurological disorders, such as Alzheimer’s disease, senile dementia, ataxia and myasthenia gravis, are related to AChE, and AChE inhibitors are meant to inhibit the AChE enzyme in order to enhance muscle contraction and strengthen the cholinergic neurotransmission [27]. White zones on a violet plate background represented AChE inhibiting compounds (Figure 3, #4 A–C). In the plant seed extracts investigated, the background was faded due to the acidic mobile phase used, if compared to detection of chromatograms using neutral mobile phases. The main AChE inhibitory compound revealed at hRF 94 for the hemp seed cake extract (30 µL, Figure 3, A4). For the canola seed cake extract (5 µL, Figure 3, C4), the very strong AChE inhibitory zone was near the front (hRF 94), as seen for the Aliivibrio fischeri bioassay. Additionally, a weak zone was observed at hRF 79. Two AChE inhibitory zones revealed at hRF 14 and 98 for the flax seed cake extract (30 µL, Figure 3, C4). In comparison, the canola seed cake extracts were most active (although six-times less applied) with regard to the AChE inhibition.
3.5. Detection of Antimicrobial Bacillus Subtilis-Effective Compounds
Previous studies employed the antimicrobial Bacillus subtilis assay for the detection of antibiotics in milk to represent the milk quality and the degree of residues in milk [28,29,30]. For plant materials, the antimicrobial activity was potentially exhibited by phytochemicals naturally present. For example, certain plants synthesize phytoalexins, i.e., a compound group with antibiotic and often also antioxidative and phytoestrogenic properties like resveratrol, in response to injury or fungal attack [30]. White zones on a violet plate background represented the presence of antimicrobial compounds (Figure 3, #5 A–C). Again, the background was faded due to the acidic mobile phase used, if compared to detection of chromatograms using neutral mobile phases. The results showed a strong antimicrobial compound zone at hRF 94 for hemp (30 µL, Figure 3, A5) and canola seed cake extracts (5 µL, Figure 3, B5). However, there was no antimicrobial activity for 30 µL of flax seed cake extract (Figure 3, C5).
3.6. Detection of Estrogen-Effective Compounds
Previous studies detected estrogenic compounds in wastewater or sewage treatment effluents, indicating the release of hormones into the ecosystem [31,32]. The degree of estrogenic pollution comes, for example, from estrogens naturally excreted by human beings (e.g., due to the intake of contraceptive pills), from the release of sewage water from animal farms (as growing hormone and soy meal feed, rich in isoflavones, are introduced to farm animals) and from wastewater of paper or pulp mill factories [33]. In plant materials, estrogenic compounds naturally exist in the form of phytoestrogen that mimic the human estrogen chemical structure. Phytoestrogens such as daidzein, genistein, coumestrol, biochanin A and formononetin have been found to exert estrogenic properties, which were detected in oilseeds, such as sesame, camelina, and pumpkin, as well as in seeds of cloudberries, blackcurrant, raspberries, bilberries and cranberries [34,35,36]. Lignans, namely secoisolariciresinol and syringaresinol showing cancer cells’ inhibition and estrogenic properties, were detected in high concentration in flax seed (691 µg/100 g dry weight), and in lower concentration in hemp seed (38 µg/100 g dry weight) [37].
For the substantially modified HPTLC-pYES bioassay, a reversed phase separation was used that was recently reported to generate sharply bounded zones [24,25]. Although there were no compounds observed on the developed plate at UV 366 nm, except for the start zone, (Figure 3, #6, 30 µL each), a blue fluorescent estrogenic compound at hRF 46 was detected in each seed cake extract after the pYES bioassay (Figure 3, #7 A–C).
3.7. Characterization of Bioactive Compounds Using HPTLC-ESI-MS
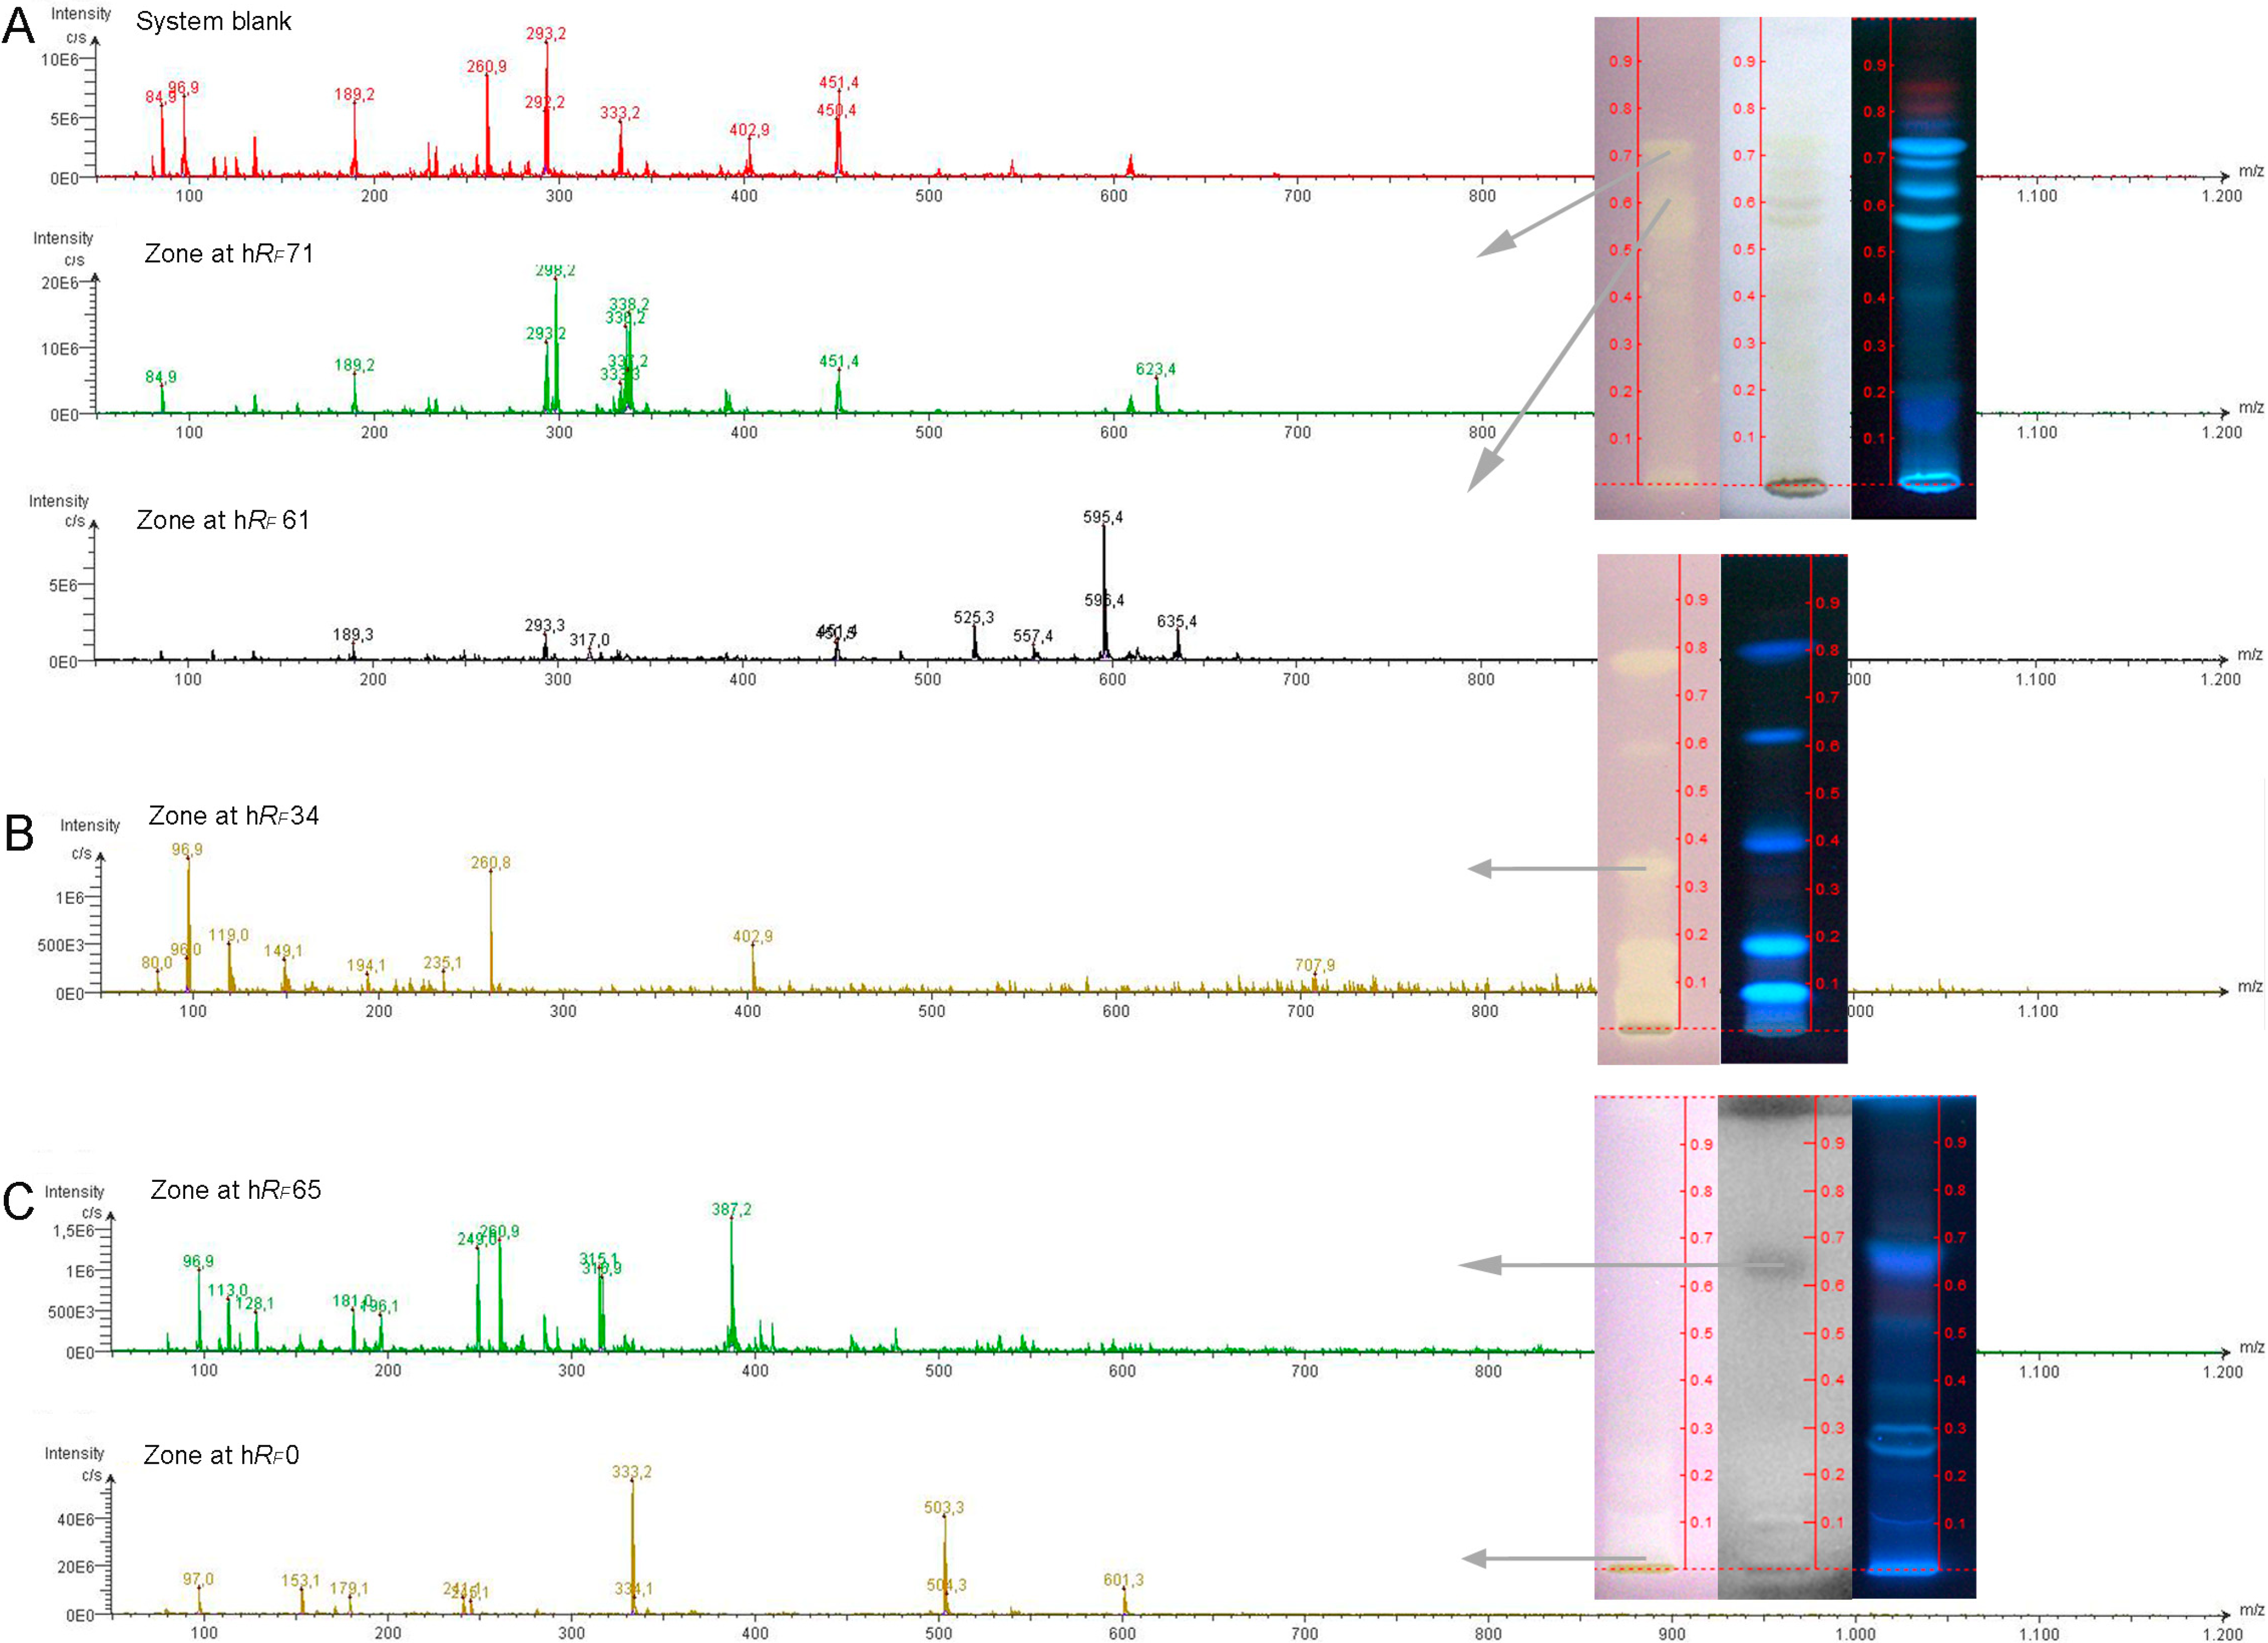
Exemplarily, effective compound zones were further characterized by ESI-MS to demonstrate this option for hyphenation, although a high-resolution mass spectrometer (HRMS) was not available. Recently introduced MS-grade plates, supposed to be more pure and to generate less plate background signals [38], were employed for this purpose. Nevertheless, a plate background at a migration position comparable to the analyte zone was subtracted from the analyte spectrum to obtain clear analyte signals. The blank elution (system background, Figure 4A) comprised the background signals from the plate, solvent and instrumentation. The MS-grade layer material used was comparable in the separation performance, although a minor shift of the hRF values was observed (Figure 3 #1’ versus #1) and had to be considered when positioning the elution head of the TLC-MS Interface onto the bioactive zone of interest.
DPPH˙ scavenging compounds are often of a phenolic nature and the negative ion mode was selected for ionization. The recorded ESI− mass spectrum of the active zone at hRF 61 (hRF 57 on MS grade plate) of hemp seed cake extract revealed clear mass signals after plate background subtraction (Figure 4A). The base peak at m/z 595.4 [M−2H]− could correspond to the anthocyanin delphinidin-3-O-(2''-O-beta-xylopyranosyl-beta-glucopyranoside), also named delphinidin-3-sambubioside, cannabi-nin and hibiscin. It is known as a resin compound in hemp seed cake that possesses antioxidant and antimicrobial activities [39]. In dependence of the acidic mobile phase used, this active zone was slightly bluish-green in color in the chromatogram under white light illumination, underlying the assumption to be an anthocyanin (Figure 4A). Future recordings with a HRMS have to confirm these initial steps of a characterization. Also, optimized recordings in the positive ion mode could be used for anthocyanin confirmation via its aglycon signal after loss of the sugar moieties. Additionally, a selective derivatization reaction for sugars [40] can be used to confirm the sugar moieity or the hRF comparison with the reference compound. The ion at m/z 635.4 could be assigned to be a caffeic acid derivative [41], as this active zone showed a native blue fluorescence in the chromatogram illuminated at UV 366 nm (Figure 3, A1 and Figure 4A). However, the mass spectrum does not show the caffeic acid signal itself. For the active zone at hRF 71, a dominant ion signals at m/z 298.2, an ion pattern at 336.2/338.2 and another ion signal at m/z 623.4 were observed in the mass spectrum recorded. Exemplarily for the canola seed cake extract, the active compound at hRF 34 showed a basepeak at m/z 96.9 and a further dominant mass signal at m/z 260.8 and a minor one at m/z 402.9 (Figure 4B). The zone at hRF 65 of flax seed cake extract, corresponding to a moderate antimicrobial Aliivibrio fischeri activity, showed a mass signal at m/z 387.2 (Figure 4C). The strong DPPH˙ scavenging and AChE inhibiting zone, remaining at hRF 0, showed a dominant ion at m/z 503.3 [M−H]− and a further one at m/z at 333.2.
With regard to the search for unknowns, these initial HPTLC-MS recordings using a single quadrupole MS are limited in the information content and clearly pointed out that HRMS is essential to proceed and to obtain the sum formulae of the effective compounds. Together with the use of selective derivatizations for confirmation of the functional groups indicated and the polarity information via the hRF value obtained, an assignment is more successful then.

Figure 4.
HPTLC-ESI-MS hyphenation exemplarily shown for further characterization of some effective zones in seed cake extracts of hemp (A, 30 µL; tracks after DPPH˙ assay, under white light and at UV 366 nm illumination), canola (B, 5 µL; tracks after DPPH˙ assay and at UV 366 nm illumination) and flax (C, 30 µL; tracks after DPPH˙ assay, after Aliivibrio fischeri bioassay and at UV 366 nm illumination).
4. Conclusions
A wealth of information was obtained by the streamlined effect-directed analysis using HPTLC-UV/Vis/FLD-(bio)assays/MS. Many effective compounds were detected in the seed cake extracts of hemp, canola and flax that exert distinct bioactivities, which underline its use for feeding. For example, estrogenic, radical scavenging, antimicrobial, and acetylcholinesterase inhibiting properties were detected in the seed cake extracts. Mostly, canola seed cake extract showed the strongest effect, if compared to hemp and flax seed cake extracts. Using this hyphenated method, all compounds are discovered, which show the selected effect. Thus, it has to be kept in mind that also effective contaminants or effective residues are detected, and not only effective phytochemicals natively present. Effect-directed detection was simply performed for all samples in parallel by immersion of the developed HPTLC plate in the particular assays. Mostly, after reaction with a substrate, effective zones were detected through a color change against the background. Subsequent targeted HPTLC-ESI-MS of selected effective zones was demonstrated to be able to further characterize the effective compounds of interest. However, these initial investigations using a single quadrupole MS require further recordings with a HRMS, which was not available in this study. HPTLC-HRMS is crucial to obtain the sum formulae of the effective compounds. This hyphenation and also the combination of HPTLC with other structure-elucidating techniques [43] is focus of future research.
Acknowledgments
We thank the DAAD Research Grants for Doctoral Candidates, Young Academics and Scientists for the research stay at Justus Liebig University (JLU) Giessen, Germany; to the coworkers in the Food Science group at JLU Giessen with regard to the assistance for bioassays and MS recording; to John Birch and Alaadin Bekhit from Department of Food Science, University of Otago, Dunedin, New Zealand, for supervision of parts of the sample preparation; to Merck, Darmstadt, Germany, for supply of plates, to CAMAG, Muttenz, Switzerland, for instrumentation; and Alan Carne from Biochemistry Department, University of Otago, Dunedin, New Zealand, being on board as a PhD supervisor of SST.
Author Contributions
The outline of the experiments, results and discussion were of both authors’ effort. The experiments were carried out by SST under supervision of GEM. The first paper version was prepared by SST, substantially revised by GEM.
Conflicts of Interest
The authors declare no conflict of interest.
References
- USDA GAIN: India Oilseeds and Products Annual 2013. Available online: http://www.thecropsite.com/reports/?id=1882 (accessed on 6 October 2014).
- Rabetafika, H.N.; Van Remoortel, V.; Danthine, S.; Paquot, M.; Blecker, C. Flaxseed proteins: Food uses and health benefits. Int. J. Food Sci. Tech. 2011, 46, 221–228. [Google Scholar] [CrossRef]
- Johnson, R. CRS Report for Congress: Hemp as an Agricultural Commodity (2013). Available online: http://fas.org/sgp/crs/misc/RL32725.pdf (accessed on 6 October 2014).
- FAO, Food Outlook Global Market Analysis Report (2012). Available online: http://www.fao.org/docrep/016/al993e/al993e00.pdf (accessed on 6 October 2014).
- Hessle, A.; Eriksson, M.; Nadeau, E.; Turner, T.; Johansson, B. Cold-pressed hempseed cake as a protein feed for growing cattle. Agr. Scand. A - Animal Sci. 2008, 58, 136–145. [Google Scholar]
- Lunger, A.N.; McLean, E.; Gaylord, T.G.; Kuhn, D.; Craig, S.R. Taurine supplementation to alternative dietary proteins used in fish meal replacement enhances growth of juvenile cobia (Rachycentron canadum). Aquaculture 2007, 271, 401–410. [Google Scholar] [CrossRef]
- Terpinc, P.; Čeh, B.; Ulrih, N.P.; Abramovič, H. Studies of the correlation between antioxidant properties and the total phenolic content of different oil cake extracts. Ind. Crop Prod. 2012, 39, 210–217. [Google Scholar] [CrossRef]
- Teh, S.S.; Birch, E.J. Effect of ultrasonic treatment on the polyphenol content and antioxidant capacity of extract from defatted hemp, flax and canola seed cakes. Ultrason. Sonochem. 2014, 21, 346–353. [Google Scholar] [CrossRef] [PubMed]
- Frankel, E.N.; Waterhouse, A.L.; Teissedre, P.L. Principal phenolic phytochemicals in selected California wines and their antioxidant activity in inhibiting oxidation of human low-density lipoproteins. J. Agric. Food Chem. 1995, 43, 890–894. [Google Scholar] [CrossRef]
- Skórkowska-Telichowska, K.; Zuk, M.; Kulma, A.; Bugajska-Prusak, A.; Gąsiorowski, K.; Kostyn, K.; Szopa, J. New dressing materials derived from transgenic flax products to treat long-standing venous ulcers—A pilot study. Wound Repair Regen. 2010, 18, 168–179. [Google Scholar] [CrossRef] [PubMed]
- Żuk, M.; Dymińska, L.; Kulma, A.; Boba, A.; Prescha, A.; Szopa, J.; Mączka, M.; Zając, A.; Szołtysek, K.; Hanuza, J. IR and Raman studies of oil and seedcake extracts from natural and genetically modified flax seeds. Spec. Acta A–Mol. Biomol. Spec. 2011, 78, 1080–1089. [Google Scholar] [CrossRef]
- Cheng, Z.; Wu, T. TLC bioautography: High throughput technique for screening of bioactive natural products. Comb. Chem. High Throughput Screen. 2013, 16, 531–549. [Google Scholar] [CrossRef] [PubMed]
- Krüger, S.; Urmann, O.; Morlock, G.E. Development of a planar chromatographic method for quantitation of anthocyanes in pomace, feed, juice and wine. J. Chromatogr. A 2013, 1289, 105–118. [Google Scholar] [CrossRef] [PubMed]
- Cretu, G.; Morlock, G.E. Analysis of anthocyanins in powdered berry extracts by planar chromatography linked with bioassay and mass spectrometry. Food Chem. 2014, 1, 104–112. [Google Scholar] [CrossRef]
- Das, B.; Paul, T.; Apte, K.G.; Chauhan, R.; Saxen, R.C. Evaluation of antioxidant potential & quantification of polyphenols of Diplazium esculentum Retz. with emphasis on its HPTLC chromatography. J. Pharm. Res. 2013, 6, 93–100. [Google Scholar] [CrossRef]
- Varghese, S.; Narmadha, R.; Gomathi, D.; Kalaiselvi, M.; Devaki, K. Phytochemical screening and HPTLC finger printing analysis of Citrullus lanatus (Thunb.) seed. J. Acute Disease 2013, 2, 122–126. [Google Scholar] [CrossRef]
- Riffaulta, L.; Destandaua, E.; Pasquierb, L.; Andréb, P.; Elfakir, C. Phytochemical analysis of Rosa hybrida cv. ‘Jardin de Granville’ by HPTLC, HPLC-DAD and HPLC-ESI-HRMS: Polyphenolic fingerprints of six plant organs. Phytochemistry 2014, 99, 127–134. [Google Scholar] [CrossRef] [PubMed]
- McDonnell, D.P.; Nawaz, Z.; Densmore, C.; Weigel, N.L.; Pham, T.A.; Clark, J.H.; O’Malley, B.W. High level expression of biologically active estrogen receptor in Saccharomyces cerevisiae. J. Steroid Biochem. Mol. Biol. 1991, 39, 291–297. [Google Scholar] [CrossRef] [PubMed]
- Klingelhöfer, I.; Morlock, G.E. Sharp-bounded zones link to the effect in planar chromatography-bioassay-mass spectrometry. J. Chromatogr. A 2014, 1360, 288–295. [Google Scholar] [CrossRef] [PubMed]
- International Organization for Standardization, ISO 11348-1, Water quality –Determination of the inhibitory effect of water samples on the light emission of Vibrio fischeri (Luminescent bacteria test) – Part 1: Method using freshly prepared bacteria. Geneva, Switzerland, 2007.
- Hage, S.; Morlock, G.E. Book of Abstracts P-64 “HPTLC Hyphenated with Bioassays for the Screening of Bioactive Constituents of Serbian Salicaceae bud Extracts”; International Symposium for HPTLC 2014, Lyon, poster contribution; 2014. [Google Scholar]
- Akkad, R.; Schwack, W. Determination of organophosphorus and carbamate insecticides in fresh fruits and vegetables by high-performance thin-layer chromatography-multienzyme inhibition assay. J. AOAC Int. 2012, 95, 1371–1377. [Google Scholar] [CrossRef] [PubMed]
- Jamshidi-Aidij, M.; Morlock, G.E. Book of abstracts P-55 “Fast HPTLC‐direct bioautography using Bacillus subtilis for screening of antimicrobial components in plant extracts”; International Symposium for HPTLC 2014, Lyon, poster contribution; 2014. [Google Scholar]
- Morlock, G.E.; Klingelhöfer, I. Liquid Chromatography-Bioassay-Mass Spectrometry for Profiling of Physiologically Active Food. Anal. Chem. 2014, 86, 8289–8295. [Google Scholar] [CrossRef] [PubMed]
- Morlock, G.; Scholl, I.; Kunz, N.; Schroeder, A. Planar-chromatographic fingerprint of German propolis, CAMAG Bibliogr. Service 2013, 111, 13–15. [Google Scholar]
- Nair, V.P.; Hunter, J.M. Anticholinesterases and anticholinergic drugs. Contin. Educ. Anaesth. Crit. Care Pain. 2004, 4, 164–168. [Google Scholar] [CrossRef]
- Silva, D.; Chioua, M.; Samadi, A.; Agostinho, P.; Garção, P.; Lajarín-Cuesta, R.; de los Ríos, C.; Iriepa, I.; Moraleda, I.; Gonzalez-Lafuente, L.; et al. Synthesis, pharmacological assessment, and molecular modelling of acethycholinesterase/butyrylcholinesterase inhibitors: Effect against amyloid-β-induced neurotoxicity. ACS Chem. Neurosci. 2013, 4, 547–565. [Google Scholar] [CrossRef] [PubMed]
- Ramirez, A.; Gutierrez, R.; Diaz, G.; Gonzalez, C.; Perez, N.; Vega, S.; Noa, M. High-performance thin-layer chromatography -bioautography for multiple antibiotic residues in cow’s milk. J. Chromotogr. B 2003, 784, 315–322. [Google Scholar] [CrossRef]
- Knecht, B.G.; Strasser, A.; Dietrich, R.; Martlbauer, E.; Niessner, R.; Weller, M.G. Automated microarray system for the simultaneous detection of antibiotics in milk. Anal. Chem. 2004, 76, 646–654. [Google Scholar] [CrossRef] [PubMed]
- Cos, P.; De Bruyne, T.; Apers, S.; Vanden Berghe, D.; Pieters, L.; Vlietinck, A.J. Phytoestrogens: Recent developments. Planta Med. 2003, 69, 589–599. [Google Scholar] [CrossRef] [PubMed]
- Holbrook, R.D.; Novak, J.T.; Grizzard, T.J.; Love, N.G. Estrogen receptor agonist fate during wastewater and biosolids treatment processes: A mass balance analysis. Environ. Sci. Technol. 2002, 36, 4533–4539. [Google Scholar] [CrossRef]
- Buchinger, S.; Spira, D.; Bröder, K.; Schlüsener, M.; Ternes, T.; Reifferscheid, G. Direct coupling of thin-layer chromatography with a bioassay for the detection of estrogenic compounds: Applications for effect-directed analysis. Anal. Chem. 2013, 85, 7248–7256. [Google Scholar] [CrossRef] [PubMed]
- McLachlan, J.A. Environmental signaling: what embryos and evolution teach us about endocrine disrupting chemicals. Endocrine Rev. 2001, 22, 319–341. [Google Scholar] [CrossRef]
- Adlercreutz, H.; Mazur, W. Phyto-oestrogen and western diseases. Ann. Med. 1997, 29, 95–120. [Google Scholar] [CrossRef] [PubMed]
- Kurzer, M.S.; Hu, X. Dietary phytoestrogens. Ann. Rev. Nutri. 1997, 17, 353–381. [Google Scholar] [CrossRef]
- Bingham, S.A.; Atkinson, C.; Liggins, J.A. Phyto-oestrogens: Where are we now? Brit. J. Nutri. 1998, 79, 393–406. [Google Scholar] [CrossRef]
- Smeds, A.I.; Eklund, P.C.; Willför, S.M. Content, composition, and stereochemical characterisation of lignans in berries and seeds. Food Chem. 2012, 134, 1991–1998. [Google Scholar] [CrossRef] [PubMed]
- Morlock, G. Influence of the TLC/HPTLC plate and solvents on the background signals obtained in TLC/HPTLC-ESI-MS using the TLC-MS Interface. J. Liq. Chromatogr. Relat. Technol. 2014, 37, 2892–2914. [Google Scholar] [CrossRef]
- Matsuda, F.; Suzuki, F.; Sawada, Y. Database of RIKEN Plant Science Centre, Japan. 2009. Available online: http://www.massbank.jp/jsp/Result.jsp (accessed on 6 September 2014).
- Morlock, G.E.; Morlock, L.P.; Lemo, C. Streamlined analysis of lactose-free dairy products. J. Chromatogr. A 2014, 1324, 215–223. [Google Scholar] [CrossRef] [PubMed]
- Schütz, K.; Kammerer, D.R.; Carle, R.; Schieber, A. Characterization of phenolic acids and flavonoids in dandelion (Taraxacum officinale WEB. ex WIGG.) root and herb by high-performance liquid chromatography/electrospray ionization mass spectrometry. Rapid Commun. Mass Spectrom. 2005, 19, 179–186. [Google Scholar] [CrossRef] [PubMed]
- Shidoji, Y.; Ogawa, H. Natural occurrence of cancer-preventive geranylgeranoic acid in medicinal herbs. J. Lipid Res. 2004, 45, 1092–1103. [Google Scholar] [CrossRef] [PubMed]
- Morlock, G. Chromatography combined with bioassays and other hyphenations—The direct link to the compound indicating the effect. ACS Syposium Series 2013, 1185, 101–121. [Google Scholar]
© 2015 by the authors; licensee MDPI, Basel, Switzerland. This article is an open access article distributed under the terms and conditions of the Creative Commons Attribution license (http://creativecommons.org/licenses/by/4.0/).