
Deoxygenation Trends and Their Multivariate Association with Self-Reported Fatigue in Post-COVID Syndrome

 ,
,  ,
, 
Abstract
1. Introduction
2. Materials and Methods
2.1. Patients
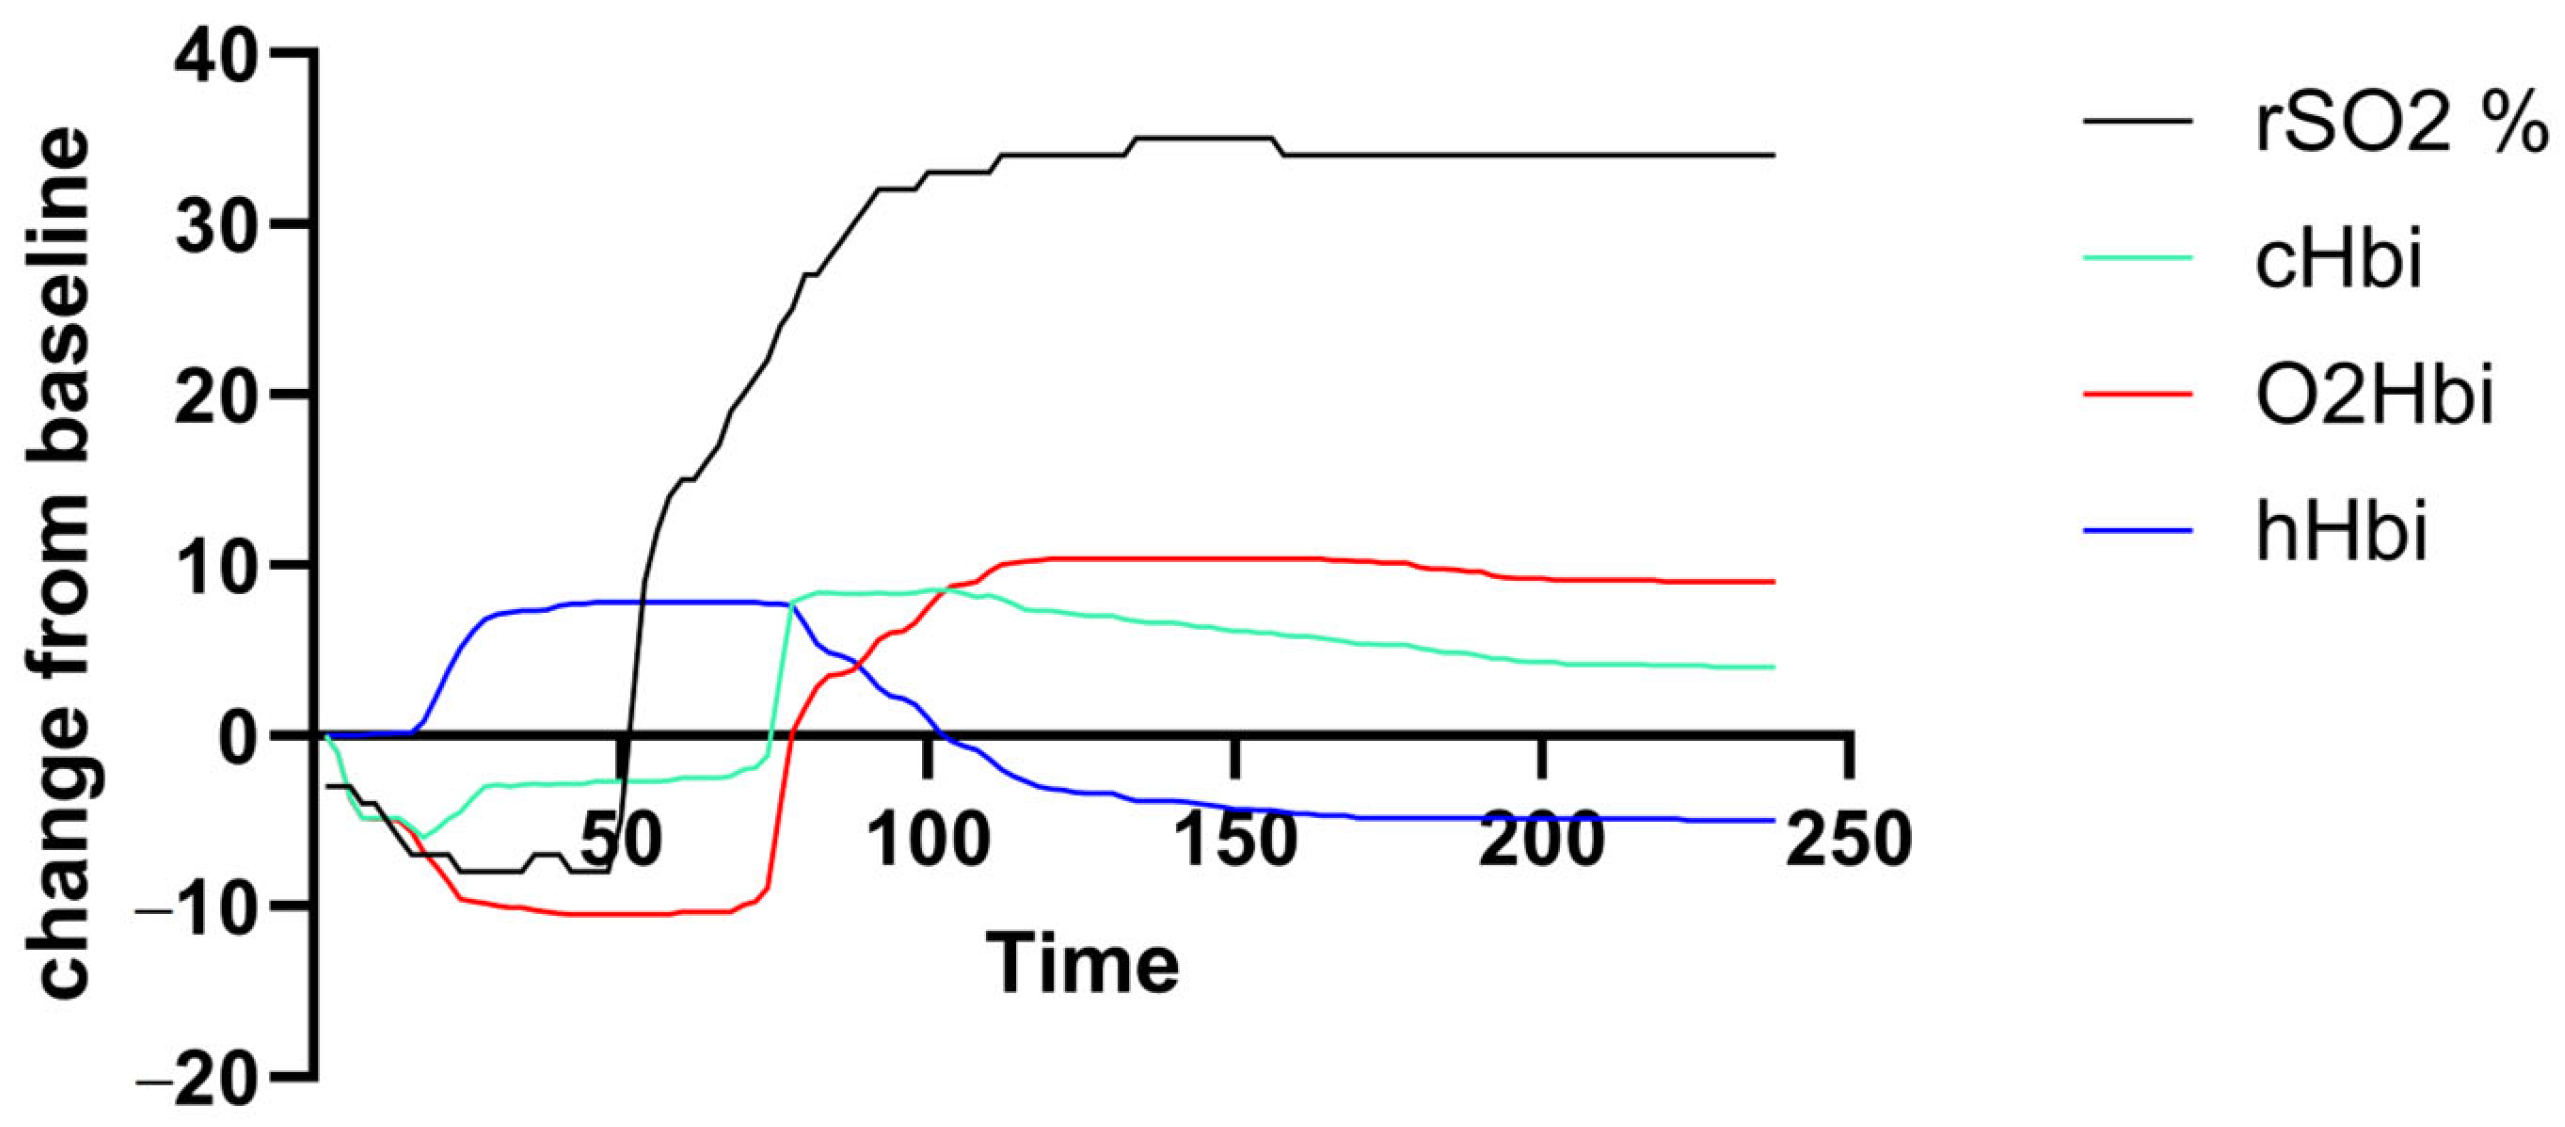
2.2. NIRS
2.3. Statistical Analysis
3. Results
3.1. Demographics and Self-Reported Fatigue
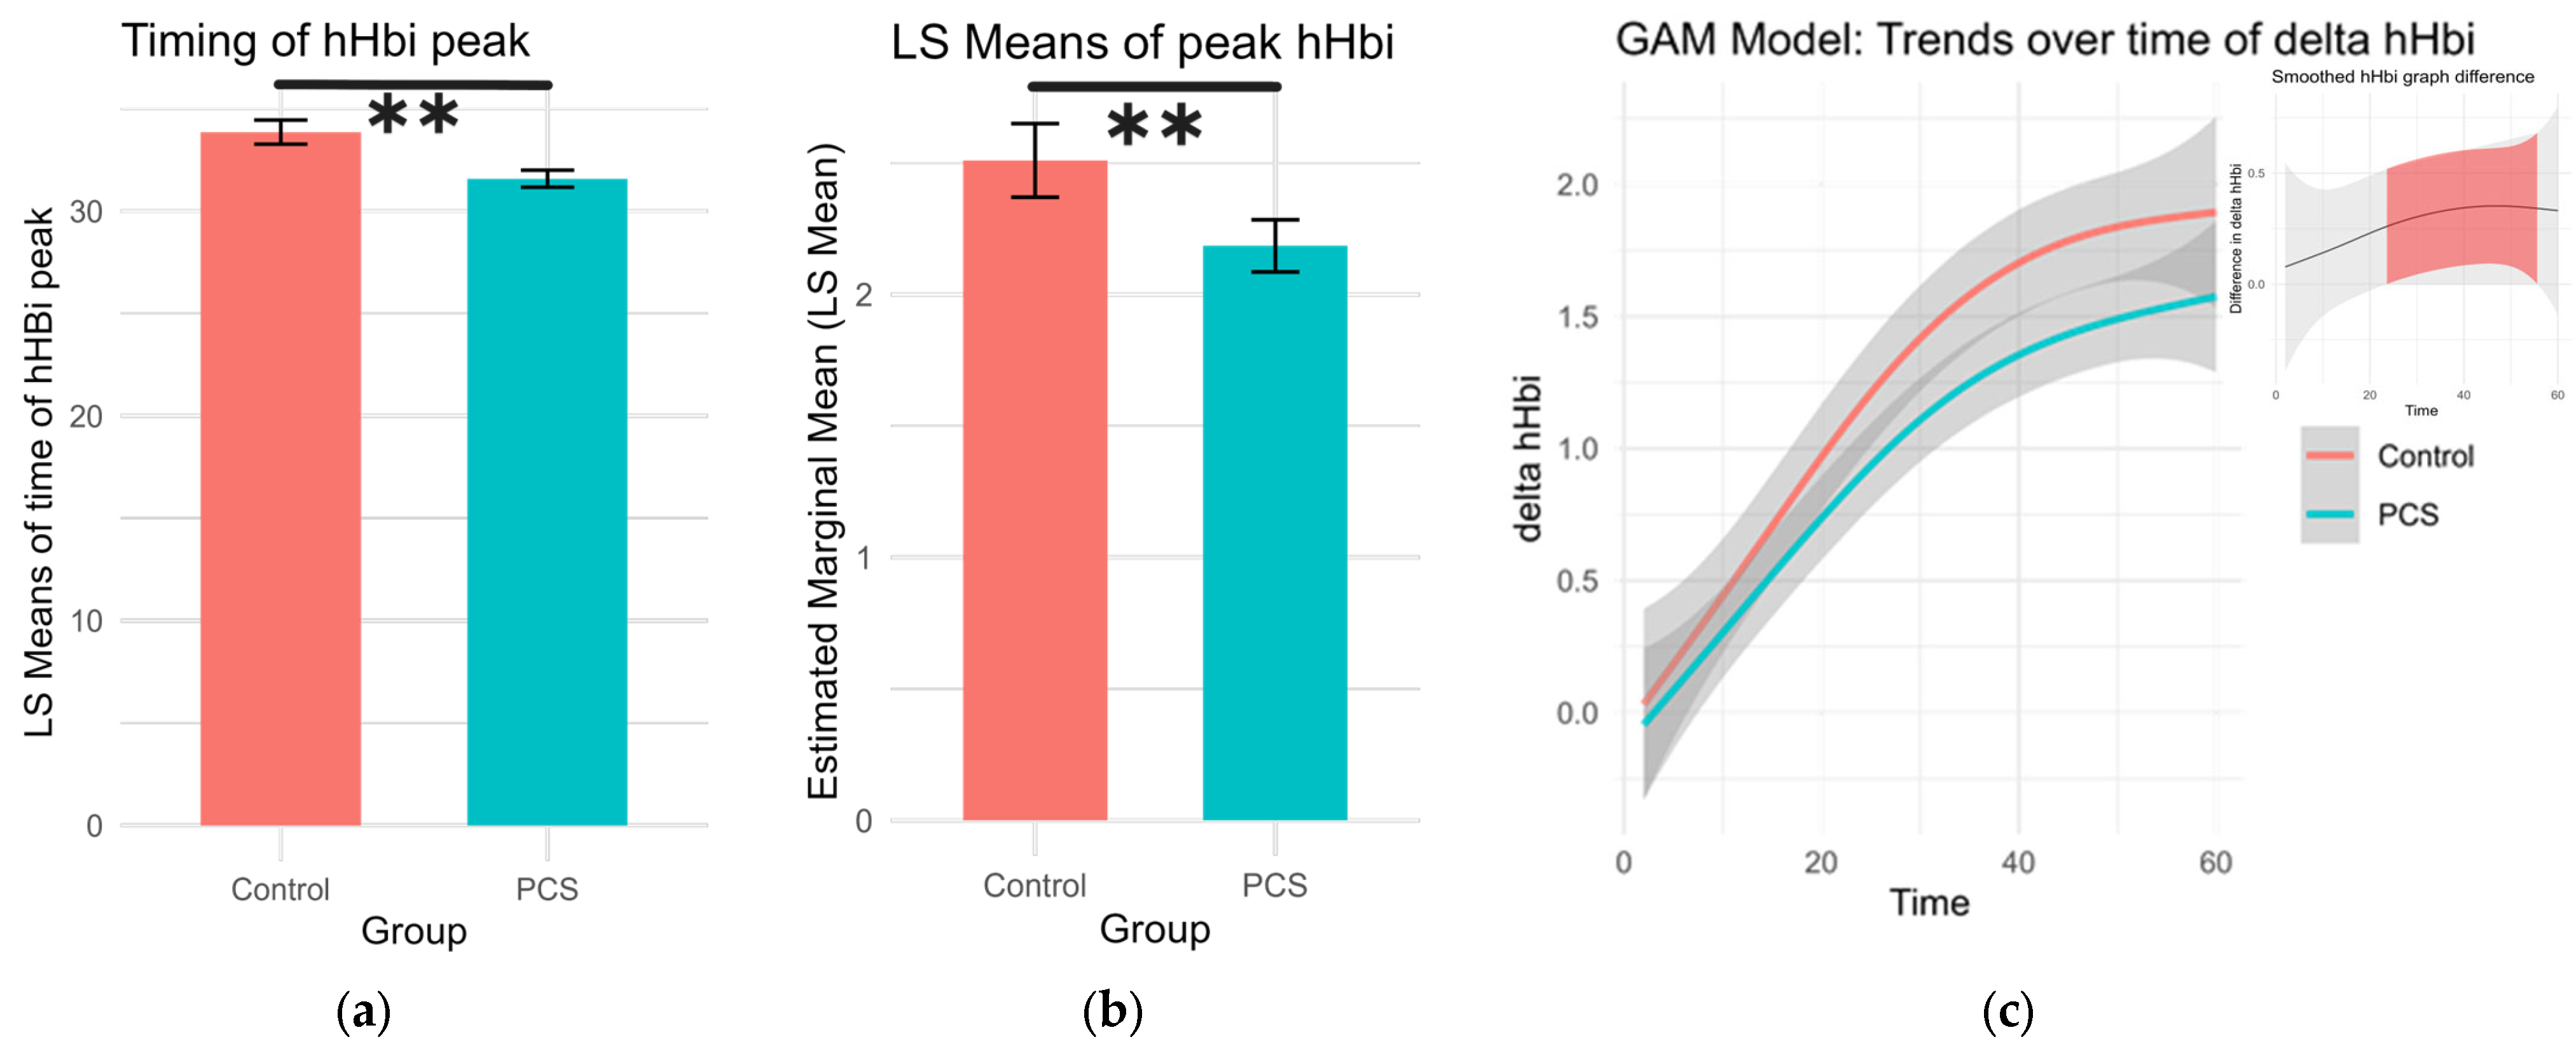
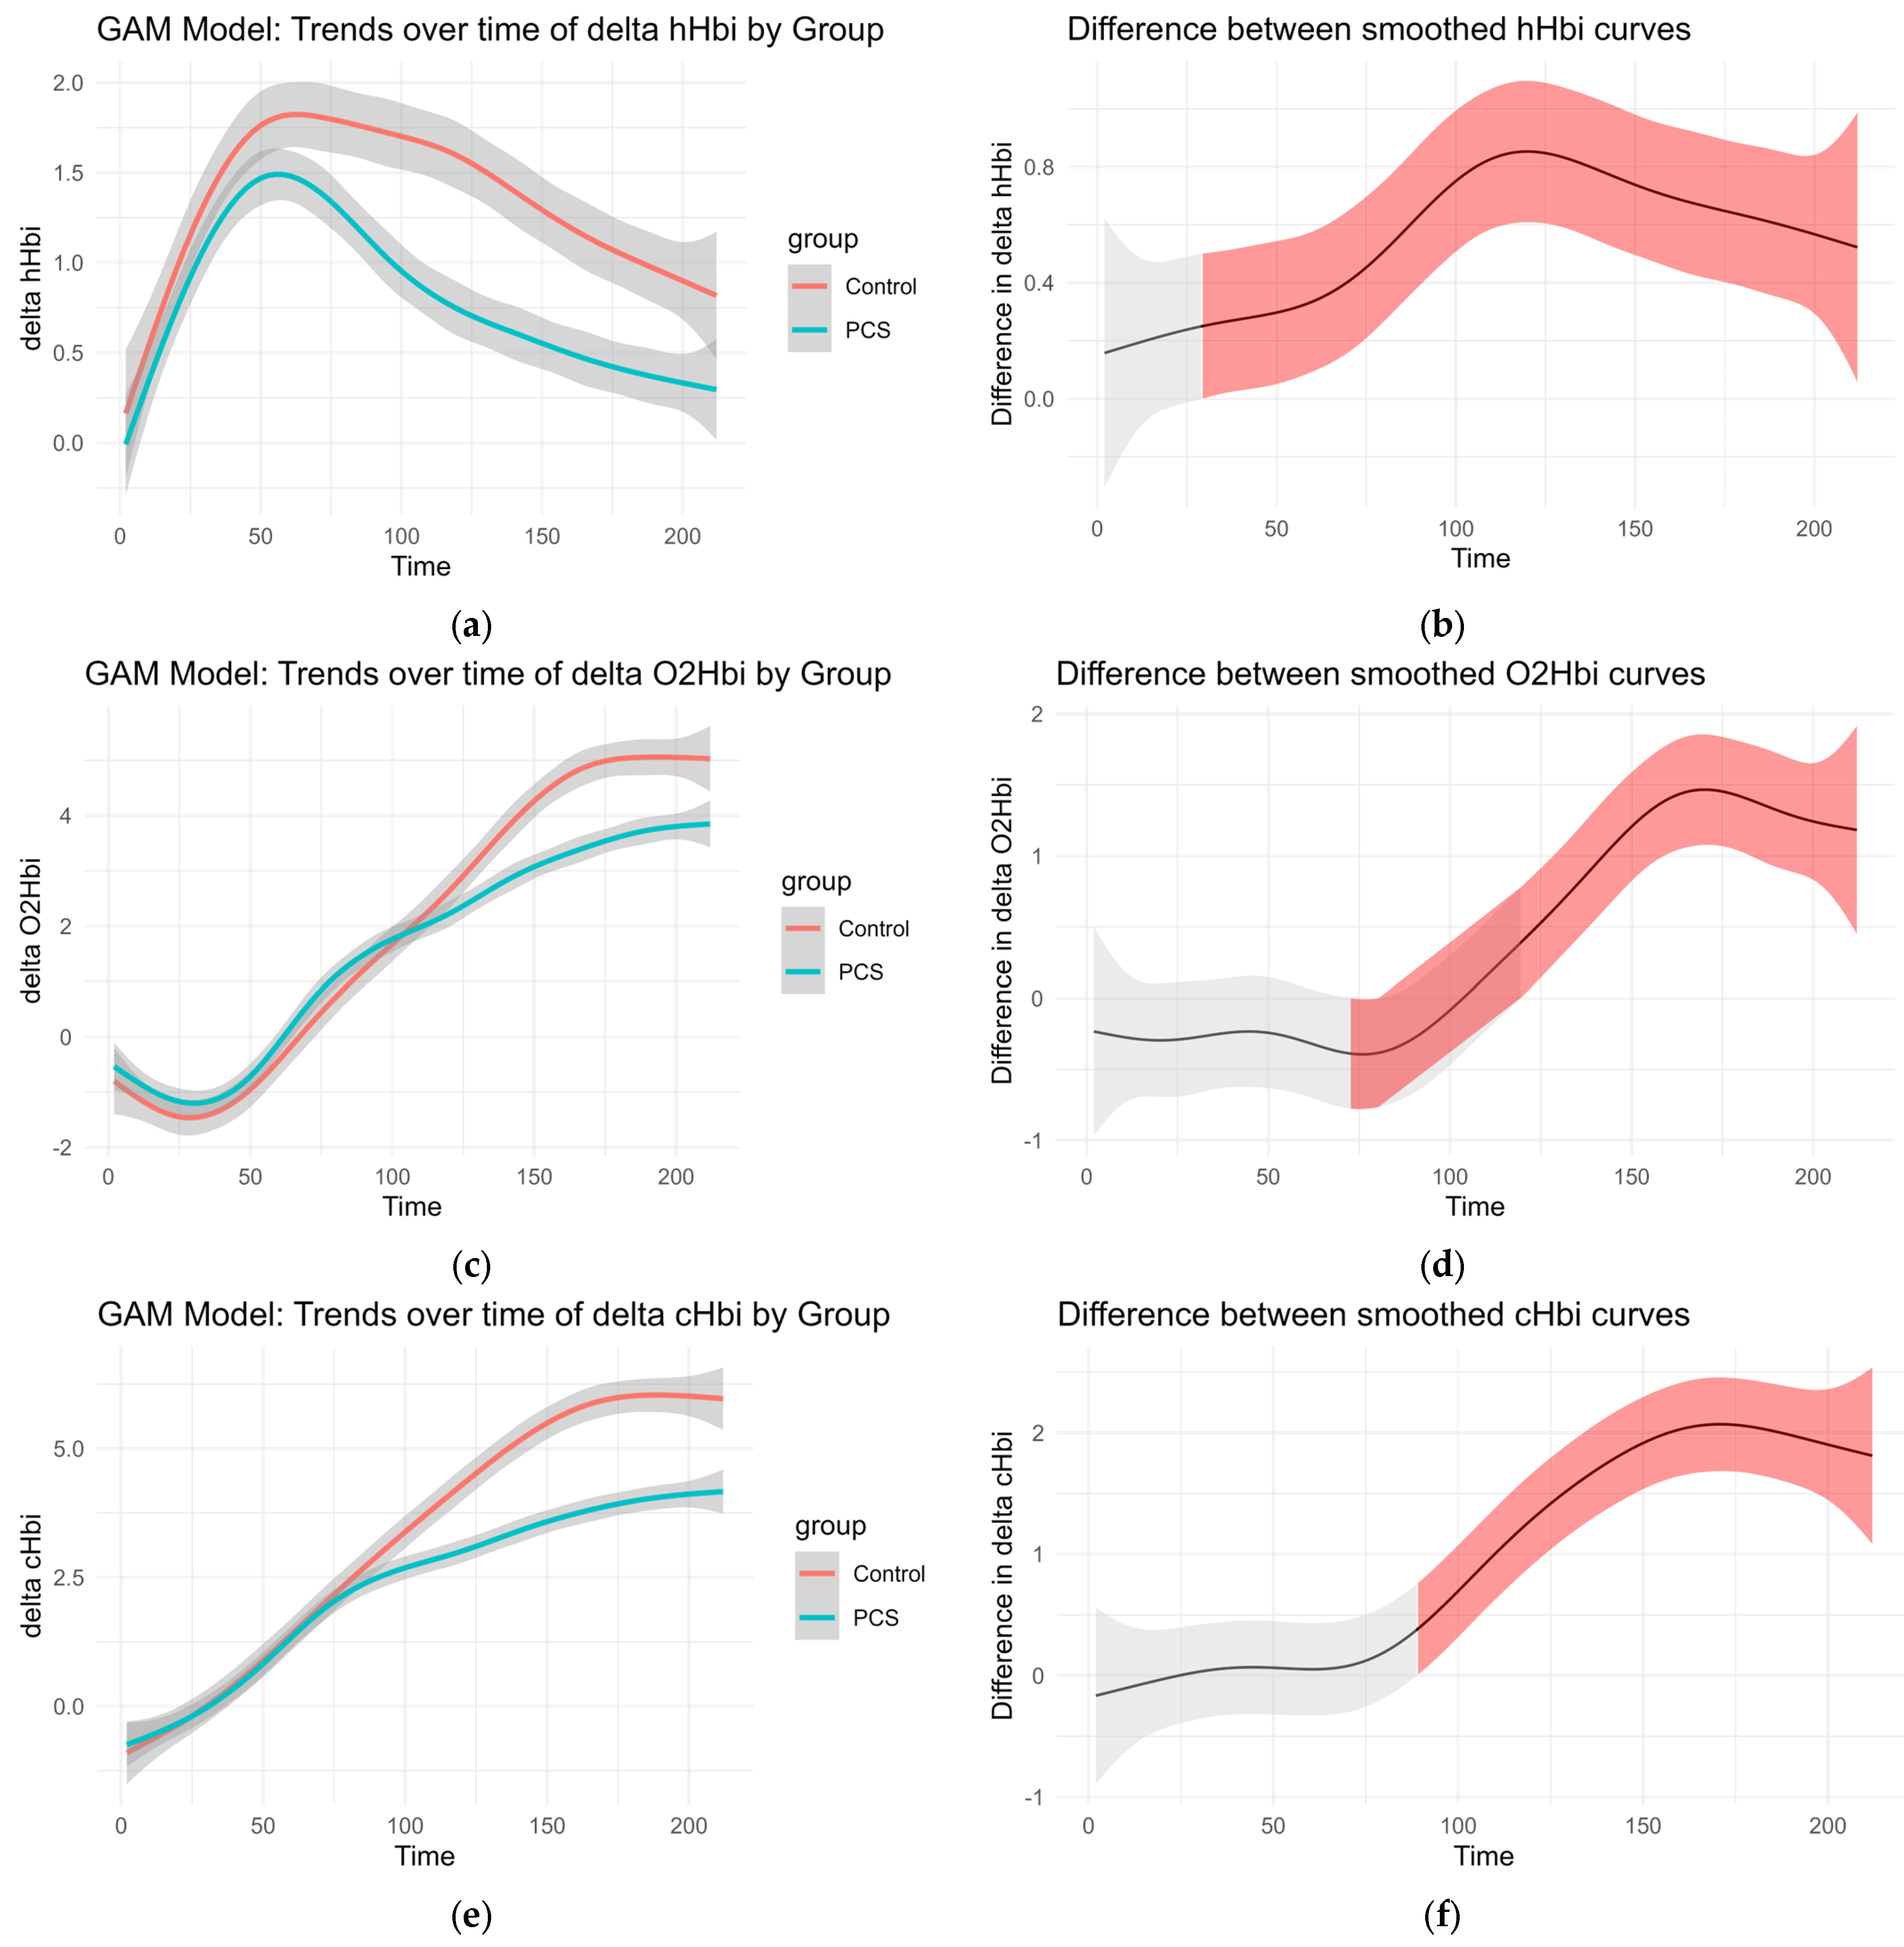
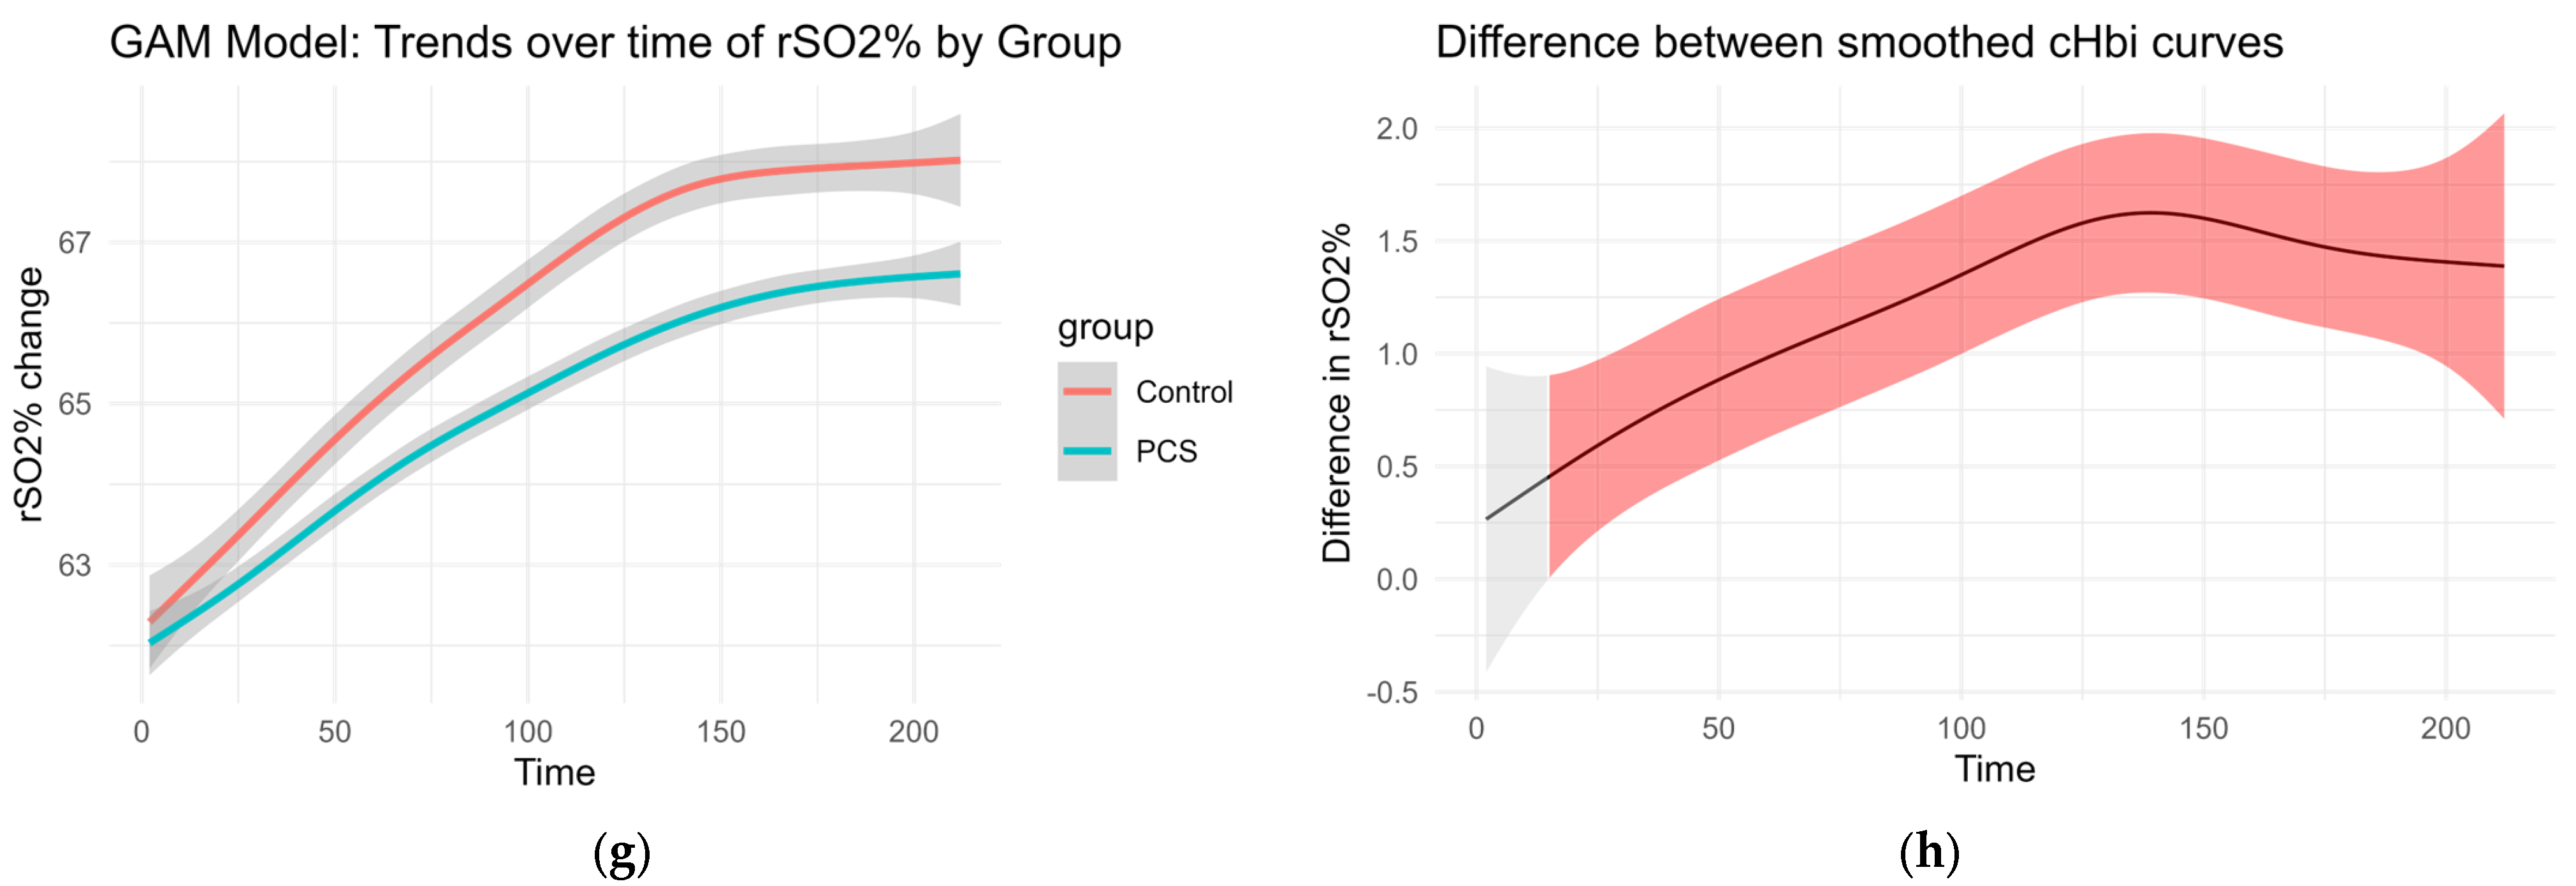
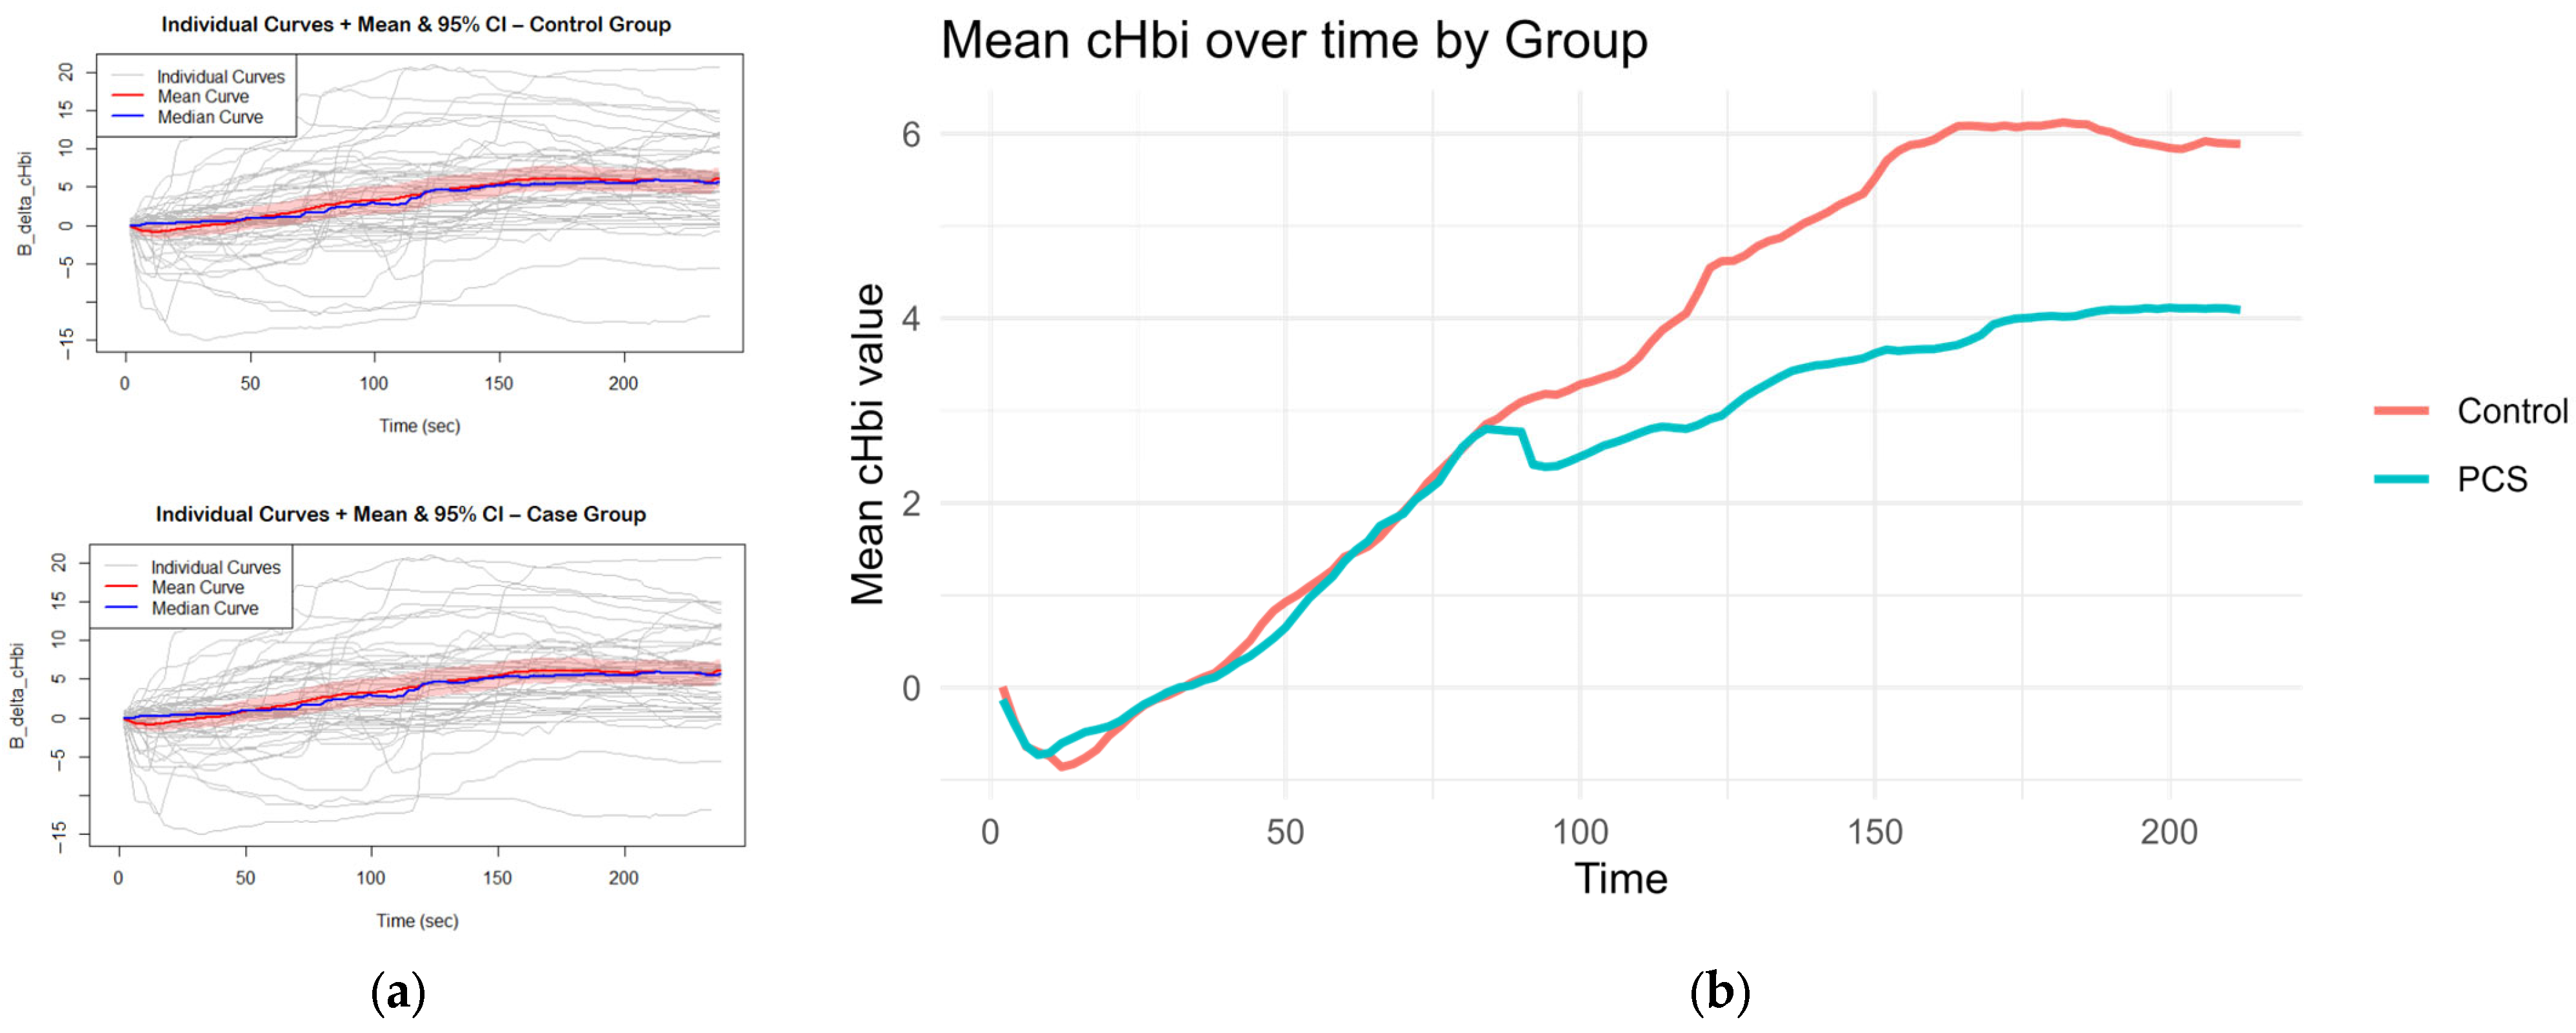
3.2. Oxygenation Changes
3.3. Multivariate Association Between Self-Reported Fatigue Scores and Masimo-Derived Oxygenation Metrics
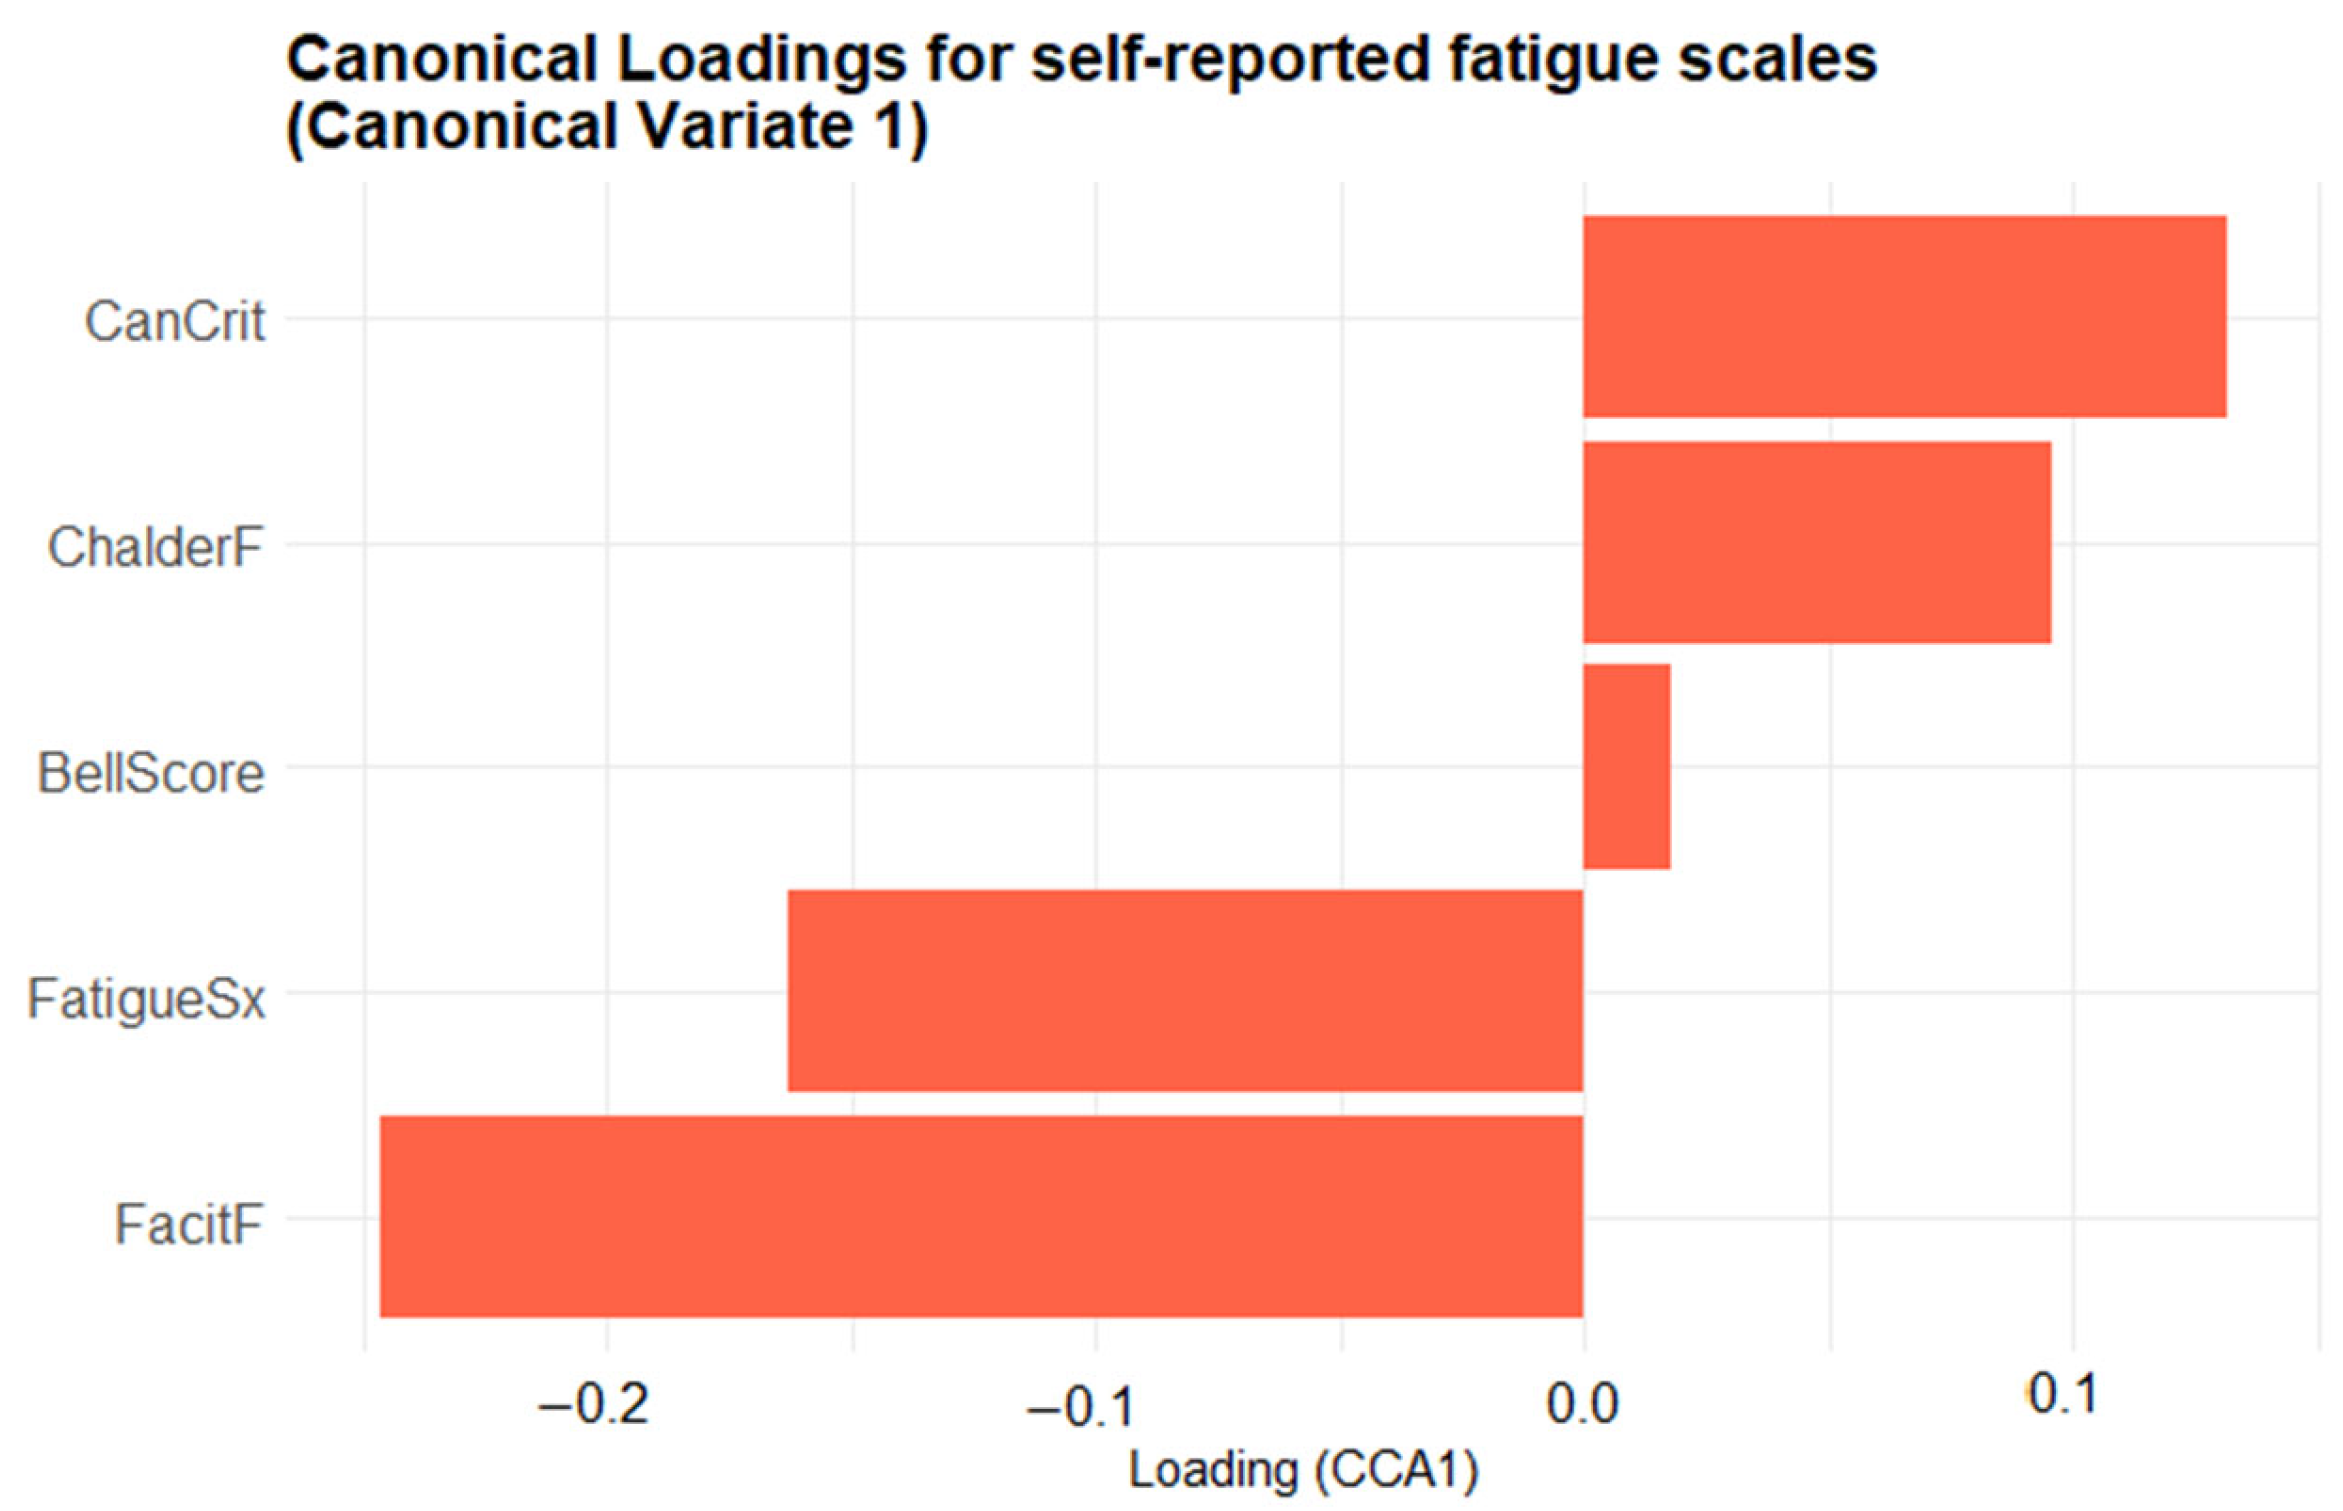
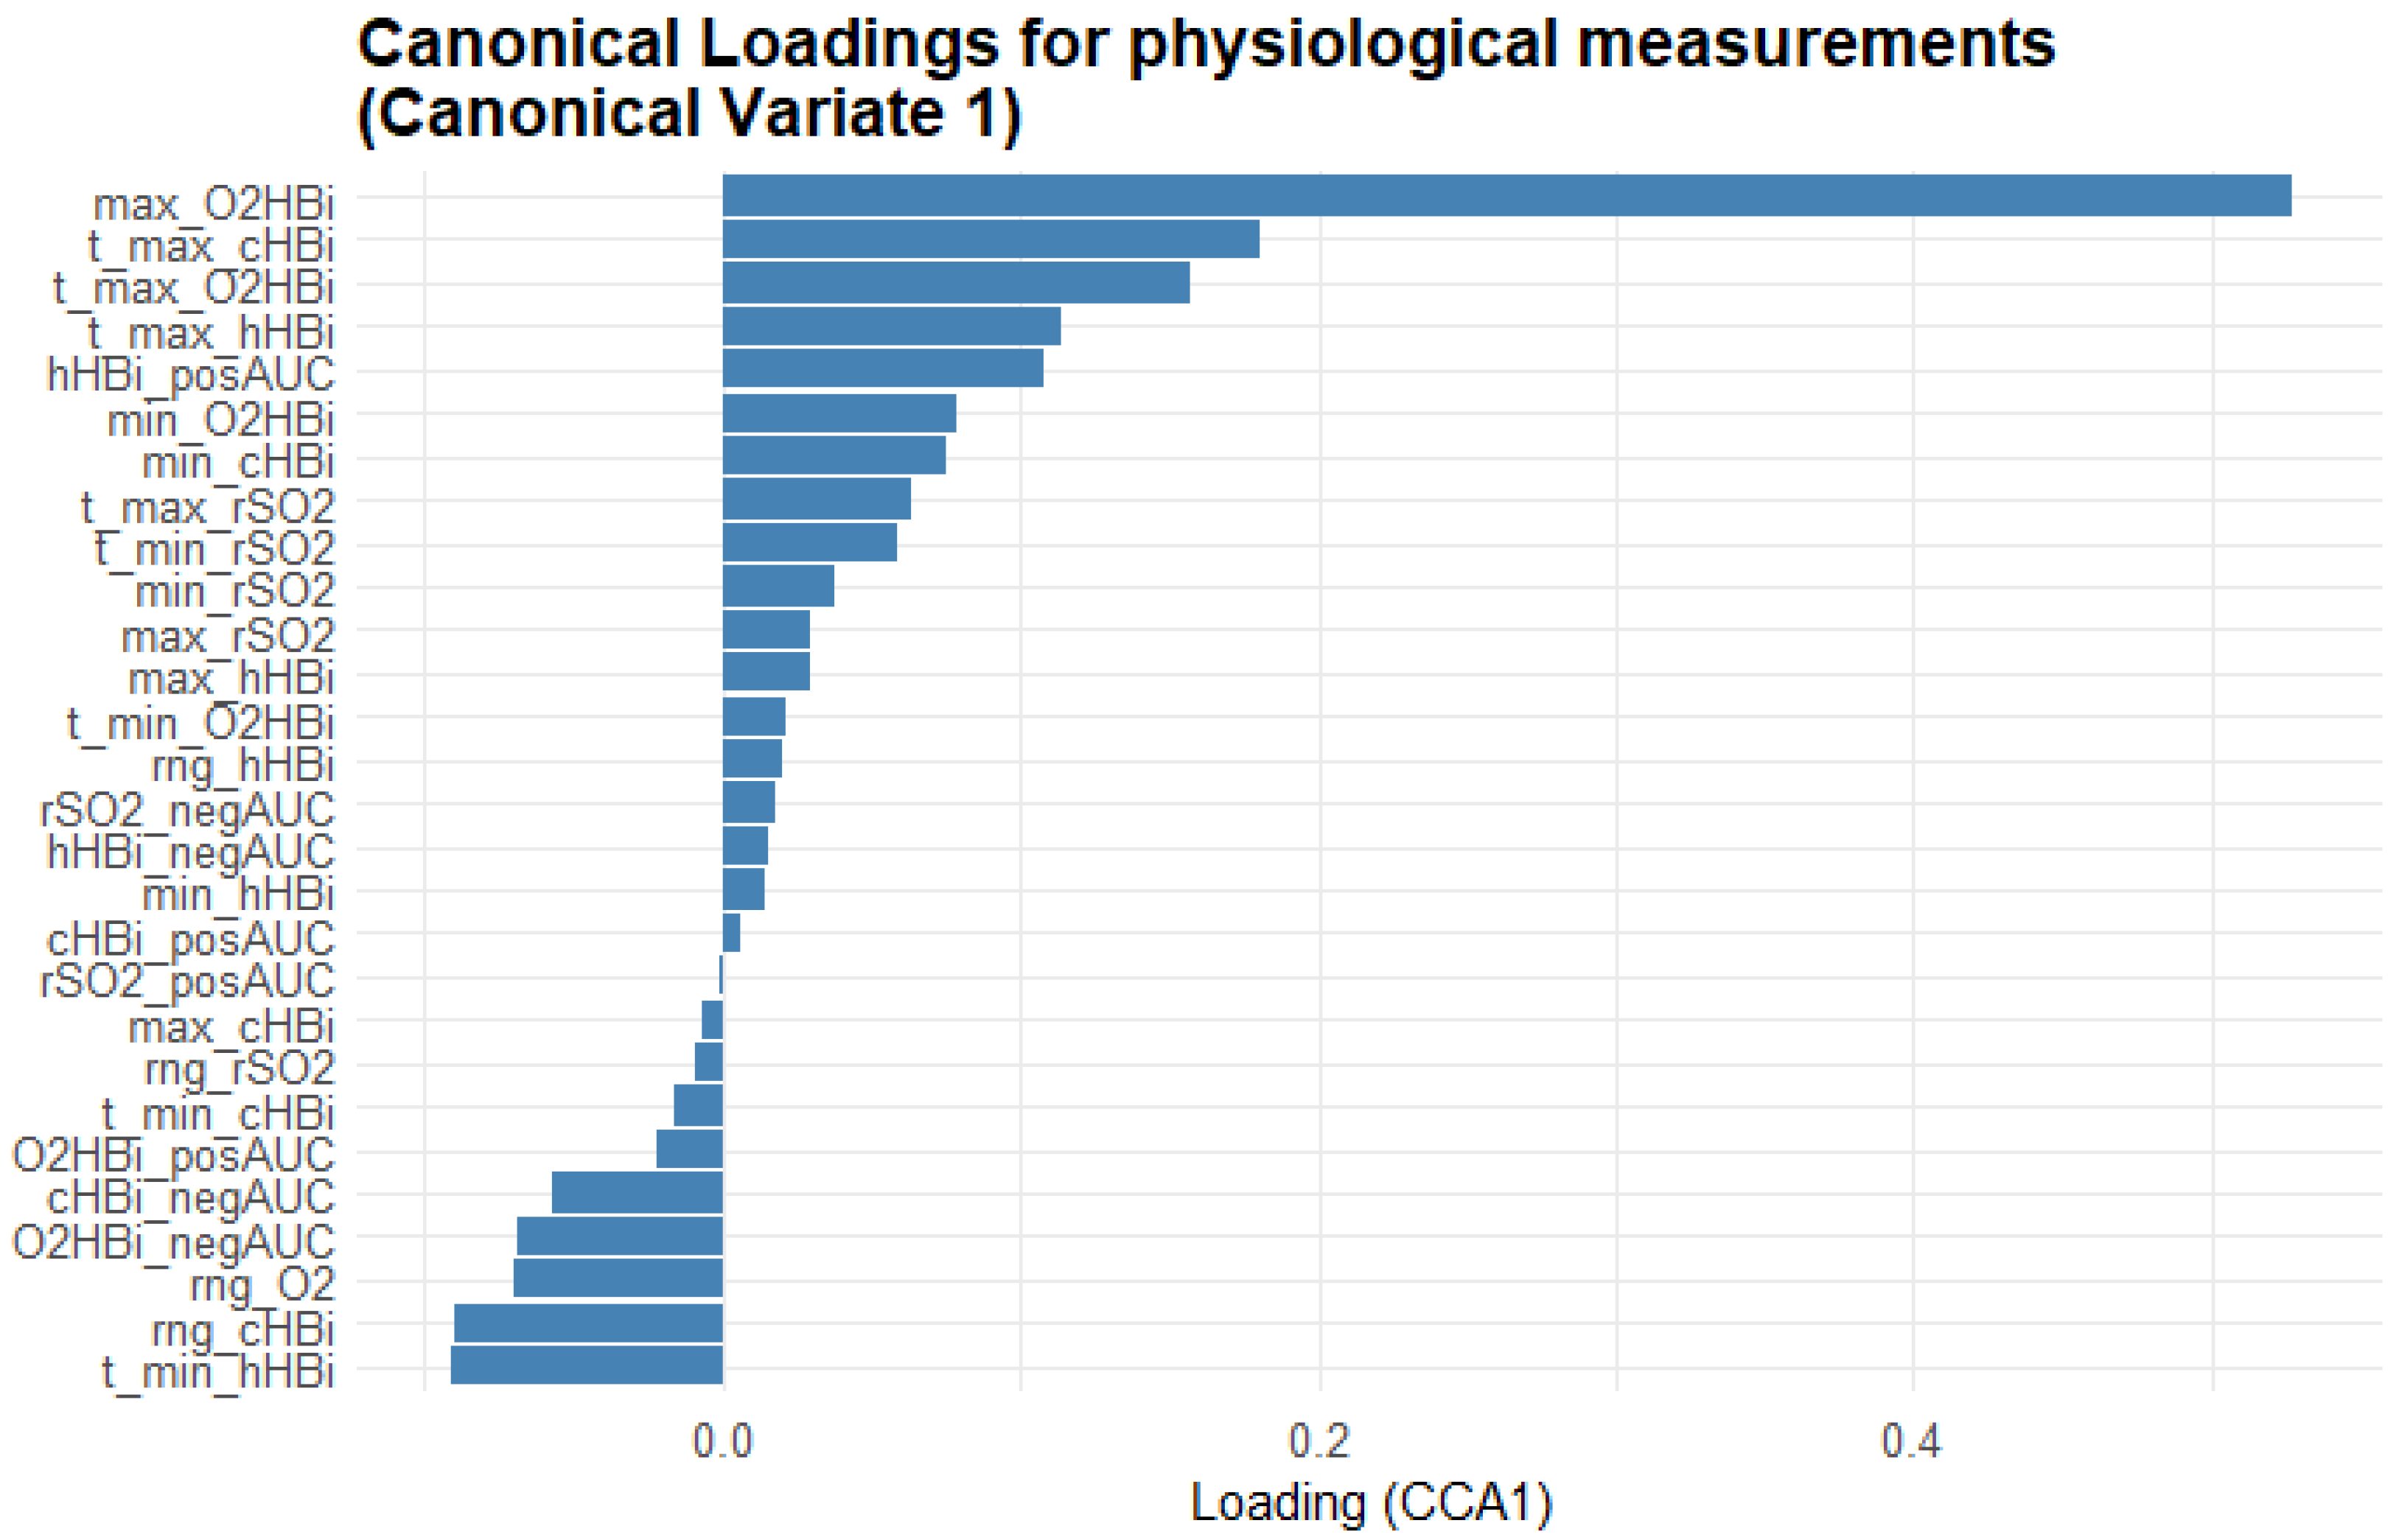
3.3.1. First Canonical Dimension
3.3.2. Second Canonical Dimension
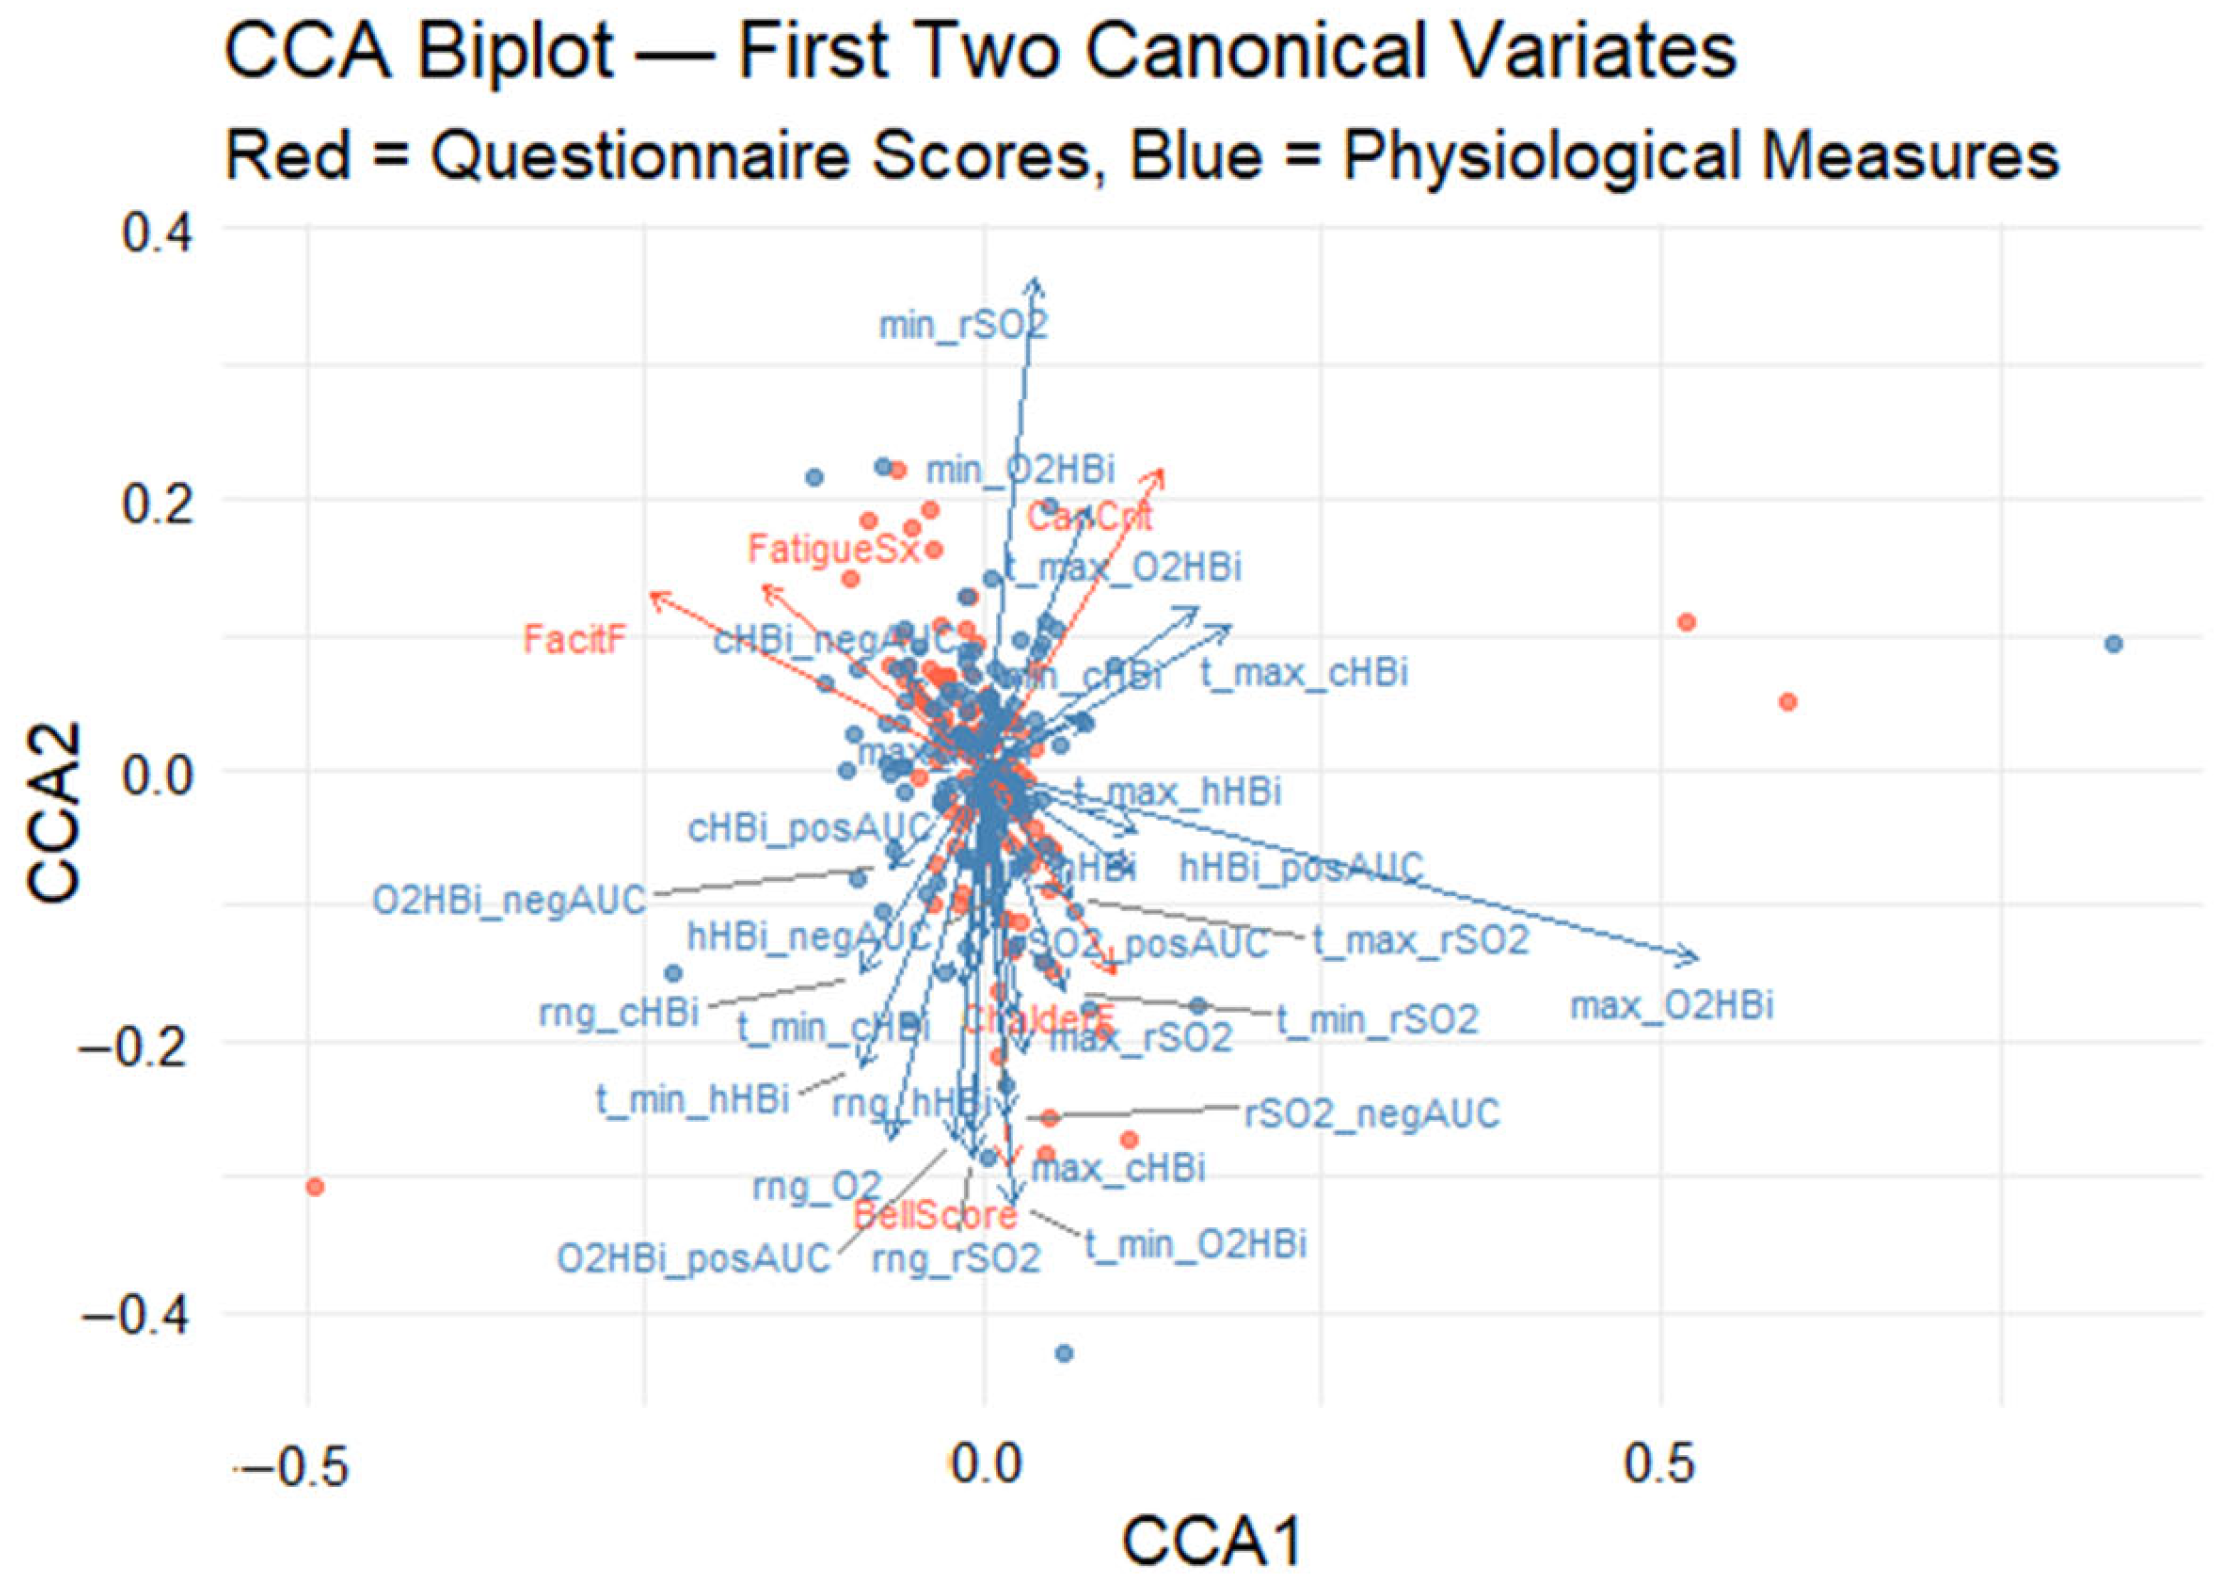
3.3.3. Canonical Correlation Analysis Biplot
4. Discussion
5. Conclusions
Author Contributions
Funding
Institutional Review Board Statement
Informed Consent Statement
Data Availability Statement
Conflicts of Interest
Abbreviations
| PCS | Post-COVID-Syndrome |
| PEM | Post-exertional malaise |
| NIRS | Near-infrared regional spectroscopy |
| LC | Long COVID |
| CF | Chronic fatigue |
| GPCR-fAAb | Functional autoantibodies targeting G-protein coupled receptors |
| Hb | Hemoglobin |
| Mb | Myoglobin |
| PCR | Polymerase chain reaction |
| ME/CFS | Myalgic Encephalomyelitis/Chronic Fatigue Syndrome |
| LFT | Lung function test |
| LVEF | Left ventricular ejection fraction |
| Delta O2Hbi | Change in oxygenated hemoglobin/myoglobin |
| Delta hHbi | Change in deoxygenated hemoglobin/myoglobin |
| Delta cHbi | Total change in hemoglobin/myoglobin |
| rSO2 | Regional oxygen saturation |
| GAM | Generalized additive model |
| CCA | Canonical Correlation Analysis |
| AUC | Area under the curves |
| rSO2_posAUC | Positive area under the curve of regional oxygen saturation |
| rSO2_negAUC | Negative area under the curve of regional oxygen saturation |
| t_min_rSO2 | Time to minimum rSO2 during observation |
| t_max_rSO2 | Time to maximum rSO2 during observation |
| max_rSO2 | Maximum rSO2 value during observation |
| min_rSO2 | Minimum rSO2 value during observation |
| Rng_rSO2 | Range of rSO2 values across all time points |
| cHbi_posAUC | Positive area under the curve of total change in cHbi |
| cHbi_negAUC | Negative area under the curve of total change in cHbi |
| t_min_cHbi | Time to minimum cHbi during observation |
| t_max_cHbi | Time to maximum cHbi during observation |
| max_cHbi | Maximum cHbi value during observation |
| min_cHbi | Minimum cHbi value during observation |
| rng_cHbi | Range of cHbi values across all time points |
| O2Hbi_posAUC | Positive area under the curve of total change in O2Hbi |
| O2Hbi_negAUC | Negative area under the curve of total change in O2Hbi |
| t_min_O2Hbi | Time to minimum O2Hbi during observation |
| t_max_O2Hbi | Time to maximum O2Hbi during observation |
| max_O2Hbi | Maximum O2Hbi value during observation |
| min_O2Hbi | Minimum O2Hbi value during observation |
| rng_O2Hbi | Range of O2Hbi values across all time points |
| hHbi_posAUC | Positive area under the curve of total change in hHbi |
| hHbi_negAUC | Negative area under the curve of total change in hHbi |
| t_min_hHbi | Time to minimum hHbi during observation |
| t_max_hHbi | Time to maximum hHbi during observation |
| max_hHbi | Maximum hHbi value during observation |
| min_hHbi | Minimum hHbi value during observation |
| rng_hHbi | Range of hHbi values across all time points |
| hHbiex | Deoxygenated hemo/myoglobin during exercise |
| LS means | Least square means |
| CV1 | Canonical variate 1 |
| CanCrit | Canadian Criteria for ME/CFS |
| FacitF | FACIT fatigue score |
| FatigueSx | Self-reported fatigue symptom |
| ChalderF | Chalder fatigue scale |
| fNIRS | Functional near-infrared regional spectroscopy |
References
- WHO. WHO-Post COVID-19 Condition (Long COVID). 26 February 2025. Available online: https://www.who.int/news-room/fact-sheets/detail/post-covid-19-condition-(long-covid) (accessed on 28 February 2025).
- World Health Organization Post COVID-19 Condition (Long COVID). 7 December 2022. Available online: https://www.who.int/europe/news-room/fact-sheets/item/post-covid-19-condition (accessed on 28 February 2025).
- Davis, H.E.; Assaf, G.S.; McCorkell, L.; Wei, H.; Low, R.J.; Re’em, Y.; Redfield, S.; Austin, J.P.; Akrami, A. Characterizing Long COVID in an International Cohort: 7 Months of Symptoms and Their Impact. eClinicalMedicine 2021, 38, 101019. [Google Scholar] [CrossRef]
- Appelman, B.; Charlton, B.T.; Goulding, R.P.; Kerkhoff, T.J.; Breedveld, E.A.; Noort, W.; Offringa, C.; Bloemers, F.W.; van Weeghel, M.; Schomakers, B.V.; et al. Muscle Abnormalities Worsen after Post-Exertional Malaise in Long COVID. Nat. Commun. 2024, 15, 17. [Google Scholar] [CrossRef]
- Premraj, L.; Kannapadi, N.V.; Briggs, J.; Seal, S.M.; Battaglini, D.; Fanning, J.; Suen, J.; Robba, C.; Fraser, J.; Cho, S.-M. Mid and Long-Term Neurological and Neuropsychiatric Manifestations of Post-COVID-19 Syndrome: A Meta-Analysis. J. Neurol. Sci. 2022, 434, 120162. [Google Scholar] [CrossRef]
- Lechuga, G.C.; Morel, C.M.; De-Simone, S.G. Hematological Alterations Associated with Long COVID-19. Front. Physiol. 2023, 14, 1203472. [Google Scholar] [CrossRef]
- Schäfer, H.; Teschler, M.; Mooren, F.C.; Schmitz, B. Altered Tissue Oxygenation in Patients with Post COVID-19 Syndrome. Microvasc. Res. 2023, 148, 104551. [Google Scholar] [CrossRef]
- Davis, H.E.; McCorkell, L.; Vogel, J.M.; Topol, E.J. Long COVID: Major Findings, Mechanisms and Recommendations. Nat. Rev. Microbiol. 2023, 21, 133–146. [Google Scholar] [CrossRef]
- Kubánková, M.; Hohberger, B.; Hoffmanns, J.; Fürst, J.; Herrmann, M.; Guck, J.; Kräter, M. Physical Phenotype of Blood Cells Is Altered in COVID-19. Biophys. J. 2021, 120, 2838–2847. [Google Scholar] [CrossRef]
- Kell, D.B.; Laubscher, G.J.; Pretorius, E. A Central Role for Amyloid Fibrin Microclots in Long COVID/PASC: Origins and Therapeutic Implications. Biochem. J. 2022, 479, 537–559. [Google Scholar] [CrossRef]
- Wallukat, G.; Hohberger, B.; Wenzel, K.; Fürst, J.; Schulze-Rothe, S.; Wallukat, A.; Hönicke, A.S.; Müller, J. Functional Autoantibodies against G-Protein Coupled Receptors in Patients with Persistent Long-COVID-19 Symptoms. J. Transl. Autoimmun. 2021, 4, 100100. [Google Scholar] [CrossRef]
- Proal, A.D.; VanElzakker, M.B.; Aleman, S.; Bach, K.; Boribong, B.P.; Buggert, M.; Cherry, S.; Chertow, D.S.; Davies, H.E.; Dupont, C.L.; et al. SARS-CoV-2 Reservoir in Post-Acute Sequelae of COVID-19 (PASC). Nat. Immunol. 2023, 24, 1616–1627. [Google Scholar] [CrossRef]
- Schlick, S.; Lucio, M.; Wallukat, G.; Bartsch, A.; Skornia, A.; Hoffmanns, J.; Szewczykowski, C.; Schröder, T.; Raith, F.; Rogge, L.; et al. Post-COVID-19 Syndrome: Retinal Microcirculation as a Potential Marker for Chronic Fatigue. Int. J. Mol. Sci. 2022, 23, 13683. [Google Scholar] [CrossRef]
- Nägele, M.P.; Haubner, B.; Tanner, F.C.; Ruschitzka, F.; Flammer, A.J. Endothelial Dysfunction in COVID-19: Current Findings and Therapeutic Implications. Atherosclerosis 2020, 314, 58–62. [Google Scholar] [CrossRef]
- Wirth, K.J.; Löhn, M. Microvascular Capillary and Precapillary Cardiovascular Disturbances Strongly Interact to Severely Affect Tissue Perfusion and Mitochondrial Function in Myalgic Encephalomyelitis/Chronic Fatigue Syndrome Evolving from the Post COVID-19 Syndrome. Medicina 2024, 60, 194. [Google Scholar] [CrossRef]
- Szewczykowski, C.; Mardin, C.; Lucio, M.; Wallukat, G.; Hoffmanns, J.; Schröder, T.; Raith, F.; Rogge, L.; Heltmann, F.; Moritz, M.; et al. Long COVID: Association of Functional Autoantibodies against G-Protein-Coupled Receptors with an Impaired Retinal Microcirculation. Int. J. Mol. Sci. 2022, 23, 7209. [Google Scholar] [CrossRef]
- Hohberger, B.; Harrer, T.; Mardin, C.; Kruse, F.; Hoffmanns, J.; Rogge, L.; Heltmann, F.; Moritz, M.; Szewczykowski, C.; Schottenhamml, J.; et al. Case Report: Neutralization of Autoantibodies Targeting G-Protein-Coupled Receptors Improves Capillary Impairment and Fatigue Symptoms After COVID-19 Infection. Front. Med. 2021, 8, 1–7. [Google Scholar] [CrossRef]
- Hohberger, B.; Ganslmayer, M.; Harrer, T.; Kruse, F.; Maas, S.; Borst, T.; Heimke-Brinck, R.; Stog, A.; Knauer, T.; Rühl, E.; et al. Safety, Tolerability and Clinical Effects of BC007 (Rovunaptabin) on Fatigue and Quality of Life in Patients with Post-COVID Syndrome (ReCOVer): A Prospective, Exploratory, Randomised, Placebo-Controlled, Double-Blind, Crossover Phase IIa Clinical Trial. medRxiv 2024. [Google Scholar] [CrossRef]
- Barstow, T.J. Understanding near Infrared Spectroscopy and Its Application to Skeletal Muscle Research. Rev. Cores Reprod. Physiol. J. Appl. Physiol. 2019, 126, 1360–1376. [Google Scholar] [CrossRef]
- Grassi, B.; Quaresima, V. Near-Infrared Spectroscopy and Skeletal Muscle Oxidative Function in Vivo in Health and Disease: A Review from an Exercise Physiology Perspective. J. Biomed. Opt. 2016, 21, 091313. [Google Scholar] [CrossRef]
- Durstenfeld, M.S.; Sun, K.; Tahir, P.; Peluso, M.J.; Deeks, S.G.; Aras, M.A.; Grandis, D.J.; Long, C.S.; Beatty, A.; Hsue, P.Y. Use of Cardiopulmonary Exercise Testing to Evaluate Long COVID-19 Symptoms in Adults: A Systematic Review and Meta-Analysis. JAMA Netw. Open 2022, 5, E2236057. [Google Scholar] [CrossRef]
- Carruthers, B.M.; van de Sande, M.I.; De Meirleir, K.L.; Klimas, N.G.; Broderick, G.; Mitchell, T.; Staines, D.; Powles, A.C.P.; Speight, N.; Vallings, R.; et al. Myalgic Encephalomyelitis: International Consensus Criteria. J. Intern. Med. 2011, 270, 327–338. [Google Scholar] [CrossRef]
- Jackson, C. The Chalder Fatigue Scale (CFQ 11). Occup. Med. 2015, 65, 86. [Google Scholar] [CrossRef]
- Bell, D.S. The Doctor’s Guide to Chronic Fatigue Syndrome: Understanding, Treating, and Living with CFIDS; Addison-Wesley Publishing Company: Reading, MA, USA, 1995; ISBN 978-0201407976. [Google Scholar]
- Webster, K.; Cella, D.; Yost, K. The Functional Assessment of Chronic Illness Therapy (FACIT) Measurement System: Properties, Applications, and Interpretation. Health Qual. Life Outcomes 2003, 1, 79. [Google Scholar] [CrossRef]
- Baum, P.; Do, L.; Deterding, L.; Lier, J.; Kunis, I.; Saur, D.; Classen, J.; Wirtz, H.; Laufs, U. Cardiac Function in Relation to Functional Status and Fatigue in Patients with Post-COVID Syndrome. Sci. Rep. 2022, 12, 19575. [Google Scholar] [CrossRef]
- Thiele, K.; Balfanz, P.; Müller, T.; Hartmann, B.; Spiesshoefer, J.; Grebe, J.; Müller-Wieland, D.; Marx, N.; Dreher, M.; Daher, A. Cardiopulmonary Work up of Patients with and without Fatigue 6 Months after COVID-19. Sci. Rep. 2022, 12, 18038. [Google Scholar] [CrossRef]
- Mancini, D.M.; Bolinger, L.; Li, H.; Kendrick, K.; Chance, B.; Wilson, J.R. Validation of Near-Infrared Spectroscopy in Humans. J. Appl. Physiol. 1994, 77, 2740–2747. [Google Scholar] [CrossRef]
- Ferreira, L.F.; Koga, S.; Barstow, T.J. Dynamics of Noninvasively Estimated Microvascular O2 Extraction during Ramp Exercise. J. Appl. Physiol. 2007, 103, 1999–2004. [Google Scholar] [CrossRef]
- Wickham, H.; Averick, M.; Bryan, J.; Chang, W.; McGowan, L.; François, R.; Grolemund, G.; Hayes, A.; Henry, L.; Hester, J.; et al. Welcome to the Tidyverse. J. Open Source Softw. 2019, 4, 1686. [Google Scholar] [CrossRef]
- Pedersen, T.L. Patchwork: The Composer of Plots; R Package Version 1.1.3; 2022. Available online: https://CRAN.R-project.org/package=patchwork (accessed on 27 May 2025).
- Wood, S.N. Fast Stable Restricted Maximum Likelihood and Marginal Likelihood Estimation of Semiparametric Generalized Linear Models. J. R. Stat. Soc. Ser. B Stat. Methodol. 2011, 73, 3–36. [Google Scholar] [CrossRef]
- Russell, L. Emmeans: Estimated Marginal Means, Aka Least-Squares Means; R Package Version 1.10.1; 2024. Available online: https://CRAN.R-project.org/package=emmeans (accessed on 27 May 2025).
- Oksanen, J.; Blanchet, F.G.; Friendly, M.; Kindt, R.; Legendre, P.; McGlinn, D.; Minchin, P.R.; O’Hara, R.B.; Simpson, G.L.; Solymos, P.; et al. Vegan: Community Ecology Package; R Package Version 2.5-7.E; 2020. Available online: https://CRAN.R-project.org/package=vegan (accessed on 27 May 2025).
- Simpson, G.L. Ggvegan: “ggplot2” Plots for the “Vegan” Package; R Package Version 0.1-0; 2019. Available online: https://github.com/gavinsimpson/ggvegan (accessed on 27 May 2025).
- Navarro-Perez, R.; Romero-García, N.; Paolessi, C.; Robba, C.; Badenes, R. Cerebral Oximetry in High-Risk Surgical Patients: Where Are We? Curr. Opin. Crit. Care 2024, 30, 672–678. [Google Scholar] [CrossRef]
- Saugel, B.; Annecke, T.; Bein, B.; Flick, M.; Goepfert, M.; Gruenewald, M.; Habicher, M.; Jungwirth, B.; Koch, T.; Kouz, K.; et al. Intraoperative Haemodynamic Monitoring and Management of Adults Having Non-Cardiac Surgery: Guidelines of the German Society of Anaesthesiology and Intensive Care Medicine in Collaboration with the German Association of the Scientific Medical Societies. J. Clin. Monit. Comput. 2024, 38, 945–959. [Google Scholar] [CrossRef]
- Perrey, S.; Quaresima, V.; Ferrari, M. Muscle Oximetry in Sports Science: An Updated Systematic Review. Sports Med. 2024, 54, 975–996. [Google Scholar] [CrossRef]
- Hammer, S.M.; Alexander, A.M.; Didier, K.D.; Smith, J.R.; Caldwell, J.T.; Sutterfield, S.L.; Ade, C.J.; Barstow, T.J. The Noninvasive Simultaneous Measurement of Tissue Oxygenation and Microvascular Hemodynamics during Incremental Handgrip Exercise. J. Appl. Physiol. 2018, 124, 604–614. [Google Scholar] [CrossRef]
- Lucero, A.A.; Addae, G.; Lawrence, W.; Neway, B.; Credeur, D.P.; Faulkner, J.; Rowlands, D.; Stoner, L. Reliability of Muscle Blood Flow and Oxygen Consumption Response from Exercise Using Near-infrared Spectroscopy. Exp. Physiol. 2018, 103, 90–100. [Google Scholar] [CrossRef]
- Sperandio, P.A.; Oliveira, M.F.; Rodrigues, M.K.; Berton, D.C.; Treptow, E.; Nery, L.E.; Almeida, D.R.; Neder, J.A. Sildenafil Improves Microvascular O2 Delivery-to-Utilization Matching and Accelerates Exercise O2 Uptake Kinetics in Chronic Heart Failure. Am. J. Physiol. Heart Circ. Physiol. 2012, 303, H1474–H1480. [Google Scholar] [CrossRef]
- Grassi, B.; Marzorati, M.; Lanfranconi, F.; Ferri, A.; Longaretti, M.; Stucchi, A.; Vago, P.; Marconi, C.; Morandi, L. Impaired Oxygen Extraction in Metabolic Myopathies: Detection and Quantification by Near-infrared Spectroscopy. Muscle Nerve 2007, 35, 510–520. [Google Scholar] [CrossRef]
- Mccully, K.K.; Smith, S.; Rajaei, S.; Leigh, J.S.; Natelson, B.H.; Mccully, K.K.; Center, R. Muscle Metabolism with Blood FLow Restriction in Chronic Fatigue Syndrome. J. Appl. Physiol. 2004, 96, 871–878. [Google Scholar] [CrossRef]
- Lynch, D.R.; Lech, G.; Farmer, J.M.; Balcer, L.J.; Bank, W.; Chance, B.; Wilson, R.B. Near Infrared Muscle Spectroscopy in Patients with Friedreich’s Ataxia. Muscle Nerve 2002, 25, 664–673. [Google Scholar] [CrossRef]
- Shang, Y.; Gurley, K.; Symons, B.; Long, D.; Srikuea, R.; Crofford, L.J.; Peterson, C.A.; Yu, G. Noninvasive Optical Characterization of Muscle Blood Flow, Oxygenation, and Metabolism in Women with Fibromyalgia. Arthritis Res. Ther. 2012, 14, R236. [Google Scholar] [CrossRef]
- Barraclough, M.; McKie, S.; Parker, B.; Jackson, A.; Pemberton, P.; Elliott, R.; Bruce, I.N. Altered Cognitive Function in Systemic Lupus Erythematosus and Associations with Inflammation and Functional and Structural Brain Changes. Ann. Rheum. Dis. 2019, 78, 934–940. [Google Scholar] [CrossRef]
- Yan, Y.; Guo, Y.; Zhou, D. Mental Fatigue Causes Significant Activation of the Prefrontal Cortex: A Systematic Review and Meta-analysis of FNIRS Studies. Psychophysiology 2025, 62, e14747. [Google Scholar] [CrossRef]
- Nascimento, E.P.d.; Nascimento, L.F.E.d.; Castro, L.d.F.; de Barros, V.C.d.; Bandeira, E.R.P.; Wanderley e Lima, T.B.; Otto-Yáñez, M.; Fregonezi, G.A.d.F.; Resqueti, V.R. Cardiac Hemodynamics, Tissue Oxygenation, and Functional Capacity in Post-COVID-19 Patients. Medicina 2025, 61, 124. [Google Scholar] [CrossRef] [PubMed]

| Variable | PCS | Control |
|---|---|---|
| Age | 44.28 (19–78; SD 12.55) | 42.64 (22–68; SD 16.93) |
| Sex | 55% female | 54% female |
| Time from positive PCR test to investigation (days) | 909 (126–1565) | N/A 1 |
| Canadian Criteria | 83% fulfillment | 0% fulfillment |
| Median Bell score | 30 (95% CI 30–40) | 100 (95% CI 100) |
| FACIT fatigue score | 20.38 (SD 10.1) | 47.84 (SD 5.05) |
| Chalder fatigue scale | 9.964 (SD 2.038) | 0.618 (SD 1.670) |
| Variable | ||||
|---|---|---|---|---|
| Time of Peak hHbiex | Estimate | Std. Error | T Value | Pr(>|t|) |
| Intercept | 27.67810 | 1.22680 | 22.561 | <2 × 10⁻¹⁶ |
| Group PCS | 2.27568 | 0.71980 | −3.162 | 0.00158 |
| Age | 0.12032 | 0.68123 | 2.695 | 0.00706 |
| Sex Female | 1.83608 | 0.68123 | 2.695 | 0.00706 |
| Peak hHbiex value | ||||
| Intercept | 1.83154 | 0.14899 | 12.293 | <2 × 10⁻¹⁶ |
| Group PCS | −0.32504 | 0.08742 | −3.718 | 0.000203 |
| Age | 0.01890 | 0.00293 | 6.450 | 1.23 × 10⁻¹⁰ |
| Sex Female | −0.29506 | 0.08273 | −3.566 | 0.000366 |
Disclaimer/Publisher’s Note: The statements, opinions and data contained in all publications are solely those of the individual author(s) and contributor(s) and not of MDPI and/or the editor(s). MDPI and/or the editor(s) disclaim responsibility for any injury to people or property resulting from any ideas, methods, instructions or products referred to in the content. |
© 2025 by the authors. Licensee MDPI, Basel, Switzerland. This article is an open access article distributed under the terms and conditions of the Creative Commons Attribution (CC BY) license (https://creativecommons.org/licenses/by/4.0/).
Share and Cite
Ladek, A.-M.; Lucio, M.; Weiß, A.; Knauer, T.; Sarmiento, H.; Ilgner, M.; Jakobi, M.; Barteczko, L.; Ganslmayer, M.; Rech, J.; et al. Deoxygenation Trends and Their Multivariate Association with Self-Reported Fatigue in Post-COVID Syndrome. Biomedicines 2025, 13, 1371. https://doi.org/10.3390/biomedicines13061371
Ladek A-M, Lucio M, Weiß A, Knauer T, Sarmiento H, Ilgner M, Jakobi M, Barteczko L, Ganslmayer M, Rech J, et al. Deoxygenation Trends and Their Multivariate Association with Self-Reported Fatigue in Post-COVID Syndrome. Biomedicines. 2025; 13(6):1371. https://doi.org/10.3390/biomedicines13061371
Chicago/Turabian StyleLadek, Anja-Maria, Marianna Lucio, Andreas Weiß, Thomas Knauer, Helena Sarmiento, Miriam Ilgner, Marie Jakobi, Laura Barteczko, Marion Ganslmayer, Jürgen Rech, and et al. 2025. "Deoxygenation Trends and Their Multivariate Association with Self-Reported Fatigue in Post-COVID Syndrome" Biomedicines 13, no. 6: 1371. https://doi.org/10.3390/biomedicines13061371
APA StyleLadek, A.-M., Lucio, M., Weiß, A., Knauer, T., Sarmiento, H., Ilgner, M., Jakobi, M., Barteczko, L., Ganslmayer, M., Rech, J., Bergua, A., Mardin, C. Y., & Hohberger, B. (2025). Deoxygenation Trends and Their Multivariate Association with Self-Reported Fatigue in Post-COVID Syndrome. Biomedicines, 13(6), 1371. https://doi.org/10.3390/biomedicines13061371