Abstract
Efficient synthesis routes for zinc oxide nanoparticles (ZnO NPs) that are rapid and non-toxic and operate at room temperature (RT) are essential to expand accessibility, minimize environmental impact, and enable integration with temperature-sensitive substrates. In this work, ZnO NPs were synthesized by probe ultrasonication at RT for durations from 30 s to 10 min and benchmarked against our previously reported water bath sonication method. A 10-min probe treatment yielded highly uniform ZnO NPs with particle sizes of 60–550 nm and a specific surface area of up to 75 m2 g−1, compared to ~38 m2 g−1 for bath sonication. These features were largely preserved after calcination at 500 °C. When integrated into chemiresistive devices, the resulting ZnO (P(10))-based sensors exhibited pronounced selectivity toward styrene, showing reversible responses at low concentrations (10–50 ppm) and stronger signals at higher levels (up to 200 ppm, with resistance changes reaching 2930%). The sensors demonstrated stable operation across 10–90% relative humidity, and consistent performance from −20 °C to 180 °C. Flexibility tests confirmed reliable sensing after 100 bending cycles at 30°. Overall, RT-probe ultrasonication offers a rapid, scalable, and eco-friendly route to ZnO NPs with tunable properties, opening new opportunities for flexible gas sensing.
1. Introduction
Zinc oxide nanoparticles (ZnO NPs) have garnered significant attention due to their unique combination of physical, chemical, and biological properties. These include a broad direct band gap (~3.3–3.37 eV), high exciton binding energy, strong UV absorption, and notable photoluminescence, which make them ideal candidates for applications in electronics, optoelectronics, sensors, and UV-blocking products [1]. Their high surface area and catalytic activity further enhance their performance in photocatalysis and antibacterial applications. At the same time, their excellent thermal stability (melting point close to 1975 °C) and mechanical robustness make them suitable for high-temperature and durable devices [2]. Additionally, ZnO NPs exhibit significant biological effects, such as antibacterial, anticancer, and anti-inflammatory activities, primarily due to their ability to generate reactive oxygen species (ROS) and disrupt microbial membranes, which is valuable in biomedical and food packaging fields [3]. Their piezoelectric and semiconductor features enable their use in sensors, actuators, and energy harvesting systems [4]. The adaptability of ZnO NPs stems from their tunable morphology, strong chemical stability, and versatile surface chemistry, supporting their integration into medicine, electronics, catalysis, and environmental remediation [2].
A wide variety of synthesis methods have been investigated to produce ZnO NPs, each offering distinct advantages and limitations (see Table S1). Chemical techniques such as precipitation and sol–gel provide high yields and precise control over particle size and shape but often involve toxic reagents and raise environmental concerns [5,6] Physical methods like laser ablation and vapor deposition yield pure and uniform NPs but require high energy and costly equipment, limiting their scalability [7,8]. In contrast, green or biological synthesis using plant extracts or microbes is eco-friendly and biocompatible, as it avoids toxic byproducts; however, it may suffer from batch variability and less control over NP features [9,10]. Solvothermal and hydrothermal techniques enable excellent control of crystallinity and uniformity but generally require high pressure or temperature and longer reaction times [11,12]. Spark ablation produces highly crystalline, ligand-free ZnO NPs through plasma vaporization between zinc electrodes, offering advantages like precursor/waste-free operation, room-temperature scalability, and precise size control (5–50 nm), though disadvantages include low yields (~mg/hour) and the need for inert gas/post-calcination [13]. Among these methods, green synthesis at room temperature (RT) has emerged as particularly promising for producing ZnO NPs with tailored properties, offering superior structural integrity and enhanced optical characteristics ideally suited for advanced applications [14]. Green synthesis refers to the eco-friendly production of NPs using non-toxic or biological resources, which avoids hazardous reagents, minimizes energy consumption, and reduces environmental impact [15].
Furthermore, the preparation procedure and synthesis parameters play a decisive role in determining the properties and applications of ZnO NPs. For example, the pH of the synthesis medium is another crucial factor (Table S2). Higher pH values generally favor the formation of smaller, more monodisperse particles [16,17], which can enhance antibacterial activity and improve performance in dye-sensitized solar cells [18,19,20]. The choice of Zn-salt precursor (such as zinc nitrate (ZnNO3), zinc acetate (ZnAc, Zn(CH3COO)2·2H2O), or zinc sulfate (ZnSO4)) significantly influences nucleation and growth kinetics, as well as the surface chemistry of the resulting NPs (Table S3) [21,22]. For example, ZnAc often leads to well-defined nanorods or nanospheres [23,24], whereas ZnNO3 can yield flower-like or needle-like morphologies, which impact the optical, catalytic, and sensing properties of ZnO NPs [25]. Next, assisted techniques such as ultrasound (sonication) and microwave synthesis, are commonly used to control particle size, morphology, and dispersion. Probe sonication delivers higher energy over shorter periods compared to bath sonication, resulting in smaller, more uniform ZnO NPs with reduced agglomeration, an advantage for gas sensors and photocatalysts [26,27] Microwave-assisted synthesis rapidly heats zinc salt solutions using microwaves, accelerates nucleation and growth, enabling fast, energy-efficient synthesis of ZnO with controlled size and morphology [28,29]. Beyond these, other synthesis parameters, including precursor concentration, annealing temperature, and doping, also critically influence ZnO NP properties [21,30,31]. For instance, a higher precursor concentration in green synthesis can decrease crystallite size, while increased annealing temperatures typically enlarge particle size and purity but may also shift the optical band gap. Doping with elements like silver or cerium can modify the band gap and promote nanorod formation, and mechanochemical methods (such as longer milling) can further reduce particle size [32,33,34]. These findings highlight the importance of the synthesis method and its conditions are crucial for tailoring ZnO NP properties for specific applications. By carefully tuning the synthesis approach, whether through sonication, pH adjustment, or precursor selection, researchers can engineer ZnO NPs with desired size, shape, and surface characteristics, optimizing them for a wide range of applications.
Our recent work has centered on developing a sustainable, reproducible, and room-temperature fabrication route for ZnO NPs and flexible gas sensors, overcoming limitations of aggregation, high-temperature operation, and inconsistent electrical baselines, while demonstrating practical performance for styrene detection. Although styrene gas detection was used as a representative application, the primary objective of this study is not the detection of styrene itself but rather establishing clear relationships between synthesis parameters, particle size, surface area, and structural properties to enable improved gas-sensing performance. This framework can be extended beyond styrene to other analytes and even to other metal-oxide systems.
To achieve this, we first investigated the room-temperature synthesis of ZnO NPs with particular emphasis on how synthesis conditions, especially pH—govern NP size, morphology, and surface characteristics. We demonstrated that precise control of pH enables effective tuning of these properties, resulting in enhanced performance of flexible gas sensors for styrene detection [17]. Styrene was selected because of its industrial relevance and associated health risks, typically appearing at concentrations of 10–100 ppm in real environments, consistent with established occupational exposure limits. Despite the presence of common interfering gases such as benzene, toluene, xylene, ethanol, acetone, ammonia, and aldehydes, our ZnO-based sensors showed pronounced selectivity toward styrene within this relevant concentration range, highlighting their practical applicability.
Building on this foundation, we extended our efforts to a comparative evaluation of sonication-assisted synthesis routes. Specifically, we contrasted bath sonication with high-energy probe sonication to elucidate how different sonication modes influence the structural and functional properties of ZnO NPs. Notably, the probe-sonication method can be regarded as a green route, as it operates at room temperature, uses benign precursors, and relies solely on mechanical energy rather than chemical reducing agents. This comprehensive assessment provides an optimized pathway for ZnO NP synthesis tailored for gas-sensing applications by correlating pH conditions, synthesis parameters, and NP performance.
2. Materials and Methods
2.1. Chemicals and Reagents
ZnAc, methanol (CH3OH), and sodium hydroxide (NaOH), graphite (Gt) flake powder (flake size < 20 µm), polystyrene (PS, Mw = 154,000 g/mol), and ACS-grade xylene were all purchased from Sigma-Aldrich (St. Louis, MO, USA). All solutions were prepared using deionized nanopure water (DI) with a resistivity greater than 18 MΩ·cm.
2.2. Synthesis of ZnO NPs
ZnO NPs were synthesized at RT following the method described in [17]. To begin, 4 g of zinc acetate salt was dissolved in 100 mL of deionized water, and the pH was adjusted to 13 by gradually adding NaOH. The solution was subsequently exposed to probe sonication at RT for varying durations, 30 s (30s), 1 min (1m), 5 min (5m), and 10 min (10m) with a Fisher Scientific Model 500 sonic dismembrator (0.5-inch tip, 30 W), which facilitated the formation of uniform colloidal precipitates. These precipitates were collected by filtration, thoroughly washed multiple times with water and MeOH, and subsequently air-dried overnight. A portion of the resulting powder was reserved for characterization, while the rest was calcined at 500 °C for 2 h in air.
The subsequent calcination step at 500 °C was included only for comparison purposes, as calcination is a widespread practice in metal oxide synthesis. By comparing ZnO NPs before and after calcination, we evaluated differences in morphology, chemical composition, surface area, particle size, electrical behavior, and sensing performance.
The ZnO samples were designated as P(x) and P(x).C, where “x” represents the sonication time used. The suffix “C” indicates that the sample underwent calcination at 500 °C. For example, P30s refers to ZnO synthesized from ZnAc using probe sonication for 30 s, and after calcination, it is labeled as P30s.C. For comparison, ZnO NPs were also synthesized using bath sonication for 2 h, following the procedure outlined in our previous report [17]. The resulting samples were designated as B2h for the as-prepared ZnO and B2h.C for the sample subjected to calcination at 500 °C for 2 h, representing the materials before and after thermal treatment, respectively.
Although methanol (and later xylene solvent in the section of ink preparation) was used in small amounts during dispersion and washing, both solvents are highly volatile and fully evaporate during processing, leaving no residues in the ZnO NPs. The overall synthesis route remains greener than conventional methods because it operates at room temperature, avoids toxic precursors, and relies on mechanical energy input rather than hazardous reagents. Future work will aim to replace these solvents with more environmentally benign alternatives to further enhance sustainability.
2.3. Characterization
The surface morphology of the samples was examined using scanning electron microscopy (SEM, Hitachi SU-8230, Minato-ku, Tokyo, Japan). Raman spectra were collected in the 100–1000 cm−1 range at RT in air with a Renishaw inVia Raman microscope, utilizing a 532 nm excitation laser. Thermal properties were evaluated by thermogravimetric analysis (TGA, TA Instruments, TGA Q500, New Castle, DE, USA), with samples heated from 30 °C to 1000 °C at a rate of 10 °C per minute in ambient air. Particle size distribution was measured by dynamic light scattering (DLS) at 633 nm using a Malvern Zetasizer Nano S90 (Malvern, Worcestershire, UK), which is equipped with a 4 mW laser and an avalanche photodiode detector (APD). The specific surface area of the ZnO NPs was determined by the Brunauer–Emmett–Teller (BET) method, employing a BET surface area and porosimetry analyzer (TMAXCN, Xiamen Tmax Battery Equipments Limited, Xiamen, China) with nitrogen adsorption. Surface functional groups on ZnO were characterized using Fourier transform infrared spectroscopy (FTIR, Thermo Scientific Nicolet 4700, Madison, WI, USA). Optical absorbance spectra and bandgap measurements were performed with a UV/VIS/NIR spectrophotometer (PerkinElmer Lambda 750, Waltham, MA, USA). The optical bandgap (Eg) was calculated from the UV absorption data using the Tauc plot approach (Equation (1)) [17].
Here, A represents a constant, and “n” is the Tauc exponent, which varies based on the type of electronic transition. Typically, n equals 1/2 for direct allowed transitions and 2 for indirect allowed transitions. To determine the material’s band gap energy (Eg), a plot of (αhν)2 against photon energy (hν) is created, and the linear segment is extrapolated to intersect the x-axis. This approach is particularly useful for evaluating the optical characteristics of disordered or amorphous semiconductors.
αhν = A(hν − E)n
2.4. Ink Formulation and Preparation of Chemiresistive ZnO NPs-Based Sensors
The fabrication procedure for the ZnO-based gas sensor follows the same steps as previously reported [17], where a schematic illustration of the process is provided. Briefly, ZnO NPs were dispersed with Gt flakes in xylene, centrifuged, and then mixed with a PS solution to yield a uniform paste. This paste was deposited onto flexible, pre-screen-printed carbon electrodes on PET substrates using the doctor blade method, followed by drying at 60 °C for one hour. Sensors were fabricated using both pre- and post-calcined ZnO NPs, consistent with our earlier work. This preparation method aligns with our prior work on sensing nanocomposites [35,36,37].
2.5. Evaluation of the Sensing Performance of the ZnO NPs-Based Sensors
The chemiresistive gas sensing performance, including sensitivity and selectivity, was assessed using a Nextron microprobe station equipped with a Peltier-type sample stage [17]. Detailed specifications and features of the station are provided in the Supporting Information [17]. Electrical resistance of the sensing thin films, placed between two closely spaced carbon electrodes, was continuously recorded as the films were exposed to various gases such as acetone (C3H6O), ammonia (NH3), triethylamine ((C2H5)3N), acetic acid (C2H4O2), alcohols (CH3OH, ethanol (C2H5OH), isopropanol (C3H7OH)), aldehydes (including dimethyl-6-octenal (C10H18O), hexanal (C6H12O), acrolein (C3H4O), butyraldehyde (C4H8O), formaldehyde (CH2O), pentanal (C5H10O), acetaldehyde (CH3CHO)), and aromatic compounds (benzene (C6H6), styrene (C8H8)). Gas exposures were generated using a custom-built organic solvent vapor generator; further details on its working principle are available in the Supporting Information [17].
A programmed multimeter, interfaced with a PC via an Arduino card, was used to collect resistance data from the sensors. The response of the sensors to gas, relative humidity (RH), and temperature was calculated according to Equation (2). For gas response measurements, R1 denotes the initial resistance under ambient conditions (RT and 30–40% RH), while R2 is the resistance after exposure to the target gas under the same environmental parameters. After reaching equilibrium in the presence of the gas, the sensors were allowed to recover by returning to the initial conditions (RT and 30–40% RH) with the chamber lid open. Response and recovery times were defined as the intervals needed to achieve 90% of the total resistance change upon gas exposure and subsequent air exposure, respectively.
The influence of temperature and RH on sensor performance was also examined. Temperature response tests were conducted from −20 °C to 180 °C at ~10% RH, while RH response was evaluated across RH levels from 10% to 90% at 20 °C. For temperature variation studies, R1 represents the resistance at 20 °C and 10% RH, and R2 is the resistance after changing the temperature (with RH held at 10% and no gas exposure). For RH response, R1 is measured at 20 °C and 10% RH, and R2 is recorded after adjusting the RH (with temperature constant at 20 °C and no gas exposure).
2.6. Evaluation of the Mechanical Flexibility of the ZnO NPs-Based Sensor
The mechanical flexibility of the sensors was assessed by subjecting them to repeated bending cycles at a controlled rate of 5° per second, using a specific critical bending angle of 30°, to evaluate their resistance to mechanical stress and strain. Resistance measurements were continuously recorded using a programmed multimeter interfaced with a PC through an Arduino card, ensuring precise and real-time data acquisition. All experiments were conducted under ambient conditions, and the results are presented as changes in electrical resistance, calculated according to Equation (2).
3. Results
The SEM images in Figure 1 provide a clear visualization of how both sonication methods and durations, as well as calcination, impact the morphology and aggregation state of ZnO NPs. The NP size was determined by measuring at least 50 well-resolved particles across multiple SEM micrographs using ImageJ software (version 1.52). Diameters were extracted from regions where particles were distinguishable to calculate the average size. These values were further cross-validated with DLS measurements to ensure consistency, as can be seen in the next section.
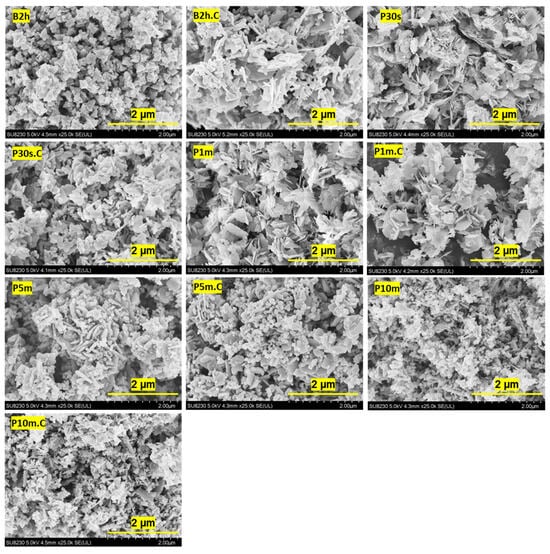
Figure 1.
SEM images of ZnO NPs synthesized using different sonication methods and durations. The first set of images corresponds to ZnO NPs prepared by water bath sonication for 2 h (B2h), shown before and after calcination at 500 °C for 2 h. The subsequent images show ZnO NPs synthesized via probe ultrasonication for 30 s, 1 min, 5 min, and 10 min, also presented before and after calcination under the same thermal conditions. Each image is labeled with its corresponding synthesis condition for clear identification.
The sample synthesized by water bath sonication for 2 h (B2h) exhibits large, irregular, and highly aggregated structures, with individual particles difficult to distinguish, and the overall morphology is dominated by dense clusters. The estimated primary particle size in B2h is broadly distributed, typically ranging from about 200 nm up to 600 nm, with some aggregates exceeding 1 μm. After calcination (B2h.C), these aggregates become even more compact and fused, with smoother surfaces, indicating significant grain growth and sintering. The primary particle size increases, now ranging from approximately 300 nm to 800 nm, but still lacks clear particle boundaries.
In contrast, the samples produced by probe ultrasonication show a marked reduction in aggregation and particle size, even at the shortest duration (P30s). Here, the particles appear more separated, with less dense packing and more defined edges, although some irregularity and clustering remain. The primary particle size in P30s is mostly in the range of 120–250 nm. After calcination (P30s.C), similar observations to the B2h.C sample were recorded with compact, fused, and smooth surfaces, and the particle size increases to about 180–350 nm, indicating significant grain growth and sintering, and still lacking clear particle boundaries.
As the probe sonication time increases to 1 min (P1m), the ZnO NPs become more uniform and better dispersed, with the primary particles appearing smaller and more distinct, typically in the range of 100–200 nm. After calcination (P1m.C), these particles show some increase in size and slight fusion, reaching about 150–270 nm, yet maintain a higher degree of separation and clearer boundaries compared to the B2h.C and P30s.C samples. The trend continues with longer probe sonication times. At 5 min (P5m), the NPs are even more finely divided and well-separated, with a noticeable reduction in aggregate size and a more consistent, near spherical or slightly faceted morphology. The primary particle size in P5m is estimated at 80–150 nm. Calcination (P5m.C) leads to a modest increase in particle size, to about 120–200 nm, but overall dispersion and uniformity are retained.
The 10-min probe sonication sample (P10m) displays the most pronounced effect: the NPs are highly uniform, small, and well-dispersed, with minimal aggregation and clear, rounded shapes. The particle size in P10m is consistently in the range of 70–120 nm. After calcination (P10m.C), the particles remain discrete and maintain their uniformity, with only a slight increase in size due to sintering, now in the range of 100–160 nm. These SEM results demonstrate that increasing the duration of probe ultrasonication significantly enhances the dispersion, uniformity, and size control of ZnO NPs, and that these improvements are largely preserved even after calcination, in stark contrast to the persistent aggregation observed in water bath sonicated samples.
DLS analysis (Figure 2A) reveals clear differences in particle size and distribution width depending on the sonication method, duration, and subsequent thermal treatment. For the water bath sonicated sample (B2h), the DLS curve reveals a broad and polydisperse distribution ranging between 310 nm and 750 nm, indicating the presence of both primary particles and substantial aggregates in the suspension. After calcination (B2h.C), the DLS profile shows a bimodal size distribution, now exhibiting two distinct populations: one between 100 nm and 360 nm, and another extending from 360 nm up to 750 nm. This shift suggests a partial breakdown of larger aggregates and some reorganization of particle size due to thermal treatment, likely because of grain growth and sintering processes. These DLS findings are in good agreement with the SEM observations. The reduction in average particle size after calcination, as detected by DLS, reflects the rearrangement and densification of the ZnO particles, supporting the morphological evolution seen in the SEM images.
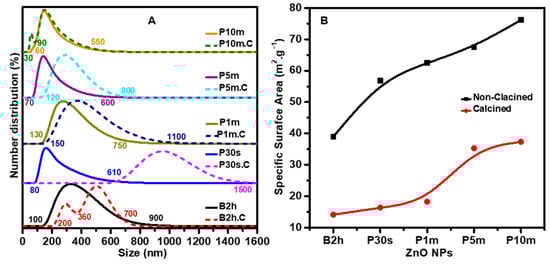
Figure 2.
(A) DLS analysis of ZnO NPs synthesized using various sonication methods and durations. Solid curves represent the particle size distribution before calcination, while dotted curves show the distribution after calcination at 500 °C for 2 h. The data illustrate the combined effects of sonication technique and thermal treatment on NP size and distribution. (B) BET surface area analysis of the same ZnO NPs before and after calcination. The results reveal the impact of sonication duration and calcination on the surface area and porosity of the ZnO NPs.
In the case of probe ultrasonication for 30 s (P30s), the DLS profile shows a particle distribution between 80 nm and 610 nm, indicating a substantial reduction in the primary particle size. After calcination (P30s.C), the size distribution shifts toward larger values, with the main peak now starting at 610 nm and a tail extending to 1500 nm (1.5 µm), reflecting significant particle growth and the persistence of aggregation upon thermal treatment. This observation partially agrees with the SEM images, with noticeable clustering and fused domains after calcination. The DLS data thus highlights that while short-duration probe ultrasonication effectively reduces the average particle size and enhances dispersion, it does not fully eliminate aggregation, especially after calcination, as also evidenced by the SEM analysis.
With increasing probe sonication time to 1 min (P1m), the DLS data reveal a particle size distribution with a broader peak ranging from 130 nm, extending up to 750 nm. This indicates the presence of a significant population of small, alongside a fraction of larger aggregates, resulting in a broader and less uniform size distribution compared to the P30s sample, which had a more pronounced separation between small and large particle populations. After calcination (P1m.C), the distribution shifts, with the broad population now spanning from 150 nm to 1100 nm (1.1 µm). This shift suggests that calcination promotes the growth and partial fusion of smaller particles into larger domains, while some degree of aggregation persists. These DLS findings align well with the SEM observations, which show that, despite some increase in particle size and minor aggregation after calcination, the P1m and P1m.C samples still exhibit better dispersion and more distinct particle boundaries than those prepared by water bath sonication (B2h and B2h.C) or shorter probe durations (P30s and P30s.C).
For 5 min of probe sonication (P5m), the DLS curve reveals a peak between 70 nm and 600 nm, reflecting a uniform and narrow size distribution. After calcination (P5m.C), the peak slightly shifts to a range between 120 nm and 800 nm, indicating a slight increase in particle size and some aggregation but overall maintaining a narrow distribution. This closely matches the SEM images, which show finely divided, well-separated NPs with only modest growth and aggregation after calcination.
The most dramatic improvement is observed for 10 min of probe sonication (P10m). Here, the DLS data displays a single peak ranging between 60 nm and 550 nm. After calcination (P10m.C), the peak maintained the exact range with a substantial reduction in the primary particle size to 30 nm, suggesting excellent size retention and minimal aggregation even after thermal treatment. The DLS analysis quantitatively supports the morphological trends observed by SEM.
The BET results, as illustrated in Figure 2B, reveal a clear relationship between sonication method, duration, calcination, and the specific surface area of ZnO NPs. For the non-calcined samples, the specific surface area increases steadily from approximately 38 m2 g−1 for the water bath sonicated sample (B2h) to about 75 m2 g−1 for the sample subjected to 10 min of probe ultrasonication (P10m). This trend demonstrates that increasing the intensity and duration of sonication, particularly with probe ultrasonication, effectively reduces particle aggregation and size, thereby exposing more surface area. The marked enhancement in surface area with longer probe sonication is consistent with the improved dispersion and reduced particle size observed in both SEM and DLS analyses.
Upon calcination, the specific surface area of all samples decreases significantly, with values ranging from around 14 m2 g−1 for B2h.C to approximately 37 m2 g−1 for P10m.C. This reduction is attributed to particle growth, sintering, and partial pore collapse during the high-temperature treatment, which is a well-documented phenomenon in ZnO systems [38]. However, even after calcination, the trend of increasing surface area with longer probe sonication is preserved. The calcined P10m sample retains the highest surface area among all calcined samples, indicating that the benefits of extended probe sonication are partially retained after thermal processing [39].
These BET findings are in strong agreement with the morphological trends seen in SEM and DLS data, confirming that probe ultrasonication, especially for extended durations, is highly effective for maximizing the accessible surface area of ZnO NPs. Enhanced surface area benefits catalysis and gas sensing, where surface-dependent phenomena are critical. The observed values also compare favorably with literature reports for ZnO synthesized under similar conditions, further validating the effectiveness of the sonication-assisted synthesis approach.
The UV-Vis absorption spectra (Figure 3A) and corresponding Tauc plots for bandgap determination (Figure 3B) provide valuable insights into the optical properties of ZnO NPs synthesized under different sonication conditions and the effects of calcination on their electronic structure.
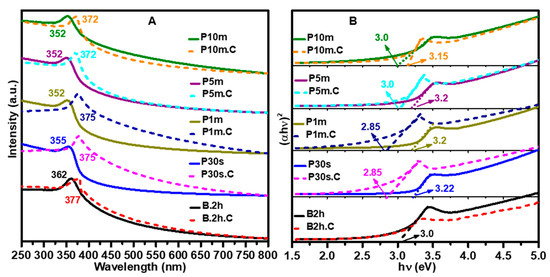
Figure 3.
(A) UV–Vis absorption spectra and (B) corresponding bandgap measurements of ZnO NPs synthesized using various sonication methods and durations, shown before and after calcination at 500 °C for 2 h. The results highlight the influence of sonication conditions and thermal treatment on the optical properties and bandgap energy of the ZnO NPs.
The UV-Vis absorption spectra (Figure 3A) reveal distinct absorption for each sample, with notable variations based on both the sonication method and duration. The typical bandgap of ZnO NPs reported in the literature generally falls within the range of 3.2 to 3.4 eV for undoped, pure ZnO NPs [40]. The water bath sonicated sample (B2h) displays an absorption edge at 362 nm, corresponding to a direct bandgap of approximately 3.0 eV, as shown in the Tauc plot (Figure 3B). For the probe ultrasonicated samples, a clear trend of blue-shifting absorption edges is observed as the sonication duration increases. The P30s sample exhibits an absorption peak at 355 nm, with a bandgap of 3.22 eV. With further increases in probe sonication time (P1m, P5m, and P10m), the absorption edge shifts to 352 nm for all three, corresponding to band gaps of 3.2 eV for P1m and P5m, and 3.0 eV for P10m. This blue shift and bandgap widening are consistent with the reduction in particle size and improved uniformity observed in SEM and DLS analyses, reflecting quantum confinement effects in the smaller, more dispersed NPs produced by longer probe sonication.
Calcination induces significant changes in the optical properties across all samples. After thermal treatment, the absorption edges are generally red-shifted, indicating a decrease in bandgap energy. For example, the B2h.C sample shows a red shift from 362 nm to 377 nm, though the bandgap remains at 3.0 eV, suggesting that particle growth and improved crystallinity during calcination offset the quantum confinement effect. The P30s.C sample exhibits a red shift from 355 nm to 375 nm, with a notable bandgap reduction from 3.22 eV to 2.85 eV. Similarly, P1m.C shows a shift from 352 nm to 375 nm, with the bandgap decreasing from 3.2 eV to 2.85 eV. The P5m.C and P10m.C samples each display a red shift from 352 nm to 372 nm, with their band gaps decreasing from 3.2 eV and 3.15 eV, respectively, to 3.0 eV after calcination.
These results demonstrate that increasing the probe sonication time leads to smaller, more uniform ZnO NPs with blue-shifted absorption and wider band gaps due to quantum confinement. However, calcination reverses this trend, causing the absorption edges to red-shift and the bandgap energies to decrease, consistent with particle growth and reduced quantum confinement as the NPs sinter and grow. The close agreement between the optical data and the morphological observations from SEM and DLS confirms the strong correlation between synthesis conditions, particle size, and the electronic structure of ZnO NPs. This tunability of optical properties through sonication and thermal treatment is highly advantageous for tailoring ZnO NPs for specific optoelectronic and photocatalytic applications.
TGA was performed to assess the thermal stability, decomposition behavior, and residual organic content of ZnO NPs synthesized using different sonication methods and durations, both before (Figure 4A) and after (Figure 4B) calcination. Figure 4A shows that all as-synthesized ZnO samples display a gradual weight loss as the temperature increases from RT to 1000 °C, with the most significant loss occurring below 500 °C. This weight loss is primarily attributed to the evaporation of adsorbed moisture, the removal of surface-bound organics, and the decomposition of residual precursor materials. Water bath sonicated sample (B2h) exhibits a total weight loss of about 4% up to 500 °C, indicating the presence of moderate organic and volatile content. Probe ultrasonicated samples show a close amount of organic and volatile content, like B2h. Still, the highest weight loss (5.2%) was achieved with shorter sonication durations (P30s), while the other samples (P1m, P5m, P10m) demonstrated a weight loss between 4.5% and 4.8%. After 500 °C, the weight loss plateaus for all samples, indicating that most of the labile components have been removed by this temperature. The residual weight loss at higher temperatures is minimal, confirming the good thermal stability of the ZnO framework.
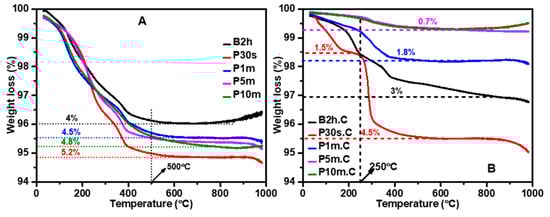
Figure 4.
TGA analysis of ZnO NPs synthesized using various sonication methods and durations, shown (A) before and (B) after calcination at 500 °C for 2 h. The results highlight the thermal stability, decomposition behavior, and residual organic content of the ZnO NPs, as influenced by sonication conditions and subsequent heat treatment.
Following calcination at 500 °C (Figure 4B), all samples show a marked improvement in thermal stability, with significantly reduced weight loss across the entire temperature range. The total weight loss values are now much lower (i.e., B2h.C: 3%, P30s.C: 4.5%, P1m.C: 1.8%, P5m.C and P10m.C: 0.7%). The weight loss for the calcined samples is mainly due to the desorption of physically adsorbed water and minor surface species. The negligible weight loss above this temperature range indicates that the calcination process has effectively removed most organics and residual precursors. Notably, the P5m.C and P10m.C samples exhibit the lowest residual weight loss (0.7%), suggesting the highest purity and thermal stability among all samples.
These TGA results are consistent with the morphological and surface area trends observed in SEM, DLS, and BET analyses. Longer probe sonication durations facilitate better dispersion and more complete reaction, resulting in ZnO NPs with less trapped organics and higher thermal stability. Calcination at 500 °C further purifies the samples, but the initial sonication conditions remain a key factor in determining the final purity and stability.
The XRD patterns of ZnO NPs (Figure 5) synthesized using various sonication methods and durations, before and after calcination at 500 °C, provide essential insights into their crystalline structure, phase purity, and orientation. All samples exhibit diffraction peaks that match the standard hexagonal wurtzite structure of ZnO, with dominant reflections observed at 2θ ≈ 31.8°, 34.5°, and 36.3°, corresponding to the (100), (002), and (101) planes, respectively. This confirms the successful formation of phase-pure ZnO under all synthesis conditions.
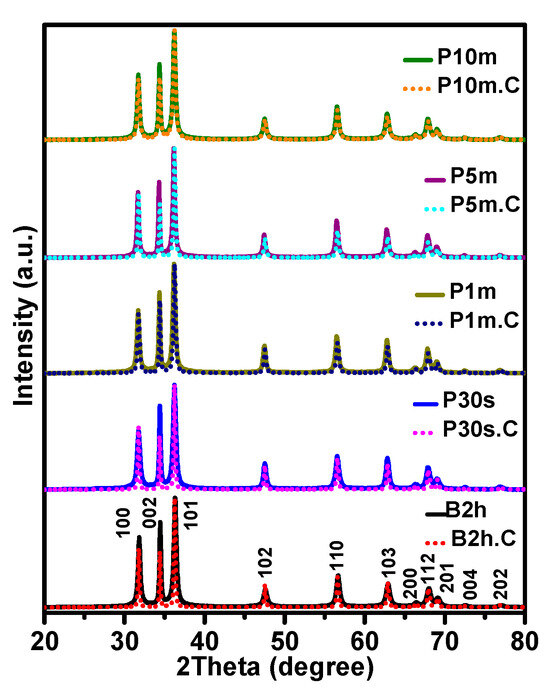
Figure 5.
XRD diffractograms of ZnO NPs synthesized using various sonication methods and durations, shown before and after calcination at 500 °C. The results highlight the structural, vibrational, and crystallographic changes induced by different sonication conditions and thermal treatment.
Notably, the relative intensities of these peaks vary significantly depending on the sonication method, duration, and thermal treatment, offering valuable information about preferred orientation and the evolution of crystallinity. Before calcination (solid diffractograms as seen in Figure 5), all samples show relatively similar peak intensity ratios, particularly those treated by probe ultrasonication, suggesting an initial random or weakly oriented polycrystalline structure. However, the water bath sonicated sample (B2h) shows disproportionately higher intensity at (002) and (101), hinting at aggregation-induced texture development. After calcination (dotted diffractograms as seen in Figure 5), the intensity of the (100) and particularly (002) peaks decreases for many samples (e.g., B2h.C and P30s.C), while some probe-sonicated samples (especially P5m.C and P10m.C) retain stronger and more balanced intensities across all three planes. This change in relative peak intensity reflects both a shift in preferred orientation and improved crystallinity due to the thermal treatment.
The decline in relative peak intensity after calcination for most samples can be attributed to grain coarsening, reduction in surface defects, and partial texturing loss as particles fuse and recrystallize. These observations are consistent with SEM and DLS results, which show significant particle growth and sintering effects post-calcination, especially in B2h.C and P30s.C. For example, the normalized intensity of the (100) plane in B2h drops from 66.7% to 53.2% after calcination, indicating a marked shift in crystallographic orientation. Similarly, the (002) peak decreases from 78.9% to 52%, reinforcing the conclusion of aggregation-driven orientation loss.
On the other hand, samples synthesized with longer probe sonication durations (P5m and P10m) retain more balanced intensities and exhibit only modest changes post-calcination. This suggests a more stable crystallographic structure, in line with their superior dispersion, higher surface area (as shown in BET results), and minimal aggregation as observed in SEM and DLS data. In particular, the P10m.C sample exhibits well-preserved peak intensities across all three planes, reflecting enhanced structural stability and isotropy.
FTIR and Raman spectroscopies were employed to probe the chemical structure, bonding environment, and crystallinity of the ZnO NPs. The combined analysis of these vibrational techniques offers valuable insights into the presence of organic residues, hydroxyl groups, and lattice ordering. The Raman spectra (Figure 6A) provide further confirmation of structural ordering and phase purity. Wurtzite ZnO exhibits a well-known set of phonon modes, among which the E2 (high) mode at ~437 cm−1 is the most prominent and is commonly used as a signature for crystallinity and lattice symmetry. In the B2h, P30s, and P1m samples, the E2 (high) peak appears broad with a low-intensity shoulder at 380 cm−1 (A1(TO)), reflecting low crystallinity and the presence of structural defects, such as oxygen vacancies and lattice distortions. These characteristics are consistent with their broad DLS distributions, low BET surface area, and high organic content. With increasing sonication time, especially in the P5m and P10m samples, the E2 (high) peak becomes sharper with a lower-intensity shoulder at 380 cm−1 (A1(TO)), indicating a progressive improvement in crystallinity and reduction in lattice defects. This trend continues after calcination, where the P10m.C and P5m.C samples show the most intense and narrow E2 (high) peaks. These observations strongly support the SEM and XRD findings of more defined and well-dispersed particles with uniform morphology, as well as the UV–Vis results indicating a narrowing of bandgap due to enhanced lattice ordering.
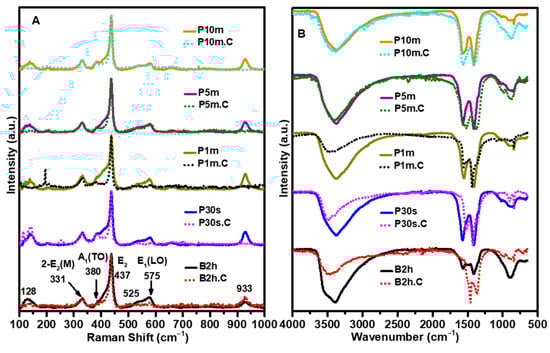
Figure 6.
(A) Raman spectra and (B) FTIR spectra of ZnO NPs synthesized before and after calcination at 500 °C. The results highlight the structural, vibrational, and crystallographic changes induced by different sonication conditions and thermal treatment, providing insight into the evolution of functional groups of the ZnO NPs.
Other Raman-active modes, such as E1(LO) and 2-E2(M), are observed in the samples subjected to shorter sonication times, but these modes, especially E1(LO), become weaker or even suppressed in samples that have undergone extended sonication and subsequent calcination. This attenuation of Raman features with increased sonication and thermal treatment provides further evidence of the profound impact these processes have on the phonon structure and phase purity of the ZnO NPs. The reduction in intensity of these modes suggests improved crystallinity and a decrease in structural defects, underscoring the critical role of sonication duration and calcination in tailoring the vibrational properties and overall quality of the ZnO NPs.
The FTIR spectra (Figure 6B) exhibit distinct features associated with hydroxyl groups, organic moieties, and Zn–O vibrations, which vary noticeably depending on the sonication conditions and the calcination state of the samples. All non-calcined samples display broad absorption bands centered around 3400 cm−1 and 1630 cm−1, corresponding to the O–H stretching and bending vibrations of adsorbed water and surface hydroxyl groups, respectively. These features are particularly pronounced in the B2h and P30s samples, indicating a high degree of surface-bound moisture and hydroxylation, likely due to their higher aggregation and surface area exposure to atmospheric RH. Upon calcination at 500 °C, these bands are significantly reduced or even completely suppressed across all samples, confirming the removal of physisorbed water and hydroxyl functionalities. However, the FTIR spectra for P5m and P10m show identical spectra before and after calcination, suggesting effective surface cleaning at high sonication times. This means that the broad peaks 3400 cm−1 and 1630 cm−1 correspond mainly to physisorption of water molecules on ZnO NPs. This aligns with the TGA findings of minimal residual weight loss.
Peaks observed in the 2900–1400 cm−1 range, associated with C–H stretching and C=O vibrations, are evident in the B2h and P30s samples before calcination. These features indicate the presence of residual organic compounds, possibly from incomplete precursor decomposition or surface contamination. These peaks also diminish or disappear post-calcination. Once again, the P5m.C and P10m.C samples show identical spectra pre- and post-calcination, corroborating their higher chemical purity and superior thermal stability, as confirmed by TGA and BET.
The Zn–O stretching vibrations, typically located in the 400–600 cm−1 region, are present in all samples. After calcination, these peaks become sharper and more intense, especially in the P10m.C and P5m.C samples, indicating enhanced crystallinity and well-formed Zn–O bonds. These improvements reflect the grain growth and lattice ordering induced by thermal treatment, consistent with XRD, Raman, and UV–Vis results.
For sensor fabrication and gas sensing evaluation, the ZnO NPs synthesized using 10 min of probe ultrasonication (P10m) and their calcined counterpart (P10m.C) were selected due to their superior physicochemical properties observed across all characterization techniques. Among all synthesized samples, P10m exhibited the smallest and most uniform particle size, minimal aggregation, and the highest surface area, as confirmed by SEM, DLS, and BET analyses. These attributes are critical for enhancing gas sensing performance, as they maximize the accessible surface area for gas adsorption and facilitate more efficient electron transfer pathways. Moreover, the P10m.C sample, which underwent calcination at 500 °C, demonstrated improved crystallinity (XRD and Raman), reduced surface-bound organics (FTIR and TGA), and greater thermal stability, all of which contribute to better sensor stability and responsiveness. These combined features made P10m and P10m.C ideal candidates for evaluating the impact of NP morphology, surface chemistry, and thermal treatment on gas sensing behavior, particularly in detecting styrene gas with high sensitivity and selectivity.
The baseline electrical resistance of the sensors, measured by multimeter, consistently ~100 kΩ. The Gt thin film governed this value, while the formulation of ZnO NPs into pastes and deposition via the doctor blade method ensured reproducibility across devices. Consequently, variations in sensing response are attributed to the micro/nano structure of the ZnO layers rather than changes in bulk resistivity.
The gas-sensing selectivity of the fabricated ZnO-based sensors, evaluated using the P10m, P10m.C, B2h, and B2h.C samples, is presented in Figure S1A,B for a diverse range of gases, including alcohols, aldehydes, ketones, amines, and aromatic hydrocarbons. Among all the tested gases, styrene (C8H8) consistently elicited the strongest response across all sensor samples, underscoring the material’s pronounced selectivity for aromatic hydrocarbons, well aligned with our observations in our previous work [17]. Figure 7A highlights that the P10m sensor, in particular, exhibited an exceptionally high response of approximately 2930%, followed by B2h (~590%), B2h.C (~450%), and P10m.C (~400%). This ranking confirms the critical influence of both the sonication method and calcination on sensor performance. The marked enhancement in the response of the P10m sensor can be attributed to its improved surface area and crystallinity, which together enhance charge mobility and the density of active surface sites available for gas interaction.
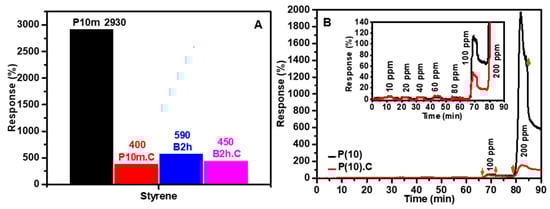
Figure 7.
Resistance response curves of sensors based on P(10) (before calcination) and P(10).C (after calcination): (A) Response to styrene gas, demonstrating the selectivity of the sensors; (B) The dynamic sensing behavior to stepwise increases in styrene gas concentration, validating their sensitivity, as well as response and recovery times. In the schematic diagram, downward-pointing arrows symbolize the injection of gas into the system, whereas upward-pointing arrows represent the venting of gas.
Furthermore, the higher response of the P10m sensor compared to its B2h counterparts reflects the significant role of probe ultrasonication in reducing particle size, improving NP dispersion, and increasing the accessible surface area. These factors collectively facilitate more effective gas-surface interactions, leading to heightened sensitivity. Figure S1B further highlights that, although the B2h and B2h.C-based sensors exhibit measurable responses to a variety of volatile organic compounds, including acetone, ammonia, and several alcohols, the P10m and P10m.C-based sensors demonstrate markedly superior selectivity toward styrene. These latter sensors show lower responses to non-aromatic gases compared to their B2h and B2h.C counterparts, underscoring their exceptional specificity for styrene detection. This pronounced selectivity distinguishes the P10m and P10m.C sensors from those prepared by bath sonication, and emphasizes the effectiveness of probe sonication and optimized processing conditions in enhancing the sensor’s ability to discriminate styrene from other volatile compounds.
Figure 7B illustrates the dynamic sensing performance of the P10m and P10m.C sensors in response to varying concentrations of styrene gas (10–200 ppm). Notably, the P10m sensor consistently exhibits a stronger and more pronounced response compared to the P10m.C sensor, reinforcing the critical role of increased surface area in promoting gas adsorption and enhancing surface reactivity. The stepwise escalation in sensor response with rising styrene concentration demonstrates a sensitive yet reversible behavior at lower concentrations (up to 80 ppm), indicative of a predominantly physical adsorption process that temporarily perturbs the electronic structure of the sensing film, leading to increased electrical resistance.
However, at higher styrene concentrations (100 and 200 ppm), both sensors display a substantial and largely irreversible increase in resistance, suggesting a transition in the sensing mechanism. At these elevated concentrations, the interaction between styrene molecules and the sensing film likely involves stronger chemical reactions, which result in permanent modifications to the film’s chemical structure and hinder the sensor’s ability to fully recover its original conductivity. This irreversible behavior at high styrene levels highlights a shift from a reversible, physisorption-dominated mechanism at low concentrations to a chemisorption-driven process at higher concentrations, ultimately affecting the long-term stability and reusability of the sensor. These findings underscore the importance of optimizing sensor materials and operating conditions to balance sensitivity, selectivity, and reversibility for practical gas sensing applications.
The difference in response at low and high styrene concentrations arises from the sensing mechanism of ZnO NPs. At low concentrations, limited adsorption–desorption of styrene molecules leads to minimal electron transfer (physical sensing mechanism), causing the response to plateau. At higher concentrations, increased adsorption enhances the styrene molecule’s reaction with ZnO NPs (chemical sensing mechanism), yield significant response change. This mechanism explains why the sensor functions effectively as a threshold detector to styrene concentration below 80 ppm rather than a quantitative sensor. While the limit of detection is typically defined as the lowest concentration at which a measurable response is observed, the plateauing behavior in the 0–80 ppm range, a precise value is difficult to indicate.
The response time (T90) was determined as the time required for the sensor signal to reach 90% of its final value upon exposure, while the recovery time (T90) was defined as the time required to return to 90% of the baseline after gas removal. At styrene concentrations ≤ 80 ppm, where physisorption dominates, the P10m sensor exhibited a response time of approximately 90 s and a recovery time of 155 s (Figure 7B). At higher concentrations (100–200 ppm), the recovery curve did not return fully to baseline due to chemisorption effects, and therefore, a recovery time could not be meaningfully defined.
Table 1 presents selected figures of merit for flexible ZnO-based sensors. We acknowledge that the information shown is limited to maintain clarity, readability, and relevance to the discussion in the manuscript. While many authors report additional metrics such as response/recovery times, power consumption, or photoactivation, our focus here is on presenting the most representative parameters for flexible devices. Sensitivity is reported as the response to specific gas concentrations, a method we have consistently used to ensure comparability. The limit of detection is typically defined as the lowest concentration at which the sensor shows a measurable response. However, as discussed, the plateauing behavior in the 0–80 ppm range complicates its precise determination.

Table 1.
Summary of recent ZnO-based gas sensors, including target gases, sensitivity or detection limits, application areas, sensor flexibility, and corresponding literature references. The table highlights the diversity of ZnO nanostructures and their performance in detecting various gases, with emphasis on flexible sensor platforms and the ZnO sensor developed in this work for styrene detection.
Compared to the ZnO-based gas sensors reported in the recent literature (Table 1), our probe-sonicated ZnO NP sensors demonstrate several notable advantages. Many conventional ZnO sensors, such as those utilizing nanorods, nanosheets, or noble metal modifications, exhibit high sensitivity and selectivity toward gases like nitrogen dioxide (NO2), hydrogen (H2), ammonia (NH3), hydrogen sulfide (H2S) and various VOCs but often require elevated operating temperatures or rigid substrates, which can limit their applicability in flexible or wearable devices.
In contrast, our sensors, fabricated using ZnO NPs synthesized via rapid, room-temperature probe ultrasonication, combine high selectivity toward styrene with robust mechanical flexibility and environmental stability. While literature examples report impressive detection limits and response values for gases such as H2S, NO2, and C3H6O (acetone), few studies address styrene detection or focus on flexible sensor platforms. Our sensors provide a reversible and pronounced response to styrene at low and high concentrations, respectively. This positions our ZnO NP-based sensor as a competitive and versatile solution for next-generation flexible gas sensing applications, bridging the gap between gas detection and the practical demands of flexible, wearable, and environmentally resilient devices.
The environmental stability of the sensors was evaluated by examining their responses to changes in RH and temperature using a Nextron probe station. To ensure that the measurements reflected the intrinsic properties of the ZnO/Gt/PS nanocomposite thin film, the sensors were first calcined at 180 °C for 10 min to remove any low-molecular-weight PS residues, as shown in our previous reports [17,54]. In the subsequent tests, the (P10m)-based sensor displayed a noticeable increase in electrical resistance as the temperature dropped from 20 °C to −20 °C, but this resistance promptly returned to its original value when the temperature was raised back to 20 °C, as seen in Figure 8A. Between 20 °C and 110 °C, only minor changes in resistance were observed, while a further increase in temperature from 110 °C to 180 °C led to another rise in resistance, which again was fully reversible upon cooling (Figure 8A). This cyclical behavior was consistent during repeated temperature variations. In contrast, the calcined (P10m.C)-based sensor exhibited much more stable performance, with significantly negligible changes in electrical resistance from 20 °C to −20 °C, as illustrated in Figure 8A. Interestingly, both the P10m and P10m.C sensors exhibited nearly identical increases in electrical resistance when the temperature was raised from 110 °C to 180 °C, despite the P10m.C sensor having undergone calcination. This similarity in thermal response between 110 °C and 180 °C is likely attributed to the thermoplastic properties of the PS component used in the sensing film [54]. As the temperature rises within this range, PS undergoes softening due to its thermoplastic nature. This softening disrupts the physical and electrical connections between the Gt flakes and ZnO NPs, thereby impeding efficient charge transfer throughout the sensing thin film. As a result, the overall electrical resistance of the sensor increases, reflecting the diminished conductivity caused by the reduced interparticle connectivity within the composite matrix. This behavior is consistent with previous findings, where temperature sensors composed solely of Gt and PS exhibited comparable resistance changes at elevated temperatures [54]. Therefore, it can be inferred that the thermoplastic nature of PS plays a significant role in the observed resistance increase for both the P10m and P10m.C sensors when subjected to high temperatures, regardless of the calcination process.
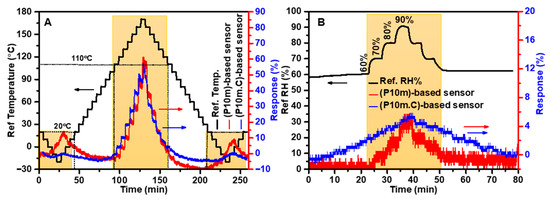
Figure 8.
Resistance response curves of P(10) and P(10).C based sensors under different environmental conditions: (A) Stepwise temperature increases and decreases from −20 °C to 180 °C; and (B) High RH variation from 60% to 90%. In the schematic diagram, the background color marks the operational ranges for temperature and RH, where the integrated sensors demonstrate responsive behavior to variations in these environmental parameters.
As shown in Figure 8B, when the RH was increased from 60% to 90%, the (P10m)-based sensor exhibited a minor rise in electrical resistance, which reversed when the RH was decreased back to 60%. In contrast, the (P10m.C)-based sensor showed a much smaller change in resistance over the same RH range and displayed greater stability in response to RH variations. The response of the sensors suggests that physisorption, particularly the adsorption of water molecules over the sensor’s thin film and held by weaker van der Waals forces, plays a significant role in the observed increase in electrical resistance. The fact that the sensors fully recover their initial resistance indicates that these physisorption processes are fully reversible. This similarity in the sensors’ response to changes in RH underscores that a 10-min sonication process is highly effective in minimizing residual organic impurities within the ZnO NPs. As a result, the sensors exhibit improved stability and reliability when exposed to varying RH levels, demonstrating that extended sonication alone can significantly enhance the environmental robustness of the sensing material.
Assessing the mechanical properties of these sensors is also vital, especially for applications in flexible electronics where both flexibility and mechanical durability are required. The mechanical flexibility of the (P10m)-based sensor was evaluated by subjecting the sensor to repeated bending cycles at a 30° angle (bending radius ~1 cm) under ambient conditions (RT and RH of approximately 30–40%), as seen in Figure 9A. This specific bending angle was selected to facilitate a direct comparison of the mechanical flexibility of the (P10m)-based sensor with our previous studies, ensuring consistency and enabling a clear assessment of performance improvements across different sensor designs. Remarkably, the sensor maintained its robustness and stability, with resistance changes remaining within 5% even after hundreds of cycles, as depicted in Figure 9B. Previous studies have confirmed that bare carbon electrodes maintain excellent mechanical flexibility with minimal resistance changes under similar conditions, indicating that the observed resistance increase is mainly due to deformation of the sensing layer rather than the electrode itself.
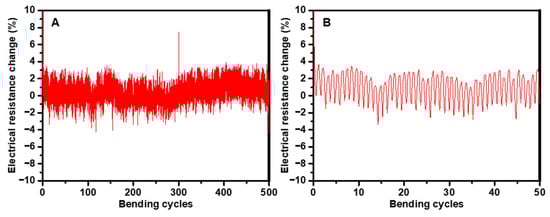
Figure 9.
(A) Evaluation of the sensor’s mechanical flexibility through repeated bending cycles at a 30° bending angle. (B) Analysis of the sensor’s resistance response during the initial 50 bending cycles at a 30° angle.
4. Conclusions
This study establishes probe ultrasonication as a highly efficient and versatile strategy for the synthesis of ZnO NPs at room temperature, clearly outperforming conventional water bath sonication. Systematic variation in sonication duration revealed that extending probe ultrasonication up to 10 min produced ZnO NPs with dramatically reduced particle sizes (70–120 nm), enhanced uniformity, and minimal aggregation. These improvements, confirmed by SEM, DLS, and BET analyses, were largely preserved after calcination at 500 °C, with only modest grain growth and aggregation, in stark contrast to the persistent clustering observed in bath-sonicated samples. The higher specific surface area achieved by probe sonication (up to 75 m2 g−1 before calcination and the highest values among calcined samples) is particularly advantageous for surface-driven applications such as catalysis and gas sensing. Optical and thermal studies further confirmed the high quality of the synthesized materials, showing tunable bandgaps, efficient removal of organics, and excellent thermal stability.
Building on these material properties, ZnO-based chemiresistive sensors fabricated from P10m and P10m.C samples demonstrated exceptional performance for styrene detection. The P10m sensor exhibited threshold-type sensing behavior with a plateauing response at low concentrations (≤80 ppm) due to dominant physisorption processes. At higher styrene levels (100–200 ppm), the response became more pronounced but less reversible, consistent with a transition toward chemisorption and partial alteration of the sensing film. These mechanistic insights highlight how particle size, surface chemistry, and thermal treatment collectively influence sensor behavior. Importantly, both P10m and P10m.C sensors also displayed outstanding mechanical flexibility, maintaining stable resistance after hundreds of bending cycles, and strong resilience to humidity and temperature variations. Furthermore, the presence of the Gt thin film and the use of doctor blade fabrication ensured consistent baseline resistance (~100 kΩ) across devices, reinforcing the reproducibility and reliability of the sensing platform for real-world applications in flexible and wearable devices.
Overall, these findings highlight that room-temperature probe ultrasonication offers a rapid, scalable, and environmentally friendly route to high-quality ZnO NPs with tunable physicochemical properties. Beyond providing superior performance in styrene detection, the resulting sensors combine high material quality with mechanical durability, environmental stability and consistent electrical properties, establishing a versatile platform for next-generation flexible gas sensors. More broadly, this approach provides a sustainable pathway for producing ZnO nanomaterials that can be extended to other sensing modalities and optoelectronic applications, reinforcing the promise of ultrasonication-assisted synthesis in advancing practical nanotechnology solutions.
Supplementary Materials
The following Supporting Information can be downloaded at https://www.mdpi.com/article/10.3390/chemosensors14010005/s1, Table S1: Summary of Preparation Procedures of ZnO NPs; Table S2: Summarizing various pH conditions used to prepare ZnO NPs, the properties achieved, and their reported applications; Table S3: Summarizing various Zn-salt precursor used to prepare ZnO NPs, the properties achieved, and their reported applications [5,21,22,55,56,57,58,59,60,61,62,63,64,65,66]; Figure S1: represents the resistance response curves of sensors based on P(10) (before calcination) and P(10).C (after calcination) to various gases, demonstrating the selectivity of the sensors.
Author Contributions
Conceptualization, A.A.S. and R.I.; Methodology, F.M., A.A.S., A.A.L.A., M.K., H.A., N.A. and R.I.; Software, M.K.; Validation, F.M., A.A.S., A.A.L.A., N.A., M.K., H.A., and R.I.; Formal analysis, F.M., A.A.S., A.A.L.A., N.A., H.A., and M.K.; Investigation, F.M., A.A.S., A.A.L.A., N.A., H.A., M.K. and R.I.; Resources, A.A.S. and R.I.; Data curation, F.M., A.A.S., A.A.L.A. and N.A., Writing—original draft, F.M. and A.A.S.; Writing—review and editing, F.M., A.A.S., A.A.L.A., N.A., H.A., M.K. and R.I.; Visualization, F.M., A.A.S. and R.I.; Supervision, A.A.S. and R.I.; Project administration, A.A.S. and R.I.; Funding acquisition, R.I. All authors have read and agreed to the published version of the manuscript.
Funding
This research was funded by the Natural Sciences and Engineering Research Council of Canada (NSERC), grant number RGPIN-2023-05211, and MITACS, Canada, grant number IT31938.
Institutional Review Board Statement
Not applicable. This research did not involve humans or animals.
Informed Consent Statement
Not applicable for studies not involving humans.
Data Availability Statement
The research data are available upon request.
Acknowledgments
The authors are grateful for the generous funding support provided by the Natural Sciences and Engineering Research Council of Canada (NSERC) and MITACS, Canada, which made this research possible. Additionally, the authors would like to acknowledge the invaluable support and resources provided by the Research centers of NanoQAM (Centre de Recherche sur les Nanomateriaux et l’Énergie), LACIME (Laboratoire de communications et d’intégration de la microélectronique), CQMF (Centre Quebecois sur les materiaux fonctionnels) and RESMIQ (Regroupement stratégique en microsystèmes du Québec). Their contributions were instrumental in the successful completion of this study.
Conflicts of Interest
The authors affirm that there are no conflicts of interest to disclose, both with the manuscript and concerning the company of Nextron microprobe station.
Abbreviations
The following abbreviations are used in this manuscript:
| ZnO NPs | Zinc oxide nanoparticles |
| RH | Relative humidity |
| SEM | Scanning electron microscopy |
| DLS | Dynamic light scattering |
| BET | Brunauer–Emmett–Teller (surface area analysis) |
| TGA | Thermogravimetric analysis |
| FTIR | Fourier transform infrared spectroscopy |
| UV-Vis | Ultraviolet–visible spectroscopy |
| Eg | Band gap energy |
| PET | Polyethylene terephthalate |
| PS | Polystyrene |
| Gt | Graphite |
| MeOH | Methanol |
| DI | Deionized (water) |
| ZnAc | Zinc acetate |
| ZnNO3 | Zinc nitrate |
| ZnSO4 | Zinc sulfate |
| P(x) | Probe-sonicated ZnO (x = sonication time) |
| P(x).C | Probe-sonicated ZnO, calcined |
| B2h | Bath-sonicated ZnO (2 h) |
| B2h.C | Bath-sonicated ZnO, calcined |
| LO | Longitudinal optical (phonon mode in Raman) |
| E1(LO) | E1 longitudinal optical (Raman mode) |
| E2(M) | E2 medium (Raman mode) |
| C3H6O | Acetone |
| NH3 | Ammonia |
| (C2H5)3N | Triethylamine |
| C2H4O2 | Acetic acid |
| ppm | Parts per million |
| °C | Degrees Celsius |
| nm | Nanometer |
| m2 g−1 | Square meters per gram |
| mL | Milliliter |
| µL | Microliter |
| wt% | Weight percent |
| kΩ | Kilo-ohm (resistance) |
References
- Raha, S.; Ahmaruzzaman, M. ZnO Nanostructured Materials and Their Potential Applications: Progress, Challenges and Perspectives. Nanoscale Adv. 2022, 4, 1868–1925. [Google Scholar] [CrossRef] [PubMed]
- Kołodziejczak-Radzimska, A.; Jesionowski, T. Zinc Oxide—From Synthesis to Application: A Review. Materials 2014, 7, 2833–2881. [Google Scholar] [CrossRef]
- Sirelkhatim, A.; Mahmud, S.; Seeni, A.; Kaus, N.H.M.; Ann, L.C.; Bakhori, S.K.M.; Hasan, H.; Mohamad, D. Review on Zinc Oxide Nanoparticles: Antibacterial Activity and Toxicity Mechanism. Nano-Micro Lett. 2015, 7, 219–242. [Google Scholar] [CrossRef]
- Wang, Z.L. Zinc Oxide Nanostructures: Growth, Properties and Applications. J. Phys. Condens. Matter 2004, 16, R829–R858. [Google Scholar] [CrossRef]
- Dey, S.; lochan Mohanty, D.; Divya, N.; Bakshi, V.; Mohanty, A.; Rath, D.; Das, S.; Mondal, A.; Roy, S.; Sabui, R. A Critical Review on Zinc Oxide Nanoparticles: Synthesis, Properties and Biomedical Applications. Intell. Pharm. 2025, 3, 53–70. [Google Scholar] [CrossRef]
- Arya, S.; Mahajan, P.; Mahajan, S.; Khosla, A.; Datt, R.; Gupta, V.; Young, S.-J.; Oruganti, S.K. Review—Influence of Processing Parameters to Control Morphology and Optical Properties of Sol-Gel Synthesized ZnO Nanoparticles. ECS J. Solid State Sci. Technol. 2021, 10, 023002. [Google Scholar] [CrossRef]
- Mandal, A.K.; Katuwal, S.; Tettey, F.; Gupta, A.; Bhattarai, S.; Jaisi, S.; Bhandari, D.P.; Shah, A.K.; Bhattarai, N.; Parajuli, N. Current Research on Zinc Oxide Nanoparticles: Synthesis, Characterization, and Biomedical Applications. Nanomaterials 2022, 12, 3066. [Google Scholar] [CrossRef]
- Pei, J.; Natarajan, P.M.; Umapathy, V.R.; Swamikannu, B.; Sivaraman, N.M.; Krishnasamy, L.; Palanisamy, C.P. Advancements in the Synthesis and Functionalization of Zinc Oxide-Based Nanomaterials for Enhanced Oral Cancer Therapy. Molecules 2024, 29, 2706. [Google Scholar] [CrossRef] [PubMed]
- Mutukwa, D.; Taziwa, R.; Khotseng, L.E. A Review of the Green Synthesis of ZnO Nanoparticles Utilising Southern African Indigenous Medicinal Plants. Nanomaterials 2022, 12, 3456. [Google Scholar] [CrossRef] [PubMed]
- Sivasankarapillai, V.S.; Krishnamoorthy, N.; Eldesoky, G.E.; Wabaidur, S.M.; Islam, M.A.; Dhanusuraman, R.; Ponnusamy, V.K. One-Pot Green Synthesis of ZnO Nanoparticles Using Scoparia Dulcis Plant Extract for Antimicrobial and Antioxidant Activities. Appl. Nanosci. 2023, 13, 6093–6103. [Google Scholar] [CrossRef]
- Tazim, T.Q.; Kawsar, M.; Sahadat Hossain, M.; Bahadur, N.M.; Ahmed, S. Hydrothermal Synthesis of Nano-Metal Oxides for Structural Modification: A Review. Next Nanotechnol. 2025, 7, 100167. [Google Scholar] [CrossRef]
- Ndlwana, L.; Raleie, N.; Dimpe, K.M.; Ogutu, H.F.; Oseghe, E.O.; Motsa, M.M.; Msagati, T.A.M.; Mamba, B.B. Sustainable Hydrothermal and Solvothermal Synthesis of Advanced Carbon Materials in Multidimensional Applications: A Review. Materials 2021, 14, 5094. [Google Scholar] [CrossRef] [PubMed]
- Drdova, S.; Gao, M.; Sambalova, O.; Pauer, R.; Zhou, Z.; Dimitriadou, S.; Schmidt-Ott, A.; Wang, J. Precursor- and Waste-Free Synthesis of Spark-Ablated Nanoparticles with Enhanced Photocatalytic Activity and Stability towards Airborne Organic Pollutant Degradation. Environ. Sci. Nano 2024, 11, 1023–1043. [Google Scholar] [CrossRef]
- Donia, D.T.; Bauer, E.M.; Missori, M.; Roselli, L.; Cecchetti, D.; Tagliatesta, P.; Gontrani, L.; Carbone, M. Room Temperature Syntheses of ZnO and Their Structures. Symmetry 2021, 13, 733. [Google Scholar] [CrossRef]
- Bouttier-Figueroa, D.C.; Cortez-Valadez, M.; Flores-Acosta, M.; Robles-Zepeda, R.E. Green Synthesis of Zinc Oxide Nanoparticles Using Plant Extracts and Their Antimicrobial Activity. Bionanoscience 2024, 14, 3385–3400. [Google Scholar] [CrossRef]
- Amin, G.; Asif, M.H.; Zainelabdin, A.; Zaman, S.; Nur, O.; Willander, M. Influence of PH, Precursor Concentration, Growth Time, and Temperature on the Morphology of ZnO Nanostructures Grown by the Hydrothermal Method. J. Nanomater. 2011, 2011, 1–9. [Google Scholar] [CrossRef]
- Mechai, F.; Al Shboul, A.; Bensidhoum, M.O.; Anabestani, H.; Ketabi, M.; Izquierdo, R. Influence of PH on Room-Temperature Synthesis of Zinc Oxide Nanoparticles for Flexible Gas Sensor Applications. Chemosensors 2024, 12, 83. [Google Scholar] [CrossRef]
- Mirhosseini, F.; Amiri, M.; Daneshkazemi, A.; Zandi, H.; Javadi, Z.S. Antimicrobial Effect of Different Sizes of Nano Zinc Oxide on Oral Microorganisms. Front. Dent. 2019. [Google Scholar] [CrossRef]
- Naqvi, Q.-A.; Kanwal, A.; Qaseem, S.; Naeem, M.; Ali, S.R.; Shaffique, M.; Maqbool, M. Size-Dependent Inhibition of Bacterial Growth by Chemically Engineered Spherical ZnO Nanoparticles. J. Biol. Phys. 2019, 45, 147–159. [Google Scholar] [CrossRef]
- Wong, K.K.; Ng, A.; Chen, X.Y.; Ng, Y.H.; Leung, Y.H.; Ho, K.H.; Djurišić, A.B.; Ng, A.M.C.; Chan, W.K.; Yu, L.; et al. Effect of ZnO Nanoparticle Properties on Dye-Sensitized Solar Cell Performance. ACS Appl. Mater. Interfaces 2012, 4, 1254–1261. [Google Scholar] [CrossRef] [PubMed]
- Gatou, M.-A.; Lagopati, N.; Vagena, I.-A.; Gazouli, M.; Pavlatou, E.A. ZnO Nanoparticles from Different Precursors and Their Photocatalytic Potential for Biomedical Use. Nanomaterials 2022, 13, 122. [Google Scholar] [CrossRef]
- Pourrahimi, A.M.; Liu, D.; Pallon, L.K.H.; Andersson, R.L.; Martínez Abad, A.; Lagarón, J.-M.; Hedenqvist, M.S.; Ström, V.; Gedde, U.W.; Olsson, R.T. Water-Based Synthesis and Cleaning Methods for High Purity ZnO Nanoparticles – Comparing Acetate, Chloride, Sulphate and Nitrate Zinc Salt Precursors. RSC Adv. 2014, 4, 35568–35577. [Google Scholar] [CrossRef]
- Hossain, M.M.; Islam, M.A.; Shima, H.; Hasan, M.; Hilal, M.; Lee, M. Recrystallization Techniques for the Synthesis of ZnO Nanorods: An in Situ Process for Carbon Doping and Enhancing the Dispersion Concentration of ZnO Nanorods. RSC Adv. 2018, 8, 16927–16936. [Google Scholar] [CrossRef]
- Tonto, P.; Mekasuwandumrong, O.; Phatanasri, S.; Pavarajarn, V.; Praserthdam, P. Preparation of ZnO Nanorod by Solvothermal Reaction of Zinc Acetate in Various Alcohols. Ceram. Int. 2008, 34, 57–62. [Google Scholar] [CrossRef]
- Al-Rasheedi, A.; Alonizan, N.H.; Aida, M.S. Effect of Zinc Nitrate Concentration on the Morphology of ZnO Nanostructures Grown by Hydrothermal Method. Phys. Status Solidi 2023, 220, 2200905. [Google Scholar] [CrossRef]
- Meroni, D.; Gasparini, C.; Di Michele, A.; Ardizzone, S.; Bianchi, C.L. Ultrasound-Assisted Synthesis of ZnO Photocatalysts for Gas Phase Pollutant Remediation: Role of the Synthetic Parameters and of Promotion with WO3. Ultrason. Sonochem. 2020, 66, 105119. [Google Scholar] [CrossRef] [PubMed]
- Sharifalhoseini, Z.; Entezari, M.H.; Shahidi, M. Sonication Affects the Quantity and the Morphology of ZnO Nanostructures Synthesized on the Mild Steel and Changes the Corrosion Protection of the Surface. Ultrason. Sonochem. 2018, 41, 492–502. [Google Scholar] [CrossRef] [PubMed]
- Barreto, G.P.; Morales, G.; Quintanilla, M.L.L. Microwave Assisted Synthesis of ZnO Nanoparticles: Effect of Precursor Reagents, Temperature, Irradiation Time, and Additives on Nano-ZnO Morphology Development. J. Mater. 2013, 2013, 1–11. [Google Scholar] [CrossRef]
- ul Hassan Sarwar Rana, A.; Kang, M.; Kim, H.-S. Microwave-Assisted Facile and Ultrafast Growth of ZnO Nanostructures and Proposition of Alternative Microwave-Assisted Methods to Address Growth Stoppage. Sci. Rep. 2016, 6, 24870. [Google Scholar] [CrossRef]
- Kaningini, A.G.; Azizi, S.; Sintwa, N.; Mokalane, K.; Mohale, K.C.; Mudau, F.N.; Maaza, M. Effect of Optimized Precursor Concentration, Temperature, and Doping on Optical Properties of ZnO Nanoparticles Synthesized via a Green Route Using Bush Tea ( Athrixia Phylicoides DC.) Leaf Extracts. ACS Omega 2022, 7, 31658–31666. [Google Scholar] [CrossRef]
- Cho, M.Y.; Kim, M.S.; Yim, K.G.; Lee, D.-Y.; Kim, J.S.; Kim, J.S.; Leem, J.-Y. Effects of Precursor Concentrations and Thermal Annealing on ZnO Nanorods Grown by Hydrothermal Method. J. Nanosci. Nanotechnol. 2011, 11, 7479–7482. [Google Scholar] [CrossRef]
- Kamarulzaman, N.; Kasim, M.F.; Rusdi, R. Band Gap Narrowing and Widening of ZnO Nanostructures and Doped Materials. Nanoscale Res. Lett. 2015, 10, 346. [Google Scholar] [CrossRef] [PubMed]
- Salah, N.; Habib, S.S.; Khan, Z.H.; Memic, A.; Azam, A.; Alarfaj, E. Habib High-Energy Ball Milling Technique for ZnO Nanoparticles as Antibacterial Material. Int. J. Nanomedicine 2011, 6, 863. [Google Scholar] [CrossRef]
- Al-Ariki, S.; Yahya, N.A.A.; Al-A’nsi, S.A.; Jumali, M.H.H.; Jannah, A.N.; Abd-Shukor, R. Synthesis and Comparative Study on the Structural and Optical Properties of ZnO Doped with Ni and Ag Nanopowders Fabricated by Sol Gel Technique. Sci. Rep. 2021, 11, 11948. [Google Scholar] [CrossRef]
- Al Shboul, A.M.; Ketabi, M.; Mechael, S.S.; Nyayachavadi, A.; Rondeau-Gagné, S.; Izquierdo, R. Hydrogen Sulfide Gas Detection in Ppb Levels at Room Temperature with a Printed, Flexible, Disposable In 2 O 3 NPs-Based Sensor for IoT Food Packaging Applications. Adv. Mater. Technol. 2023, 8, 2201086. [Google Scholar] [CrossRef]
- Al Shboul, A.M.; Izquierdo, R. Printed Chemiresistive In 2 O 3 Nanoparticle-Based Sensors with Ppb Detection of H 2 S Gas for Food Packaging. ACS Appl. Nano Mater. 2021, 4, 9508–9517. [Google Scholar] [CrossRef]
- Al Shboul, A.; Shih, A.; Izquierdo, R. A Flexible Indium Oxide Sensor With Anti-Humidity Property for Room Temperature Detection of Hydrogen Sulfide. IEEE Sens. J. 2021, 21, 9667–9674. [Google Scholar] [CrossRef]
- Saidani, A.; Boudraa, R.; Fendi, K.; Benouadah, L.; Benabbas, A.; Djermoune, A.; Salvestrini, S.; Bollinger, J.-C.; Alayyaf, A.; Mouni, L. Effect of Calcination Temperature on the Photocatalytic Activity of Precipitated ZnO Nanoparticles for the Degradation of Rhodamine B Under Different Light Sources. Water 2024, 17, 32. [Google Scholar] [CrossRef]
- Sharbatdaran, M.; Janbazi, M. Effect of Temperature on the Structure, Catalyst and Magnetic Properties of Un-Doped Zinc Oxide Nanoparticles: Experimental and DFT Calculation. RSC Adv. 2024, 14, 31153–31164. [Google Scholar] [CrossRef]
- Aga, K.W.; Efa, M.T.; Beyene, T.T. Effects of Sulfur Doping and Temperature on the Energy Bandgap of ZnO Nanoparticles and Their Antibacterial Activities. ACS Omega 2022, 7, 10796–10803. [Google Scholar] [CrossRef]
- Zhang, H.; Chen, W.-G.; Li, Y.-Q.; Song, Z.-H. Gas Sensing Performances of ZnO Hierarchical Structures for Detecting Dissolved Gases in Transformer Oil: A Mini Review. Front. Chem. 2018, 6, 508. [Google Scholar] [CrossRef]
- Zhang, L.; Yin, M.; Qiu, J.; Qiu, T.; Chen, Y.; Qi, S.; Wei, X.; Tian, X.; Xu, D. Mesoporous ZnO Nanosheet as Gas Sensor for Sensitive Triethylamine Detection. Anal. Bioanal. Chem. 2022, 414, 2181–2188. [Google Scholar] [CrossRef]
- Agarwal, S.; Kumar, S.; Agrawal, H.; Moinuddin, M.G.; Kumar, M.; Sharma, S.K.; Awasthi, K. An Efficient Hydrogen Gas Sensor Based on Hierarchical Ag/ZnO Hollow Microstructures. Sens. Actuators B Chem. 2021, 346, 130510. [Google Scholar] [CrossRef]
- Li, Y.; Zhao, F.-X.; Lian, X.-X. Enhanced Gas-Sensing Performance of Au-Modified ZnO Nanoparticles Synthesized Using Bamboo Cellulose as a Template. Mater. Sci. 2016, 34, 708–714. [Google Scholar] [CrossRef]
- Andre, R.; Kwak, D.; Dong, Q.; Zhong, W.; Correa, D.; Mattoso, L.; Lei, Y. Sensitive and Selective NH3 Monitoring at Room Temperature Using ZnO Ceramic Nanofibers Decorated with Poly(Styrene Sulfonate). Sensors 2018, 18, 1058. [Google Scholar] [CrossRef]
- Kwon, Y.M.; Son, Y.; Lee, D.H.; Lim, M.H.; Han, J.K.; Jang, M.; Park, S.; Kang, S.; Yim, S.; Myung, S.; et al. Enhancing Selectivity and Sensitivity in Gas Sensors through Noble Metal-Decorated ZnO and Machine Learning. Appl. Surf. Sci. 2025, 693, 162750. [Google Scholar] [CrossRef]
- Saluja, A.; Pan, J.; Kerr, L.; Cho, E.; Hubbard, S. Gas Sensing Properties of Porous ZnO Nano-Platelet Films. MRS Proc. 2007, 1035, 1035-L11-07. [Google Scholar] [CrossRef]
- Qi, G.; Zhang, L.; Yuan, Z. Improved H 2 S Gas Sensing Properties of ZnO Nanorods Decorated by a Several Nm ZnS Thin Layer. Phys. Chem. Chem. Phys. 2014, 16, 13434–13439. [Google Scholar] [CrossRef]
- Ao, D.; Li, Z.; Fu, Y.; Tang, Y.; Yan, S.; Zu, X. Heterostructured NiO/ZnO Nanorod Arrays with Significantly Enhanced H2S Sensing Performance. Nanomaterials 2019, 9, 900. [Google Scholar] [CrossRef] [PubMed]
- Kumar, R.; Al-Dossary, O.; Kumar, G.; Umar, A. Zinc Oxide Nanostructures for NO2 Gas–Sensor Applications: A Review. Nano-Micro Lett. 2015, 7, 97–120. [Google Scholar] [CrossRef] [PubMed]
- Li, W.; Chen, R.; Qi, W.; Cai, L.; Sun, Y.; Sun, M.; Li, C.; Yang, X.; Xiang, L.; Xie, D.; et al. Reduced Graphene Oxide/Mesoporous ZnO NSs Hybrid Fibers for Flexible, Stretchable, Twisted, and Wearable NO 2 E-Textile Gas Sensor. ACS Sens. 2019, 4, 2809–2818. [Google Scholar] [CrossRef] [PubMed]
- Zhu, C.; Zhou, T.; Xia, H.; Zhang, T. Flexible Room-Temperature Ammonia Gas Sensors Based on PANI-MWCNTs/PDMS Film for Breathing Analysis and Food Safety. Nanomaterials 2023, 13, 1158. [Google Scholar] [CrossRef]
- Liu, L.; Zhang, D.; Zhang, Q.; Chen, X.; Xu, G.; Lu, Y.; Liu, Q. Smartphone-Based Sensing System Using ZnO and Graphene Modified Electrodes for VOCs Detection. Biosens. Bioelectron. 2017, 93, 94–101. [Google Scholar] [CrossRef]
- Al Shboul, A.; Ketabi, M.; Ngai, J.H.L.; Skaf, D.; Rondeau-Gagné, S.; Izquierdo, R. Fully Printed Flexible Polystyrene/Graphite-Based Temperature Sensor with Excellent Properties for Potential Smart Applications. ACS Omega 2025, 10, 3878–3889. [Google Scholar] [CrossRef]
- Thorat, A.; Kasabe, S.; Ahire, B.; Kate, A.; Amalnerkar, D. Synthesis, Characterization of ZnO Nanoparticles and the Impact of Changing the Proportion of Precursor on their Morphology, Average Formation, and Its Antimicrobial activity. Orient. J. Chem. 2025, 41, 178–184. [Google Scholar] [CrossRef]
- Qu, B.; Xiao, Z.; Luo, Y. Sustainable nanotechnology for food preservation: Synthesis, mechanisms, and applications of zinc oxide nanoparticles. J. Agric. Food Res. 2025, 19, 101743. [Google Scholar] [CrossRef]
- Hussien, N.A.; Khalil, M.A.E.F.; Schagerl, M.; Ali, S.S. Green Synthesis of Zinc Oxide Nanoparticles as a Promising Nanomedicine Approach for Anticancer, Antibacterial, and Anti-Inflammatory Therapies. Int. J. Nanomed. 2025, 20, 4299–4317. [Google Scholar] [CrossRef]
- Mahajan, M.; Kumar, A.; Gaur, J.; Kaushal, S.; Dalal, J.; Singh, G.; Misra, M.; Ahlawat, D.S. Green synthesis of ZnO nanoparticles using Justicia adhatoda for photocatalytic degradation of malachite green and reduction of 4-nitrophenol. RSC Adv. 2025, 15, 2958–2980. [Google Scholar] [CrossRef]
- Singh, K.; Yadav, S. Biosynthesis of a range of ZnO nanoparticles utilising Salvia hispanica L. seed extract and evaluation of their bioactivity. Sci. Rep. 2025, 15, 4043. [Google Scholar] [CrossRef] [PubMed]
- Arif, H.; Qayyum, S.; Akhtar, W.; Fatima, I.; Kayani, W.K.; Rahman, K.U.; Al-Onazi, W.A.; Al-Mohaimeed, A.M.; Bangash, N.K.; Ashraf, N.; et al. No Title Synthesis and Characterization of Zinc Oxide Nanoparticles at Different pH Values from Clinopodium vulgare L. and Their Assessment as an Antimicrobial Agent and Biomedical Application. Micromachines 2023, 14, 1285. [Google Scholar] [CrossRef] [PubMed]
- XZhou, X.Q.; Hayat, Z.; Zhang, D.D.; Li, M.Y.; Hu, S.; Wu, Q.; Cao, Y.F.; Yuan, Y. Zinc Oxide Nanoparticles: Synthesis, Characterization, Modification, and Applications in Food and Agriculture. Processes 2023, 11, 1193. [Google Scholar] [CrossRef]
- Blinov, A.V.; Kachanov, M.D.; Gvozdenko, A.A.; Nagdalian, A.A.; Blinova, A.A.; Rekhman, Z.A.; Golik, A.B.; Vakalov, D.S.; Maglakelidze, D.G.; Nagapetova, A.G.; et al. Synthesis and Characterization of Zinc Oxide Nanoparticles Stabilized with Biopolymers for Application in Wound-Healing Mixed Gels. Gels 2023, 9, 57. [Google Scholar] [CrossRef] [PubMed]
- Cervantes-Gaxiola, M.; Vázquez-González, F.; Rios-Iribe, E.; Méndez-Herrera, P.; Leyva, C. Effect of pH on the green synthesis of ZnO nanoparticles using Sorghum bicolor seed extract and their application in photocatalytic dye degradation. Mater. Lett. 2024, 372, 136982. [Google Scholar] [CrossRef]
- Droepenu, E.K.; Wee, B.S.; Chin, S.F.; Kok, K.Y.; Maligan, M.F. Zinc oxide nanoparticles synthesis methods and its effect on morphology: A review. Biointerface Res. Appl. Chem. 2021, 12, 4261–4292. [Google Scholar] [CrossRef]
- Raj, C.J.; Joshi, R.K.; Varma, K.B.R. Synthesis from zinc oxalate, growth mechanism and optical properties of ZnO nano/micro structures. Cryst. Res. Technol. 2011, 46, 1181–1188. [Google Scholar] [CrossRef]
- Bhosale, A.S.; Abitkar, K.K.; Sadalage, P.S.; Pawar, K.D.; Garadkar, K.M. Photocatalytic and antibacterial activities of ZnO nanoparticles synthesized by chemical method. J. Mater. Sci. Mater. Electron. 2021, 32, 20510–20524. [Google Scholar] [CrossRef]
Disclaimer/Publisher’s Note: The statements, opinions and data contained in all publications are solely those of the individual author(s) and contributor(s) and not of MDPI and/or the editor(s). MDPI and/or the editor(s) disclaim responsibility for any injury to people or property resulting from any ideas, methods, instructions or products referred to in the content. |
© 2025 by the authors. Licensee MDPI, Basel, Switzerland. This article is an open access article distributed under the terms and conditions of the Creative Commons Attribution (CC BY) license.