Abstract
While pH possesses inherent chemical significance and potential forensic value in Scotch whisky authentication, it has previously lacked a statistically rigorous exclusionary standard. This study addressed this gap by performing statistical distribution fitting analysis on the pH of 32 authentic single malt and 33 authentic blended Scotch whiskies, utilizing the three-parameter lognormal distribution to establish the 99.7% authentic pH ranges for the first time: 3.47–4.46 for single malt and 3.73–4.67 for blended whisky. Validation using seized counterfeit samples confirmed that an abnormally elevated pH serves as critical evidence of adulteration. Consequently, this research proposes the chemically fundamental pH threshold as a rapid, non-destructive, and cost-effective forensic exclusionary criterion. Although the pH value feature alone is insufficient to confirm authenticity, its high operational applicability significantly enhances the efficiency of rapid field screening for counterfeit whisky, strongly supporting law enforcement and food safety efforts in Taiwan.
1. Introduction
The globalization of the alcoholic beverage market, combined with increasing consumer demand for premium products, has significantly increased the scale and profitability of alcoholic beverage fraud offences. High financial incentives and comparatively low perceived legal risks have facilitated the proliferation of these crimes globally [1], resulting in intensified enforcement activities across all continents [2].
Scotch whisky, one of the most famous spirits, is central to this issue. The Scotch Whisky Association’s 2024 Export Report estimated the market value at USD 65.6 billion and projected growth to USD 89.48 billion by 2029 [3]. In Taiwan, Scotch whisky is the most commonly imported whisky category [4], making the domestic market particularly vulnerable to counterfeiting and adulteration.
Fake alcoholic products have been extensively documented worldwide [5], including several significant incidents in Taiwan. Taiwanese police records have documented two primary types of whisky-related fraud schemes. “Adulterated Scotch whisky” is typically sold under prominent brand labels at premium prices and consists of a minor proportion of authentic Scotch whisky blended with neutral spirits, water, and artificial flavourings. In contrast, “Counterfeit Scotch whisky” is marketed under obscure labels at lower prices, consisting predominantly of neutral spirits with minimal or no authentic whisky content. As neither product complies with statutory production standards, each exhibits measurable compositional anomalies that can be analytically utilized as authentication markers [6,7].
In authenticity verification, counterfeiters often imitate the features of authentic samples to mislead law enforcement officers. However, the more discriminating features are employed, the greater the likelihood of detecting inconsistencies that reveal non-authenticity. Previous studies have recommended employing various analytical techniques and methods to differentiate suspicious from authentic samples. These differences may include single compounds, various compounds, selected multiple compounds, and elemental compositions [8]. Authentication reliability increases with the number of meaningful differences utilized—including reasonable methanol content [9,10,11], ethanol stable isotope ratios [12,13], water δ2H/δ18O values [14], semi-quantitative congener profiles [15], oak extractives [16,17,18], spectroscopic patterns [19,20], and element concentrations [21]—to discriminate authentic whiskies from fraudulent ones, as shown in Table 1. Consequently, the evidential value of the assessment is strengthened by establishing a greater number of meaningful differences [22] between questioned and authentic reference samples. In forensic science, there is a growing emphasis on rapid and non-destructive on-site testing techniques. In the whisky field, Raman spectroscopy has been demonstrated as one such rapid, cost-effective, and non-destructive tool for reliable identification [11,16]. However, studies employing these fast, non-destructive approaches remain relatively limited; therefore, the present study aims to establish a rapid and simple analytical method based on pH measurement.

Table 1.
Meaningful differences in features for fake Scotch whisky identification.
Although pH is routinely monitored as part of distillery process control [23] and serves as an integrated indicator of the acid–base strength of the whisky, it specifically represents the negative logarithm of the hydrogen ion concentration in solution. As such, it reflects the impact of key production steps—such as distillation, maturation, and dilution—on the chemical composition of the final product. Due to its clear chemical significance, pH holds potential value as a discriminating feature in authenticity verification. While pH is a routinely monitored parameter in whisky production, no previously published research has established statistically derived decision criteria to objectively utilize pH as an authentication feature in forensic whisky examinations. Authentic Scotch whiskies consistently exhibit acidic pH values, typically ranging from 3.5 to 4.5 [24]. In contrast, fake products reportedly span a much broader range, from 2.79 to 8.70, covering both acidic and alkaline conditions, depending on the process used to create the fake [25]. Production protocols for authentic Scotch whisky are strictly regulated, resulting in products with consistently acidic pH values within a narrow and well-defined range. Even though experimental data on counterfeit samples exist, no previously published research has established statistically derived decision criteria to objectively utilize pH as an authentication feature in forensic whisky examinations.
This study focuses on addressing this research gap. According to the 2009 Scotch Whisky Regulations [26], the production of Scotch whisky is subject to strict requirements designed to safeguard its quality and authenticity. These regulations govern key aspects of the manufacturing process, including ingredients, distillation, maturation, and bottling, to ensure compliance with the legal definition of Scotch whisky. For this work, Scotch whisky samples seized in Taiwan and verified as authentic were collected, along with suspected counterfeit samples that had intact packaging to minimize environmental influences such as moisture evaporation and gas exchange on pH measurements. By integrating these findings with suitable statistical modelling, we propose a practical pH-based assessment framework that can be incorporated into a multi-feature authentication scheme, thus improving the evidential reliability of whisky authentication in forensic investigations. While multi-parameter models generally provide greater robustness in whisky authentication, this study focuses specifically on the forensic value of pH as an exclusionary marker for non-authentic samples. Rather than confirming authenticity, the goal is to establish a chemically meaningful pH threshold that can rapidly and non-destructively eliminate suspect samples that fall significantly outside the distribution of authentic Scotch whisky. This represents a practical tool for preliminary screening, especially in enforcement contexts where time and resources are limited. In this context, this study focuses on pH as one accessible discriminating feature with exclusion potential.
2. Materials and Methods
2.1. Preparation of Scotch Whisky Samples
Verified reference materials were obtained by directly importing authentic Scotch whisky from Scotland and purchasing additional bottles through legally authorized retailers in Taiwan. A total of 65 authentic Scotch whisky samples were obtained, comprising 32 single malt and 33 blended Scotch whisky samples, as shown in Table 2. This sample size exceeds the 30-sample rule of thumb in the Central Limit Theorem. Our screening criteria are derived from Scotch whisky samples that comply with the Scotch Whisky Regulations 2009, and are not intended to cover all types of whisky produced worldwide. To ensure that the reference set was representative and covered the typical variability of authentic Scotch whisky, all reference products were selected from different brands or from different vintages of the same brand. The 32 single malt Scotch whisky samples were all from distinct brand–vintage combinations, including Ardbeg, Auchentoshan, Bowmore, Bunnahabhain, Deanston, Glenlivet, Glenfiddich, Glenmorangie, Macallan, Singleton, and others, and comprised expressions finished in Port casks, Sherry casks, as well as various age statements. The 33 blended Scotch whisky samples included products such as Chivas Regal, Bell’s, High Commissioner, Dewar’s, Johnnie Walker Black Label, Matisse Old, Prime Blue, The Famous Grouse, and others.
Table 2.
Statistical properties of pH values observed in this work.
For forensic case comparison, 15 suspect whisky samples seized by Taiwanese law enforcement authorities were concurrently analyzed. These samples were confirmed to be fake Scotch whisky. Based on the labelling claims on the bottles, we classified the samples into three fake single malt whiskies (S1, S2, S3) and ten fake blended Scotch whiskies (S4 to S10, S12, S13, S15). Additionally, two samples, S11 and S14, were identified as samples with no observed brand labels, as shown in Table 3. To better understand the effects of maturation on pH values, the sample set was further augmented with three “new-make” spirits (freshly distilled, unmatured spirits) and four “aged” spirits that had completed full cask maturation but had not been blended or bottled, as shown in Table 2.
Table 3.
Fake Scotch whisky samples seized in Taiwan.
We diluted 98.5% ABV neutral spirits with water to obtain a 40% ABV solution, and then added varying proportions of authentic Scotch whisky (Singleton 12 years), ranging from 0% to 100%, resulting in a total of 13 measurement points, as shown in Table 4.
Table 4.
Simulated homemade counterfeit whisky at different mixing ratios.
2.2. pH Meter Analysis
A Clean L’EAU bench-top pH meter (model PH-200, Clean L’eau Instruments Co., Ltd., Taoyuan, Taiwan), equipped with a glass combination electrode containing a sealed Ag/AgCl reference and filled with a 3 M KCl solution, was employed for all pH measurements. Daily calibration was conducted at 25 °C using a three-point calibration protocol with NIST-traceable buffer solutions (pH 4.01, 7.00, and 10.01). After each buffer measurement stabilized, the electrode was rinsed thoroughly with deionized water, gently blotted dry, and then immersed in the subsequent buffer solution. The calibration typically produced a zero potential of approximately 4.0 mV and an electrode slope of 97.6%, both comfortably within the manufacturer’s recommended range (95–105%).
Prior to measurement, whisky samples were gently homogenized by carefully inverting the bottles three times. Approximately 20 mL of each whisky sample was then transferred into a clean glass beaker. The pre-rinsed electrode was immersed in the sample solution, which was gently swirled until the pH reading stabilized within ±0.01 pH units. The stable pH values were then recorded. Although analyzing samples at 40% ABV may involve a risk of systematic error due to alcohol effects, all authentic samples in this study were Scotch whisky produced in accordance with the Scotch Whisky Regulations 2009, and the same analytical procedure and conditions were consistently applied to the seized samples in the subsequent analyses.
2.3. Statistical Analysis
The pH dataset was modelled in Statistical Process Control (SPC v6.0) for Excel (BPI Consulting, LLC, San Antonio, TX, USA). Candidate probability-density functions were fitted, and goodness-of-fit statistics identified the distribution providing the best fit to the data. To corroborate this selection, an Anderson–Darling normality test was applied within the same software; a non-significant result (p > 0.05) indicated failure to reject the null hypothesis of normality.
3. Results
3.1. Reference Scotch Whisky
Authentic single malt Scotch whiskies (n = 32) exhibited a mean pH of 3.88 with a standard deviation of 0.17 (range: 3.53–4.36). Authentic blended Scotch whiskies (n = 33) were slightly less acidic, showing a mean pH of 4.04 and a standard deviation of 0.15 (range: 3.77–4.50). This difference is attributable to production methods and maturation: single malts are distilled in pot stills, which retain more volatile acidic compounds, while blended whiskies contain a higher proportion of grain whisky produced by continuous distillation at higher purity, yielding fewer acidic by-products. In addition, the typically longer ageing of single malts promotes the extraction of acidic components from oak casks. Taken together, these factors explain why, on average, single malts are more acidic than blended whiskies in this dataset.
An independent samples t-test was conducted to compare the pH values of authentic single malt (n = 32) and blended (n = 33) Scotch whiskies. The test yielded t = 4.16, p = 1.0 × 10⁻⁴ (α = 0.05), indicating a statistically significant difference between the two groups. As a result, subsequent analyses treat single malt and blend Scotch whiskies as distinct populations. Exploratory density plots further confirmed that the pH values of single malts approximate a Gaussian distribution (Figure 1a), whereas the blended whisky data exhibit moderate right skewness (Figure 2a), supporting the use of separate statistical modelling approaches. To further investigate the statistical characteristics of the blended Scotch whisky dataset, a logarithmic transformation was applied to the pH values. The transformed data exhibited a distribution closely approximating normality. This finding supports the hypothesis that the pH values of blended Scotch whisky are well-described by either a lognormal or a three-parameter lognormal distribution, as illustrated in Figure 2c.
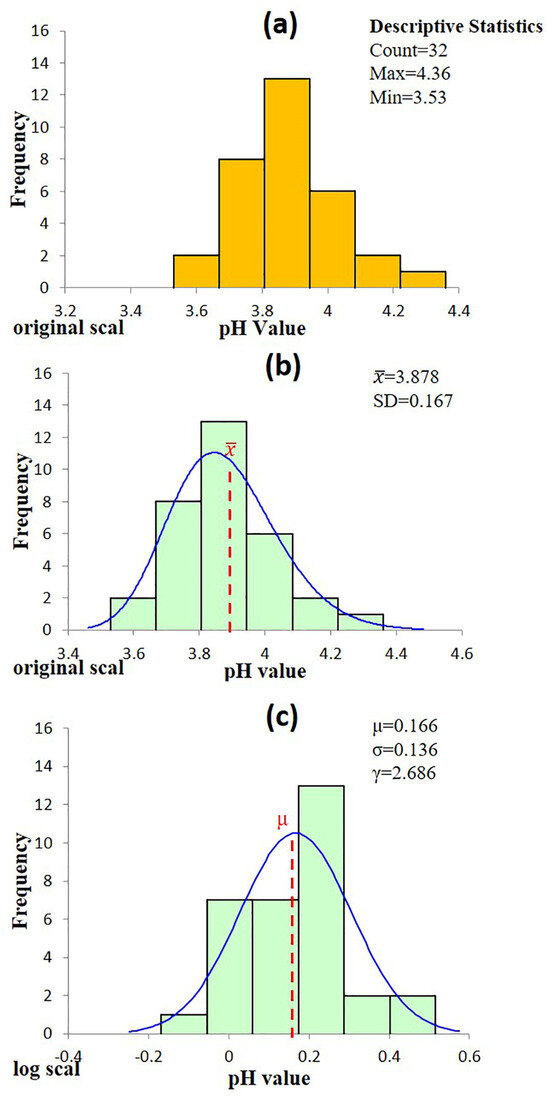
Figure 1.
Statistics analysis of pH values for authentic single malt Scotch whisky (a) Histogram of the raw data. (b) Distribution fitting on the original scale shows that the data conform to a three-parameter lognormal distribution. (c) Distribution fitting on the log-transformed scale shows that the data conform to a normal distribution.
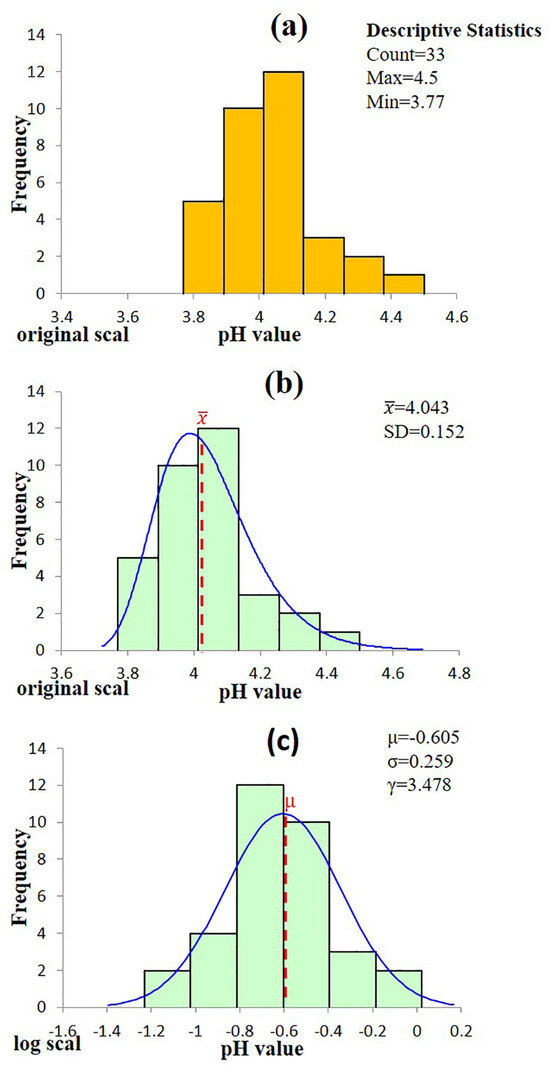
Figure 2.
Statistics analysis of pH value for authentic blended Scotch whisky (a) Histogram of the raw data. (b) Distribution fitting on the original scale shows that the data conform to a three-parameter lognormal distribution. (c) Distribution fitting on the log-transformed scale shows that the data conform to a normal distribution.
3.2. Fake Scotch Whisky
Fake samples were seized by law enforcement agencies across multiple independent operations, rather than from a single production batch; consequently, these fake data were not subjected to formal statistical distribution analysis. Samples were classified based on product descriptions provided on seized labels. Three samples labelled as single malt Scotch whisky yielded pH values of 3.96, 4.11, and 4.25 (mean = 4.11, SD = 0.15). In contrast, ten samples labelled as blended Scotch whisky exhibited a broader pH range from 3.88 to 4.76 (mean = 4.36, SD = 0.30), while two samples lacking label information displayed pH values of 6.04 and 4.05, respectively (Table 3). The coefficient of variation (CV) for the fake single malt Scotch whisky samples was 3.6%, while that for the fake blended category was 6.8%, indicating greater variability in the latter. It reflects the differences in source batches and blending practices among the separately seized samples. Among the samples lacking label information, the highest pH value observed across all seized items was from sample S11, which measured 6.04. Finally, due to the limited number of seized samples and their diverse sources, it was not possible to perform a formal statistical analysis of their distribution.
While variations in genuine Scotch whiskies are expected due to factors such as different cask types (e.g., ex-bourbon vs. ex-sherry) and blending practices, the significantly broader coefficient of variation (CV) observed in the counterfeit samples likely stems from the lack of any controlled production standards. The pH values of these fake products are influenced by the random use of diverse, unstable, and unaged components (various neutral spirits, tap water, or chemical agents), which introduces far greater chemical heterogeneity than is found in legally aged products.
3.3. New Make Spirit and Aged Spirit
Three unmatured “new-make” distillates—the Belgian Owl, Kavalan, and Thompson Bros—were analyzed to establish a baseline prior to cask ageing. Their pH readings were 6.48, 5.81, and 5.50 (mean = 5.93, SD = 0.5), all substantially higher than the values observed for bottled reference whiskies. The new-make spirit samples (n = 3) were collected from different distilleries and production batches. Their pH values are influenced by factors such as malt treatment, fermentation duration, and the distillation cuts, resulting in a relatively large standard deviation. In contrast, four cask-matured but as-yet unblended “aged spirit” samples (Aberlour, Johnnie Walker Blue Label, Kavalan Port Cask, and Kavalan Sherry Cask) yielded pH values of 3.41, 4.24, 3.82, and 3.20 (mean = 3.67, SD = 0.46). The clear downward shift in pH after maturation supports the well-documented acidification that occurs during prolonged contact with oak, and highlights the importance of considering the production stage when interpreting pH as an authenticity marker.
3.4. Homemade Counterfeit Whisky
The experimental results show that when the mixture contains only authentic Scotch whisky, the pH value is 3.96. Once the proportion of Scotch whisky decreases to 20%, the pH value increases noticeably and exceeds 4.0. When the proportion decreases further to 6%, the pH value rises above 5.0.
Overall, as the amount of neutral spirits and water increases, the pH value shows a clear upward trend. When the mixture consists entirely of 40% ABV neutral spirits, the pH value reaches 5.82, as shown in Table 4.
4. Discussion
4.1. pH Values of Authentic Scotch Whisky
4.1.1. Distribution of pH Value in Authentic Scotch Whisky
Figure 1a summarizes the pH values measured from 32 authentic single malt Scotch whiskies. Fermentation and early-stage distillation processes, influenced by complex microbial and biochemical interactions, frequently result in data distributions best described by lognormal models [27,28,29,30]. Huang et al. previously identified a similar lognormal distribution in methanol concentrations of Scotch whisky samples [6]. Considering that cask maturation contributes significantly to acid formation, leading to a slightly right-skewed acidity profile, both normal (Gaussian) and lognormal distributions were evaluated against the raw pH data. Goodness-of-fit tests were subsequently applied to determine the most appropriate statistical model, thus ensuring robust statistical authenticity thresholds.
Six candidate probability models were assessed using SPC for Excel, and their goodness-of-fit was evaluated through the Anderson–Darling (AD) test (Table 5). Four distributions—Normal, Lognormal, Three-parameter Lognormal, and Largest Extreme Value—produced p-values substantially greater than the conventional significance threshold of α = 0.05 (0.447, 0.517, 0.527, and 0.190, respectively), signifying no statistically significant deviation from the proposed theoretical distributions [31,32,33]. Conversely, the Smallest Extreme Value and three-parameter Log-Logistic models did not meet this acceptance criterion.
Table 5.
Statistical Model Fitting Test for Single Malt Scotch Whisky Data.
The three-parameter lognormal distribution was identified as the optimal model for describing the single-malt whisky pH data, as it yielded both the highest p-value and the smallest Anderson–Darling (AD) statistic among the six candidate models [34,35,36]. Using maximum-likelihood estimation, the parameters obtained were a threshold (location) parameter γ = 2.686, a log-location parameter μ = 0.166 (representing the mean of ln[x − γ]), and a log-scale parameter σ = 0.136 (representing the standard deviation of ln[x − γ]) (Figure 1b). The notably low AD statistic indicates excellent agreement between the empirical cumulative distribution and the theoretically fitted curve, confirming the suitability of this model for subsequent analysis of the single-malt pH dataset. A probability–probability (P–P) plot evaluates the goodness-of-fit by comparing the empirical cumulative distribution of sample data with a theoretical cumulative distribution. Data points aligning closely with the 45° diagonal indicate an appropriate model fit [37]. As depicted in Figure 3a, the single malt whisky data closely follow this diagonal, confirming the suitability of the selected three-parameter lognormal model.
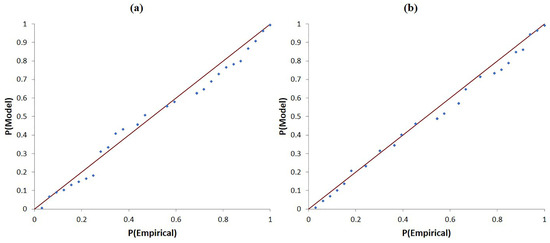
Figure 3.
P-P plot of pH for authentic Scotch whisky in a three-parameter lognormal distribution. (a) Single malt Scotch whiskies. (b) Blended Scotch whiskies.
Similarly, the pH values of 33 authentic blended Scotch whiskies were analyzed, and the resulting histogram (Figure 2a) exhibited a mild right-skewness. Six candidate distributions were fitted using SPC for Excel, and their goodness-of-fit was evaluated with the Anderson–Darling (AD) statistic (Table 6). Four models—the Normal, Lognormal, Three-parameter Lognormal, and Three-parameter Log-Logistic distributions—yielded p-values exceeding the conventional significance threshold of α = 0.05 (0.204, 0.327, 0.899, and 0.053, respectively). Among these, the three-parameter lognormal model demonstrated both the highest p-value and the smallest AD statistic, making it the optimal statistical model. Maximum-likelihood parameter estimation provided a threshold parameter γ = 3.478, a log-location parameter μ = −0.605, and a log-scale parameter σ = 0.259 (Figure 2b). Presenting the data on a logarithmic scale (Figure 2c) effectively resolved the observed skewness, further substantiating the appropriateness of the model selection.
Table 6.
Statistical Model Fitting Test for Blended Whisky Data.
The P–P plot for blended whiskies (Figure 3b) demonstrated strong agreement between the empirical distribution and the theoretical curve, reinforcing the appropriateness of the selected three-parameter lognormal distribution to represent authentic blended Scotch whisky pH values.
4.1.2. pH Distribution and Confidence Intervals in Scotch Whisky
Although a Gaussian distribution is typically preferred due to its mathematical simplicity, the empirical analysis above demonstrates that pH data from both authentic single malt and blended Scotch whiskies are more accurately represented by a three-parameter lognormal distribution. In log-transformed space, confidence intervals are defined as μ ± kσ (where k = 1, 2, 3 correspond to confidence probabilities of 68.3%, 95.5%, and 99.7%, respectively). Converting these intervals back to the original scale yields the ranges γ + e(μ±σ), γ + e(μ±2σ), and γ + e(μ±3σ). Using the maximum-likelihood parameter estimates determined previously, the recommended 99.7% confidence intervals are 3.47–4.46 for single malt whiskies and 3.73–4.67 for blended whiskies (Table 7). Samples with pH values falling outside these ranges warrant closer scrutiny, as their acidity deviates from that expected of authentic Scotch whisky with an approximate probability of 1 in 333.
Table 7.
Confidence intervals for the pH values of authentic single malt and blended Scotch whiskies.
It is noteworthy that although pH measurement is a rapid and convenient method, when routine analyses are performed by non-specialists such as police or customs officers, proper calibration prior to testing is crucial to ensure the accuracy of the results.
4.1.3. Eliminative Authentication of Scotch Whiskies Using Observed pH Confidence Intervals
To evaluate the effectiveness of the exclusion-based authentication method described previously, a total of 15 seized samples were analyzed—comprising three bottles labelled as fake single malt Scotch whisky, ten labelled as fake blended Scotch whisky, and two samples without the clear type. As illustrated in Figure 4a, the pH values of samples S1, S2, and S3 fall within the 99.7% confidence interval established for single malt Scotch whiskies, indicating these cannot be excluded as authentic single malt Scotch whisky.
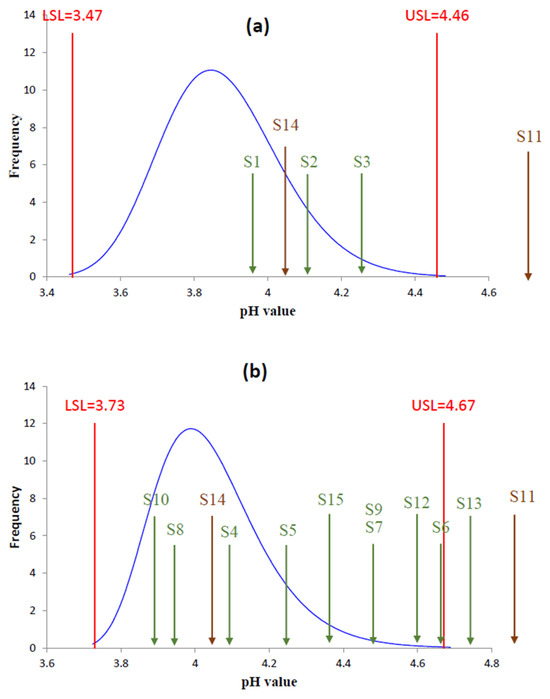
Figure 4.
Mapping result of (a) Fake Scotch whisky S1 to S3, S11, and S14 plotted against the distribution of authentic single malt Scotch whisky. (b) Fake Scotch whisky S4–S15 plotted against the distribution of authentic blended Scotch whisky.
Conversely, the ten fake blended samples were plotted against the 99.7% confidence interval established for authentic blended Scotch whisky, as shown in Figure 4b. Sample S13 (pH 4.76), which is labelled as a blended Scotch whisky, lies just above the 99.7% upper reference limit for authentic blends (4.67). In terms of the fitted distribution, this position corresponds to roughly 4–5 standard deviations above the mean and therefore to the extreme upper tail of the authentic population. The absolute difference of 0.09 pH from the 99.7% limit is modest, and we do not claim that this value alone proves adulteration; rather, it flags the sample as statistically atypical and, when considered together with our controlled dilution experiment (Table 4), suggests a composition closer to a heavily diluted mixture than to a typical blended Scotch whisky. For such borderline cases, pH should be interpreted as a suspicion-raising indicator that must be corroborated by additional analytical features. Samples S4–S10, S12, and S15 fell within the confidence intervals and therefore could not be clearly distinguished, indicating that pH measurements must still be combined with other multi-parameter frameworks for effective application. Therefore, additional identification methods are required to detect meaningful differences [22] and determine their authenticity.
For the two samples lacking clear type (S11 and S14), their pH values were compared against both the 99.7% confidence intervals for single malt and blended Scotch whiskies. Within this known-counterfeit set, sample S11 (pH 6.04) lies far above the upper limits of both reference intervals (4.46 for single malts and 4.67 for blends), even when allowing for a potential systematic bias of 0.1–0.2 pH units in hydro-alcoholic matrices. This makes S11 an unambiguous extreme outlier that is incompatible with properly matured Scotch whisky and is consistent with extensive replacement by neutral spirit and water. It is important to note that when a seized sample is not specified as either single malt or blended Scotch whisky, it must fall outside the confidence intervals of both types to be conclusively identified as fake Scotch whisky. If the seized sample only exceeds the confidence interval of one type, and the label does not indicate whether it is single malt or blended whisky, its authenticity cannot be ruled out. The pH value of sample S14 falls within the reference intervals of both types, and therefore, its authenticity as authentic Scotch whisky cannot be excluded.
However, the inability to exclude a sample from the established confidence interval does not, in itself, constitute definitive evidence of its authenticity as authentic Scotch whisky. Accordingly, additional analytical methodologies or advanced instrumental techniques are required to achieve conclusive verification. The limitation is the lack of cross-validation for multi-parameter analysis, which makes it impossible to provide accurate false negative and false positive rates (i.e., it is impossible to accurately assess how many pH-normal counterfeit products can escape screening). Nevertheless, in light of its methodological simplicity, rapid execution, and cost-efficiency, the pH-based approach proposed in this study represents a practicable and economically viable preliminary screening modality for the presumptive assessment of Scotch whisky authenticity in applied forensic and regulatory settings.
4.2. Modus Operandi of Fake Scotch Whisky
Under the Scotch Whisky Regulations 2009, spirit distilled in Scotland cannot legally be labelled as “whisky” unless it has matured in oak casks for a minimum of three years—a period intended to mellow the harsh sensory profile of new-make spirit and to develop the characteristic flavour of the final product [15,26]. Oak maturation induces a cascade of chemical transformations that collectively influence colour, aroma, and palate [37]. These include the extraction of lignin- and hemicellulose-derived wood constituents [38], the dissolution of trace metal ions [21], the progressive evaporation of ethanol and water (angel’s share), and the in-cask formation of congeners, such as organic acids, esters, aldehydes, and tannins [24]. During the first two years of maturation, the pH typically declines, reflecting a growing concentration of acidic species—acetic acid is predominant, accounting for 50–90% of the volatile-acid fraction [39,40]. Because Scotland’s cool, humid climate favours ethanol loss over water, the alcoholic strength of maturing spirit declines, further accentuating the relative abundance of acid and thus amplifying the downward trend in pH [41].
This study confirms the expected trend: the three new-make distillates exhibited pH values ranging from 5.50 to 5.81, while the four cask-aged spirits showed markedly lower values, between 3.20 and 4.24. The observed decrease in pH, mirroring the classical findings of Liebmann and Rosenblatt (1942), indicates the accumulation of H+ ions as maturation proceeds [39]. Authentic Scotch whiskies that comply with the 2009 Regulations therefore occupy a well-defined acidic range, whereas several seized Taiwanese fake products displayed anomalously elevated pH values.
This strongly suggests that illicit producers added a small amount of authentic Scotch whisky with neutral spirit (>95% v/v ethanol), and subsequently diluted the mixture with excessive amounts of drinking water to adjust the alcohol content to 40% ABV. Since both neutral spirits and water have pH values close to neutral [42,43], their addition results in an overall increase in the pH value, as shown in Table 3. To verify this inference, we conducted a serial dilution experiment, as shown in Table 4, and observed the same pattern. When this finding is considered together with the previously established critical range for authentic single malt Scotch whisky (3.47–4.46), it becomes clear that when the proportion of authentic Scotch whisky in a counterfeit mixture falls below 16%, the resulting pH value is highly likely to fall outside the acceptable range. Therefore, the elevated pH observed in samples S11 and S13 supports the validity of pH as a rapid exclusion feature in whisky forensic identification. This method of mixing a small amount of authentic spirit with neutral alcohol and water has been reported in multiple cases in Taiwan and is not a new occurrence [44,45]. It has also been observed in different types of liquor, such as Kinmen Kaoliang Liquor, one brand of Chinese spirits [46].
5. Conclusions
This study is the first to systematically establish the criteria range for pH measurement and apply it to forensic identification to exclude fake Scotch whisky. It has great value in the application of forensic science. By fitting a three-parameter lognormal distribution to pH data from 32 authentic single malt and 33 authentic blended Scotch whiskies, statistically defined reference intervals of 3.47–4.46 for single malts and 3.73–4.67 for blends were established. These ranges reflect the strict regulatory standards of Scotch whisky production, particularly the roles of cask maturation and controlled dilution, both of which strongly influence acidity.
When applied to 15 seized whisky samples, two were identified as non-authentic. Sample S11, which lacked clear classification as either single malt or blend, had a pH of 6.04, exceeding the upper limits for both categories. Sample S13, labelled as a blend, was also excluded as authentic because its pH of 4.76 exceeded the upper limit of the blended whisky range. These findings illustrate that even a single feature, such as pH, can provide effective exclusionary evidence. The elevated pH values observed are consistent with an adulteration practice documented in Taiwan, in which neutral spirit and water, both near-neutral in pH, are mixed with small amounts of genuine Scotch whisky.
This study shows that, although limited by the small number of seized samples, pH can serve as an exclusionary screening feature for differentiating authentic and counterfeit Scotch whisky, providing a rapid, non-destructive, and straightforward method for analyzing whisky samples seized in Taiwan, with potential contributions to both forensic practice and food safety. Although pH measurement can effectively exclude certain counterfeit products, it has limitations when used alone and cannot fully verify authenticity. For suspicious samples with pH values falling within the reference ranges (e.g., S4–S10, S12, and S15), it is essential to combine pH with more specific analytical techniques (such as spectroscopic methods or isotopic ratio analysis) to achieve final confirmation of authenticity. Future work should include longitudinal monitoring of pH throughout fermentation, distillation, and maturation to better characterize the underlying chemical transformations. In addition, integrating pH with complementary parameters, such as alcohol content, total acidity, congener profiling, stable isotope analysis, spectroscopic techniques, and electrochemical descriptors (e.g., K+/Na+ ion ratios, phenolic/tannin-responsive sensors, or redox potential), and combining the pH screening method with multi-parameter techniques like GC-MS/LC-MS for comprehensive blind testing validation are crucial. This approach will allow for a thorough evaluation of the error rate and significantly enhance the reliability of the authentication conclusions. Furthermore, expanding the reference database to include whiskies from different regions may further improve classification performance and strengthen its forensic applicability.
Author Contributions
Methodology, T.-C.C.; Software, H.-W.H.; Validation, H.-W.H.; Investigation, M.-Y.W.; Writing—original draft, T.-C.C.; Writing—review & editing, T.-C.C.; Visualization, T.-C.C.; Supervision, T.-C.C. and W.-T.C.; Project administration, W.-T.C. All authors have read and agreed to the published version of the manuscript.
Funding
This research received no external funding.
Data Availability Statement
Data is contained within the article.
Acknowledgments
The authors used ChatGPT-4.5 (OpenAI, San Francisco, CA, USA) for language refinement and grammar improvement during manuscript preparation. The authors reviewed and verified all content to ensure accuracy and integrity.
Conflicts of Interest
The authors declare no conflicts of interest.
References
- Rizzuti, A. Food crime: A review of the UK institutional perception of illicit practices in the food sector. Soc. Sci. 2020, 9, 112. [Google Scholar] [CrossRef]
- Europol. Operation OPSON XI–Report; Europol: The Hague, The Netherlands, 2022; Available online: https://www.europol.europa.eu/media-press/newsroom/news/food-fraud-about-27-000-tonnes-shelves (accessed on 15 November 2025).
- Market Data Forecast. Whiskey Market 2024; Market Data Forecast: Hyderabad, India, 2024. [Google Scholar]
- Toma, S.-G. Whisky, a tasty business. Contemp. Econ. J. 2023, 8, 28–34. [Google Scholar]
- Bigão, V.L.C.P.; da Costa, B.R.B.; Gomes, N.C.; Júnior, W.J.R.S.; Marinho, P.A.; De Martinis, B.S. From inspection to analysis: A combined approach to identifying counterfeit whiskeys using HS-GC-FID and bottle integrity. Forensic Sci. Int. 2024, 357, 111977. [Google Scholar] [CrossRef] [PubMed]
- Huang, H.W.; Chang, W.T. Methanol concentration as a preceding eliminative marker for the authentication of Scotch Whiskies in Taiwan. Forensic Sci. Int. 2022, 339, 111413. [Google Scholar] [CrossRef] [PubMed]
- Huang, H.W.; Chang, W.T. δ13C-ethanol as a potential exclusionary criterium for the authentication of Scotch whiskies in Taiwan: Normal vs. 3-parameter lognormal distributions of δ13C-ethanol found in single malt and blended Scotch whiskies. Beverages 2023, 9, 13. [Google Scholar] [CrossRef]
- Chang, T.C.; Huang, H.W.; Chang, W.T. Scotch whiskies and forensic examinations of manufacturing-derived features for their authentication. Forensic Sci. Rev. 2024, 36, 127–142. [Google Scholar]
- Arslan, M.M.; Zeren, C.; Aydin, Z.; Akcan, R.; Dokuyucu, R.; Keten, A.; Cekin, N. Analysis of methanol and its derivatives in illegally produced alcoholic beverages. J. Forensic Leg. Med. 2015, 33, 56–60. [Google Scholar] [CrossRef]
- Bauer-Christoph, C.; Christoph, N.; Aguilar-Cisneros, B.O.; López, M.G.; Richling, E.; Rossmann, A.; Schreier, P. Authentication of tequila by gas chromatography and stable isotope ratio analyses. Eur. Food Res. Technol. 2003, 217, 438–443. [Google Scholar] [CrossRef]
- Boyaci, I.H.; Genis, H.E.; Guven, B.; Tamer, U.; Alper, N. A novel method for quantification of ethanol and methanol in distilled alcoholic beverages using Raman spectroscopy. J. Raman Spectrosc. 2012, 43, 1171–1176. [Google Scholar] [CrossRef]
- Cook, G.T.; Dunbar, E.; Tripney, B.G.; Fabel, D. Using carbon isotopes to fight the rise in fraudulent whisky. Radiocarbon 2020, 62, 51–62. [Google Scholar] [CrossRef]
- Rhodes, C.N.; Heaton, K.; Goodall, I.; Brereton, P.A. Gas chromatography carbon isotope ratio mass spectrometry applied to the detection of neutral alcohol in Scotch whisky: An internal reference approach. Food Chem. 2009, 114, 697–701. [Google Scholar] [CrossRef]
- Meier-Augenstein, W.; Kemp, H.F.; Hardie, S.M.L. Detection of counterfeit Scotch whisky by 2H and 18O stable isotope analysis. Food Chem. 2012, 133, 1070–1074. [Google Scholar] [CrossRef]
- Aylott, R.I.; Clyne, A.H.; Fox, A.P.; Walker, D.A. Analytical strategies to confirm Scotch whisky authenticity. Analyst 1994, 119, 1741–1746. [Google Scholar] [CrossRef]
- Fleming, H.; Chen, M.; Bruce, G.D.; Dholakia, K. Through-bottle whisky sensing and classification using Raman spectroscopy in an axicon-based backscattering configuration. Anal. Methods 2020, 12, 4572–4578. [Google Scholar] [CrossRef]
- Møller, J.K.S.; Catharino, R.R.; Eberlin, M.N. Electrospray ionization mass spectrometry fingerprinting of whisky: Immediate proof of origin and authenticity. Analyst 2005, 130, 890–897. [Google Scholar] [CrossRef] [PubMed][Green Version]
- Teodoro, J.A.R.; Pereira, H.V.; Sena, M.M.; Piccin, E.; Zacca, J.J.; Augusti, R. Paper spray mass spectrometry and chemometric tools for a fast and reliable identification of counterfeit blended Scottish whiskies. Food Chem. 2017, 237, 1058–1064. [Google Scholar] [CrossRef] [PubMed]
- Joshi, I.; Truong, V.K.; Elbourne, A.; Chapman, J.; Cozzolino, D. Influence of the scanning temperature on the classification of whisky samples analysed by UV-VIS spectroscopy. Appl. Sci. 2019, 9, 3254. [Google Scholar] [CrossRef]
- Kew, W.; Goodall, I.; Uhrín, D. Analysis of Scotch whisky by 1H NMR and chemometrics yields insight into its complex chemistry. Food Chem. 2019, 298, 125052. [Google Scholar] [CrossRef]
- Shand, C.A.; Wendler, R.; Dawson, L.; Yates, K.; Stephenson, H. Multivariate analysis of Scotch whisky by total reflection X-ray fluorescence and chemometric methods: A potential tool in the identification of counterfeits. Anal. Chim. Acta 2017, 976, 14–24. [Google Scholar] [CrossRef]
- ASTM E1610-18; Standard Guide for Forensic Paint Analysis and Comparison. ASTM: West Conshohocken, PA, USA, 2018. Available online: https://store.astm.org/e1610-18.html (accessed on 17 November 2025).
- Ramsay, C.M.; Berry, D.R. Effect of temperature and pH on the formation of higher alcohols, fatty acids and esters in the malt whisky fermentation. Food Microbiol. 1984, 1, 117–121. [Google Scholar] [CrossRef]
- Aylott, R.I.; MacKenzie, W.M. Analytical strategies to confirm the generic authenticity of Scotch whisky. J. Inst. Brew. 2010, 116, 215–229. [Google Scholar] [CrossRef]
- Gajek, M.; Pawlaczyk, A.; Maćkiewicz, E.; Albińska, J.; Wysocki, P.; Jóźwik, K.; Szynkowska-Jóźwik, M.I. Assessment of the authenticity of whisky samples based on the multi-elemental and multivariate analysis. Foods 2022, 11, 2810. [Google Scholar] [CrossRef]
- UK Government. The Scotch Whisky Regulations 2009, Statutory Instrument 2009 No. 2890. Available online: https://www.legislation.gov.uk/uksi/2009/2890/contents (accessed on 24 November 2025).
- Limpert, E.; Stahel, W.A.; Abbt, M. Log-normal distributions across the sciences: Keys and clues. BioScience 2001, 51, 341–352. [Google Scholar] [CrossRef]
- Gaddum, J.H. Lognormal distributions. Nature 1945, 156, 463–466. [Google Scholar] [CrossRef]
- Siano, D.B. The log-normal distribution function. J. Chem. Educ. 1972, 49, 755. [Google Scholar] [CrossRef]
- Grönholm, T.; Annila, A. Natural distribution. Math. Biosci. 2007, 210, 659–667. [Google Scholar] [CrossRef] [PubMed]
- Razali, N.M.; Wah, Y.B. Power comparisons of some selected normality tests. In Proceedings of the Regional Conference on Statistical Sciences, Universiti Teknologi MARA (UiTM), Shah Alam, Malaysia, 13–14 June 2010; pp. 126–138, ISBN 978-967-363-157-5. [Google Scholar]
- Engmann, S.; Cousineau, D. Comparing distributions: The two-sample Anderson–Darling test as an alternative to the Kolmogorov–Smirnov test. J. Appl. Quant. Methods 2011, 6, 1–17. [Google Scholar]
- Shapiro, S.S.; Wilk, M.B. An analysis of variance test for normality (complete samples). Biometrika 1965, 52, 591–611. [Google Scholar] [CrossRef]
- Stephens, M.A. EDF statistics for goodness of fit and some comparisons. J. Am. Stat. Assoc. 1974, 69, 730–737. [Google Scholar] [CrossRef]
- Anderson, T.W.; Darling, D.A. A test of goodness of fit. J. Am. Stat. Assoc. 1954, 49, 765–769. [Google Scholar] [CrossRef]
- Hranac, R.; Sterzin, E.; Krechmer, D.; Rakha, H.A.; Farzaneh, M. Empirical Studies on Traffic Flow in Inclement Weather; United States. Federal Highway Administration: Washington, DC, USA, 2006.
- Habibzadeh, F. Data distribution: Normal or abnormal. J. Korean Med. Sci. 2024, 39, e35. [Google Scholar] [CrossRef] [PubMed]
- Piggott, J.R. Whisky, whiskey and bourbon: Composition and analysis of whisky. In Encyclopedia of Food and Health; Caballero, B., Finglas, P.M., Toldrá, F., Eds.; Academic Press: Oxford, UK, 2016; pp. 514–518. [Google Scholar] [CrossRef]
- Liebmann, A.J.; Rosenblatt, M. pH in distilled alcoholic beverages. J. Assoc. Off. Agric. Chem. 1942, 25, 163–168. [Google Scholar] [CrossRef]
- Guymon, J.F.; Tolbert, N.E.; Amerine, M.A. Studies with brandy. I. pH. J. Food Sci. 1943, 8, 224–230. [Google Scholar] [CrossRef]
- Piggott, J.R. Whisky. In Current Developments in Biotechnology and Bioengineering: Food and Beverages Industry; Pandey, A., Sanromán, M.Á., Du, G., Soccol, C.R., Dussap, C.-G., Eds.; Elsevier: Amsterdam, The Netherlands, 2017; pp. 435–450. [Google Scholar] [CrossRef]
- Deleebeeck, L.; Snedden, A.; Nagy, D.; Szilágyi Nagyné, Z.; Roziková, M.; Vičarová, M.; Heering, A.; Bastkowski, F.; Leito, I.; Quendera, R.; et al. Unified pH Measurements of Ethanol, Methanol, and Acetonitrile, and Their Mixtures with Water. Sensors 2021, 21, 3935. [Google Scholar] [CrossRef]
- Riché, E.; Carrié, A.; Andin, N.; Mabic, S. High-purity water and pH. Am. Lab. 2006, 38, 22. [Google Scholar]
- Taiwan Taichung District Court. Criminal Judgment No. 113; Taiwan Taichung District Court: Taichung, Taiwan, 2024.
- Taiwan Changhua District Court. Criminal Judgment No. 108; Taiwan Changhua District Court: Changhua, Taiwan, 2019.
- Taiwan Tainan District Court (Taiwan). Criminal Judgment No. 5; Taiwan Tainan District Court: Tainan, Taiwan, 2015.
Disclaimer/Publisher’s Note: The statements, opinions and data contained in all publications are solely those of the individual author(s) and contributor(s) and not of MDPI and/or the editor(s). MDPI and/or the editor(s) disclaim responsibility for any injury to people or property resulting from any ideas, methods, instructions or products referred to in the content. |
© 2025 by the authors. Licensee MDPI, Basel, Switzerland. This article is an open access article distributed under the terms and conditions of the Creative Commons Attribution (CC BY) license (https://creativecommons.org/licenses/by/4.0/).