Article

Facile Electrodeposition-Based Chemosensors Using PANI and C-Hybrid Nanomaterials for the Selective Detection of Ammonia and Nitrogen Dioxide at Room Temperature

1
National Institute for Research and Development in Microtechnologies (IMT Bucharest), 126A Iancu Nicolae Street, 72996 Bucharest, Romania
2
Pharmacy Faculty, “Titu Maiorescu” University, 16 Sincai, 040314 Bucharest, Romania
3
Extreme Light Infrastructure-Nuclear Physics (ELI-NP), ‘Horia Hulubei’ National R&D Institute for Physics and Nuclear Engineering (IFIN-HH), 30 Reactorului Street, 077125 Măgurele, Romania
4
Romelgen, 82 Baicului Street, 021771 Bucharest, Romania
*
Authors to whom correspondence should be addressed.
Chemosensors 2023, 11(2), 132; https://doi.org/10.3390/chemosensors11020132
Submission received: 28 December 2022 / Revised: 7 February 2023 / Accepted: 8 February 2023 / Published: 13 February 2023
(This article belongs to the Special Issue Carbon Nanomaterials and Related Materials for Sensing Applications)

Abstract

:
Sensor systems for monitoring indoor air quality are vital for the precise quantification of the mechanisms which lead to the deterioration of human health, with a typical person spending an average of 20 h a day in an enclosed space. Thus, a series of layered chemoresistive sensors, obtained by the facile electrodeposition of carbon nanomaterial-enhanced PANI composites, have been tested for the selective detection of two core indoor pollutants: ammonia and nitrogen dioxide. The sensors were tested with respect to sensitivity and selectivity to the target gasses, with performance being assessed based on response linearity and repeatability at room temperature. Of the tested sensors, two have been identified as having an adequate performance on ammonia, with sensitivities of up to 96.99% and resolutions of up to 0.85 ppm being observed, while on nitrogen dioxide, despite the successful sensor having a lower sensitivity, 10.71%, it has shown high resolution, 1.25 ppm, and linearity over a large concentration domain. These high performances highlight the viability of multi-layers chemosensors based on the electrodeposition of nanomaterial-enhanced conductive polymers for the detection of pollutant gasses, with finetuning of the detection layer allowing the accurate monitoring of a wide range of gasses.

1. Introduction

The control of air quality and the degree of air pollution have been at the forefront of the European research effort on improving the environment, health, and general state of wellbeing of citizens. For urban environments, indoor air quality becomes a particular concern due to a typical person spending an average of 20 h a day in enclosed spaces, where pollutant concentrations can be 2 to 5 times higher than outdoors [1]. The development of new, reliable, and economical sensor systems for the monitoring of pollutants, such as ammonia and nitrogen dioxide, is thus a key factor in better understanding and counteracting their effect on human health. Ammonia is the second-highest synthesized chemical commodity, with wide use in pharmaceuticals, packaging, refrigerants, and also in the textile and wood treatment industries [2,3]. However, it is a highly toxic substance, especially dangerous because of the high solubility of its gaseous form in water, leading to easier absorption into the human body. Thus, the maximum exposure limit at 25 ppm is set to 8 h, dropping to 10 min for the concentration reaching 35 ppm [4]. Exposure to NH3 vapors can cause eye, mucous membrane, and respiratory tract irritation, with high concentrations, over 100 ppm, or continuous exposure to the maximum exposure limit leading to pulmonary edemas or respiratory failure [2]. Similar health effects are observed for nitrogen dioxide, a result of fuel combustion or cigarette smoking and a prevalent pollutant in urban landscapes. Despite its lower water solubility, NO2 proves more dangerous for the human body, with a maximum exposure limit of 1 ppm being advised [5].
To ensure the real-time detection of concentration increases for hazardous gases, it is crucial to provide unobtrusive monitoring systems with fast response times, which can be easily relocated to ensure a prompt adherence to safety precautions [6]. Miniaturized sensing systems combined with pattern recognition algorithms would thus be a viable solution to the raised problem. However, of the commercially available sensing systems, those relying on optical devices are less desirable despite their robustness and accuracy, due to their increased costs [7,8,9]. Thus, viable alternatives to optical technologies are chemoresistive sensors, which make use of sensing materials such as metal oxide semiconductors to elicit a change in conductivity on the absorption and desorption of gas molecules at the solid–gas interface, making them ideal for use in integrated circuits [5,6,7,8,9,10,11]. Traditionally, such sensors are prone to high working temperatures, high cross-sensitivity, especially with moisture, and low environmental stability due to humidity variations [12,13]. Moisture interference becomes even more prominent when using metal oxides at room temperature, with water molecules competing with oxygen, thus lowering the response of the sensor. Using hygroscopic materials to form heterostructures that prevent the effect of humidity [14], interposing organic molecules to decrease the water adsorption in the layer [15], and removing the effect of humidity algorithmically using a reference measurement [16] are traditional techniques for dealing with this problem.
Nanomaterial-enriched chemoresistive sensors based on conductive polymers (CPs), carbon structures (e.g., carbon nanotubes and reduced graphene), and nanocomposite (e.g., C-hybrid) materials have the ability to operate at room temperature, while preserving their sensitivity in the range of 1–100 ppm and detection limit in the ppb range [17,18]. One such example is nanostructured polyaniline (PANI), which is particularly suited to the detection of ammonia because of its inherent characteristic of being electrically influenced by pH changes. While PANI can respond to multiple pollutants, selectivity to specific gases can be significantly raised by emphasizing different interaction mechanisms through layering. NH3 sensors based on PANI function by de-doping the protonated centers of emeraldine salts, leading to the formation of NH4+ ions and thus to an increase in the sensor resistance [19], while the reaction between NO2 and PANI is characterized by the oxidation of emeraldine salts followed by the reduction of NO2 and a decrease in the measured resistance. Due to the inherently low sensitivity of PANI, it is usually employed as part of a composite material with either metal oxides, carbon-based materials, transition metal dichalcogenides (TMD), or, more recently, halloysite nanotubes [20,21]. The addition of carbon structures to the sensing layer, such as carbon nanotubes (CNTs) [22] and 2D materials [23], has been proven to improve gas detection properties owing to their increased specific area and tunable chemistries. However, high contents of carbon structures can lead to the deterioration of the polymer matrix and thus to a reduction in performance [24]. More complex carbonic structures can also be employed, as is the case for a recent article [25] in which three-dimensional reduced graphene oxide (3D-rGO) was set into a PANI matrix to significantly increase sensitivity to ammonia. This performance enhancement is likely due to the increased carrier mobility provided by rGO and the larger surface area resulting from the 3D structure of the graphene [26,27]. Combining CPs with carbonic structures has also been shown to result in fast, ultrasensitive, and recoverable sensing devices for detecting trace levels of ammonia, as is the case for a sensor using in situ chemical oxidative polymerized aniline monomers with carboxylated multiwalled CNTs (C-MWCNTs) [22,28,29,30]. For such sensors, the best performance is obtained when the carboxyl groups are either free or aminated, as this allows them to better interact with ammonia [31].
CNTs and zinc oxide (ZnO) composite materials have also been shown to result in a high performance when used as sensing layers, due to multifunctional properties of ZnO such as a larger contact surface, high crystallinity, and its organized molecular structure [32,33,34]. While composite nanofibers (NFs), combining PANI with ZnO, have recently been use for enhanced NO2 detection [35], their high selectivity is counterbalanced by the need for high operating temperatures (300 °C). However, an ammonia sensor making use of such nanofibers was developed by Talwar et al. [36], which was modified to preserve functionality at room temperature. Similarly, PANI-rGO has been used in sensing films for the detection of ammonia [29], H2 [37], and H2S [38]. However, for NO2 detection, such sensors need to further improve their catalytic and electrical properties, as attempted in a recent work where a PANI-rGO-Ag2O composite was obtained via the drop and dry method. While the sensor had a suitable performance, it required working temperatures of 100 °C, leading to a higher energy consumption. A different NO2 sensor with adequate selectivity at high operating temperatures was developed using physisorption-based charge transfer in two-dimensional SnS2, achieving a limit of detection in the range of ppb [39]. However, when compared to CP sensors, such materials are unsuited for use in low-cost miniaturized systems [34] and have poor recovery rates [40].
For sensors to be used in practical applications, there is a need to develop devices that combine low-operating temperatures with high selectivity and sensitivity towards the target gas. While it is important to design such sensors with a focus towards high sensitivity, their stability and precision also need to be preserved, with the use of electrically stable materials that offer a high degree of customizability during the deposition process being a solution. Several techniques for the deposition of the sensing material on different configurations of electrodes, such as the interdigitated electrodes (IDEs) used in this work, including electrospinning, dipping, drop deposition, thermal evaporation, physical/chemical/vapor deposition, and the sol–gel method [41,42,43,44,45,46], are available for the development of chemoresistive sensors. Moreover, for the polymerization process, several techniques for binding the monomers can be observed in the literature, including in situ chemical oxidative, light-induced, microwave-induced, and electrochemical polymerization. As it allows for more controllable parameters, electrochemical polymerization is identified as a method for obtaining the desired characteristics in the fabricated sensors.
Based on existing literature and extensive testing, two sensing layers have been identified (from an assortment of various sensors based on conductive polymers combined with C-based materials) and optimized for the rapid, continuous, and selective monitoring of NH3 and NO2 in the environment, with material characterization and analysis of their response being the core focus of this work. Both layers involved the facile electrodeposition of C-material hybrids on gold IDEs, with PANI-MWCNT-NH2 being selected for ammonia detection and PANI-rGO-ZnO being selected for the detection of NO2. All sensors have shown strong stability in time and acceptable repeatability. Ammonia sensors have shown high sensitivities of up to 96.99%, while attaining a suitable resolution and linearity over the domain of interest. On the other hand, while the NO2 sensors exhibit lower sensitivities of up to 10.71%, they show high resolution and linearity over the domain of interest.

2. Materials and Methods

2.1. Materials

Aniline (anhydrous, >99.5%), sodium polystyrene sulfonate (PSS) with a molar mass of ~70,000 g/M, sulfuric acid (95–98%), nitric acid 70% (HNO3), pure ethylic alcohol, potassium chloride (KCl), MgSO4, NaOH, KNO3, Zn(NO3)2, and phosphate-buffered saline (PBS, pH 7.0) were purchased from Sigma-Aldrich. Graphene oxide (GO-4 mg/mL dispersed in water) was acquired from MSE Supplies (Tucson, AZ, USA) and MWCNT-NH2 powder (with a ~7% percentage of -NH2 groups) was purchased from Cheap Tubes Inc., (Cambridgeport, VT, USA). All solutions were prepared using Milli-Q deionized water.

2.2. Characterization Methods

All electrochemical experiments were performed using VoltaLabPGZ100, and deposition experiments were performed using a conventional three-electrode system. The employed working electrode was a gold IDE, the counter electrode was Pt, and the reference electrode contained Ag/AgCl (3M, KCl).
Micro Raman measurements were performed with a WiTec Alpha (300S/2008, WiTec Gmbh, Ulm, Germany) system consisting of a 532 nm Nd-YAG laser (2.41 eV) set in a backscattering configuration through the equipped 600 grooves/mm grating (Thorlabs100x microscope attached), with exposure time being set to 20 s in accumulation. Spectra were collected through the WiTec Project Five software, with smoothing and peak identification carried out via Origin 8.5. X-ray photoemission spectroscopy (XPS) spectra were recorded for PANI-MWCNT-NH2 on a Sigma Surface Science photoelectron spectrometer equipped with a 160 mm hemispherical energy analyzer and a 1D detector (ASPECT), and using a 13 kV Al Kα X-ray source at 200 W. A 1.3 × 1.3 mm2 analysis area was employed and the sample normally coincided with the detection column axis. Pressure in the analysis chamber was kept below 1 × 10⁻⁹ mbar. Wide scan survey spectra were collected from −5 to 1200 eV (binding energy), using a constant pass energy of 200 eV. The high-resolution spectra were recorded using a pass energy of 20 eV. All spectra were fitted using a Shirley-type background and a Lorentzian–Gaussian peak shape. Prior to the XPS measurements, the samples were infrared heated to ~100 °C for 5 min with pressure kept below 1 × 10⁻⁶ mbar.
Morphology of the film surface was observed using scanning electron microscopy (SEM) through a Nova NanoSEM 630 system (FEI Company, Hillsboro, OR, USA) equipped with an UHR detector (Through-Lens-Detector-TLD). The chemical constituents of interest within the PANI-rGO-ZnO film were detected using an element energy-dispersive spectroscopy (EDS) system (Smart Insight AMETEK).

2.3. Sensor Fabrication

The developed sensors were deposited on miniaturized transducers patterned on the front of 0.1 mm thick alumina wafers KYOCERA (Esslingen, Germany). Thin nanostructured films of PANI-rGO-ZnO and PANI-MWCNT-NH2 were electrodeposited on gold interdigitated electrodes (IDEs) and used for NO2 and NH3 gas detection. The layout of the IDEs was drawn with the help of a dedicated design software, with the active area being projected to 5 × 8 mm. The active area of the electrodes consists of 80 pairs of interdigitated electrodes with their digits sized at 10 µm. Figure S1A,B show the schematics of the sensors and the fabricated sensors, respectively.

2.4. Electrodeposition

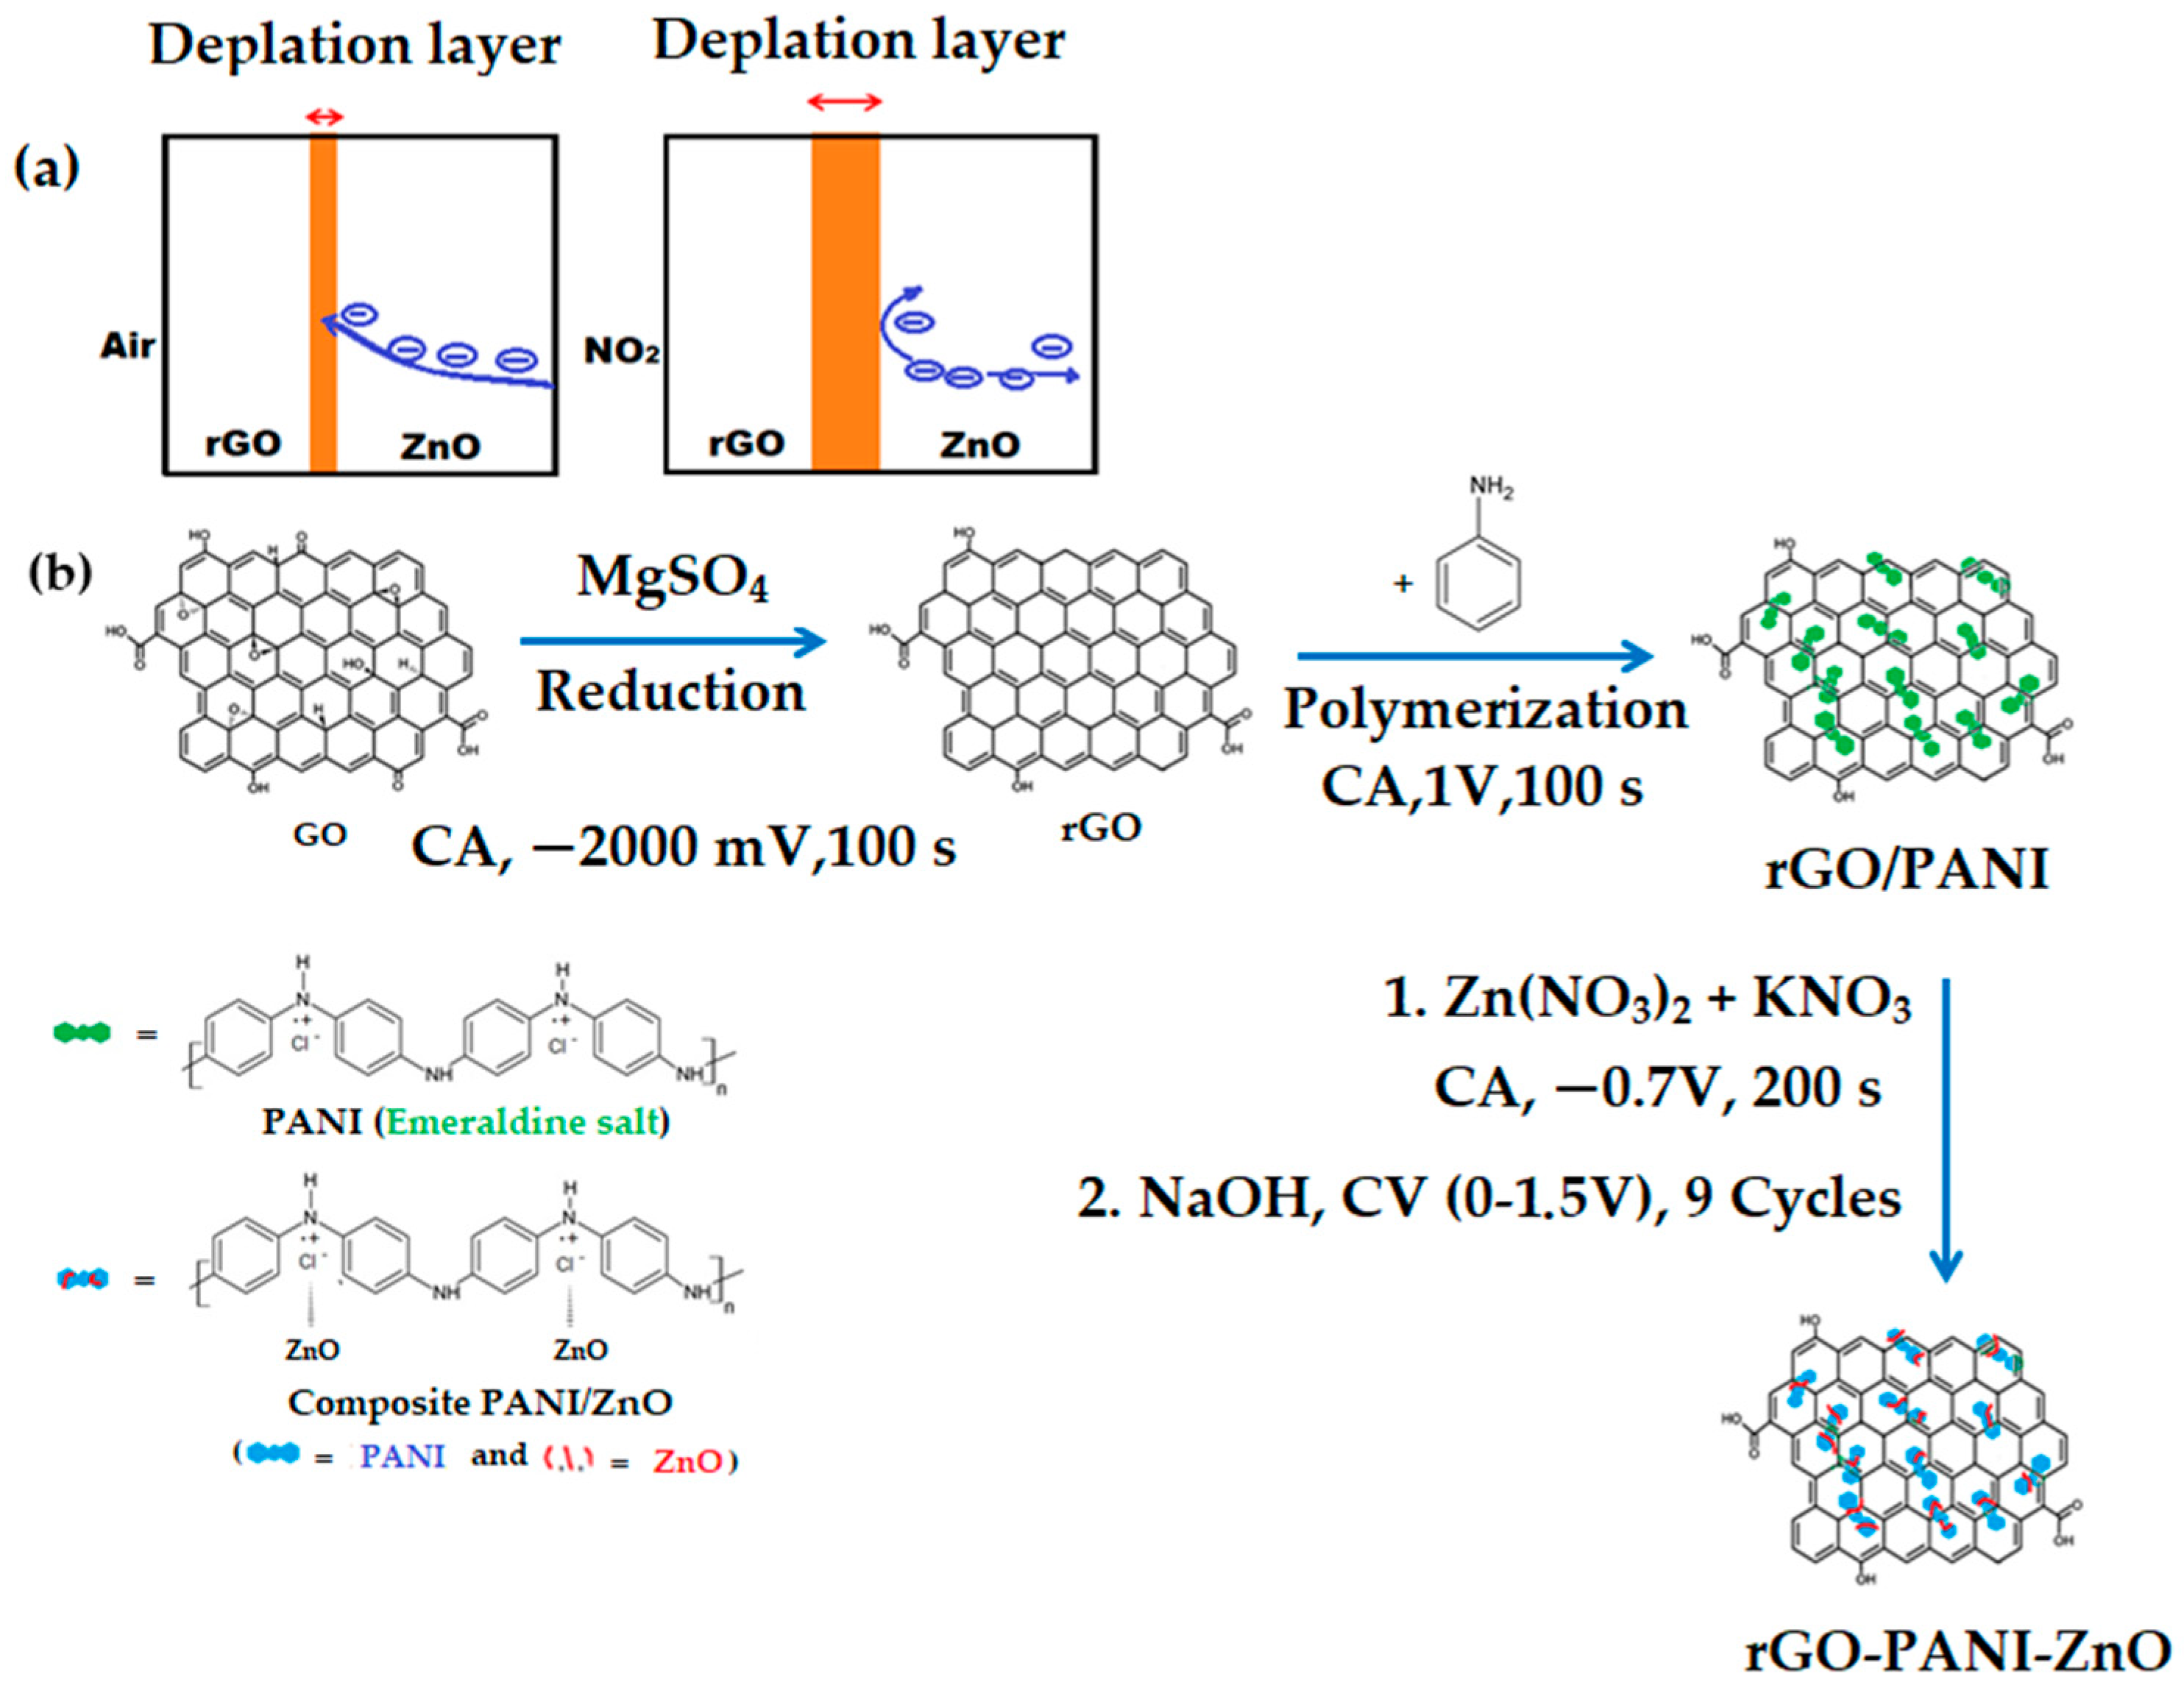
2.4.1. PANI-rGO-ZnO Electrodeposition

Four solutions were employed in the electrodeposition process:
  • Solution 1 (S1): add 20 mL of GO (2 mg/mL) and 0.038 g of MgSO4 to dispersed water;
  • Solution 2 (S2): mix 182 µL aniline, 197 µL HCl, and 17.818 mL H2O;
  • Solution 3 (S3): dissolve 0.08 g NaOH in 20 mL H2O;
  • Solution 4 (S4): dissolve 0.08 M Zn(NO3)2 and 0.27 g KNO3 in 20 mL H2O.
PANI-rGO electrodeposition: Sensors were first immersed in S1, which led to the initiation of the GO electrodeposition, followed by the electrochemical reduction of GO to rGO at a constant potential of −2000 mV for 100 s using chronoamperometry (CA). After rGO was fully electrodeposited on the IDEs, a further PANI electropolymerization step was employed by immersing the IDEs-rGO in S2 and applying chronoamperometry (CA) for 60 s at 1000 mV. The sensor with PANI-rGO was then introduced in S3 for PANI overoxidation through cyclic voltammetry (CV) by linearly sweeping the potential between 0 mV and 1500 mV at a scanning speed of 100 mV/s for 9 cycles.
ZnO deposition: The resulting IDEs with PANI-rGO were then immersed in S4 and the temperature of the cell solution was increased to 60–90 °C while applying a CA sequence at −0.7 V for 200 s so that the zinc nanoparticles could precipitate. ZnO was formed through the immersion of the IDEs in S3 while performing 7 cycles of CV between −0.2 V and 1.2 V. Finally, the sensors were dried in forced air, stored in well-sealed Eppendorf tubes, and placed in silica gel boxes until use.

2.4.2. PANI-MWCNT-NH2 Electrodeposition

Synthesis of the final electropolymerization solution (24 mL) was carried out as follows. Solution Z1 consisting of 0.5% polystyrene sulfonate (PSS, co-solvent) in distilled water was ultrasonicated for 30 min. Then, 0.007 g of MWCNT-NH2 was added to Z1, with the ultrasonication being continued for 1 h at below 50 °C. While magnetically stirring the resulting solution, 0.5 M H2SO4 was added dropwise, with stirring being maintained until the next day, for approximately 20 h. Then, 0.09 M aniline monomer was added dropwise, while maintaining magnetic stirring. The obtained solution was then employed to deposit the composite material using the cyclic voltammetry method by sweeping the potential between −200 mV and 1200 mV at a scanning speed of 50 mV/s.

2.5. Testing Method

Before testing, the sensors were mounted in a hermetically sealed test chamber into which mixtures of the gasses of interest can be released. A diagram of the testing platform can be seen in Figure 1, with Figure S2 giving a more detailed representation of the setup.
Test gases were prepared by diluting the target gas (either NH3 or NO2) with sufficient purified nitrogen so that a mixture of the required concentration arrived in the test chamber for measurement. Gas flow proportionality was maintained via MFCs and control via an in-house developed LabVIEW control software. The measurement cycle consisted of 300 s of purging the test chamber with N2 followed by the introduction of the desired gas for 300 s in most measurement protocols. A variation of this method was employed for the selectivity measurements when purging was performed on changing gasses or changing to another gas cylinder for the same gas as to obtain higher concentrations. Tests were performed at room temperature (~20 °C) and under N2 flow. Resistances were continuously monitored by measuring the current of the sensors.

2.6. Sensor Analytical Performance

Data were fed into Python 3.6 algorithms for the parsing and statistical analysis of the sensor signals, both during the selection process and for their fine-tuning. Linearity and behavior of the tested sensors was determined using the scipy module function curve fit, with the primary function classes being linear, power law, and logarithmic. A PCA analysis was also employed for the selection of the sensing substrates, with sklearn being employed for its implementation. This technique involves summarizing the target dataset in a n-dimensional space, where each component is perpendicular to the others, such that the variance of the data projections on each component can be analyzed. Before use in the analysis, resistance measurements for each chip were standardized across all gasses using the scale function from the preprocessing library. Inputs consisted of 1-dimenisional vectors containing information on the mean values and standard deviations of the resistance measurements for the gas concentrations, as shown in Table S1 in the Supplementary Materials. Efficiency of the sensors was determined using four main metrics: sensitivity, limit of detection (LoD), linearity, and sensor repeatability, a measure quantified by its relative standard deviation (RSD). Two other factors have also been considered in determining the sensors’ viability, namely their stability with the passage of time and their selectivity to the target gas. Thus, the sensitivity was defined as:
S i = R g , i   R c , 0 R c , 0
where i represents the gas concentration for which the resistance is being measured, Rg represents the mean resistance registered by the sensor for the target gas, and Rc,0 represents the mean resistance registered by the sensor before N2 is inserted in the measurement enclosure. To ensure that measurements can be collected reliably, the mean resistance is predicted from the values registered in the 60% to 90% response time interval. Hence, reading times can be shortened to increase sensor responsivity. Limits of detection were calculated on the linear domain of the sensors as follows:
LoD = 3 σ m
where m is the slope of the line fitted to the sensor response on the linearity domain and σ represents the standard deviation of the intersect with the 0y axis. The relative standard deviation was calculated using:
RSD = j = 1 N R g , j N  
where N represents the number of repeats. Linearity of the sensors was determined by calculating the coefficient of determination (R2) over the domain of linearity:
R 2 = 1 y i   y i , p   2 y i y ¯ 2  
where yi is the measured value, yi,p, is the predicted value of the model, and y is the mean value of the measured data. A fit is considered acceptable if the coefficient of determination passes 97.5%.

3. Results and Discussions

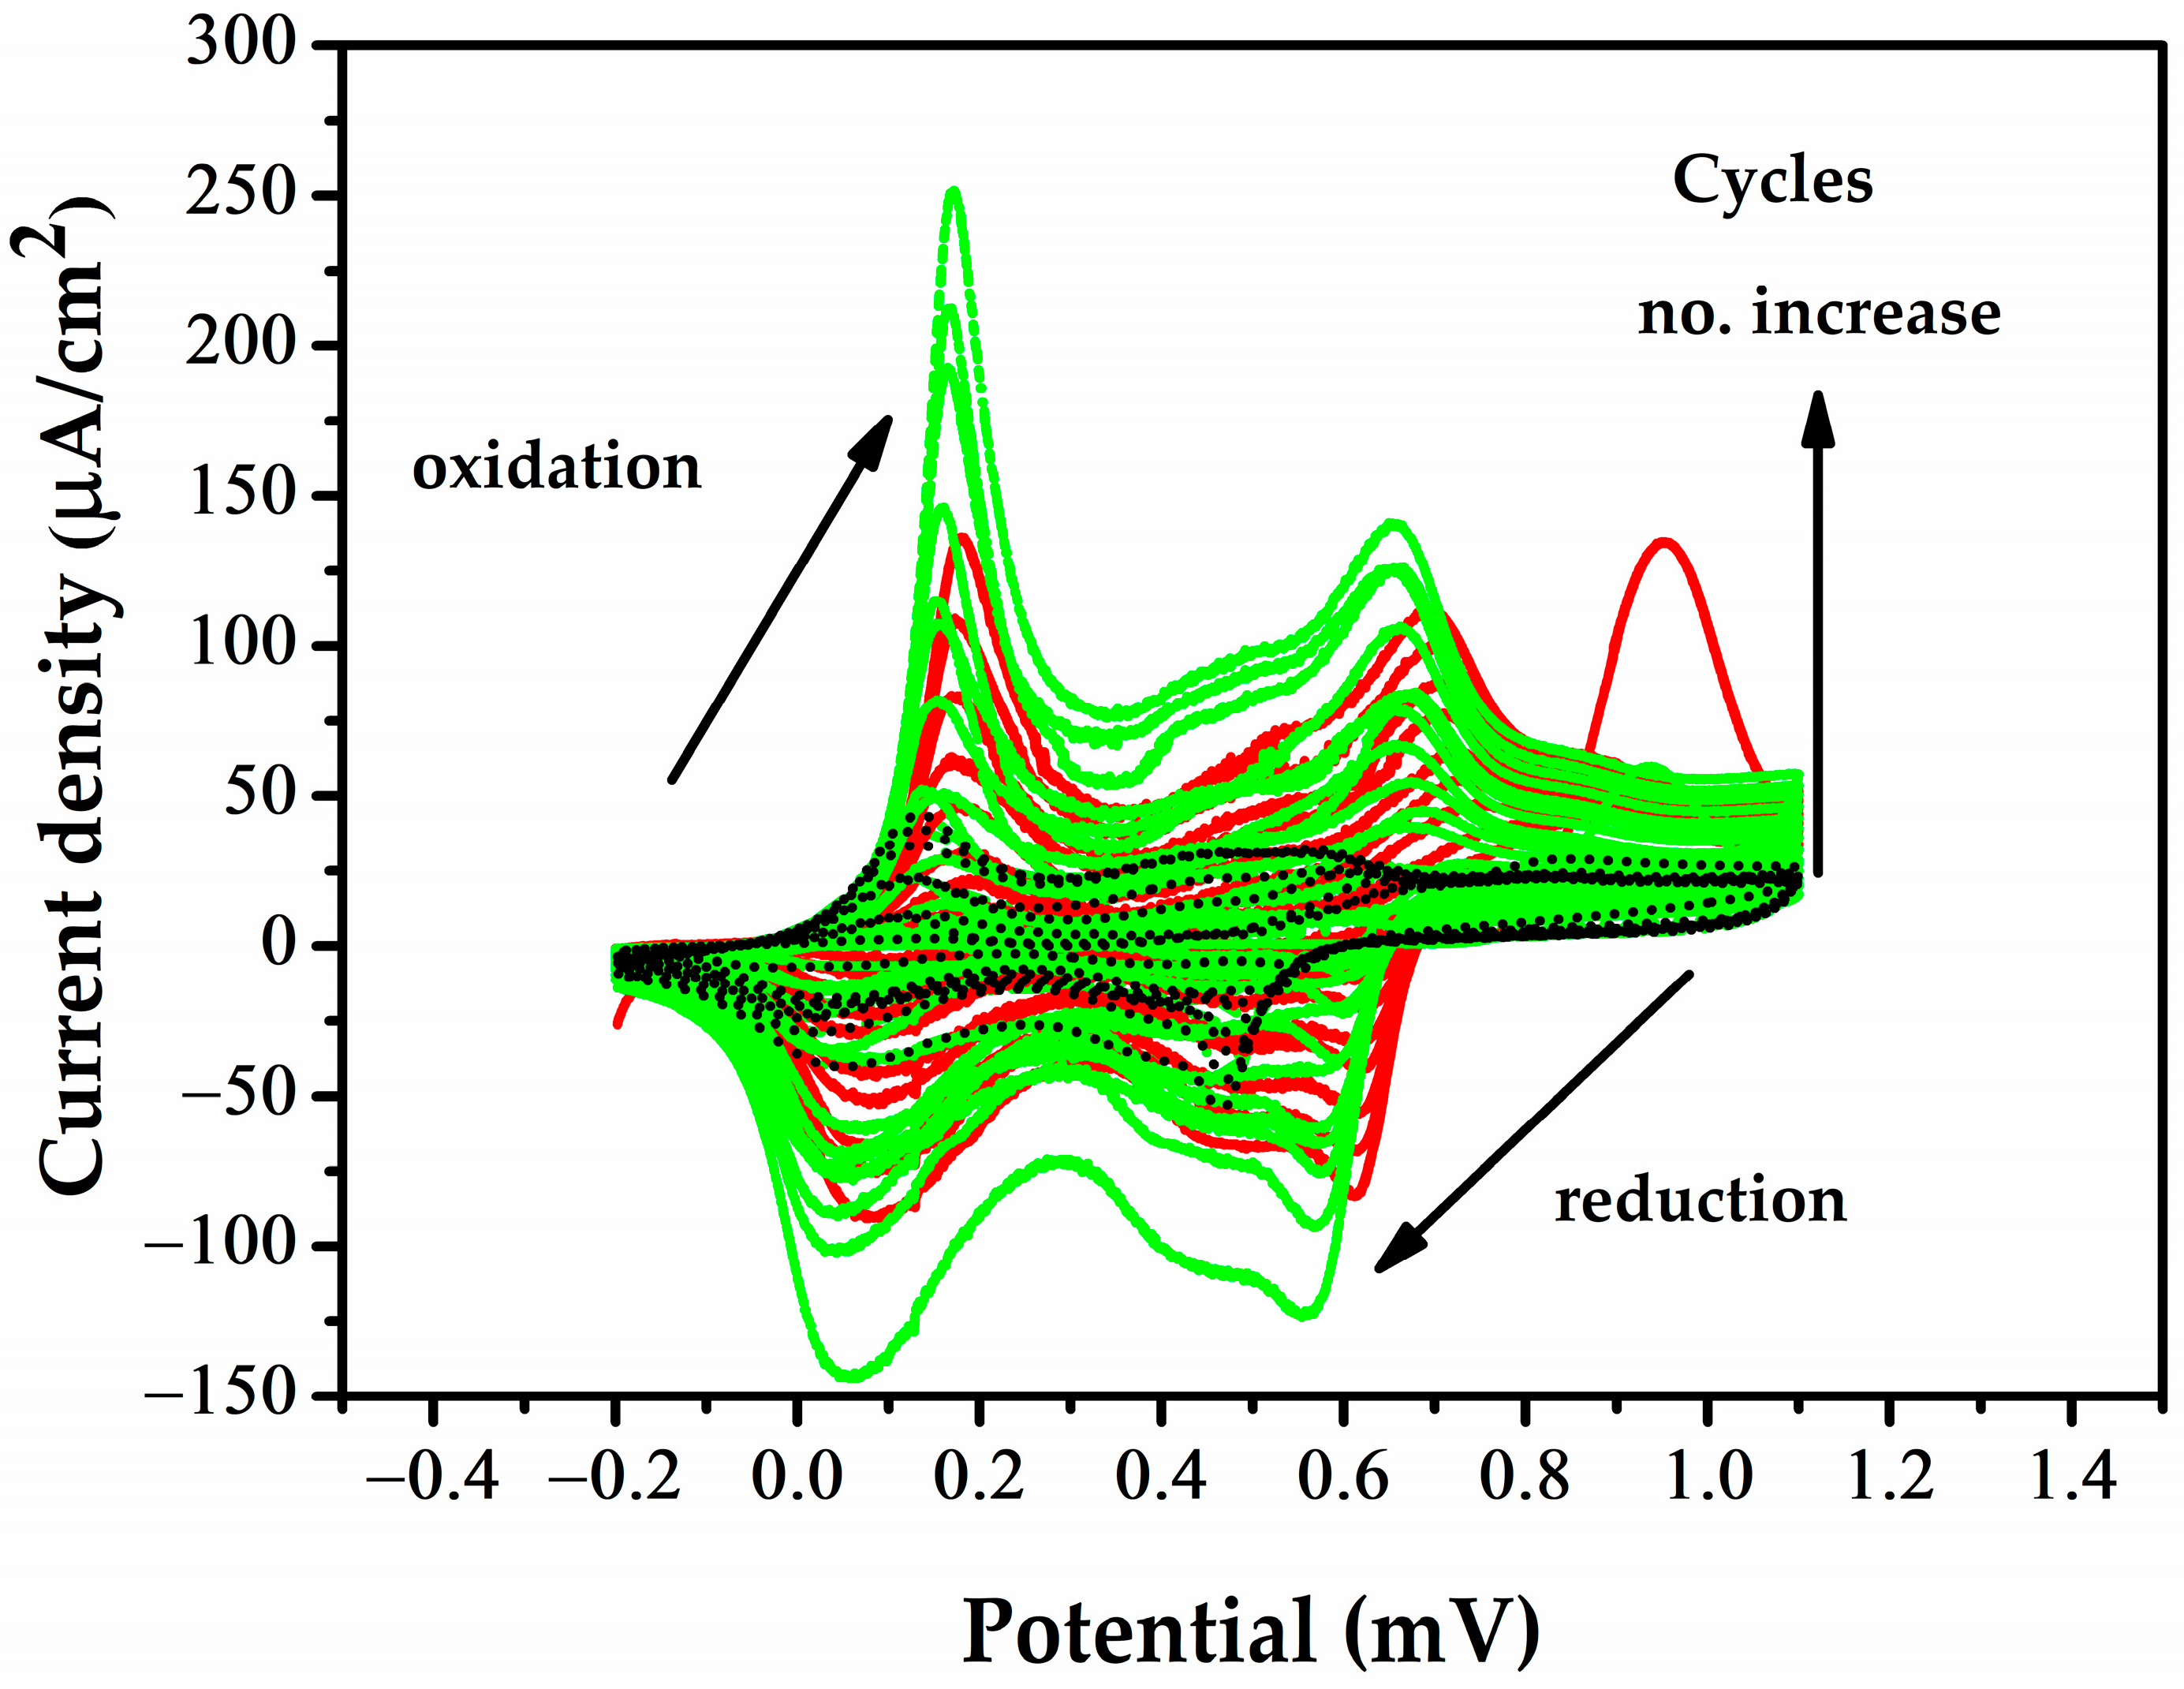
3.1. PANI-MWCNT-NH2 Electrodeposition

  • ANI monomer and MWCNT-NH2 concentrations
The concentration ratio of aniline (ANI) to MWCNT-NH2 in the electrodeposition solution was optimized to obtain a resistance in the kΩ range, while allowing for the registration of visible responses upon exposure to 5–8 ppm of ammonia, irrespective of humidity. Choosing the suitable number of deposition cycles is also related to the concentrations of ANI and MWCNT-NH2 within the electrodeposited solution. As PANI is highly sensitive to humidity, the concentration of its monomer in the electrodeposited solution requires tight control to minimize the effect of humidity [47]. Conversely, too much MWCNT-NH2 (>0.03%) leads to a more conductive layer, with resistances dropping to Ω levels. This resistance value can also be linked to the ANI concentration, as a higher concentration, 1 M ANI, can lead to Ω range measurements due to too much conductive PANI being deposited on the MWCNT-NH2. Therefore, a concentration of 0.09 M ANI with 0.03% MWCNT-NH2 was selected as the optimal electrodeposition solution due to kΩ range initial resistances being obtained when using an optimized number of CV cycles.
  • Deposition cycle number
The effect of the CV cycle number on the sensitivity is explored in greater depth in Section 3.3. Figure 2 shows the voltammograms of the sensors in the PANI-MWCNT-NH2 electrolyte solution, with repeat scans showing an increase in both cathodic and anodic current peaks. Two oxidation peaks can be observed at 0.1 V, due to PANI being transformed from a reduced state to a neutral state, and 0.6 V, due to PANI being transformed from an emeraldine salt into a pernigraniline salt, as is also observed by other authors for PANI electropolymerization in sulfuric acid [48]. The small additional peak at 0.4 V may either characterize the interaction of PANI with MWCNT-NH2 in composite materials or PANI crosslinking [49]. On recording the current peaks after 8, 10, and 15 CV cycles in the electrodeposited solution, an increase was observed, which indicates that PANI layers were deposited. Resistances in the range of kΩ were obtained only after 10 and 15 cycles. Upon passing 15 cycles, a drastic drop in initial resistance was observed, with an Ω range being reached on CV run for 17 cycles.
From the registered values presented in Table S2, it appears that both the concentration of deposited PANI and humidity have a significant effect on the initial response of the sensors, as shown by the increased values of the resistances when measured in nitrogen at 10%, 25%, and 50% humidity. Moreover, this effect appears to persist and increase when the relative resistances between measurements in air and nitrogen are considered. While humidity has an effect on the sensor response, the sensor is much more sensitive to ammonia. With repeatability of ammonia measurements being adequate (RSD < 10%), an algorithm making use of data from a separate humidity sensor could be used to remove the effects of humidity [50]. As the effect of humidity increases with the concentration of deposited PANI, a lower number of cycles, without compromising the initial resistance value, is preferable. Further analysis of the performance of PANI based sensors is given in Section 3.3.

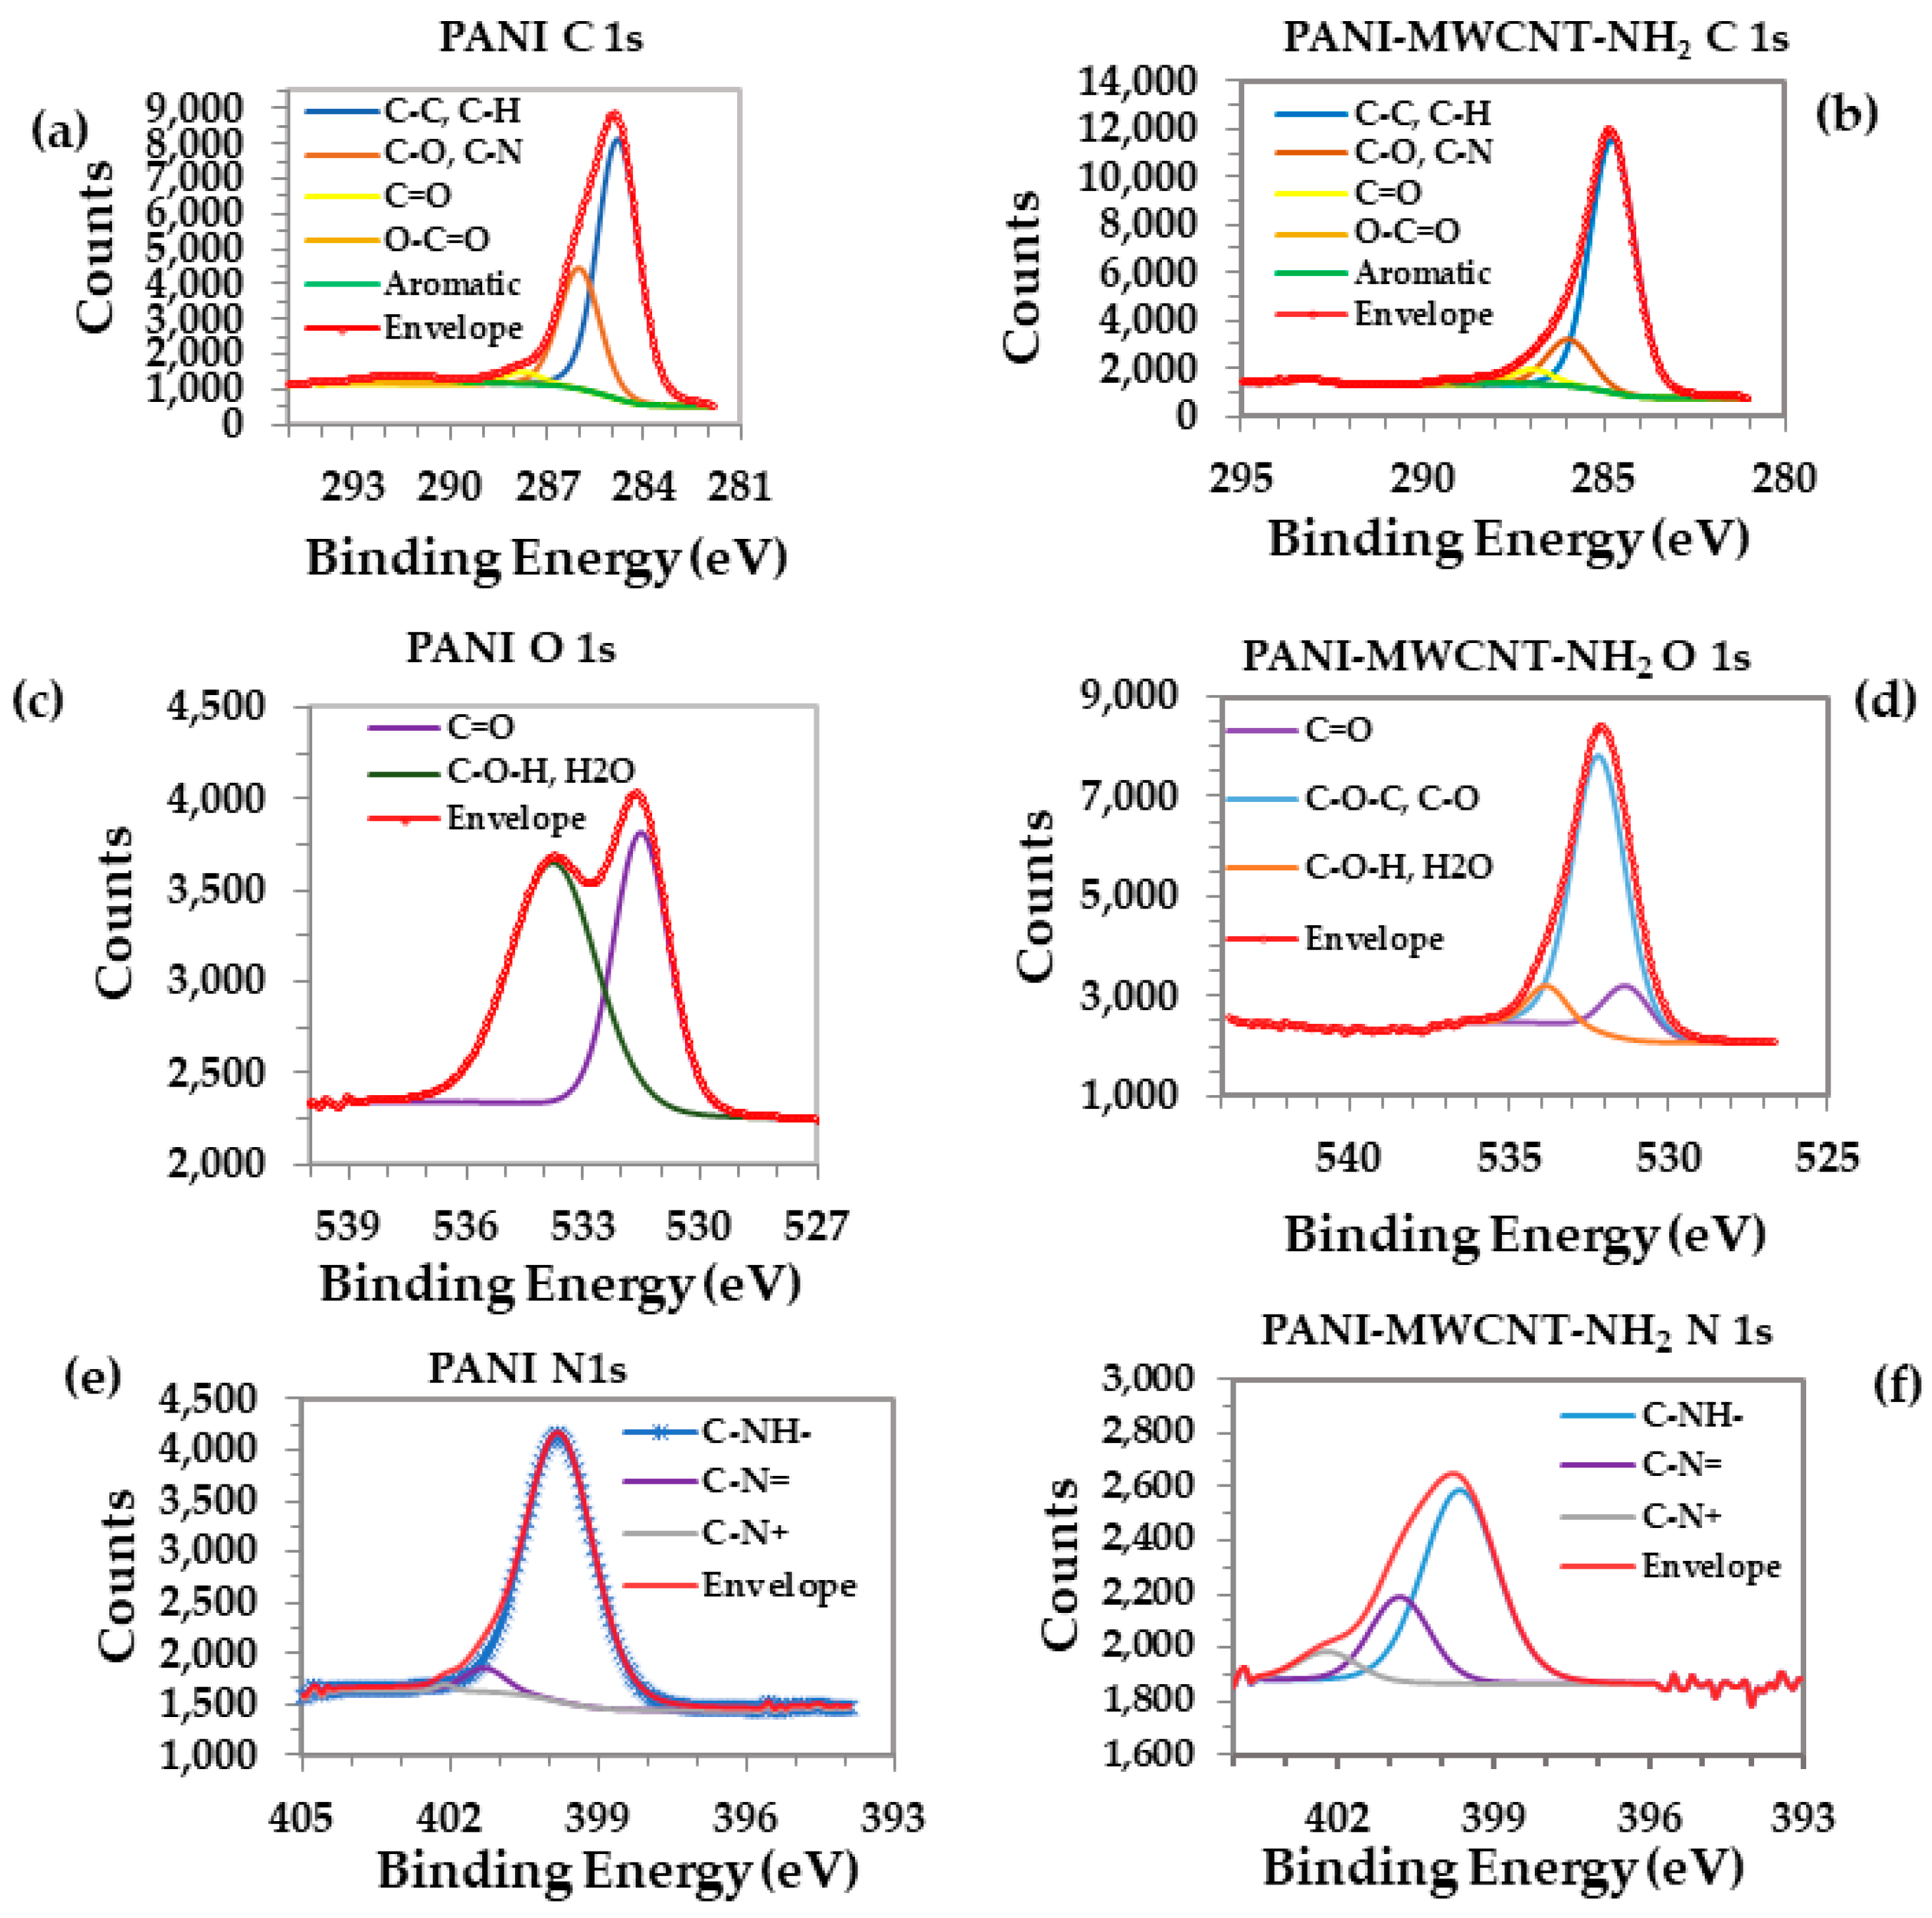
3.1.1. PANI-MWCNT-NH2 Morphological and Structural Characterization

  • SEM, Raman, and XPS
CV deposition parameters for obtaining the PANI-MWCNT-NH2 film determine the morphology and structural arrangement of the resulting layers. In turn, morphology influences gas detection performance and must be taken into account. Figure 3a shows the SEM images of a bare gold IDE grown on a ceramic substrate, while Figure 3b,c show the bare gold IDEs after the CV electropolymerization of PANI (10 cycles) from a sulfuric acid diluted solution. Typically, PANI films obtained by electrodeposition can have different shapes depending on the type of electrochemical deposition method and the parameters chosen for deposition. Thus, PANI polymers can appear as nanowires (through chronopotentiometry), nanorods (through CV, CA), a porous polymer, or as homogenously distributed spherical particles of various sizes ranging from large to small (through CV) [51,52,53,54,55]. While at low magnification, as in Figure 3b, only a chromatic difference can be seen on PANI deposition, higher magnifications (inset of Figure 3b and the 240,000× magnified Figure 3c) show homogenous nano granulation deposited on the gold electrode throughout the PANI film. Figure 3d,e shows SEM images of PANI-MWCNT-NH2 deposited by CV (10 cycles) on the IDE electrodes at different magnifications. The size distribution of PANI-MWCNT-NH2 structures was obtained from SEM images by measuring 200 individual multi-walled carbon nanotubes. The PANI-MWCNT-NH2 diameter was found to vary in the range of 35 to 174 nm. Their histogram was best fitted with a Gauss function, with structures of mean diameter 85.4 ± 28.9 nm being distributed, as shown in Figure 3f. Obtaining a rarefied and more porous network results in a larger contact surface between the gas molecules and the sensitive material, as well as in a higher electrical conductivity. One reason for choosing the PANI film is that it was expected from previous studies for it to be sensitive to ammonia [56,57]. However, it was shown that PANI films with homogenous nanoparticles deposited on IDEs (10 cycles), as presented in Figure 3c, show 20 times worse sensitivity than when MWCNT-NH2 is added in the film and forms a PANI-MWCNT-NH2 network (more detailed discussion in Section 3.3).
Figure 3g displays the Raman spectra of the PANI-MWCNT-NH2 composite, PANI reference, and MWCNT-NH2 reference. On the Raman spectrum of the MWCNT-NH2 reference, four prominent characteristics bands are observed: the D band (1350 cm −1) of the amorphous disordered carbon structure of CNTs, the G band (1580 cm −1) of the stretching mode of C-C, a 2D secondary band (2646 cm−1), and a 2D’ band (3148 cm−1) highlighting the large diameters of the MWCNTs [58]. In the PANI reference spectrum, the four characteristic modes of the protonated imine form of polyaniline appeared at 606, 818, and 1176 cm−1 (C–H in-plane bending vibration of the benzenoid and quinoid ring) and at 1349 cm−1 (C–N stretching vibration of delocalized polaronic structures). In Figure 3h, the C–C, C=C, and C=N stretching of PANI quinoid ring bands and the D and G bands of carbon bands are highlighted and overlayed, suggesting strong p–p conjugated interactions between carbonic and polymeric materials. Comparison of the intensity ratio of the G and D bands (ID/IG) of the MWCNT-NH2 versus PANI-MWCNT-NH2 samples reveals a decrease of 21% for PANI-MWCNT-NH2, suggesting an increase in the degree of disorder due to the coverage of MWCNT-NH2 by PANI.
The XPS spectra survey of the samples, presented in Figure S3, indicated the presence of species with C 1s, O 1s, and N 1s in the layer. Using the intensities of the photoemission lines at binding energies of ~285 eV, ~532 eV, and ~400 eV, the atomic concentrations of all detected elements were calculated and displayed in Figure S3 [59].
Figure 4a,b and Table S3 (C1s) show how the aromatic component in the PANI spectrum almost disappeared in the case of the PANI-MWCNTs-NH2 film, probably due to the formation of a nanocomposite, but also due to it being trapped in nanotubes. The formation of a nanocomposite can also be explained by the significant increase in the concentration of C-C and C-H bonds for the PANI-MWCNTs-NH2 film [22].
Figure 4c,d, presenting the peak deconvolution of the O 1s spectra of the PANI and PANI-MWCNTs-NH2 samples, revealed that C=O and C-O-H/H2O are highly visible in PANI. Specific to the formation of the nanocomposite is the presence of C-O-C and C-O bonds, which were not observed in PANI layers. Table S4 (O1s) details the distribution of components.
Peak deconvolution of N 1s is shown in Figure 4e,f with three components, C-NH-, C-N=, and -C-N+, being observed. Their distribution is shown in Table S5 (N1s). A characteristic component of benzenoid amine, C-NH- has peaks centered at 399.99 eV in PANI and at 399.90 eV in PANI-MWCNTs-NH2 [60]. On deconvolving the PANI layer, three distinct curves which correspond to quinoid imine, benzenoid amine, and positively charged nitrogen are usually present. Simple PANI layers in their conductive form are known to have Ω range resistances due to being totally dopped with SO4+ ions from emeraldine salts. In PANI-MWCNT-NH2 layers, however, the C-N+ bonds are highly visible when compared to PANI layers, as in nanocomposites, PANI is an emeraldine salt, with the concentrations of PANI increasing after electrodeposition due the high area of MWCNT-NH2 covered by PANI’s conductive form. The peaks centered at 401.593 eV (in PANI) and 401.054 eV (in PANI-MWCNT-NH2) suggest that some nitrogen atoms are in the form of imine groups (C-N=), with a small shift in the binding energy arising due to the formation of a nanocomposite. The C-N= bonds are significantly more visible in the PANI-MWCNT-NH2 layers compared to the PANI layers, with an increase from 4.76% to 23.82% in bonding being observed when MWCNTs with -NH2 groups were added. The presence of more bonding with carbon and nitrogen atoms in the PANI-MWCNT-NH2 nanocomposite indicated successful wrapping of PANI on the surface of MWCNTs, similar to the behavior arising from binding with the nitrogen atoms from amine. All these observations indicate the presence of PANI trapped in the nanotubes, while highlighting its role in sensitizing the surface to the interaction with NH3 [61].

3.1.2. Mechanisms of the PANI-MWCNT-NH2 Sensor Interaction with NH3

Figure S4 shows the electrodeposition stage of PANI-MWCNT-NH2 and its possible PANI forms on interaction with MWCNT-NH2 and after its reaction with ammonium ions as per the acid–base mechanism. As seen in the sensor tests from the following sections, when put in contact with ammonia, a PANI-MWCNT-NH2 film leads to a significantly higher response than a PANI film. The attachment of polyaniline to MWCNT-NH2 significantly improves gas adsorption compared to polyaniline due to the increase in surface area through the carbonic structures. The diagram shows the emeraldine-doped PANI form resulting after the electropolymerization of PANI in sulfuric acid. The -NH2 amine terminal of MWCNT-NH2 in the electrodeposited solution becomes amino-protonated (due to its acidic pH), further favoring the electrostatic interaction between the conductive form of PANI and MWCNT-NH2. Although there are studies that use MWCNTs with functionalized carboxyl groups (instead of -NH2 groups), the reaction with ammonium ions that leads to the formation of amide bonds would take place at a temperature of at least 100 °C, making it unsuitable for use at room temperature [62]. If this strategy were followed, the sensor would become sensitive due the electron delocalization from amide bonds, while having a more difficult recovery, as the resulting bonds would be much stronger. Presently, the NH3 sensing mechanism employed by PANI-MWCNT nanocomposites is not fully understood, with gas sensor performance potentially originating from several factors [22].
PANI is a conducting p-type semiconductor (as an emeraldine salt, ES) which is de-doped (as an emeraldine base, EB) when ammonia changes the pH of the reaction medium at the interface of the sensitive film with the gas. The attachment of polyaniline to MWCNT-NH2 significantly improves the adsorption of NH3 molecules and the transfer of electrons through the polymer network to the carbon nanotubes. PANI-MWCNT-NH2 is also considered a p-type semiconductor. When NH3 molecules are adsorbed on the surface of PANI from the composite, due to the large number of NH+, these are quickly converted into the more favorable N H 4 + according to the reversible reactions presented in the following reaction:
PANI NH + ES + NH 3   PANI EB + NH 4 +
In this way, a large number of electrons are transferred to PANI and the strong π π interaction with MWCNT enhances the electron delocalization. This leads to a higher charge transfer between PANI and MWCNT-NH2, with further electrons being passed through holes, the majority being carriers of p-type semiconductors, leading to an increase in sensor resistance. Increased nanotube diameters and the presence of more protonated PANI amine groups in the composites were also demonstrated with the SEM and XPS analysis, respectively. Recovery is assured by the reversibility of the reaction, with NH4+ ions decomposing (after exposure to air/nitrogen with controlled humidity) into NH3 and protons such that the base resistance can be recovered and PANI doped again.

3.2. PANI-rGO-ZnO

3.2.1. PANI-rGO-ZnO Electrodeposition

As previously shown, coupling ZnO with conductive polymers can lead to a reduction in the working temperature and of the response/recovery times [63]. Electrodeposition techniques were employed throughout the film synthesis. In the first stage, the GO was electrodeposited on IDEs by immersing the sensor in the electrodeposition solution, followed by CA at a constant potential of −2000 mV for GO reduction and formation of rGO. At room temperature, GO is typically an electrical insulator and remains non-conductive, unless the oxygen functional groups on the graphite are eliminated. Distance between the graphitic domains is thus reduced, which increases the charge transport in the materials. The polymer used is a conductive one which could cover an incomplete electrochemical reduction of GO. The deposition time was chosen as optimal at 100 s such that the rGO layer can homogenously cover the gold electrode. rGO presents oxygenated functional groups on the surface and edges of the sheet, such as hydroxyl and carboxyl groups, which may electrostatically interact with the gold IDEs, leading to a reduction in the deposition time. The remaining functional groups in the rGO nanosheets then attach to the aniline monomers in addition to the physical bonding occurring during the aniline electropolymerization process through hydrogen bonding and π − π interactions. Parameters such as the concentration of Zn(NO3)2 and temperature of ZnO electrodeposition were then evaluated to obtain resistances in the range of kΩ. ZnO morphology and therefore the gaseous sensitivity of the ZnO layer are highly corelated with these parameters, as seen in previous studies [64,65]. During the electrodeposition of ZnO, the temperature plays an important role in the hydroxylation and dehydroxylation reactions as follows: at low temperature, the rate of hydroxylation is faster than that of dehydroxylation, leading to the production of large amounts of OH and thus the formation of smaller-sized grains [66]. Conversely, increasing the temperature favors the dehydroxylation reaction, leading to the formation and deposition of ZnO on the surface, followed by reactions (6)–(9) at the cathode [62].
  NO 3   + 2 e +   H 2 O   2 OH +   NO 2
Zn 2 + 2 HO   Zn OH 2
Zn OH 2   ZnO   +   H 2 O
Zn NO 3 2 + 4 Zn ( OH ) 2   Zn 5 NO 3 2 ( OH ) 8
Equation (9) is only possible when low deposition temperatures and an increased degree of the hydroxylation are involved. Therefore, the temperature for ZnO electrodeposition, the concentration of ANI, and the concentration of ZnO were tested to achieve a suitable reading sensitivity with final resistances greater than 1 kΩ. The optimal temperature for ZnO grain formation was determined to be 80 °C, with the film reaching resistance values greater than 10 kΩ when using the optimal concentration of ANI, Zn(NO3)2 and GO. Resistances in the Ω range were obtained for temperatures lower than 80 °C, while temperatures greater than 90 °C led to resistances reaching MΩ values. Table S6 shows the results for different ratios of aniline, ZnO, and GO in the composite film, with ZnO deposition being executed at a constant temperature of 80 °C. The final result of the deposition stage was the homogeneous distribution of small (<40 nm) spherical ZnO nanoparticles on the surface of the sensing layer (see the SEM section). To our knowledge, this represents a novel technique for the facile electrochemical deposition of ZnO nanoparticles on a PANI–graphene composite film [67].

3.2.2. PANI-rGO-ZnO Structural and Morphological Characterization

  • SEM, Raman, and Energy-dispersive X-ray
SEM was used to further examine the surface of the graphene oxide and of the short polyaniline nanowires deposited throughout the rGO network, as shown in Figure 5a and Figure 5b, respectively. The high temperature used for the electrodeposition of ZnO led to the formation of nanoparticles over the entirety of the PANI-rGO network, as presented in Figure 5c. The size distribution of ZnO NPs was obtained from SEM images by measuring 200 individual nanoparticles. Spherical geometry of the ZnO NPs was also observed from the SEM images. ZnO NPs’ diameters were determined to vary between 20 and 83 nm. A histogram was fitted with a Gauss function centered around the mean diameter of 38.3 ± 10.6 nm, as shown in Figure 5d. As per previous studies, the deposition of small nanoparticles or other nanostructures of ZnO leads to an increase in the sensitivity of the gaseous sensors [68,69]. Energy-dispersive x-ray (EDX) spectra from Figure S4 revealed the existence of several chemical species in the PANI-rGO-ZnO film. Eight elements could be detected: carbon (C), nitrogen (N), oxygen (O), aluminum (Al), gold (Au), chlorine (Cl), potassium (K), and zinc (Zn), with Zn being present in the largest concentrations (Figure S5).
Spectra of the nitrogen dioxide sensitive film and two reference components are shown in Figure 5e. In the rGO reference spectrum, two prominent peaks at 1355 cm−1 (D bands—lattice defects of E1g mode and disordered sp3 bonded carbon) and at 1589 cm−1 (G bands—E2g mode corresponds to in-plane stretching of ordered sp2 bonded carbon) suggest that the structure of graphene is maintained in the composites [70]. In the PANI-rGO spectrum, C–H in-plane bending vibration of the benzenoid and quinoid ring corresponds to the bands at 409 cm−1, 606 cm−1, 818 cm−1, and 1176 cm−1, whereas C–N quinoid stretching appeared at 1348 cm−1, 1486, and 1577 cm−1 [71]. The bands at 1377 cm−1 and 1569 cm−1 are attributed to D and G rGO bands, where both the position (shifted by ~20 cm−1) and intensity are highly affected by the structure change in the PANI-rGO-ZnO composite matrix. As per literature values, in the PANI-rGO-ZnO spectrum, the 2E1 localized at 327 cm−1 and E2 mode centered at 438 cm−1 are attributed to ZnO. Meanwhile, the intensity ratio of the D and G bands (ID/IG) is the signature by which the ordered and disordered crystal structures of carbon modes are evaluated [72]. For low and moderate defect densities, ID/IG increases with defect density. For the presented film, the intensity ratio ID/IG is 0.97 in rGO but decreases to 0.77 for the PANI-rGO-ZnO composite matrix, due to the G and D bands of rGO overlapping with those of ZnO and PANI.

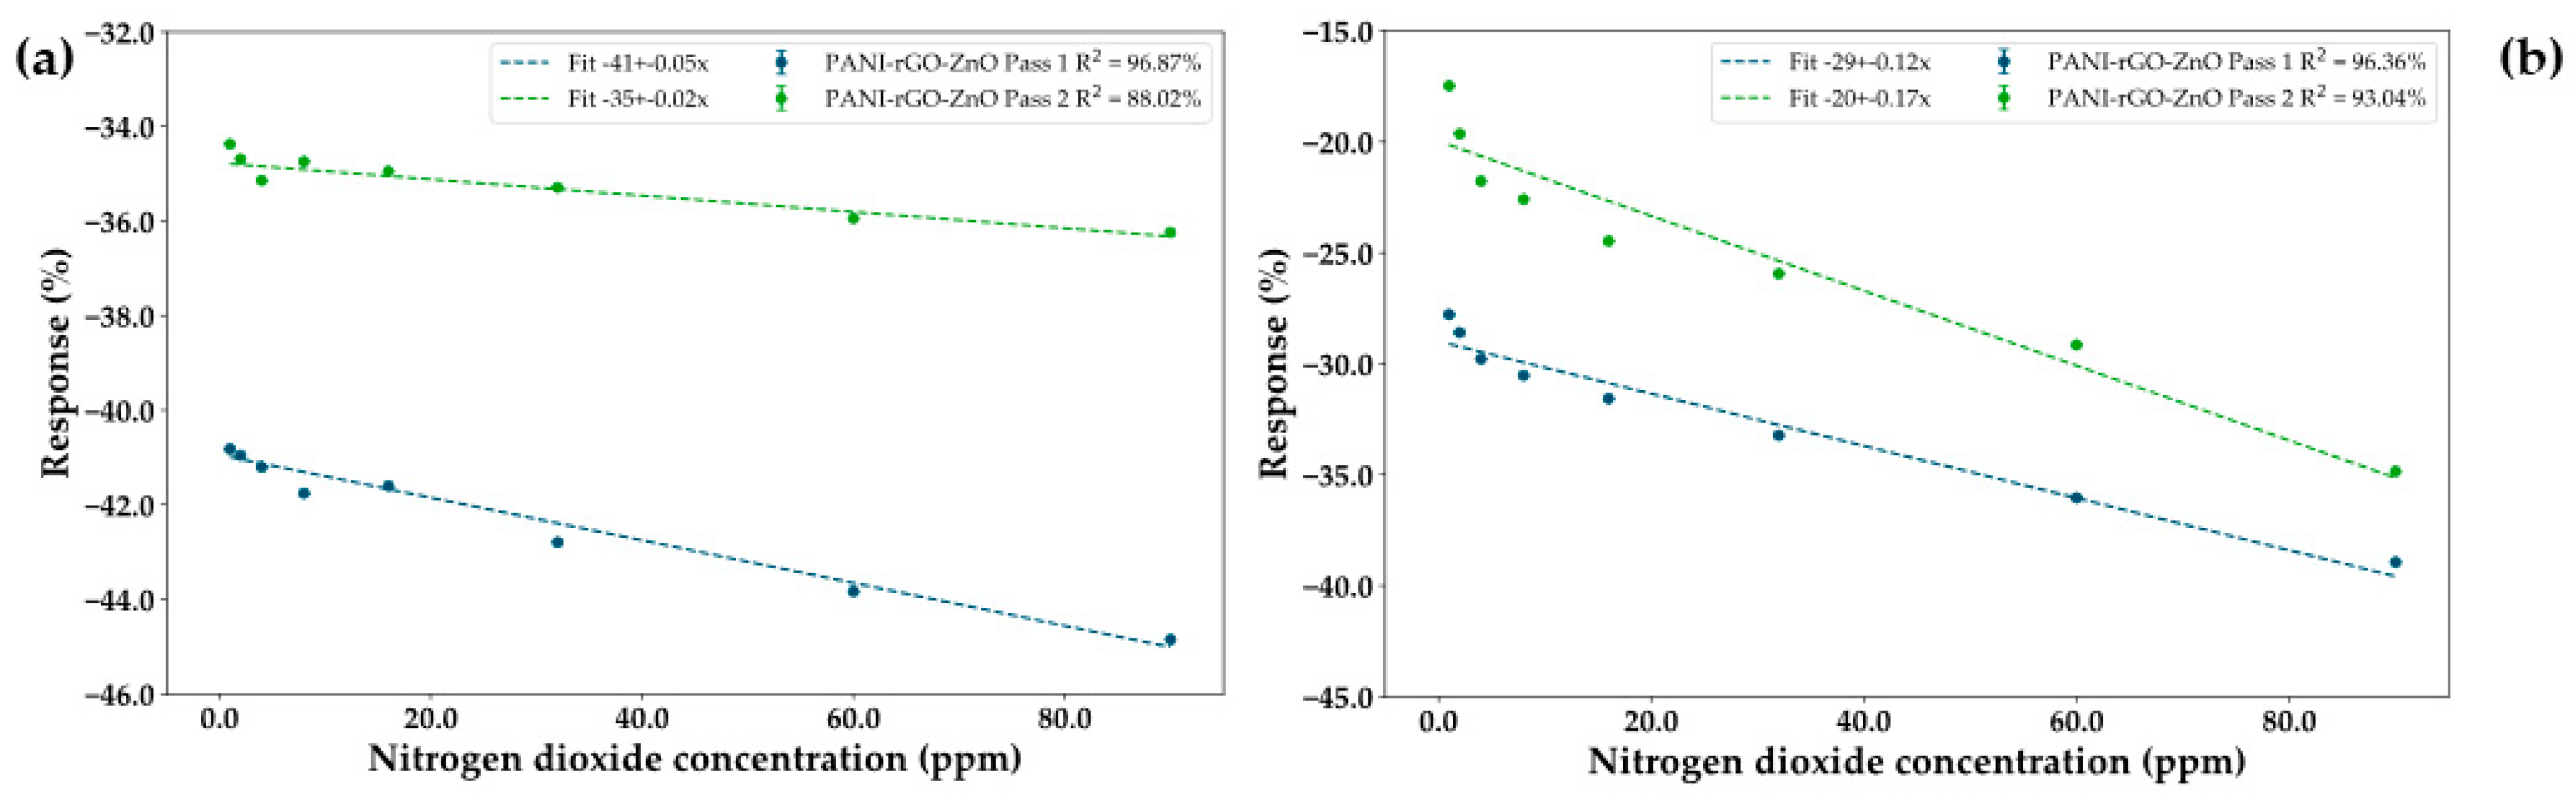
3.2.3. Mechanisms of the PANI-rGO-ZnO Sensor Interaction with NO2
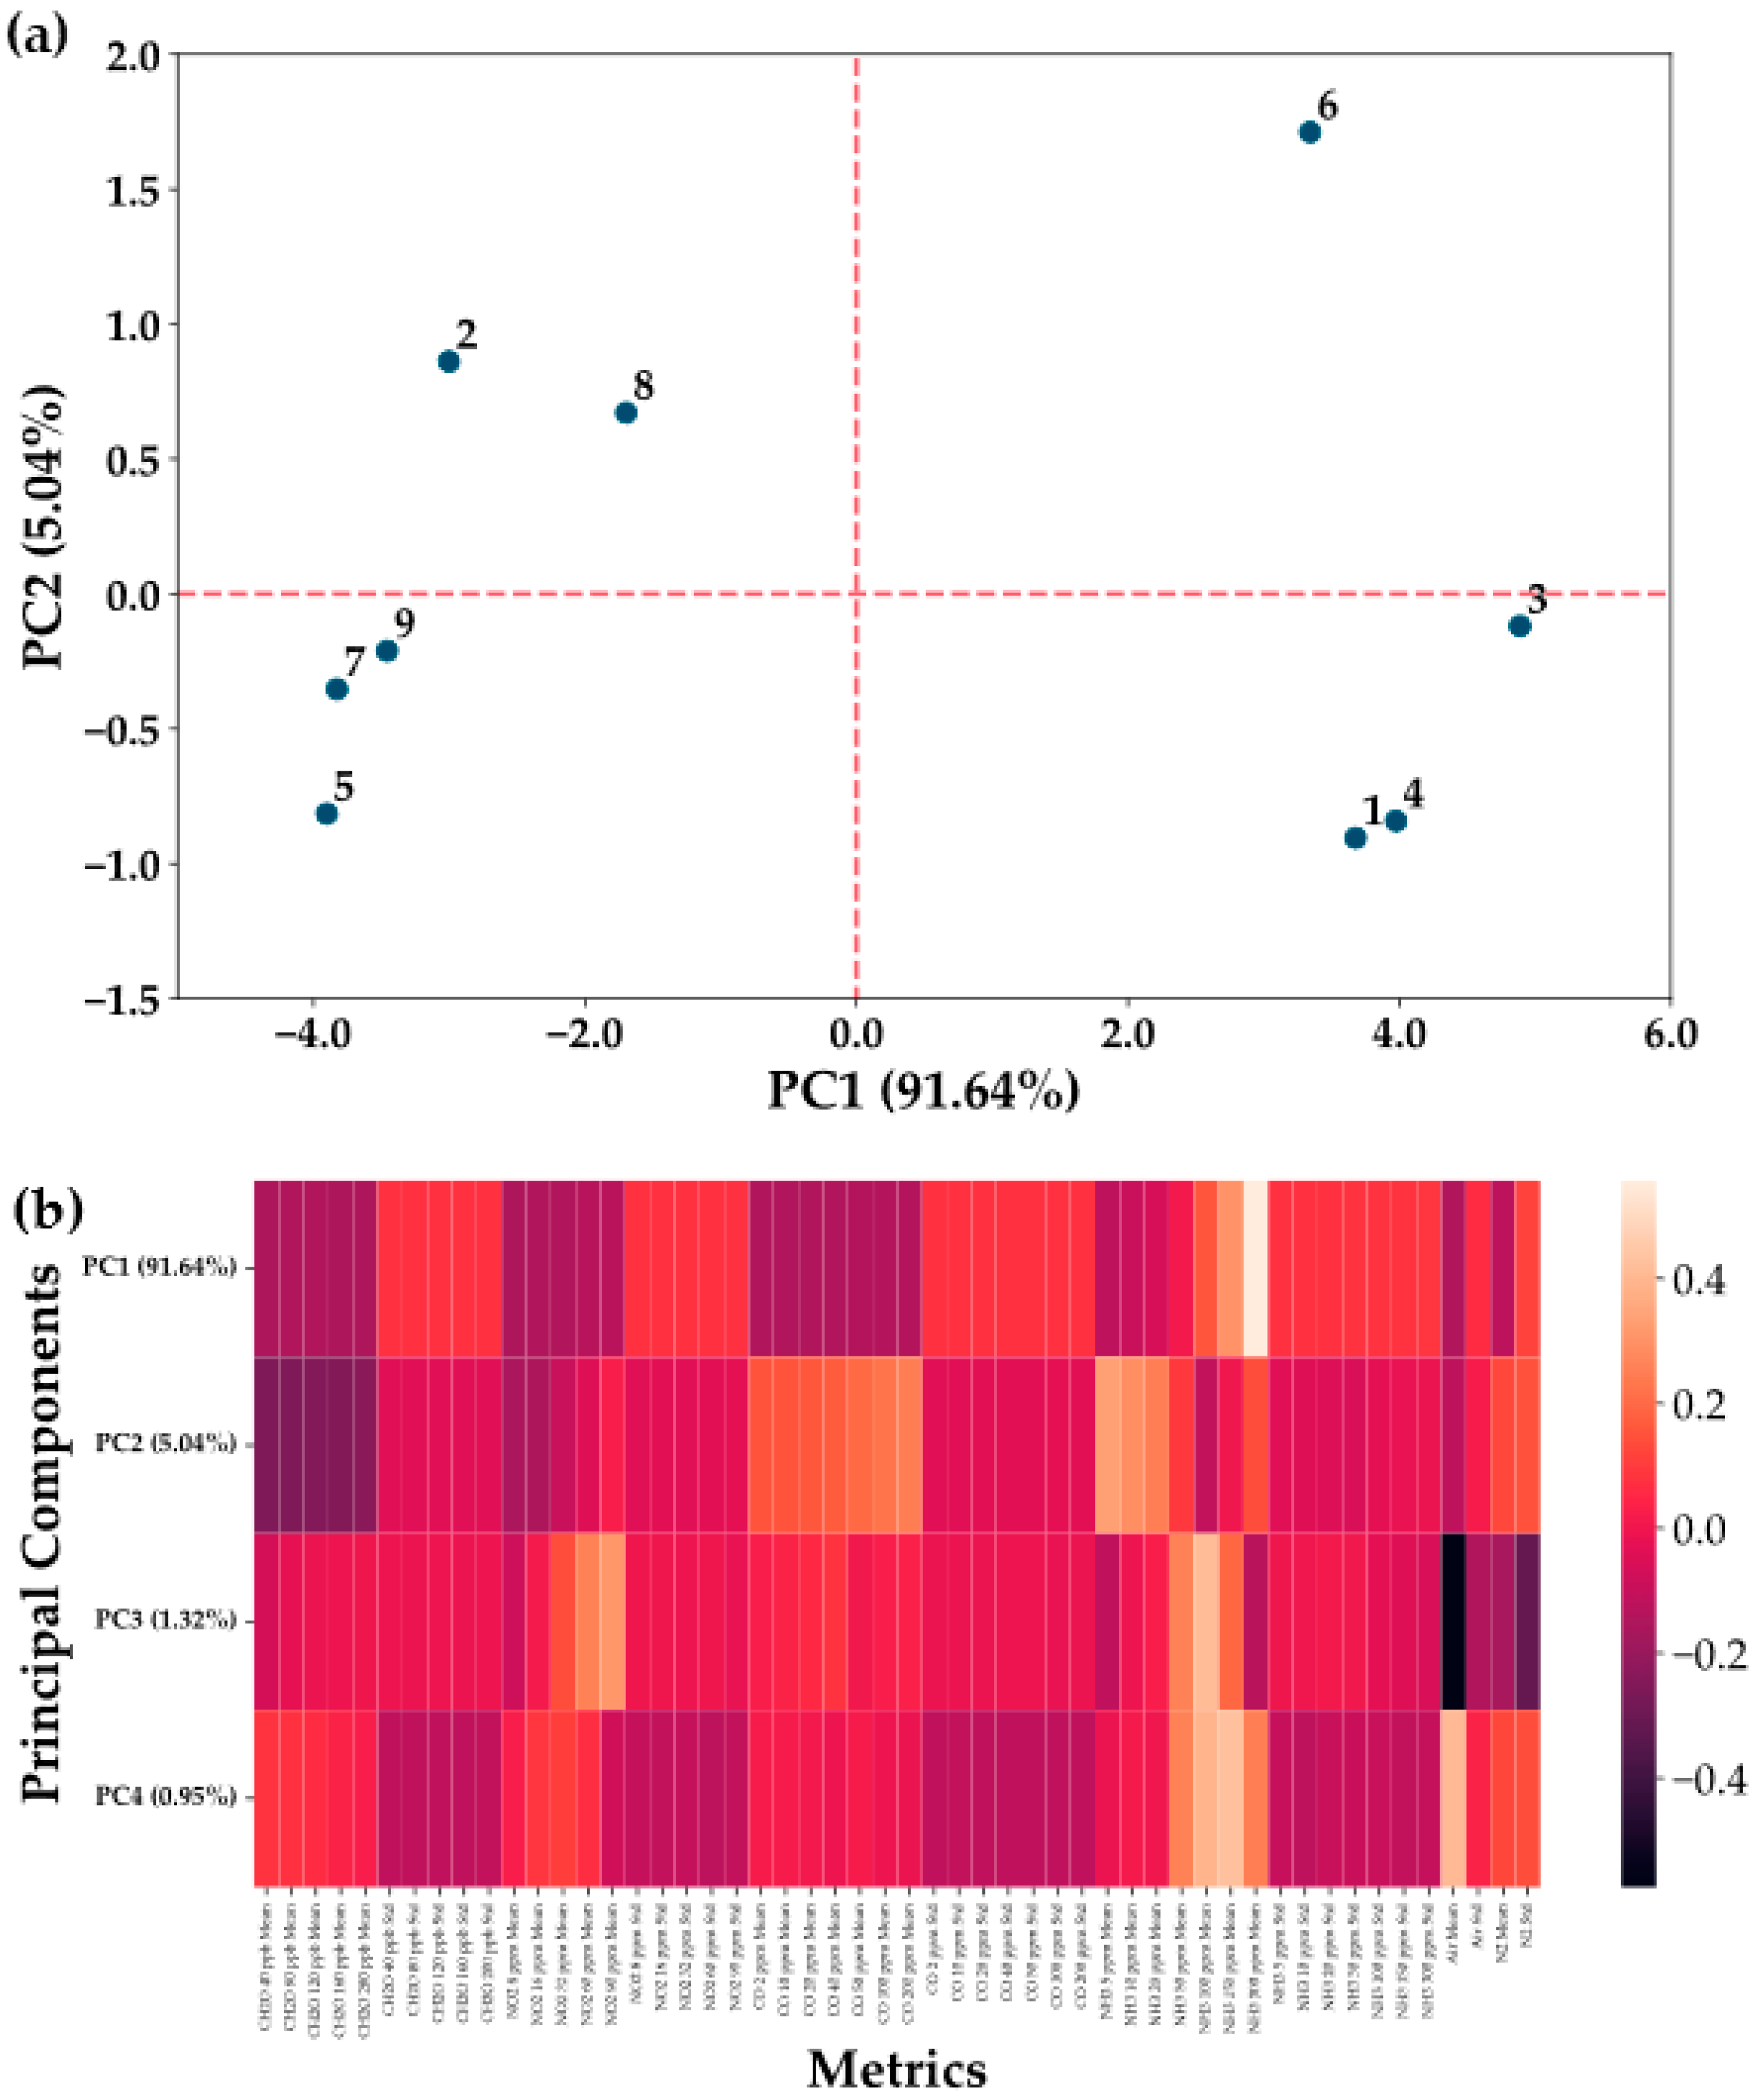
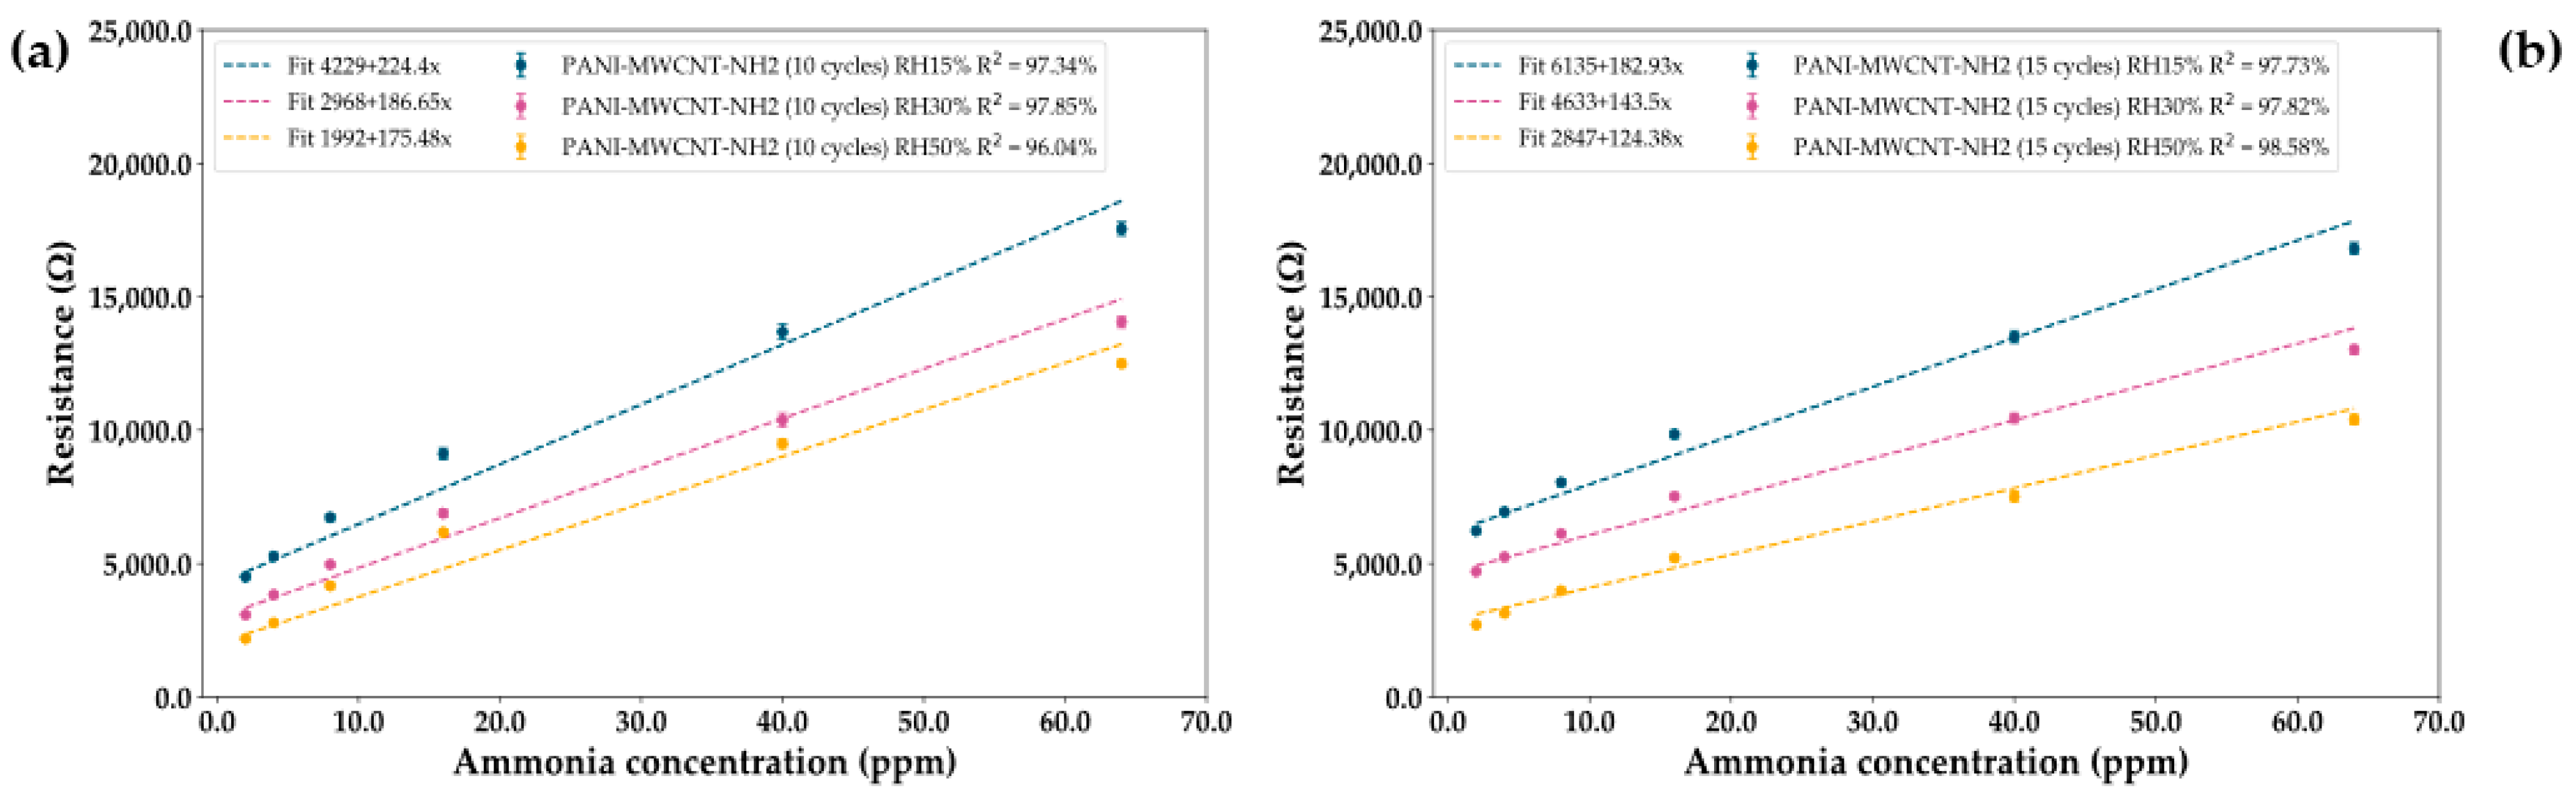
ZnO is considered an n-type semiconductor, with its resistance decreasing in the presence of reducing gasses and increasing upon exposure to oxidizing gasses. The PANI-rGO-ZnO gas sensing mechanism upon exposure to NO2 can be explained through the mechanism shown in Figure 6a. Oxygen adsorption is an important component assuring electrical transport in both ZnO and PANI-rGO. From the literature, it can be seen that when exposed to air, the sensor reacts with O2, resulting in the formation of several oxygen adsorbates, as presented in Equations (10)–(12):
O 2 air O 2 adsorbed
O 2 adsorbed   +   e   O 2 adsorbed
O 2 adsorbed +   e   2 O adsorbed
NO 2 + 2 O adsorbed NO 2 +   O 2 adsorbed
When the sensor is exposed to air, the adsorbed species ( O 2 a d s o r b e d and   O 2 a d s o r b e d ) can trap electrons from ZnO to form O 2 and 2 O a d s o r b e d at the surface of the ZnO nanoparticles, leading to the formation of an electron-depleted surface layer. This process occurs even in the absence of other gases such as NO2. However, upon exposure to NO2 , the ZnO composite material will widen its depletion region, formed between rGO and ZnO (Figure 6a), leading to an increase in resistance. Other studies have also observed similar behaviors, being more prominent at elevated temperatures (>90 °C) [73]. However, this is dissimilar to the behavior encountered on testing the developed PANI-rGO-ZnO upon exposure to NO2 at room temperature and in a nitrogen atmosphere, where a resistance decrease was observed. While the oxygen adsorption mechanism does not hold in such circumstances, studies on Density Functional Theory (DST) have shown that the electronic properties of a ZnO monolayer can be effectively tuned by absorbing NO2 by physisorption, with direct interaction of adsorbed NO2 molecules with the materials and without involvement of chemisorbed oxygen. An example of similar interactions at room temperature can be observed for cobalt oxysulfide [74,75]. This abnormal behavior persists while testing at room temperature in a synthetic air atmosphere, with sensors becoming more sensitive than in the nitrogen atmosphere. Thus, an alternative explanation might be the presence of a high concentration of rGO in the sensing layer. As graphene does not require oxygen activation, when the sensor is exposed to an oxidizing gas such as NO2, the gas could directly attract the electrons from graphene due to their higher affinity, leading to the electron transfer from the ZnO–graphene structure to the surface adsorbed NO2 to form NO 2 (as in equation 13), behaviors also observed by other authors [70]. Although exposure to NO2 of the ZnO composite material will lead to the widening of its depletion regions, the rGO behavior will dominate due to its much higher conductivity, thus leading to an overall lowering of resistance. As rGO has adequate coverage of the sensing surface (Figure S6A,B) and the behavior of the tested films appears to change with the content of rGO (Figure S7), this might be the explanation for the decrease in resistance. Depending on the method of ZnO preparation, the grain size can also have a high effect on the sensitivity of the end film, with it rapidly decreasing for diameters larger than 40 nm due to the low increase in the specific area [76]. As NO2 acts as a dopant for PANI films, the resistance is expected to decrease. Two other possible explanations for the observed behavior can be excess PANI polymerization over the rGO network or the higher aggregation and interconnectivity of rGO [77]. This behavior was also observed by other authors who employed ZnO at room temperature, in combination with nanowires or other nanostructures. P-type material behavior persists even upon exposure to NO2 at room temperature, 30 °C, and 50 °C [70,78,79].
The diagram shown in Figure 6b portrays the formation of the PANI-rGO-ZnO film through electrodeposition and its possible interaction with NO2. Thus, a final explanation of the decreasing resistances on sensor exposure to NO2 would revolve around the wider depletion layer at the interface between rGO and ZnO being outbalanced by the higher conductivity resulting from the high concentration of rGO functional groups, leading to a resistance decrease. While unexpected, this behavior has the advantages of high sensitivity at room temperature and lower energy consumption.

3.3. Data Analysis

  • Materials selection
To determine the best sensing layer for the detection of ammonia and nitrogen dioxide, a series of sensors have been manufactured and tested. The decision on the sensors warranting further investigation has been informed by a PCA classification of the sensing materials and an initial determination of linearity and sensitivity of the sensors on four competing pollutants: formaldehyde, nitrogen dioxide, carbon monoxide, and ammonia. Results of the PCA classification can be observed in Figure 7a, which shows a differentiation in the effects of the CPs employed and the addition of carbonic materials in the sensing layer on the sensitivity of the sensors to the given pollutants.
From Figure 7, it can be seen that a first important split occurs between the other CPs and PANI through its response to ammonia, with PC1 showing that PANI-based gasses have a much better response to ammonia, as inferred from the literature. PC2 also offers information on the introduction of carbon structures into the sensing layers, with them having a boosting effect on the retrieved signal, especially on the lower concentrations. The exceptions appear to be sensing layers using either non-reduced graphene oxide in combination with PPY or carbonic materials without the stabilizing effect of CPs. From comparing sensing layers making use of just PANI, with those also employing carbon nanostructures, such as PANI-MWCNT-NH2 (Figure S8), it can be seen that the carbon nanostructures do not have an effect on only low concentrations, but on the whole sensitivity of the sensor. This is lost in the PCA due to data being standardized prior to analysis. Thus, this confirms that the addition of carbon nanostructures in PANI has a significant effect on sensor efficiency, leading to large increases in sensitivity, but also making its ammonia response more linear.
As the effect of NO2 appears only on PC3, which covers little of the data variance, this suggested the need for improvements to the initial film to boost the signal. Of the tested sensors, the highest sensitivity to NO2 appears to be registered for sensors 3 and 1 (Figure S9), but of the two, only sensor 3 (PANI-rGO) had sufficient linearity for further improvement. Metrics for quantifying the performance of all selected sensors for the detection of ammonia and nitrogen dioxide can be observed in Table 1 and Table 2. Response metrics of the sensors are quoted for a single concentration value, with the slope of the linear fit giving another quantifier for the sensitivity over the linear domain.
  • PANI-MWCNT-NH2 sensor
A PANI sensor with added carbon structures was determined to be the best performing sensor for the detection of ammonia, with an increase in sensitivity of more than 20 times being observed upon the addition of MWCNT-NH2 to the conductive polymer. However, to improve the performance of the sensor, several other parameters also required fine tuning, with the thickness of the sensing layer playing an important part in the intensity and linearity of the sensor response. Thus, two sensing layers are compared to highlight this difference, despite their comparatively similar performances in other metrics: a thinner sensing layer obtained upon running the electrodeposition for 10 CV cycles and a thicker layer obtained upon running it for 15 cycles. To observe stability of the sensors on prolonged periods of used, four continuous measurement cycles were taken, with each pass executed at an interval of one hour. From Figure 8a, it can be seen that both sensors do not reach full saturation on the first pass of the measurement cycle, with low concentrations giving much lower resistance measurements on the first pass. This behavior can also be observed in the repeatability and stability measurements shown in Figure 8. However, at high concentrations, this underperformance starts to disappear for both sensors, with the thinner sensor achieving saturation faster. Moreover, the thicker sensor appears to gain stability at a larger initial resistance, while reaching lower resistance values at high concentration, thus resulting in a lower sensitivity and response. From the linearity plots (Figure 8b,c), it can be seen that the thinner sensor indeed has a higher sensitivity, while the thicker one has a higher tendency towards being linear. However, due to the higher air resistance at which the thicker sensor stabilizes, its response is lower when compared to the expected value from the resistance measurements. This becomes even more pronounced for subsequent passes, when the response can become negative due to the measurements at lower concentrations being lower than those in air. Both sensors have LoDs smaller than 1 ppm (Table 1), thus making them usable for their intended purpose.
From Figure 8 d,e, it can be seen that both sensors have a high degree of repeatability following the first measurement pass, with RSDs of 10.06% and 11.79% being registered for the thin and thick sensors, respectively. This metric was obtained when calculating the repeatability at 8 ppm of ammonia, 30% humidity, and over a period of 1 month, while taking into account the first pass. For the values calculated at 20 ppm ammonia and 0% humidity, those RSDs increase to 11.9% and 13.74%, respectively. Thus, it appears that the sensor is sufficiently stable in time and has a good repeatability both in the presence and absence of humidity. Of the four tested gasses, the sensors are also selective to ammonia, as can be seen from Figure 8f. Concentrations of CO and NH3 appear in two stacks due to the gas tank needing to be changed to account for the high concentration range.
Selectivity was also tested with respect to humidity, with it being one of the main confounding factors in chemoresistive sensors (Figure 8f and Figure 9a,b). Thus, it can be observed that with increasing humidity, there is a decrease in the response of the sensors as well as in the slope of the linear fit, while there appears to be an increase in linearity up to a breaking point where the saturation of water in the sensing layer leads to an overall worsening of results. However, while humidity has an effect on the response, it is minimal when compared to the sensor responses to ammonia.
  • PANI-rGO-ZnO sensor
From the literature and experiments, it was determined that the best improvement to the PANI-rGO sensing layer is the addition of ZnO nanoparticles, thus leading to the increase in sensitivity while preserving its response at room temperature. While this sensing layer leads to a high initial resistance, such behavior is acceptable due to the decrease in sensor resistance with the concentration of gas (Figure 10a). As with the ammonia sensors, it can be observed than initial passes result in a different response when compared to the subsequent measurements, suggesting that the sensors are best used for continuous measurements with data logging after an adjustment period. Moreover, as opposed to the ammonia sensors, it can be seen that there is more dispersion of the response at subsequent passes at low concentrations due to a variation in the initial resistance. However, at high concentrations, this variation decreases to 6.62% RSD at 90 ppm as opposed to 8.85% RSD at 8 ppm.
Linearity plots show a high dependence of the sensor response on the nitrogen dioxide concentration, with the slope of the linear fit reaching values of −294.27 Ohm/ppm (Figure 10b). However, due to the response being in depletion, sensitivity values do not fully represent the true response of the sensors. If we were to use the final gas value as the determinant of the sensitivity metric, the response would be better exemplified, such as for 90 ppm obtaining a value of 101.74% rather than the sensitivity being constrained in the −3.91% to −49.61% range for the tested gas concentrations. Moreover, from the stability plot (Figure 10c), it appears that the response remains unchanged even after 2 weeks of testing.
In terms of selectivity, the PANI-rGO-ZnO sensor appears (Figure 10d) to be highly selective to nitrogen dioxide, with it being the only gas which has a full spread coverage of the concentrations. However, there seems to be a small response to the higher concentrations of formaldehyde, though it is negligible when compared with the response to NO2. Of particular note is that despite PANI-rGO being highly sensitive to ammonia, the addition of ZnO and the selection of the electrodeposition parameters resulted in the minimization of the final response to any other gasses apart from nitrogen dioxide.
Control of the ratio between the thickness of the rGO layer and the ZnO layer is of great importance to the preservation of the acceptable performance of the NO2 sensor, with a much thicker layer of the carbonic material resulting in a loss of performance of the sensor. In such cases, it can be seen that the presence of oxygen is required to boost the signal to levels previously observed in the optimized sensor, as observed from Figure 11a,b. Moreover, it can be observed that the decrease in resistance upon increases in the gas concentration persists in the presence of oxygen, confirming the tradeoff between the graphene and the depletion layer being the main driving mechanism behind the sensor behavior.

4. Conclusions

Two sensors sensitive to different gasses were developed based on the electrodeposition of C-hybrid materials on gold interdigitated electrodes. Moreover, progress has been made on determining the optimal parameters for the selected electrodeposition method, as well as on the optimization of the monomer and carbon material concentrations in the hybrid materials such that response and selectivity to NO2 and NH3 are maximized. The sensors were tested at room temperature, with both sensitive films exhibiting acceptable sensitivity, linearity, and repeatability over a gas concentration domain relevant to preserving human safety and health. It was shown that the addition of carbon materials to CPs, such as PANI, drastically increases the sensitivity of those films to the target gases, with carbonaceous materials such as MWCNT-NH2 and rGO eliciting preferential responses from NH3 and NO2, respectively. These results highlight the viability of chemosensors based on composite films with C-hybrid materials for the detection of pollutant gasses in the environment, with further fine-tuning allowing for the development of such sensors for a wider range of pollutant gasses. Testing of the NO2 sensor also highlighted a curious interplay between ZnO nanostructures and carbon materials. Despite it being an oxidizing gas, which would elicit an increase in resistance due to the widening of the depletion layer, NO2 leads to a decrease in resistance in films with a concentration of carbon materials higher than 1%, when their behavior becomes dominant. However, the presence of ZnO is necessary for stabilizing the sensitive film and increasing the selectivity and sensitivity to nitrogen dioxide. While the sensors have exhibited acceptable performance in laboratory conditions, it is important to further test their reliability under real conditions and over several batches of the same sensitive film. One method to preserve the performance and stability of the sensor is through encapsulation, with this being one of the main avenues of improving the presented designs before further testing in real environments. Their simple design, functionality at low temperatures, and effective performance would allow such sensors to compete with, and even outdo, existing commercial devices, making them desirable in the pursuit of better monitoring the effects of pollution on our surroundings.

Supplementary Materials

The following supporting information can be downloaded at: https://www.mdpi.com/article/10.3390/chemosensors11020132/s1, Figure S1: Interdigitated electrode layout. (a) Fabricated sensor, (b,c) sensors with electrodeposited films; Figure S2: Diagram of testing platform; Table S1: Metrics employed for the PCA. One vector is composed of all elements in the table. Hence metrics are collected for each tested film; Figure S3: XPS survey spectra of the PANI/MWCNT-NH2; Figure S4: SEM images at different magnitude of active area of the sensors covered by PANI-rGO-ZnO; Tabel S3. The component for C 1s spectra of PANI and PANI-MWCNT-NH2; Tabel S4. The component for O 1s spectra; Tabel S5. The component for N 1s spectra; Table S6. Resistance values for PANI-rGO-ZnO (ANI in 1MHCl) films obtained following the electrodeposition of ZnO at 80 °C; Figure S5: Resistances changes correlated with% rGO content for PANI-rGO-ZnO; Figure S6: PCA of tested sensors 1–8 to NO2; Figure S7. Ressistances changes correlated with %rGO content for PANI-rGO-ZnO; Table S7. Fabrication protocol for the sensors employed in the selection process; Figure S8. Response and linearity of two sensors, on using only PANI and one adding MWCNT-NH2 to PANI, on measuring ammonia concentration in a nitrogen atmosphere without added humidity; Figure S9. PCA of tested sensors 1–8 to NO2.

Author Contributions

Conceptualization, A.G., C.-M.M. and M.S.; Data curation, A.A., A.G. and G.S.M.; Formal analysis, M.S., S.D., I.S., G.S.M., M.I., B.F. and A.A.; Investigation, C.-M.M., C.B., S.D., N.D., O.B., G.V.C., G.S.M., G.C. and C.P.; Methodology, A.G., C.-M.M., M.S., C.B., S.D., N.D., O.B., C.P., I.S., G.C. and G.S.M.; Project administration, B.F.; Resources, B.F. and C.A.M.; Software, A.G. and C.-M.M.; Supervision, A.G., C.A.M., A.A., C.-M.M. and I.S.; Validation, C.A.M., G.V.C., C.-M.M., A.A. and M.S.; Visualization, C.-M.M., S.D., I.S., A.G., B.F., M.I. and G.V.C.; Writing—original draft, A.G., C.A.M., C.-M.M., C.B., N.D., O.B., C.P., G.S.M., M.I., G.C. and M.S. All authors have read and agreed to the published version of the manuscript.

Funding

This research was funded by Horizon 2020, ECSEL-IA - ECSEL Innovation Action, Call ECSEL-2-19-IA, Project number: 876190 (Moore4Medical project), HORIZON-WIDERA-2021-ACCESS-03, Project 101079455 (NET4Air) and partially supported by the contract PN 23 21 01 06 sponsored by the Romanian Ministry of Research, Innovation and Digitalization.

Institutional Review Board Statement

Not applicable.

Informed Consent Statement

Not applicable.

Data Availability Statement

Data are contained within the article and supplementary material.

Conflicts of Interest

The authors declare no conflict of interest.

References

  1. U.S. Environmental Protection Agency. Report to Congress on Indoor Air Quality: Volume 2; EPA/400/1-89/001C; U.S. Environmental Protection Agency: Washington, DC, USA, 1989. [Google Scholar]
  2. Valera-Medina, A.; Amer-Hatem, F.; Azad, A.K.; Dedoussi, I.C.; De Joannon, M.; Fernandes, R.X.; Glarborg, P.; Hashemi, H.; He, X.; Mashruk, S.; et al. Review on ammonia as a potential fuel: From synthesis to economics. Energy Fuels 2021, 35, 6964–7029. [Google Scholar] [CrossRef]
  3. Szmant, H.H. Organic Building Blocks of the Chemical Industry; John Wiley & Sons: Hoboken, NJ, USA, 1989. [Google Scholar]
  4. Ammonia, National Institute for Occupational Safety and Health. Available online: https://www.cdc.gov/niosh/idlh/7664417.html (accessed on 15 November 2022).
  5. Dotson, G.S.; Maier, A.; Parker, A.; Haber, L. TImmediately Dangerous to Life or Health (IDLH) Value Profile: Nitrogen Dioxide; CAS No. 10102-44-0; Centers for Disease Control and Prevention, National Institute for Occupational Safety and Health: Washington, DC, USA, 2017. [Google Scholar]
  6. Fernández-Ramos, M.D.; Capitán-Vallvey, L.F.; Pastrana-Martínez, L.M.; Morales-Torres, S.; Maldonado-Hódar, F.J. Chemoresistive NH3 gas sensor at room temperature based on the Carbon gel-TiO2 nanocomposites. Sens. Actuators B Chem. 2022, 368, 132103. [Google Scholar] [CrossRef]
  7. Serafini, M.; Mariani, F.; Gualandi, I.; Decataldo, F.; Possanzini, L.; Tessarolo, M.; Fraboni, B.; Tonelli, D.; Scavetta, E. A Wearable Electrochemical Gas Sensor for Ammonia Detection. Sensors 2021, 21, 7905. [Google Scholar] [CrossRef] [PubMed]
  8. Xu, K.; Zhang, B.Y.; Mohiuddin, M.; Ha, N.; Wen, X.; Zhou, C.; Li, Y.; Ren, G.; Zhang, H.; Zavabeti, A.; et al. Free-standing ultra-thin Janus indium oxysulfide for ultrasensitive visible-light-driven optoelectronic chemical sensing. Nano Today 2021, 37, 101096. [Google Scholar] [CrossRef]
  9. Yao, Q.; Ren, G.; Xu, K.; Zhu, L.; Khan, H.; Mohiuddin, M.; Khan, M.W.; Zhang, B.Y.; Jannat, A.; Haque, F.; et al. 2D plasmonic tungsten oxide enabled ultrasensitive fiber optics gas sensor. Adv. Opt. Mater. Mater. 2019, 7, 1901383. [Google Scholar] [CrossRef]
  10. Korotcenkov, G.; Cho, B.K. Metal oxide composites in conductometric gas sensors: Achievements and challenges. Sens. Actuators B-Chem. 2017, 244, 182–210. [Google Scholar] [CrossRef]
  11. Park, S.Y.; Kim, Y.; Kim, T.; Eom, T.H.; Kim, S.Y.; Jang, H.W. Chemoresistive materials for electronic nose: Progress, perspectives, and challenges. InfoMat 2019, 1, 289–316. [Google Scholar] [CrossRef]
  12. Dey, A. Semiconductor metal oxide gas sensors: A review. Mater. Sci. Eng. B 2018, 229, 206–217. [Google Scholar] [CrossRef]
  13. Liu, X.; Cheng, S.; Liu, H.; Hu, S.; Zhang, D.; Ning, H. A survey on gas sensing technology. Sensors 2012, 12, 9635–9665. [Google Scholar] [CrossRef]
  14. Cheng, Y.; Ren, B.; Xu, K.; Jeerapan, I.; Chen, H.; Li, Z.; Ou, J.Z. Recent progress in intrinsic and stimulated room-temperature gas sensors enabled by low-dimensional materials. J. Mater. Chem. C 2021, 9, 3026–3051. [Google Scholar] [CrossRef]
  15. Savin, M.; Mihailescu, C.M.; Avramescu, V.; Dinulescu, S.; Firtat, B.; Craciun, G.; Brasoveanu, C.; Pachiu, C.; Romanitan, C.; Serban, A.B.; et al. A New Hybrid Sensitive PANI/SWCNT/Ferrocene-Based Layer for a Wearable CO Sensor. Sensors 2021, 21, 1801. [Google Scholar] [CrossRef] [PubMed]
  16. Liu, C.; Duan, Z.; Zhang, B.; Zhao, Y.; Yuan, Z.; Zhang, Y.; Wu, Y.; Jiang, Y.; Tai, H. Local Gaussian process regression with small sample data for temperature and humidity compensation of polyaniline-cerium dioxide NH3 sensor. Sens. Actuators B-Chem. 2023, 378, 133113. [Google Scholar] [CrossRef]
  17. Javadian-Saraf, A.; Hosseini, E.; Wiltshire, B.D.; Zarifi, M.H.; Arjmand, M. Graphene oxide/polyaniline-based microwave split-ring resonator: A versatile platform towards ammonia sensing. J. Hazard. Mater. 2021, 418, 126283. [Google Scholar] [CrossRef] [PubMed]
  18. Zhang, W.; Cao, S.; Wu, Z.; Zhang, M.; Cao, Y.; Guo, J.; Zhong, F.; Duan, H.; Jia, D. High-performance gas sensor of polyaniline/carbon nanotube composites promoted by interface engineering. Sensors 2019, 20, 149. [Google Scholar] [CrossRef]
  19. Elizalde-Torres, J.; Hu, H.; Saniger, J.M. Comparison of NO2 and NH3 gas adsorption on semiconductor polyaniline thin films. Rev. Mex. Fís 2005, 51, 482–487. [Google Scholar]
  20. Chen, X.; Chen, X.; Ding, X.; Yu, X. Gas Sensitive Characteristics of Polyaniline Decorated with Molybdenum Ditelluride Nanosheets. Chemosensors 2022, 10, 264. [Google Scholar] [CrossRef]
  21. Duan, X.; Duan, Z.; Zhang, Y.; Liu, B.; Li, X.; Zhao, Q.; Yuan, Z.; Jiang, Y.; Tai, H. Enhanced NH3 sensing performance of polyaniline via a facile morphology modification strategy. Sens. Actuators B-Chem. 2022, 369, 132302. [Google Scholar] [CrossRef]
  22. Maity, D.; Kumar, R.T.R. Polyaniline anchored MWCNTs on fabric for high performance wearable ammonia sensor. ACS Sens. 2018, 3, 1822–1830. [Google Scholar] [CrossRef]
  23. Chaudhary, V.; Gautam, A.; Mishra, Y.K.; Kaushik, A. Emerging MXene–polymer hybrid nanocomposites for high-performance ammonia sensing and monitoring. Nanomaterials 2021, 11, 2496. [Google Scholar] [CrossRef]
  24. Kałużyński, P.; Mucha, W.; Capizzi, G.; Lo Sciuto, G. Chemiresistor gas sensors based on conductive copolymer and ZnO blend–prototype fabrication, experimental testing, and response prediction by artificial neural networks. J. Mater. Sci.—Mater. El. 2022, 33, 26368–26382. [Google Scholar] [CrossRef]
  25. Tohidi, S.; Parhizkar, M.; Bidadi, H.; Mohamad-Rezaei, R. Electrodeposition of polyaniline/three-dimensional reduced graphene oxide hybrid films for detection of ammonia gas at room temperature. IEEE Sens. J. 2020, 20, 9660–9667. [Google Scholar] [CrossRef]
  26. Wang, L.; Lu, X.; Lei, S.; Song, Y. Graphene-based polyaniline nanocomposites: Preparation, properties and applications. J. Mater. Chem. A 2014, 2, 4491–4509. [Google Scholar] [CrossRef]
  27. Chakrabarti, M.H.; Low, C.T.J.; Brandon, N.P.; Yufit, V.; Hashim, M.A.; Irfan, M.F.; Akhtar, J.; Ruiz-Trejo, E.; Hussain, M.A. Progress in the electrochemical modification of graphene-based materials and their applications. Electrochim. Acta 2013, 107, 425–440. [Google Scholar] [CrossRef]
  28. Norizan, M.N.; Moklis, M.H.; Demon, S.Z.N.; Halim, N.A.; Samsuri, A.; Mohamad, I.S.; Knight, V.F.; Abdullah, N. Carbon nanotubes: Functionalisation and their application in chemical sensors. RSC Adv. 2020, 10, 43704–43732. [Google Scholar] [CrossRef]
  29. Lee, C.T.; Wang, Y.S. High-performance room temperature NH3 gas sensors based on polyaniline-reduced graphene oxide nanocomposite sensitive membrane. J. Alloys Compd. 2019, 789, 693–696. [Google Scholar] [CrossRef]
  30. Suhail, M.H.; Abdullah, O.G.; Kadhim, G.A. Hydrogen sulfide sensors based on PANI/f-SWCNT polymer nanocomposite thin films prepared by electrochemical polymerization. J. Sci. Adv. Mater. Devices 2019, 4, 143–149. [Google Scholar] [CrossRef]
  31. Wulandari, S.A.; Widiyandari, H. Subagio, Synthesis and characterization carboxyl functionalized multi-walled carbon nanotubes (MWCNT-COOH) and NH2 functionalized multi-walled carbon nanotubes (MWCNT-NH2). J. Phys. Conf. Ser. 2018, 1025, 012005. [Google Scholar] [CrossRef]
  32. Alharbi, N.D.; Shahnawaze Ansari, M.; Salah, N.; Khayyat, S.A.; Khan, Z.H. Zinc oxide-multi walled carbon nanotubes nanocomposites for carbon monoxide gas sensor application. J. Nanosci. Nanotechnol. 2016, 16, 439–447. [Google Scholar] [CrossRef]
  33. Franco, M.A.; Conti, P.P.; Andre, R.S.; Correa, D.S. A review on chemiresistive ZnO gas sensors. Sensor. Actuator. Rep. 2022, 4, 100100. [Google Scholar] [CrossRef]
  34. Xu, K.; Ha, N.; Hu, Y.; Ma, Q.; Chen, W.; Wen, X.; Ou, R.; Trinh, V.; McConville, C.F.; Ou, J.Z. A room temperature all-optical sensor based on two-dimensional SnS2 for highly sensitive and reversible NO2 sensing. J. Hazard. Mater. 2022, 426, 127813. [Google Scholar]
  35. Bonyani, M.; Zebarjad, S.M.; Janghorban, K.; Kim, J.Y.; Kim, H.W.; Kim, S.S. Au-Decorated Polyaniline-ZnO Electrospun Composite Nanofiber Gas Sensors with Enhanced Response to NO2 Gas. Chemosensors 2022, 10, 388. [Google Scholar] [CrossRef]
  36. Talwar, V.; Singh, O.; Singh, R.C. ZnO assisted polyaniline nanofibers and its application as ammonia gas sensor. Sens. Actuators B-Chem. 2014, 191, 276–282. [Google Scholar] [CrossRef]
  37. Al-Mashat, L.; Shin, K.; Kalantar-Zadeh, K.; Plessis, J.D.; Han, S.H.; Kojima, R.W.; Kaner, R.B.; Li, D.; Gou, X.; Ippolito, S.J.; et al. Graphene/polyaniline nanocomposite for hydrogen sensing. J. Phys. Chem. C 2010, 114, 16168–16173. [Google Scholar] [CrossRef]
  38. Zhang, D.; Wu, Z.; Zong, X. Flexible and highly sensitive H2S gas sensor based on in-situ polymerized SnO2/rGO/PANI ternary nanocomposite with application in halitosis diagnosis. Sens. Actuators B-Chem. 2019, 289, 32–41. [Google Scholar] [CrossRef]
  39. Ou, J.Z.; Ge, W.; Carey, B.; Daeneke, T.; Rotbart, A.; Shan, W.; Wang, Y.; Fu, Z.; Chrimes, A.F.; Wlodarski, W.; et al. Physisorption-based charge transfer in two-dimensional SnS2 for selective and reversible NO2 gas sensing. ACS Nano 2015, 9, 10313–10323. [Google Scholar] [CrossRef] [PubMed]
  40. Shin, S.H.; Park, J.H.; Ahn, B.W.; Ro, J.C.; Suh, S.J. Facile Synthesis of Template-Free SnS2 with Different Morphologies and Excellent Gas-Sensing Performance for NO2 Gas-Sensor Applications. Phys. Status Solidi (A) 2022, 219, 2100827. [Google Scholar] [CrossRef]
  41. Kuo, C.G.; Chen, J.H.; Chao, Y.C.; Chen, P.L. Fabrication of a P3HT-ZnO nanowires gas sensor detecting ammonia gas. Sensors 2017, 18, 37. [Google Scholar] [CrossRef] [PubMed]
  42. Liu, T.; Xu, L.; Wang, X.; Li, Q.; Cui, Q.; Suo, H.; Zhao, C. A simple dip-coating method of SnO2-NiO composite thin film on a ceramic tube substrate for methanol sensing. Crystals 2019, 9, 621. [Google Scholar] [CrossRef]
  43. Caricato, A.P.; Luches, A.; Rella, R. Nanoparticle thin films for gas sensors prepared by matrix assisted pulsed laser evaporation. Sensors 2009, 9, 2682–2696. [Google Scholar] [CrossRef]
  44. Chou, T.I.; Chiu, S.W.; Tang, K.T. A CMOS compatible miniature gas sensing system. In Chemical, Gas, and Biosensors for Internet of Things and Related Applications; Elsevier: Amsterdam, The Netherlands, 2019; pp. 237–252. [Google Scholar]
  45. Guang, Q.; Huang, B.; Li, X. Au-decorated WS2 microflakes based sensors for selective ammonia detection at room temperature. Chemosensors 2021, 10, 9. [Google Scholar] [CrossRef]
  46. Baharuddin, A.A.; Ang, B.C.; Haseeb, A.S.M.A.; Wong, Y.C.; Wong, Y.H. Advances in chemiresistive sensors for acetone gas detection. Mat. Sci. Semicon. Proc. 2019, 103, 104616. [Google Scholar] [CrossRef]
  47. Anisimov, Y.A.; Evitts, R.W.; Cree, D.E.; Wilson, L.D. Polyaniline/biopolymer composite systems for humidity sensor applications: A review. Polymers 2021, 13, 2722. [Google Scholar] [CrossRef]
  48. El Aggadi, S.; Loudiyi, N.; Chadil, A.; El Abbassi, Z.; El Hourch, A. Electropolymerization of aniline monomer and effects of synthesis conditions on the characteristics of synthesized polyaniline thin films. Mediterr. J. Chem. 2020, 10, 138–145. [Google Scholar] [CrossRef]
  49. Tang, H.; Ding, Y.; Zang, C.; Gu, J.; Shen, Q.; Kan, J. Effect of temperature on electrochemical degradation of polyaniline. Int. J. Electrochem. Sci 2014, 9, 7239–7252. [Google Scholar]
  50. Sohn, J.H.; Atzeni, M.; Zeller, L.; Pioggia, G. Characterisation of humidity dependence of a metal oxide semiconductor sensor array using partial least squares. Sens. Actuators B-Chem. 2008, 131, 230–235. [Google Scholar] [CrossRef]
  51. Liu, C.; Noda, Z.; Sasaki, K.; Hayashi, K. Development of a polyaniline nanofiber-based carbon monoxide sensor for hydrogen fuel cell application. Int. J. Hydrogen Energ. 2012, 37, 13529–13535. [Google Scholar] [CrossRef]
  52. Liu, C.; Hayashi, K.; Toko, K. Electrochemical deposition of nanostructured polyaniline on an insulating substrate. Electrochem. Commun. 2010, 12, 36–39. [Google Scholar] [CrossRef]
  53. Van Tuan, C.; Tuan, M.A.; Van Hieu, N.; Trung, T. Electrochemical synthesis of polyaniline nanowires on Pt interdigitated microelectrode for room temperature NH3 gas sensor application. Curr. Appl. Phys. 2012, 12, 1011–1016. [Google Scholar] [CrossRef]
  54. Koluaçık, E.; Karabiberoğlu, Ş.U.; Dursun, Z. Electrochemical Determination of Serotonin Using Pre-treated Multi-walled Carbon Nanotube-polyaniline Composite Electrode. Electroanalysis 2018, 30, 2977–2987. [Google Scholar] [CrossRef]
  55. Hassan, A.A.; Abdulazeez, I.; Salawu, O.A.; Al-Betar, A.R. Electrochemical deposition and characterization of polyaniline-grafted graphene oxide on a glassy carbon electrode. SN Appl. Sci. 2020, 2, 1257. [Google Scholar] [CrossRef]
  56. Korent, A.; Žagar Soderžnik, K.; Šturm, S.; Žužek Rožman, K.; Redon, N.; Wojkiewicz, J.L.; Duc, C. Facile Fabrication of an ammonia-gas sensor using electrochemically synthesised polyaniline on commercial screen-printed three-electrode systems. Sensors 2020, 21, 169. [Google Scholar] [CrossRef] [PubMed]
  57. Lim, J.H.; Phiboolsirichit, N.; Mubeen, S.; Deshusses, M.A.; Mulchandani, A.; Myung, N.V. Electrical and gas sensing properties of polyaniline functionalized single-walled carbon nanotubes. Nanotechnology 2010, 21, 075502. [Google Scholar] [CrossRef]
  58. Bokobza, L.; Bruneel, J.L.; Couzi, M. Raman spectra of carbon-based materials (from graphite to carbon black) and of some silicone composites. C 2015, 1, 77–94. [Google Scholar] [CrossRef] [Green Version]
  59. Korusenko, P.M.; Nesov, S.N.; Iurchenkova, A.A.; Fedorovskaya, E.O.; Bolotov, V.V.; Povoroznyuk, S.N.; Smirnov, D.A.; Vinogradov, A.S. Comparative study of the structural features and electrochemical properties of nitrogen-containing multi-walled carbon nanotubes after ion-beam irradiation and hydrochloric acid treatment. Nanomaterials 2021, 11, 2163. [Google Scholar] [CrossRef]
  60. Patil, D.S.; Shaikh, J.S.; Pawar, S.A.; Devan, R.S.; Ma, Y.R.; Moholkar, A.V.; Kim, J.H.; Kalubarme, R.S.; Park, C.J.; Patil, P.S. Investigations on silver/polyaniline electrodes for electrochemical supercapacitors. Phys. Chem. Chem. Phys. 2012, 14, 11886–11895. [Google Scholar] [CrossRef] [PubMed]
  61. Abdulla, S.; Ponnuvelu, D.V.; Pullithadathil, B. Rapid, trace-level ammonia gas sensor based on surface-engineered Ag nanoclusters@ polyaniline/multiwalled carbon nanotubes and insights into their mechanistic pathways. Chem. Sel. 2017, 2, 4277–4289. [Google Scholar] [CrossRef]
  62. Norizan, M.N.; Zulaikha, N.S.; Norhana, A.B.; Syakir, M.I.; Norli, A. Carbon nanotubes-based sensor for ammonia gas detection–an overview. Polimery 2021, 66, 175–186. [Google Scholar] [CrossRef]
  63. Dakshayini, B.S.; Reddy, K.R.; Mishra, A.; Shetti, N.P.; Malode, S.J.; Basu, S.; Naveen, S.; Raghu, A.V. Role of conducting polymer and metal oxide-based hybrids for applications in ampereometric sensors and biosensors. Microchem. J. 2019, 147, 7–24. [Google Scholar] [CrossRef]
  64. Prasad, B.E.; Kamath, P.V.; Ranganath, S. Electrodeposition of ZnO coatings from aqueous Zn (NO3)2 baths: Effect of Zn concentration, deposition temperature, and time on orientation. J. Solid State Electr. 2012, 16, 3715–3722. [Google Scholar] [CrossRef]
  65. Chang, C.M.; Hon, M.H.; Leu, I.C. Preparation of ZnO nanorod arrays with tailored defect-related characterisitcs and their effect on the ethanol gas sensing performance. Sens. Actuators B-Chem. 2010, 151, 15–20. [Google Scholar] [CrossRef]
  66. Izaki, M.; Omi, T. Electrolyte optimization for cathodic growth of zinc oxide films. J. Electrochem. Soc. 1996, 143, L53. [Google Scholar] [CrossRef]
  67. Liu, X.; Sun, J.; Zhang, X. Novel 3D graphene aerogel–ZnO composites as efficient detection for NO2 at room temperature. Sens. Actuators B-Chem. 2015, 211, 220–226. [Google Scholar] [CrossRef]
  68. Gu, C.; Shanshan, L.; Huang, J.; Shi, C.; Liu, J. Preferential growth of long ZnO nanowires and its application in gas sensor. Sens. Actuators B-Chem. 2013, 177, 453–459. [Google Scholar] [CrossRef]
  69. Hsu, C.L.; Chen, K.C.; Tsai, T.Y.; Hsueh, T.J. Fabrication of gas sensor based on p-type ZnO nanoparticles and n-type ZnO nanowires. Sens. Actuators B-Chem. 2013, 182, 190–196. [Google Scholar] [CrossRef]
  70. Scardaci, V.; Compagnini, G. Raman spectroscopy investigation of graphene oxide reduction by laser scribing. C 2021, 7, 48. [Google Scholar] [CrossRef]
  71. Quillard, S.; Louarn, G.; Lefrant, S.; MacDiarmid, A.G. Vibrational analysis of polyaniline: A comparative study of leucoemeraldine, emeraldine, and pernigraniline bases. Phys. Rev. B 1994, 50, 12496. [Google Scholar] [CrossRef] [PubMed]
  72. Ferrari, A.C. Raman spectroscopy of graphene and graphite: Disorder, electron–phonon coupling, doping and nonadiabatic effects. Solid State Commun. 2007, 143, 47–57. [Google Scholar] [CrossRef]
  73. Umar, A.; Ibrahim, A.A.; Algadi, H.; Albargi, H.; Alsairi, M.A.; Wang, Y.; Akbar, S. Enhanced NO2 gas sensor device based on supramolecularly assembled polyaniline/silver oxide/graphene oxide composites. Ceram. Int. 2021, 47, 25696–25707. [Google Scholar] [CrossRef]
  74. Chen, H.; Qu, Y.; Ding, J.; Fu, H. Adsorption behavior of graphene-like ZnO monolayer with oxygen vacancy defects for NO2: A DFT study. Superlattices Microst. 2019, 134, 106223. [Google Scholar] [CrossRef]
  75. Zhou, H.; Xu, K.; Ha, N.; Cheng, Y.; Ou, R.; Ma, Q.; Hu, Y.; Trinh, V.; Ren, G.; Li, Z.; et al. Reversible room temperature H2 gas sensing based on self-assembled cobalt oxysulfide. Sensors 2022, 22, 303. [Google Scholar] [CrossRef]
  76. Fioravanti, A.; Marani, P.; Morandi, S.; Lettieri, S.; Mazzocchi, M.; Sacerdoti, M.; Carotta, M.C. Growth mechanisms of ZnO micro-nanomorphologies and their role in enhancing gas sensing properties. Sensors 2021, 21, 1331. [Google Scholar] [CrossRef] [PubMed]
  77. Xu, J.; Pan, Q.; Tian, Z. Grain size control and gas sensing properties of ZnO gas sensor. Sens. Actuators B-Chem. 2000, 66, 277–279. [Google Scholar] [CrossRef]
  78. Wang, J.X.; Sun, X.W.; Yang, Y.; Wu, C.M.L. N–P transition sensing behaviors of ZnO nanotubes exposed to NO2 gas. Nanotechnology 2009, 20, 465501. [Google Scholar] [CrossRef]
  79. Sanchez-Martın, S.; Olaizola, S.M.; Castaño, E.; Mandayo, G.G.; Ayerdi, I. Low temperature NO2 gas sensing with ZnO nanostructured by laser interference lithography. RSC Adv. 2021, 11, 34144–34151. [Google Scholar] [CrossRef]
Figure 1. Diagram of the testing setup. Five gas cylinders containing the gases of interest, nitrogen and two other pollutants (CO and CH2O) are connected to the testing chamber via multi-channel mass flow controllers (MFCs)). The MFCs, via a feedback loop with the acquisition computer, can control the composition of the mixture that is to arrive in the test chamber. A more detailed image of the testing setup can be found in Figure S2.
Chemosensors 11 00132 g001
Figure 2. Cyclic voltammograms of 8 (black), 10 (red), and 15 (green) electropolymerization cycles of the MWCNT-NH2-PANI composite material.
Chemosensors 11 00132 g002
Figure 3. SEM images of (a) bare gold IDE- mag. 16,000× (inert: one interdigit bare gold granulation with 30,000×); (b) PANI film deposited on IDE at mag. 15,000× (inset: electropolymerized nanoPANI on one gold IDE, mag. 240,000×); (c) PANI film nano-grains deposited on IDE at mag. 240,000×; (d) PANI-MWCNT-NH2 composite at mag. 14,000×; (e) PANI-MWCNT-NH2 (Mag. 120,000×); (f) histogram of MWCNT diameters (N = 200). Raman spectra of (g) each material (used as references) forming the PANI-MWCNT-NH2 composite; (h) peak and baseline analysis of the PANI-MWCNT-NH2 Raman spectrum.
Chemosensors 11 00132 g003
Figure 4. XPS spectra deconvolution of electrons from C 1s for (a) PANI and (b) PANI-MWCNTs-NH2; spectra deconvolution of electrons from O 1s for (c) PANI and (d) PANI-MWCNTs-NH2; spectra deconvolution of electrons from N 1s for (e) PANI and (f) PANI-MWCNTs-NH2.
Chemosensors 11 00132 g004
Figure 5. SEM images of (a) PANI-rGO mag. 15,000×; (b) PANI-rGO mag. 30,000×; (c) PANI-rGO-ZnO nanoparticles mag. 28,000×. (d) Histogram of the size distribution of ZnO nanoparticles obtained by measuring 200 individual nanoparticles. (e) Raman spectra of the PANI-rGO-ZnO film, PANI-rGO reference, and rGO reference.
Chemosensors 11 00132 g005
Figure 6. Mechanism diagram for the (a) PANI-rGO-ZnO electrodeposition stages; (b) PANI-rGO-ZnO film interaction with NO2.
Chemosensors 11 00132 g006
Figure 7. PCA results for the sensor selection process. (a) Projection on the first two principal components (PCs) of the sensors. Sensing layers (1–9) are defined as follows: 1. PANI-SWCNT (8 cycles); 2. rGO; 3. PANI-rGO (12 cycles); 4. PANI-MWCNT-NH2 (10 cycles); 5. PEDOT-GO; 6. PANI (15 cycles); 7. PPY-rGO-Fc; 8. PPY-GO; 9. PEDOT-MWCNT-NH2. Fabrication parameters for the classified sensors can be seen in Table S7. (b) Representation of the first four PCs and what each PC represents in terms of the chosen metrics (gas means for each tested concentration, followed by standard deviation of the gas measurements, split by gas: CH2O, NO2, CO, NH3, Air, N2. Full definition of the PCA metrics can be seen in Table S1).
Chemosensors 11 00132 g007
Figure 8. (a) Measurements for the PANI-MWCNT-NH2 (10 cycles) sensing layer and the PANI-MWCNT-NH2 (15 cycles) sensing layer on increasingly high concentrations of ammonia in the range of 0.5 ppm to 128 ppm. Concentrations of ammonia are sequentially introduced while interspaced with N2. Passes were performed at intervals of 1 h and at 30% humidity. Performance metrics for the ammonia sensors with different thicknesses, with the PANI-MWCNT-NH2 sensor after 10 cycles being drawn in blue and the sensor after 15 cycles being drawn in green: (b) linearity plots for the resistance of the sensor as a function of concentration for the first measurement pass at 30% humidity; (c) linearity plots for the response of the sensor as a function of concentration for the first measurement pass at 30% humidity; (d) repeatability and stability measurements for the PANI-MWCNT-NH2 (10 cycles) sensor at 0% humidity on measuring 20 ppm of ammonia; (e) repeatability and stability measurements for the PANI-MWCNT-NH2 (15 cycles) sensor at 0% humidity on measuring 20 ppm of ammonia; (f) selectivity test of the PANI-MWCNT-NH2 (10 cycles) sensor to a group of four gasses: formaldehyde (40–200 ppb), nitrogen dioxide (8–90 ppm), carbon monoxide (2–200 ppm), and ammonia (5–300 ppm), with humidity (0–50%). Gases were tested in an atmosphere of N2 at 0% humidity.
Chemosensors 11 00132 g008
Figure 9. Effect of humidity on the two PANI-MWCNT-NH2 sensing layers. Humidity varies from 15% to 50%. (a) PNI-MWCNT-NH2 (10 cycles). (b) PANI-MWCNT-NH2 (15 cycles).
Chemosensors 11 00132 g009
Figure 10. (a) Measurements for the PANI-rGO-ZnO sensing layer on increasingly high concentrations of nitrogen dioxide in the range of 0.2 ppm to 90 ppm. Concentrations of nitrogen dioxide are sequentially introduced into the testing chamber. Passes were performed at intervals of 1 h and at 0% humidity. (b) Linearity plots for the resistance and response of the PANI-rGO-ZnO sensor as a function of concentration for the second measurement pass at 0% humidity. (c) Repeatability and stability measurements for the PANI-rGO-ZnO sensor at 0% humidity on measuring 16 ppm of nitrogen dioxide. (d) Selectivity test of the PANI-rGO-ZnO sensor to a group of four gasses: formaldehyde (0.8–5 ppm), nitrogen dioxide (8–90 ppm), carbon monoxide (2–200 ppm), and ammonia (5–300 ppm). Gases were tested in an atmosphere of N2 at 0% humidity.
Chemosensors 11 00132 g010
Figure 11. Response and linearity of a PANI-rGO-ZnO sensor with a thicker layer of rGO measured at 0% humidity in an atmosphere of (a) N2; (b) synthetic air.
Chemosensors 11 00132 g011
Table 1. Sensitivity and repeatability statistics for the proposed sensors. Ammonia sensors were tested at a humidity of 30%, whereas the dioxide sensor was tested at a humidity of 0%.
Sensing LayerConcentration (ppm)S (%)LoD (ppm)RSD (%)
PANI-MWCNT-NH2 (10 cycles)NH3: 896.990.8510.06
PANI-MWCNT-NH2 (15 cycles)NH3: 855.820.7611.79
PANI-rGO-ZnONO2: 8−10.711.178.85
Table 2. Linearity statistics for the proposed sensors. Ammonia sensors were tested at a humidity of 30%, whereas the dioxide sensor was tested at a humidity of 0%.
Sensing LayerSlope (Ω/ppm)R2 (%)Linear Domain (ppm)
PANI-MWCNT-NH2 (10 cycles)186.65 ± 13.0197.85 ± 0.862–64
PANI-MWCNT-NH2 (15 cycles)143.5 ± 11.8797.82 ± 0.922–64
PANI-rGO-ZnO−294.27 ± 21.3298.77 ± 0.890.4–90
Disclaimer/Publisher’s Note: The statements, opinions and data contained in all publications are solely those of the individual author(s) and contributor(s) and not of MDPI and/or the editor(s). MDPI and/or the editor(s) disclaim responsibility for any injury to people or property resulting from any ideas, methods, instructions or products referred to in the content.

