Abstract
We have designed a new ternary structure to enhance the sensing properties of WS2 nanosheet (NS)-based gas sensors at room temperature (RT) in self-heating mode. SnO2 nanowires (NWs, 10–30 wt%) were added to WS2 NSs and then Au nanoparticles (NPs) were deposited on the surface of the resulting composites by UV irradiation. The Au-decorated 10 wt% SnO2–WS2 composition showed the highest gas sensing properties. The presence of SnO2 NWs on the WS2 NSs effectively enhanced the diffusion and adsorption of gas species into deeper parts of the gas sensor. Furthermore, the chemical sensitization of Au (increase in oxygen ionosorption; spillover effect and catalytic effect towards CO) contributed to an enhanced response to CO gas. Gas sensing tests performed in the self-heating mode demonstrated the possibility of realizing a low-voltage, low-power-consumption CO gas sensor based on the Au-decorated 10 wt% SnO2–WS2. The sensor response under 60% relative humidity (RH) conditions was 84% of that under dry conditions, which shows that CO sensing is possible in wet environments at room temperature operation.
1. Introduction
Gas sensors are used for many different purposes, but their main applications are related to safety. One of the most poisonous gases, carbon monoxide (CO), is known as a silent killer [1]. CO causes hypoxia and cell death in human tissue because it can easily replace oxygen and combine with hemoglobin (Hb) in the blood to form carboxyhemoglobin (COHb), which reduces the oxygen-carrying ability of Hb [2]. CO is a colorless, tasteless, and odorless gas [3]; therefore, high-sensitivity detection of CO using gas sensors is necessary for safety.
Resistive gas sensors, which are made of semiconducting metal oxides such as SnO2 [4] or two-dimensional (2D) transition metal dichalcogenides (TMDs) such as WS2 [5], are among the most popular types of gas sensors due to their high sensitivity, high stability, fast dynamics, and low cost [6]. Two-dimensional material has very exciting optical and electrical properties from both theoretical and practical standpoints [7,8,9,10,11]. TMD-based gas sensors with a 2D structure can function at low or RT due to the high electron mobility and high surface area [12]. Among the TMDs, the monolayer WS2 NS is a promising sensing material owing to its high thermal stability, high oxidative resistance, favorable band structure, and high phonon-limited electron mobility [13]. To enhance the sensor response, composite materials with heterojunctions and a 3D structure have been proposed [14,15].
For the detection of various gases by resistive gas sensors, high temperatures are often necessary to achieve the best performance. Sensor devices need heaters, but this hinders miniaturization and thus limits their practical application in portable and mobile devices. A good strategy for dealing with this problem is to operate the gas sensor in self-heating mode [16,17]. In this mode, a voltage is applied to the sensor and its temperature increases by Joule heating [18]. The flow of the charge carriers generates heat inside the sensor material. The power of Joule heating, W, is calculated using the W = V2/R relationship, where V is the applied voltage and R is the resistance. W increases with an increase in the applied voltage. Therefore, sensing measurements can be performed at RT without heaters by applying an optimized voltage.
In this study, we investigated CO gas sensing at RT in self-heating mode using WS2 NS-based composite gas sensors for low-voltage, low-power sensor devices. We used the p-type WS2, which is sometimes produced depending on the process, but only a few sensor applications have been reported [19]. For the composites, SnO2 NWs [20,21,22,23] were added to the WS2 NSs to construct a 3D morphology, which provides an increased adsorption of gases into the depths of the composite gas sensor and enhances the sensor response. SnO2 is a well-known n-type metal oxide and SnO2 NWs are promising sensor materials because of their high sensitivity and 3D structure with high gas diffusivity [24,25]. Subsequently, Au NPs were deposited on the surface of the resultant 3D structure. Au NPs are known to act as a catalyst for oxygen dissociation and CO oxidation [26,27] and they have an effect on CO gas detection [28,29,30]. Gas sensing studies under self-heating conditions demonstrated the possibility of realizing a low-voltage, low-power-consumption CO gas sensor based on our proposed Au-decorated SnO2 NW–WS2 NS structure.
2. Experimental Procedure
2.1. Preparation of Pristine and Au-Decorated WS2 NSs
In total, 5 mg of monolayer WS2 NS powder (ACS Material, Pasadena, CA, USA) was first dispersed in 0.01 mL of 2-propanol for 15 min. A total of 0.075 μL of the suspension was drop-coated (in three drops) onto prepared Si substrates. The substrates with deposited WS2 were dried at 80 °C for 10 min. For Au NP decoration, 0.4 g of HAuCl6·H2O was initially dissolved in 2-propanol. The substrate with WS2 NSs was then immersed into the Au solution, and Au NPs were coated onto the surfaces of the WS2 NSs under UV irradiation for 15 s by a halogen lamp (0.11 mW/cm2 and λ = 360 nm), followed by an annealing process at 500 °C for 30 min in the presence of N2 gas. We have previously reported [28] that the size of the resultant Au NPs was 7.4 nm, and their density was 17 NPs per 50 nm2. The heat-treated powders were subsequently scratched off from the Si substrate, dispersed in 2-propanol, and drop-coated onto a sensor substrate.
2.2. Preparation of SnO2 NW/WS2 NS Composites
SnO2 NWs were grown by a vapor–liquid–solid (VLS) growth technique [31,32]. The Si substrate on which a 3 nm-thick Au catalyst layer was deposited was placed in a quartz tube furnace that contained a ceramic crucible with highly pure (99.9%) Sn powder (Sigma-Aldrich, St. Louis, MO, USA). SnO2 NWs were grown at 900 °C for 5 min in the presence of N2 (300 sccm) and O2 (10 sccm) flowing gases. The as-grown SnO2 NWs on the Si substrate were then scraped off and stored in a vial. The diameter and length of SnO2 NWs were about 50 nm and 40 μm.
As-synthesized SnO2 NWs (10, 20, and 30 wt%) were dispersed in a 2-propanol suspension of WS2 to form a WS2-SnO2 composite structure.
2.3. Preparation of Au NP-Coated SnO2–WS2 Composite Gas Sensors
After preparation of SnO2–WS2 composite gas sensors, Au NPs were coated on their surfaces as described in Section 2.1. Figure S1 schematically shows the procedure for preparation of the Au NP-decorated SnO2–WS2 composite gas sensors.
2.4. Characterization
The morphology of the products was investigated using scanning electron microscopy (SEM; JSM-6700F, JEOL, Tokyo, Japan) and transmission electron microscopy (TEM; JEM-2100F, JEOL). The chemical composition was determined using X-ray photoelectron spectroscopy (XPS; SigmaProbe, Thermo Fisher Scientific, Waltham, MA, USA) using an Al- Kα characteristic emission line (E = 1486 eV) with the C 1s peak used as a reference peak (284.8 eV). For self-heating studies, the applied voltage was changed in the range of 1–20 V. The temperature of the gas sensors in self-heating mode was measured at room temperature with an infrared thermometer (IT-480S, Horiba, Kyoto, Japan), and the distance was fixed at 30 mm. Ultraviolet photo-emission spectroscopy (UPS, PHI company-made VersaProbe, Kanahawa, Japan) was used to estimate the work function of p-type WS2. He I (21.22 eV) was used as the emission light, and the pressure of the chamber used for the analysis was fixed at ~ 2 × 10⁻⁸ mbar.
2.5. Gas Sensing Studies
The sensor substrate used in this study was glass that was equipped with Au interdigitated electrodes (DRP-G-IDEAU5, Drop Sens, Asturias, Spain) with 5 μm pitch. The sensing materials were dispersed in 2-propanol (0.01 mL). Three drops of the solution were then released onto the substrate, which was then dried at 80 °C for 10 min. The sensing responses of the gas sensors to C3H6O, C6H6, C6H7, CH4, and CO gases were measured. The gas concentration was set by adjusting the ratio of the target gas and dry air using mass flow controllers (total flow rate = 100 sccm). The gas chamber was located inside of a horizontal-type quartz furnace, connecting to the electrical measurement system (Keithley DMM6500, Cleveland, OH, USA) to record the current continuously. The sensor response was calculated as R = Ra/Rg or Rg/Ra, where Ra and Rg are the resistance in the presence of air and the target gas, respectively. Different voltages were applied at RT for the self-heating operation mode. The response and recovery times were defined as the times required to attain a 90% change in the resistance upon the supply or removal of the target gas, respectively. To investigate the effect of humidity of the 10 wt% SnO2–WS2 composite in sensing test, we compared the sensing behaviors in dry and humid air.
3. Results and Discussion
3.1. Morphological and Chemical Studies
Figure 1 shows typical SEM images of the morphologies of pristine WS2 and a 10 wt% SnO2–WS2 composite, respectively. We confirmed that SnO2 NWs were dispersed among the WS2 NSs (Figure 1b). This unique morphology is beneficial for sensing studies as it enlarges the active surface area between the SnO2 NWs and WS2 NSs for incoming gas molecules. Figure 2a–c show TEM images of the Au NP-decorated WS2 NSs. The high-resolution TEM (HRTEM) image in Figure 2c clearly shows the lattice fringes related to the crystalline planes of Au and WS2. The spacings between the parallel fringes were 0.236 and 0.27 nm, which are related to the (111) and (100) crystal planes of Au and WS2, respectively [33,34]. Figure 2d–f show TEM images of the SnO2–WS2 composite in which Au NPs, SnO2 NWs, and WS2 NSs are clearly observable. The overall TEM analysis results indicated the successful formation of Au NPs, SnO2 NWs, and WS2 NSs in a unique structure.
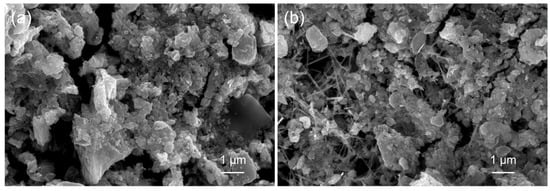
Figure 1.
SEM images of (a) pristine WS2 and (b) 10 wt% SnO2–WS2 composite.
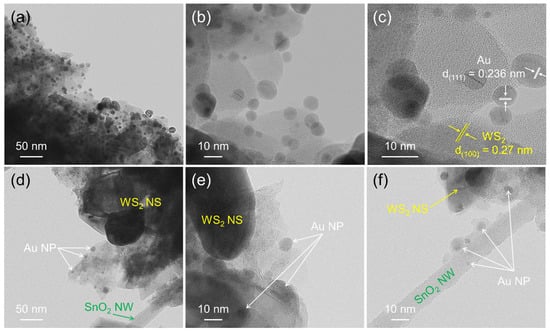
Figure 2.
TEM analyses of (a–c) Au-decorated WS2 NSs and (d–f) Au-decorated SnO2–WS2 composites.
Chemical analysis of the prepared sensor materials was performed using XPS. Based on the XPS results, all the expected elements were present in the synthesized sensing materials. An XPS survey of the Au-decorated SnO2–WS2 composite is shown in Figure S2a. The expected elements, i.e., W, S, Sn, O, and Au, are present. Figure S2b–f show the core-level regions of W 4f, S 2p, Sn 3d, O 1s, and Au 4f, respectively. Figure S2b shows that the W 4f peak is composed of W 5p3/2 (40.53 eV), W 4f7/2 (34.98 eV), and W 4f5/2 (37.23 eV) peaks. Two peaks can be observed in the S 2p region. The first peak, located at 161.53 eV, is related to S 2p and the second peak, located at 168.58 eV, is related to the S–O bond due to the partial adsorption of oxygen from the environment (Figure S2c). Figure S2d shows a high-resolution image of the Sn 3d region, which is composed of Sn 3d3/2 and Sn 3d5/2 peaks located at 494.88 and 486.63 eV, respectively. Additionally, a high-resolution image of the core-level region of O 1s is presented in Figure S2e. The Au 4f core-level region shown in Figure S2f is composed of two peaks, located at 83.28 and 86.98 eV, which can be attributed to Au 4f7/2 and Au 4f5/2, respectively.
3.2. Gas Sensing Studies
3.2.1. Pristine and SnO2–WS2 NSs Gas Sensors without Au
We compared the sensor response to CO at RT under an applied voltage of 1 V, and the results are shown in Figure 3. The sensor behavior changed from the p-type to the n-type after adding 20 wt% or more of the n-type SnO2 NWs to the p-type WS2 NSs. The addition of SnO2 NWs increased the baseline resistance of the gas sensors as SnO2 has a higher resistance than WS2. The sensor response was improved by the addition of SnO2 NWs. The 30 wt% SnO2–WS2 composite and the SnO2 sample did not show any sensor responses because of the low temperature conditions.
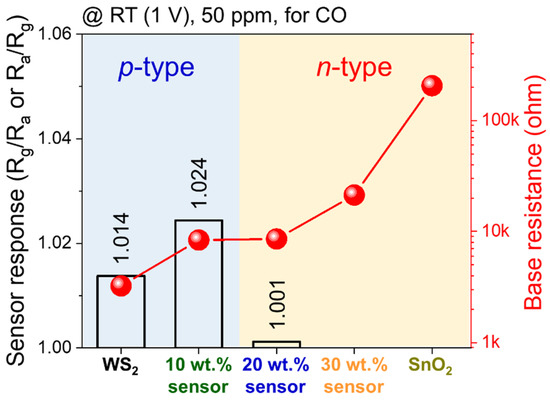
Figure 3.
Comparison between the responses and base resistance of different gas sensors to 50 ppm CO at 20 °C under 1 V applied voltage.
The reproducibility test was conducted for pristine WS2 gas sensors, which were annealed in N2 atmosphere at 500 °C for 30 min using different sensor devices. As shown in Figure S3a, all of the devices showed a very small error value (0.001) in the sensor response. The baseline resistance of the sensor increased by more than a factor of two after annealing.
3.2.2. Au-Decorated Gas Sensors
We evaluated the effects of the Au NP decoration on the sensing properties for 50 ppm CO gas under an applied voltage of 1 V at RT (Figure 4). Figure 4e summarizes the responses of the gas sensors with and without Au NPs. Figure 4a–d show the normalized dynamic resistance plots. Au had a significant effect on the enhancement of the sensor response of WS2 and the SnO2–WS2 composites. The 30 wt% SnO2–WS2 composite took a long time for recovery and did not show good results in repeated tests. For the pristine SnO2 NWs, there was little effect of Au on the sensor response at this low temperature (Figure 4d). Figure 4f shows the baseline resistances in air and N2 with Au NPs. The baseline resistance of the Au-decorated samples was higher than that of the samples without Au (Figure 3). The resistance in N2, RN2, was larger than that in air, Rair, for the p-type WS2 and 10 wt% SnO2–WS2 composite, and RN2 was smaller than Rair for the n-type 30 wt% SnO2–WS2 composite and the SnO2. For the 10 wt% SnO2–WS2 composite, the resistance ratios in N2 and air, RN2/Rair, were 1.44 and 1.09 with and without Au, respectively. This reveals that the oxygen ionosorption was enhanced by the Au NPs. The 10 wt% SnO2–WS2 composite gas sensor showed the highest response; therefore, this sensor was selected for further studies.
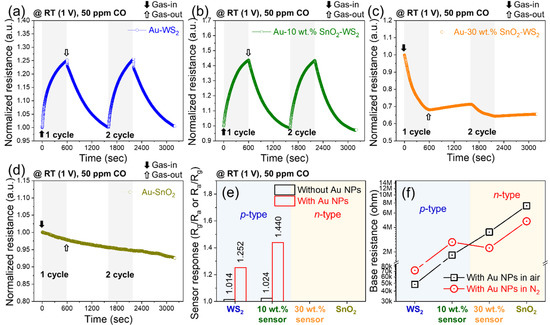
Figure 4.
(a–d) Normalized dynamic resistance plots of different gas sensors to 50 ppm CO at room temperature (20 °C) under 1 V applied voltage. Comparison between the (e) sensor response and (f) base resistance of WS2 NS, 10 wt% SnO2–WS2, 30 wt% SnO2–WS2, and SnO2 NS gas sensors with Au NPs decoration in air and N2 atmosphere.
Figure 5 indicates the selectivity patterns for the 10 wt% SnO2–WS2 gas sensor with and without Au for 50 ppm of various gases at RT and under an applied voltage of 1 V. In all cases, the response to the gases was increased after the Au decoration. In particular, the sensor response to CO was selectively improved due to the Au decoration. Overall, it can be concluded that Au decoration enhanced both the response and the selectivity of the gas sensors.
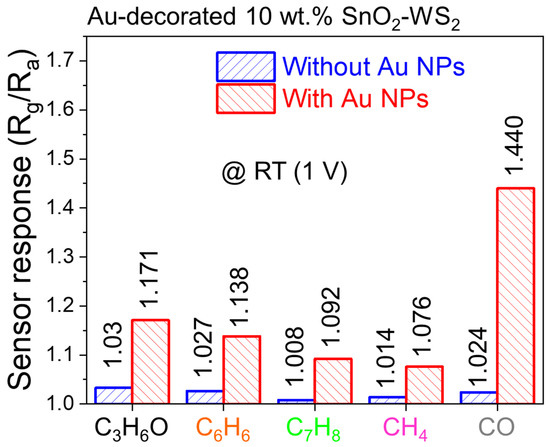
Figure 5.
Selectivity pattern of Au-decorated 10 wt% SnO2–WS2 composite gas sensor without and with Au NPs measured under 1 V applied voltage at 20 °C.
3.2.3. Temperature Dependence
Figure 6a shows the hysteresis measurement results for the Au-decorated 10 wt% SnO2–WS2 composite gas sensor for 50 ppm CO gas under an applied voltage of 1 V, where the sensor temperature was increased from RT to 160 °C in the first step, and then was decreased to RT in the next step. Figure 6b compares the sensor response and baseline resistance at the same temperatures during the first and second step. The higher the temperature, the higher the sensor response, and the highest value was obtained at 160 °C. No significant hysteresis was observed for the gas sensor. There were only small differences (<0.05) in the sensor response. We avoided measurements at higher temperatures where WS2 was oxidized. Figure S4 shows the sensor experiments that demonstrate the oxidation of WS2 and show the n-type nature at temperatures above 200 °C.
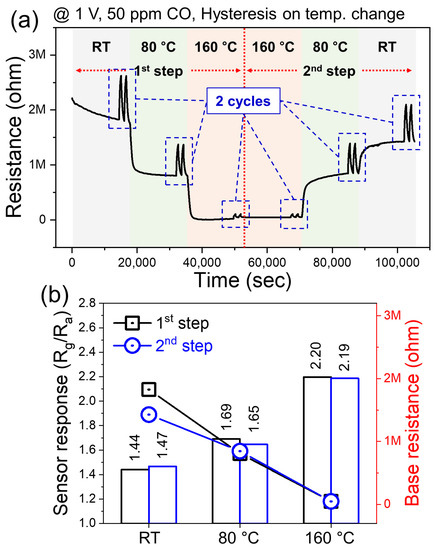
Figure 6.
Hysteresis study for Au-decorated 10 wt% SnO2–WS2 composite gas sensor (a) dynamic resistance plots under 1 V applied voltages during the increasing and decreasing of the temperature. (b) Comparison between the response of sensors at the same temperatures during increasing and decreasing of the temperature.
The sensing measurements for 50 ppm CO gas were performed at 160 °C under an applied voltage of 1 V for different sensor devices. Figure S5e compares the response with and without Au NPs decoration. Figure S5a–d show the normalized dynamic resistance plots. For all devices, the presence of Au NPs improved the sensor response, which was higher at 160 °C than at RT. Figure S5f shows the baseline resistance in air and N2 with Au NPs. For the Au-decorated 10 wt% SnO2–WS2 composite, the resistance ratios in N2 and air, RN2/Rair, were 2.49 and 1.31 with and without Au, respectively. This difference was larger than that at room temperature (Figure 4f), which means that more oxygen ions are adsorbed at higher temperatures.
3.2.4. Self-Heating Studies
In the next step, the self-heating effect on the gas sensor was evaluated for the Au-decorated 10 wt% SnO2–WS2 composite. The gas sensor response to ON/OFF for 50 ppm CO gas was measured at various applied voltages (1–20 V) at RT. CO gas was introduced at time 0 s (ON) and was stopped at time 600 s (OFF). The sensor responses are plotted in Figure 7a as a function of the applied voltage. The optimal applied voltage was found to be 6.8 V; therefore, further selectivity studies were performed at this voltage. Figure 7b shows the variations in the sensor baseline resistance and power consumption as a function of the applied voltage. The minimum baseline resistance was observed at an applied voltage of 15 V and the sensor electrode broke at 20 V. The power consumption was calculated using the W = V2/R relationship and it increased with an increase in the applied voltage. Under 6.8 V, the power consumption was about 95 μW. Figure 7c shows the dynamic resistance curves of the sensor for 50 ppm of various gases, and the corresponding selectivity pattern is plotted in Figure 7d. The sensor showed a higher response to CO than to other gases, as in the case of 1 V (Figure 5).
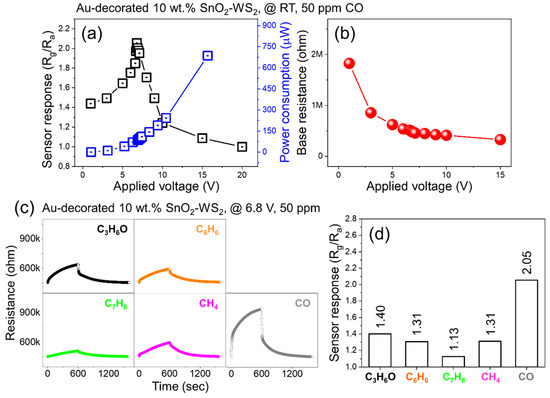
Figure 7.
(a) Sensor response versus applied voltage for Au-decorated 10 wt% SnO2–WS2 gas sensor at 20 °C to 50 ppm CO gas. (b) Corresponding base resistance and power consumption versus applied voltage. (c) Dynamic resistance curves of 10 wt% SnO2–WS2 gas sensor to 50 ppm of different gases at 20 °C and under fixed 6.8 V applied voltage. (d) Corresponding selectivity pattern.
Figure S6 shows the dynamic resistance graphs for 50 ppm CO gas, the sensor response versus applied voltage, and the baseline resistance versus applied voltage measured at RT for the Au-decorated WS2 (Figure S6a), Au-decorated SnO2 (Figure S6d), and Au-decorated 30 wt% SnO2–WS2 (Figure S6g) gas sensors, for which the optimal applied voltage was 6.1, 17.3, and 13.1 V, respectively. The 10 and 30 wt% SnO2–WS2 composite gas sensors required a higher optimal voltage than the WS2 gas sensor. This is due to the fact that the SnO2 gas sensor requires a higher optimal voltage than the WS2 gas sensor. The optimal applied voltage difference between the Au-decorated WS2 and the Au-decorated 10 wt% SnO2–WS2 composite was 0.7 V. Despite this small difference, the Au-decorated SnO2–WS2 composite showed a higher sensor response (2.05) compared with that for the Au-decorated WS2 gas sensor (1.59). The power consumption at the optimized voltage was 3 mW and 95 μW for Au-decorated WS2 and Au-decorated 10 wt% SnO2–WS2, respectively. Therefore, the present SnO2–WS2 composite is an effective sensor that can operate at a low voltage and low power consumption. For reference, the temperature change with respect to the applied voltage for each gas sensor without gas flow was measured using an infrared thermometer (Text S1 and Figure S7).
Figure 8 shows the performance of the Au-decorated 10 wt% SnO2–WS2 composite gas sensor under different RH conditions. Figure 8a shows the dynamic resistance plots of the Au-decorated 10 wt% SnO2–WS2 composite gas sensor for 50 ppm CO gas under 6.8 V external voltage at different RH conditions. The sensor response decreased with an increase in the RH (Figure 8b). The sensor response at 60% RH was 84% of that in dry air. The water vapor was adsorbed on the surface of the sensor, leading to a decrease in the available sites for the adsorption of oxygen in the air and a decrease in the CO effects. In Figure 8c, the response and recovery times under different RH conditions are plotted. While the effect of the RH on the response time was small, the recovery time became longer with an increase in the RH. The recovery process is the desorption of CO and the readsorption of oxygen, which is influenced by the water vapor. Reducing the impact of the water vapor for sensors operating at RT is our next challenge. Certain additives [35,36] and water absorbing filters [37,38] can minimize the influence of the RH.
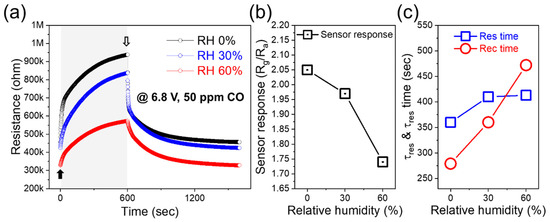
Figure 8.
(a) Dynamic resistance curves of Au-decorated 10 wt% SnO2–WS2 gas sensor to 50 ppm CO gas under 6.8 V external voltage at different RH. Corresponding (b) sensor response, (c) response and recovery times as a function of RH.
In addition, Au-decorated 10 wt% SnO2–WS2 composite gas sensor showed excellent repeatability over ten cycles to 50 ppm of CO gas, at 6.8 V (Figure S8a,b). These results illustrate that the sensing properties of the gas sensor is maintained and that its robustness is supported by highly reproducible sensor responses. Additionally, long-term stability of the gas sensor was examined, with the results being represented in Figure S8c–e. The sensor shows excellent stability even after 3 months in the lab.
3.3. Gas Sensing Mechanism
The gas sensing mechanism of resistive gas sensors is based on variations of the resistance of the gas sensor in the presence of target gases [39,40]. For the pristine p-type WS2 gas sensor, holes were the main carriers for the current [41]. In air, oxygen molecules are adsorbed on the surface of the gas sensor and they take electrons from the WS2 due to the high electron affinity of oxygen molecules. Therefore, the concentration of holes increases relative to the conditions in N2, resulting in the formation of a hole accumulation layer (HAL). In the presence of a reducing gas such as CO, the reaction between the incoming CO molecules and the adsorbed oxygen ions causes the liberation of electrons at the sensor surface. The electrons combine with the holes, resulting in a thinner HAL and thus an increase in the resistance. Figure S9(b1) schematically show the sensing mechanism for a pristine p-type WS2 gas sensor.
Figure S9(b2) show the sensing mechanism for n-type SnO2 NW gas sensors. The main carriers are electrons. In air, oxygen molecules take electrons from the SnO2 conduction band, which leads to the formation of an electron depletion layer (EDL) on SnO2. In the presence of a reducing gas such as CO, the released electrons increase the concentration of electrons in the conduction band, so that the width of the EDL narrows to decrease the electrical resistance. The p-n junction between p-WS2 and n-SnO2 can cause the diffusion of carriers to maintain the equilibrium of the carrier concentrations (Figure S9c). As a depletion layer is created inside WS2, the thickness of the HAL decreases (resistance increases). This is a disadvantage for p-type sensors for reducing gases.
In the present study, composites with SnO2 showed a positive effect on the sensor response, which suggests that the effect of the p-n junction was small and the steric effect of the SnO2 NWs was dominant for improving the sensor response. The SnO2 NWs acted as a type of structure modifier so that the adsorption of gas species was improved by increasing the active surface area of the WS2 NSs. When the WS2 NSs were coated on the sensor substrate using the drop casting method, they formed a fairly dense structure due to the 2D nature of the WS2 NSs, and the dense structure reduced the adsorption sites of the gaseous species. As shown in Figure S9a, by placing the 1D SnO2 NWs between the 2D WS2 NSs, a complex 3D structure was constructed inside the composite gas sensor. This architecture effectively improved the diffusion and adsorption of the gas species into deeper parts of the gas sensor by the steric effect of the SnO2 NWs [42,43].
Next, we considered the electronic sensitization effects of Au on the p-type WS2. Figure S10a shows that the ohmic contact between the p-type semiconductor (WS2) and metal electrodes (Au) causes the electrons to move from the WS2 to Au to equalize the Fermi levels if the work function of Au is larger than that of WS2. Accordingly, as additional holes are created inside the WS2, the HAL thickness expands and the sensor response can be improved. Conversely, (Figure S10b) a Schottky contact causes the electrons to move from Au to WS2 if the work function of Au is smaller than that of WS2. Accordingly, as a hole depletion layer (HDL) is created inside WS2, the HAL thickness decreases (resistance increases), which is a disadvantage for p-type sensors.
In order to know the work functions, we took UPS measurements of the present p-type WS2 NSs (Figure 9a). The high kinetic energy cutoff (EFermi), referred to as E1, and the low kinetic energy cutoff (ECutoff), referred to as E2, were used to find the Wf value (Figure 9b). The Wf value for the WS2 NSs was determined to be 5.67 eV (i.e., 21.22 − 15.55 = 5.67 eV) when we assumed that the electric potential was the same as the sample holder [44]. As this work function of WS2 (Wf,WS2 = 5.67 eV) is larger than that of Au (Wf,Au ≈ 5.1 eV [45]), the electrons will be transferred from Au to WS2 to equalize the Fermi levels and as a result, a Schottky junction will be formed (Figure 9c) for the Au-decorated WS2 NS sensor. The presence of the Au NPs forms the HDL of the WS2 NSs, which increases the resistance and has the opposite effect of improving the sensor response. Therefore, we can conclude that the effect of Au on improving the sensing properties is due to chemical, not electronic, sensitization effects.
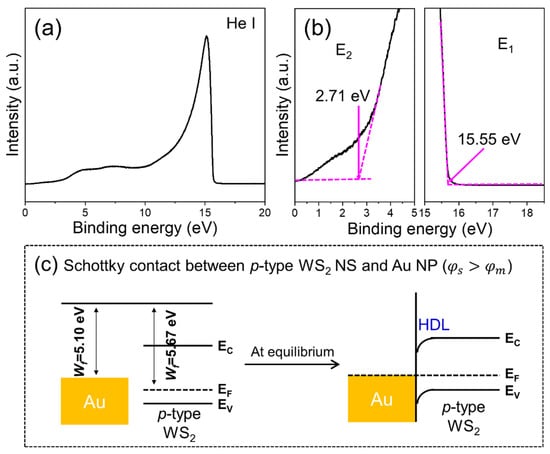
Figure 9.
(a) UPS spectra of WS2 NSs. (b) Corresponding energy cut off values of WS2 NSs. (c) Band structures of WS2 NSs and Au NPs before and after intimate contact.
Figure 10 shows the chemical sensitization effects of the Au NPs, the spillover effect [46] and catalytic effect. In the first mechanism, incoming oxygen gas molecules are adsorbed on the surface of Au and then become dissociated into ionic species. The species move to the surrounding medium and increase the ionosorption of oxygen on the surface of the gas sensor, resulting in more reactions between the oxygen and CO gas molecules. The higher resistance ratios in N2 and air, RN2/Rair, of the Au-decorated samples suggest that the oxygen ionosorption was enhanced by the spillover effect of the Au NPs. In the second mechanism, Au works as the catalyst to lower the activation energy for CO oxidation. This effect resulted in improved sensor response and gas selectivity for CO. Table S1 lists the RT CO sensing properties of the present sensor with some 2D nanostructure-based gas sensors reported elsewhere. Overall, the present sensor showed a superior response to CO gas at RT, demonstrating its practical applications.
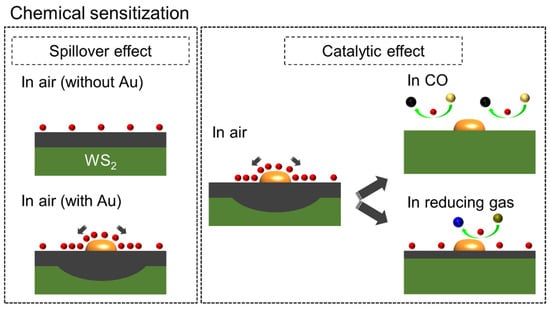
Figure 10.
Gas sensing mechanism in chemical sensitization effects due to decorate the Au NPs.
Figure S11 illustrates the Joule-heating effect of the Au-decorated 10 wt% SnO2–WS2 composite under an optimized voltage of 6.8 V. Under this voltage, WS2 with low resistance generated enough heat to show the same level of sensor response at 160 °C. SnO2 was only able to generate temperatures lower than 160 °C under this voltage. For the 10 wt% SnO2–WS2 composite, despite the fact that SnO2 was warmed by the surrounding WS2, the sensor response of the composite was the p-type and was larger than that without SnO2. This suggests that the n-type SnO2 has no effect due to its high resistance, which is about 24 times higher than that of WS2 at 160 °C in air.
4. Conclusions
A new sensor structure for CO detection at RT was designed using Au-decorated n-type SnO2/p-type WS2 composites. SnO2 NWs grown using a VLS method were added (10, 20, and 30 wt%) to WS2 NSs. The SnO2 NWs were dispersed among the WS2 NSs to construct a porous 3D morphology for CO sensing. The sensor behavior changed from the p-type to the n-type when 20 wt% or more of the n-type SnO2 NWs was added to the p-type WS2 NSs. The Au-decorated 10 wt% SnO2–WS2 composite gas sensor showed a p-type behavior and the highest sensitivity to CO gas. The SnO2 NWs acted as a type of structure modifier so that the adsorption of gas species was improved by increasing the active surface area of the WS2 NSs. The UPS analysis for the work function of the p-type WS2 revealed that the chemical sensitization of Au NPs led to an enhanced sensor response in the ternary composite. Gas sensing in the self-heating mode using Joule heating for the materials demonstrated the possibility of a low-voltage, low-power-consumption CO gas sensor of the Au-decorated 10 wt% SnO2–WS2. The sensor response under 60% relative humidity conditions was 84% of that under dry conditions, which shows that CO sensing is possible in wet environments at RT operation. Further studies should be directed towards better microstructural control by improving the powder dispersion to make additional homogeneous sensing layers, reducing the humidity influence, and extending this approach to other similar systems such as SnS2 and MoS2.
Supplementary Materials
The following supporting information can be downloaded at: https://www.mdpi.com/article/10.3390/chemosensors10040132/s1, Table S1: A summary of CO gas sensing materials based on 2D nanostructures at low temperature. Figure S1: Schematic illustration of preparation of Au-decorated SnO2–WS2 gas sensors. Figure S2: XPS survey and core-level regions of Au-decorated 10wt% SnO2–WS2 composite. Figure S3: (a) Dynamic resistance curves of the pristine WS2 gas sensors annealed in N2 atmosphere at 500 °C for 30 min, where the sensor responses were obtained from three different sensor devices at 50 ppm of CO gas. (b) Corresponding base resistance. Figure S4: (a) Dynamic resistance curves of pristine WS2 NS gas sensor to 50 ppm C3H6O gas at different temperatures (20–350 °C). (b) Corresponding response and base resistance versus temperature. Figure S5: (a–d) Normalized dynamic resistance plots of different gas sensors to 50 ppm CO at 160 °C under 1 V applied voltage. Comparison between the (e) sensor response and (f) base resistance of WS2 NS, 10 wt% SnO2–WS2, 30 wt% SnO2–WS2, and SnO2 NS gas sensors with Au NPs decoration in air and N2 atmosphere. Figure S6: (a,d,g) Normalized dynamic resistance plots to 50 ppm CO at 20 °C under 1 V applied voltage. (b,e,h) Sensor responses and base resistance and (c,f,i) power consumption under different applied voltages at 20 °C for Au-decorated WS2 NS, Au-decorated SnO2 NW, and Au-decorated 30 wt% SnO2–WS2 composite gas sensors. Figure S7: Sensor temperature versus applied voltage for different gas sensors. Text S1: Supplementary explanation for Figure S7. Figure S8: (a) Repeatability (ten sequential cycles) of Au-decorated 10 wt% SnO2–WS2 composite gas sensor to 50 ppm CO at 6.8 V. (b) Sensor response at different cycles. (c) Dynamic resistance curves to 50 ppm of CO for fresh sensor and those kept for 3 months at the laboratory. (d) Corresponding sensing response and (e) response times and recovery times. Figure S9: (a) Microscopic geometry of pristine WS2 and SnO2–WS2 composite gas sensors on the surface of substrate. (b) Gas sensing mechanism in p-type WS2 and n-type SnO2 gas sensors. Energy-band diagrams showing (c) p-n junction. Figure S10: Energy-band diagrams showing (a) Ohmic contact with p-type semiconductor (ɸm > ɸs) and (b) Schottky contact with p-type semiconductor (ɸs > ɸm). Figure S11: Schematic of self-heating effects in Au-decorated 10 wt% SnO2–WS2 composite gas sensor. References [47,48,49,50,51] are cited in the supplementary materials.
Author Contributions
Conceptualization, formal analysis, investigation, data curation, writing—original draft preparation, and writing—review and editing, J.-H.K.; writing—review and editing, I.S., S.H. and T.T.S.; conceptualization, writing—original draft preparation, writing—review and editing, supervision, N.S. All authors have read and agreed to the published version of the manuscript.
Funding
This work was supported by JSPS KAKENHI Grant Nos. 17K06807 and 20F20343.
Institutional Review Board Statement
Not applicable.
Informed Consent Statement
Not applicable.
Data Availability Statement
Not applicable.
Acknowledgments
This work was supported by JSPS KAKENHI Grant Nos. 17K06807 and 20F20343. The authors also acknowledge the helpful discussion with K. Shimanoe. The author J.-H.K. thanks international research fellowship of the Japan society for the promotion of science.
Conflicts of Interest
The authors declare no conflict of interest.
References
- Kulhari, L.; Ray, K.; Suri, N.; Khanna, P.K. Detection and characterization of CO gas using LTCC micro-hotplates. Sādhanā 2020, 45, 71. [Google Scholar] [CrossRef]
- Prockop, L.D.; Chichkova, R.I. Carbon monoxide intoxication: An updated review. J. Neurol. Sci. 2007, 262, 122–130. [Google Scholar] [CrossRef] [PubMed]
- Mirzaei, A.; Park, S.; Sun, G.-J.; Kheel, H.; Lee, C. CO gas sensing properties of In4Sn3O12 and TeO2 composite nanoparticle sensors. J. Hazard. Mater. 2016, 305, 130–138. [Google Scholar] [CrossRef] [PubMed]
- Gupta, P.; Rathore, V. A comprehensive review: SnO2 for photovoltaic and gas sensor applications. Appl. Innov. Res. 2019, 1, 184–193. [Google Scholar]
- Donarelli, M.; Ottaviano, L. 2D materials for gas sensing applications: A review on graphene oxide, MoS2, WS2 and phosphorene. Sensors 2018, 18, 3638. [Google Scholar] [CrossRef] [Green Version]
- Majhi, S.M.; Mirzaei, A.; Kim, H.W.; Kim, S.S.; Kim, T.W. Recent advances in energy-saving chemiresistive gas sensors: A review. Nano Energy 2020, 79, 105369. [Google Scholar] [CrossRef] [PubMed]
- Zhang, Z.; Cai, R.; Long, F.; Wang, J. Development and application of tetrabromobisphenol A imprinted electrochemical sensor based on graphene/carbon nanotubes three-dimensional nanocomposites modified carbon electrode. Talanta 2015, 134, 435–442. [Google Scholar] [CrossRef]
- Cheng, Z.; Liao, J.; He, B.; Zhang, F.; Zhang, F.; Huang, X.; Zhou, L. One-step fabrication of graphene oxide enhanced magnetic composite gel for highly efficient dye adsorption and catalysis. ACS Sustain. Chem. Eng. 2015, 3, 1677–1685. [Google Scholar] [CrossRef]
- Xiao, L.; Youji, L.; Feitai, C.; Peng, X.; Ming, L. Facile synthesis of mesoporous titanium dioxide doped by Ag-coated graphene with enhanced visible-light photocatalytic performance for methylene blue degradation. RSC Adv. 2017, 7, 25314–25324. [Google Scholar] [CrossRef] [Green Version]
- Tang, N.; Li, Y.; Chen, F.; Han, Z. In situ fabrication of a direct Z-scheme photocatalyst by immobilizing CdS quantum dots in the channels of graphene-hybridized and supported mesoporous titanium nanocrystals for high photocatalytic performance under visible light. RSC Adv. 2018, 8, 42233–42245. [Google Scholar] [CrossRef] [Green Version]
- Chen, H.; Chen, Z.; Yang, H.; Wen, L.; Yi, Z.; Zhou, Z.; Dai, B.; Zhang, J.; Wu, X.; Wu, P. Multi-mode surface plasmon resonance absorber based on dart-type single-layer graphene. RSC Adv. 2022, 12, 7821–7829. [Google Scholar] [CrossRef]
- Liu, D.; Tang, Z.; Zhang, Z. Comparative study on NO2 and H2S sensing mechanisms of gas sensors based on WS2 nanosheets. Sens. Actuators B 2020, 303, 127114. [Google Scholar] [CrossRef]
- Zhou, J.; Ma, C.; Kang, X.; Zhang, L.; Liu, X.-L. Effect of WS2 particle size on mechanical properties and tribological behaviors of Cu-WS2 composites sintered by SPS. Trans. Nonferrous Met. Soc. China 2018, 28, 1176–1185. [Google Scholar] [CrossRef]
- Moon, W.J.; Yu, J.H.; Choi, G.M. The CO and H2 gas selectivity of CuO-doped SnO2-ZnO composite gas sensor. Sens. Actuators B 2002, 87, 464–470. [Google Scholar] [CrossRef]
- Bang, J.H.; Choi, M.S.; Mirzaei, A.; Kwon, Y.J.; Kim, S.S.; Kim, T.W.; Kim, H.W. Selective NO2 sensor based on Bi2O3 branched SnO2 nanowires. Sens. Actuators B 2018, 274, 356–369. [Google Scholar] [CrossRef]
- Tan, H.M.; Hung, C.M.; Ngoc, T.M.; Nguyen, H.; Hoa, N.D.; Duy, N.V.; Hieu, N.V. Novel self-heated gas sensors using on-chip networked nanowires with ultralow power consumption. ACS Appl. Mater. Interfaces 2017, 9, 6153–6162. [Google Scholar] [CrossRef]
- Ngoc, T.M.; Duy, N.V.; Hoa, N.D.; Hung, C.M.; Nguyen, H.; Hieu, N.V. Effective design and fabrication of low-power-consumption self-heated SnO2 nanowire sensors for reducing gases. Sens. Actuators B 2019, 295, 144–152. [Google Scholar] [CrossRef]
- Kim, J.-H.; Mirzaei, A.; Bang, J.H.; Kim, H.W.; Kim, S.S. Selective H2S sensing without external heat by a synergy effect in self-heated CuO-functionalized SnO2-ZnO core-shell nanowires. Sens. Actuators B 2019, 300, 126981. [Google Scholar] [CrossRef]
- Guang, Q.; Huang, B.; Li, X. Au-decorated WS2 microflakes based sensors for selective ammonia detection at room temperature. Chemosensors 2022, 10, 9. [Google Scholar] [CrossRef]
- Dattoli, E.N.; Wan, Q.; Guo, W.; Chen, Y.; Pan, X.; Lu, W. Fully transparent thin-film transistor devices based on SnO2 nanowires. Nano Lett. 2007, 7, 2463–2469. [Google Scholar] [CrossRef]
- Gubbala, S.; Chakrapani, V.; Kumar, V.; Sunkara, M.K. Band-edge engineered hybrid structures for dye-sensitized solar cells based on SnO2 nanowires. Adv. Funct. Mater. 2008, 18, 2411–2418. [Google Scholar] [CrossRef]
- Luo, L.; Liang, F.; Jie, J. Sn-catalyzed synthesis of SnO2 nanowires and their optoelectronic characteristics. Nanotechnology 2011, 22, 485701. [Google Scholar] [CrossRef] [PubMed]
- El-Maghraby, E.M.; Qurashi, A.; Yamazaki, T. Synthesis of SnO2 nanowires their structural and H2 gas sensing properties. Ceram. Int. 2013, 39, 8475–8480. [Google Scholar] [CrossRef]
- Das, S.; Jayaraman, V. SnO2: A comprehensive review on structures and gas sensors. Prog. Mater. Sci. 2014, 66, 112–255. [Google Scholar] [CrossRef]
- Yamazoe, N.; Sakai, G.; Shimanoe, K. Oxide semiconductor gas sensors. Catal. Surv. Asia 2003, 7, 63–75. [Google Scholar] [CrossRef]
- Kim, J.-H.; Wu, P.; Kim, H.W.; Kim, S.S. Highly selective sensing of CO, C6H6, and C7H8 gases by catalytic functionalization with metal nanoparticles. ACS Appl. Mater. Interfaces 2016, 8, 7173–7183. [Google Scholar] [CrossRef]
- Kim, J.-H.; Mirzaei, A.; Kim, H.W.; Kim, S.S. Low power-consumption CO gas sensors based on Au-functionalized SnO2-ZnO core-shell nanowires. Sens. Actuators B 2018, 267, 597–607. [Google Scholar] [CrossRef]
- Kim, J.-H.; Mirzaei, A.; Kim, H.W.; Kim, S.S. Flexible and low power CO gas sensor with Au-functionalized 2D WS2 nanoflakes. Sens. Actuators B 2020, 313, 128040. [Google Scholar] [CrossRef]
- Weng, T.-F.; Ho, M.-S.; Sivakumar, C.; Balraj, B.; Chung, P.-F. VLS growth of pure and Au decorated β-Ga2O3 nanowires for room temperature CO gas sensor and resistive memory applications. Appl. Surf. Sci. 2020, 533, 147476. [Google Scholar] [CrossRef]
- Kim, J.-H.; Mirzaei, A.; Kim, H.W.; Kim, S.S. Realization of Au-decorated WS2 nanosheets as low power-consumption and selective gas sensors. Sens. Actuators B 2019, 296, 126659. [Google Scholar] [CrossRef]
- Park, H.; Kim, J.-H.; Vivod, D.; Kim, S.; Mirzaei, A.; Zahn, D.; Park, C.; Kim, S.S.; Halik, M. Chemical-recognition-driven selectivity of SnO2-nanowire-based gas sensors. Nano Today 2021, 40, 101265. [Google Scholar] [CrossRef]
- Choi, S.-W.; Katoch, A.; Kim, J.-H.; Kim, S.S. Prominent reducing gas-sensing performances of n-SnO2 nanowires by local creation of p-n heterojunctions by functionalization with p-Cr2O3 nanoparticles. ACS Appl. Mater. Interfaces 2014, 6, 17723–17729. [Google Scholar] [CrossRef] [PubMed]
- Song, X.; Xu, Q.; Zhang, T.; Song, B.; Li, C.; Cao, B. Room-temperature, high selectivity and low-ppm-level triethylamine sensor assembled with Au decahedrons-decorated porous α-Fe2O3 nanorods directly grown on flat substrate. Sens. Actuators B 2018, 268, 170–181. [Google Scholar] [CrossRef]
- Zhu, M.; Zhai, C.; Fujitsuka, M.; Majima, T. Noble metal-free near-infrared-driven photocatalyst for hydrogen production based on 2D hybrid of black Phosphorus/WS2. Appl. Catal. B 2018, 221, 645–651. [Google Scholar] [CrossRef]
- Kwak, C.-H.; Kim, T.-H.; Jeong, S.-Y.; Yoon, J.-W.; Kim, J.-S.; Lee, J.-H. Humidity-independent oxide semiconductor chemiresistors using terbium-doped SnO2 yolk-shell spheres for real-time breath analysis. ACS Appl. Mater. Interfaces 2018, 10, 18886–18894. [Google Scholar] [CrossRef]
- Choi, K.-I.; Kim, H.-J.; Kang, Y.C.; Lee, J.-H. Ultraselective and ultrasensitive detection of H2S in highly humid atmosphere sung CuO-loaded SnO2 hollow spheres for real-time diagnosis of halitosis. Sens. Actuators B 2014, 194, 371–376. [Google Scholar] [CrossRef]
- Gao, Z.; Song, G.; Zhang, X.; Li, Q.; Yang, S.; Wang, T.; Li, Y.; Zhang, L.; Fu, Y. A facile PDMS coating approach to room-temperature gas sensors with high humidity resistance and long-term stability. Sens. Actuators B 2020, 325, 128810. [Google Scholar] [CrossRef]
- Lim, T.; Kang, Y.; Jeong, S.-M.; Ju, S. Thermally nonreactive and chemically reactive metal-oxide-nanowire transistor covered with aerogel-microsphere-thin-film-based selective filter. Mater. Res. Express 2018, 5, 116402. [Google Scholar] [CrossRef]
- Mirzaei, A.; Kim, J.-H.; Kim, H.W.; Kim, S.S. Resistive-based gas sensors for detection of benzene, toluene and xylene (BTX) gases: A review. J. Mater. Chem. C 2018, 6, 4342–4370. [Google Scholar] [CrossRef]
- Mirzaei, A.; Lee, J.-H.; Majhi, S.M.; Weber, M.; Bechelany, M.; Kim, H.W.; Kim, S.S. Resistive gas sensors based on metal-oxide nanowires. J. Appl. Phys. 2019, 126, 241102. [Google Scholar] [CrossRef] [Green Version]
- Kim, H.-J.; Lee, J.-H. Highly sensitive and selective gas sensors using p-type oxide semiconductors: Overview. Sens. Actuators B 2014, 192, 607–627. [Google Scholar] [CrossRef]
- Chen, Z.; Wang, J.; Cao, N.; Wang, Y.; Li, H.; de Rooij, N.F.; Umar, A.; Feng, Y.; French, P.J.; Zhou, G. Three-dimensional graphene-based foams with “greater electron transferring areas” deriving high gas sensitivity. ACS Appl. Nano Mater. 2021, 4, 13234–13245. [Google Scholar] [CrossRef]
- Chen, Z.; Wang, J.; Wang, Y. Strategies for the performance enhancement of graphene-based gas sensors: A review. Talanta 2021, 235, 122745. [Google Scholar] [CrossRef] [PubMed]
- Kim, J.W.; Kim, A. Absolute work function measurement by using photoelectron spectroscopy. Curr. Appl. Phys. 2021, 31, 52–59. [Google Scholar] [CrossRef]
- Michaelson, H.B. The work function of the elements and its periodicity. J. Appl. Phys. 1977, 48, 4729. [Google Scholar] [CrossRef] [Green Version]
- Hübner, M.; Koziej, D.; Grunwaldt, J.-D.; Weimar, U.; Barsan, N. An Au clusters related spill-over sensitization mechanism in SnO2-based gas sensors identified by operando HERFD-XAS, work function changes, DC resistance and catalytic conversion studies. Phys. Chem. Chem. Phys. 2012, 14, 13249–13254. [Google Scholar] [CrossRef]
- Panda, D.; Nandi, A.; Datta, S.K.; Saha, H.; Majumdar, S. Selective detection of carbon monoxide (CO) gas by reduced graphene oxide (rGO) at room temperature. RSC Adv. 2016, 6, 47337–47348. [Google Scholar] [CrossRef]
- Quyang, C.; Chen, Y.; Qin, Z.; Zeng, D.; Zhang, J.; Wang, H.; Xie, C. Two-dimensional WS2-based nanosheets modified by Pt quantum dots for enhanced room-temperature NH3 sensing properties. Appl. Surf. Sci. 2018, 455, 45–52. [Google Scholar]
- Aykanat, A.; Meng, Z.; Stolz, R.M.; Morrell, C.T.; Mirica, K.A. Bimetallic two-dimensional metal-organic frameworks for the chemiresistive detection of carbon monoxide. Angew. Chem. 2022, 134, e202113665. [Google Scholar] [CrossRef]
- Absalan, S.; Nasresfahani, S.; Schikhi, M.H. High-performance carbon monoxide gas sensor based on palladium/tin oxide/porous graphitic carbon nitride nanocomposite. J. Alloys Compd. 2019, 795, 79–90. [Google Scholar] [CrossRef]
- Molavi, R.; Sheikhi, M.H. Facile wet chemical synthesis of Al doped CuO nanoleaves for carbon monoxide gas sensor applications. Mater. Sci. Semicond. Process. 2020, 106, 104767. [Google Scholar] [CrossRef]
Publisher’s Note: MDPI stays neutral with regard to jurisdictional claims in published maps and institutional affiliations. |
© 2022 by the authors. Licensee MDPI, Basel, Switzerland. This article is an open access article distributed under the terms and conditions of the Creative Commons Attribution (CC BY) license (https://creativecommons.org/licenses/by/4.0/).