Abstract
The severity of software bug reports plays an important role in maintaining software quality. Many approaches have been proposed to predict the severity of bug reports using textual information. In this research, we propose a deep learning framework called MASP that uses convolutional neural networks (CNN) and the content-aspect, sentiment-aspect, quality-aspect, and reporter-aspect features of bug reports to improve prediction performance. We have performed experiments on datasets collected from Eclipse and Mozilla. The results show that the MASP model outperforms the state-of-the-art CNN model in terms of average Accuracy, Precision, Recall, F1-measure, and the Matthews Correlation Coefficient (MCC) by 1.83%, 0.46%, 3.23%, 1.72%, and 6.61%, respectively.
1. Introduction
In software maintenance and development, bug reports play an important role because they provide much valuable information describing the problems encountered in software operations. Based on this information, one or more analysts, namely triagers, decide processing priorities and assign bug reports to software developers for correction. As shown in past studies [1,2,3,4,5,6], the severity attribute of a bug report is an important factor that influences its processing priority in the schedule of bug fixing activities that follow. When a bug report is submitted to a bug tracking system (BTS), such as Bugzilla (https://www.bugzilla.org, accessed on 7 July 2021) or MantisBT (https://www.mantisbt.org, accessed on 7 July 2021), the reporter generally assigns a severity level to the bug report based on personal judgement. However, the manual severity assignment process can be subjective and error-prone [3,4,5,6]. Therefore, research on severity prediction has attracted much attention [5,6]. Many schemes have been proposed that use machine learning [2,3,4,7,8,9,10,11,12,13,14,15,16,17,18,19,20,21,22,23] or information retrieval techniques [3,4,7,14,16,17,24].
To predict the severity level of a bug report, many features of the bug report have been investigated, including the unstructured text in the Summary and Description fields, the Product and Component attributes, and Reporter information. Figure 1 shows as an example bug report #576700 of Mozilla Firefox in which a severity level of Major is assigned. Although research studies have been conducted to investigate the effectiveness of severity prediction using multiple features, e.g., [9,10,21,23], to the best of our knowledge, deep learning techniques have not been comprehensively applied to exploit the abundant information in the multiple features of bug reports.

Figure 1.
An example of Mozilla Firefox bug report #576700.
In this paper, we propose a deep learning approach we call Multi-Aspect-based Severity Prediction (MASP) that uses convolutional neural networks (CNN) [25,26,27] to learn the content-, sentiment-, quality-, and reporter-aspect features of bug reports. With the effectiveness of the learning capability of the CNN model, MASP achieves performance improvements for severity prediction. In particular, this paper answers the following research questions:
- Does MASP outperform the state-of-the-art approaches in bug severity prediction?
- How does each aspect feature influence the prediction performance?
To investigate the effectiveness of MASP, we have performed experiments on seven datasets extracted from Eclipse and Mozilla and have compared its performance to that of two other severity prediction schemes [20,23]. The results show that the proposed MASP model outperforms the state-of-the-art CNN model eCNN [20] in terms of average Accuracy, Precision, Recall, F1-measure, and the Matthews Correlation Coefficient (MCC) by 1.83%, 0.46%, 3.23%, 1.72%, and 6.61%, respectively. The main contributions of this study are summarized as follows:
- We propose a novel severity prediction approach called MASP to predict the severity of bug reports using convolutional neural networks to learn multi-aspect features of bug reports.
- We perform experiments on two large open source projects (Eclipse and Mozilla). The experimental results show that MASP outperforms the state-of-the-art CNN model eCNN [20] in terms of average Accuracy, Precision, Recall, F1-measure, and MCC. MASP also outperforms another prediction model RF-PSO [23] considering multi-aspect features in terms of average Accuracy, Precision, F1-measure, and MCC.
- We also perform extensive experiments with a variety of feature configurations to investigate the influence of various aspect features. The sentiment-aspect and reporter-aspect features show the benefits in improving Precision and MCC. The quality-aspect features are beneficial for improving Accuracy, Recall, and F1-measure.
The rest of this paper is organized as follows. Section 2 presents an overview of the related work. Section 3 describes the problem definition and explains the proposed MASP model in detail. Section 4 describes the experimental process and its results. Section 5 discusses threats to the validity of this research. Section 6 concludes this paper.
2. Related Work
As machine learning technology is applied to mining software artifacts, various text-based severity prediction schemes for bug reports have been proposed. For example, Menzies and Marcus proposed a prediction scheme called SEVERIS that uses information gain to extract informative words and then learns the classification rules with a rule-based classifier for the bug reports of the NASA PITS dataset [2]. Lamkanfi et al. [3] proposed a prediction scheme using the Naïve Bayes (NB) model and applied the scheme on three open source projects, Eclipse, Mozilla, and GNOME. Later, they investigated the prediction performance of four classification models, namely, NB, Multinomial Naïve Bayes (MNB), 1-Nearest Neighbor (1NN), and Support Vector Machines (SVM) [4]. As shown in a recent survey [6] of 27 research papers published from 2010 to 2017, many machine learning classification models, such as k-Nearest Neighbor (kNN) [24], SVM [4], Random Forest [12], and the Bagging Ensemble model [11], have been used to construct bug severity prediction models. This survey also shows that 26 types of features were investigated in these papers. Most studies consider a small number of bug report features, and 96% of the surveyed studies exploit unstructured text data. Among the surveyed papers, only one study [10] considered nine quantified bug features that the authors studied more extensively for bug severity and fix-time prediction in their later work [21].
With advances in prediction schemes, more bug report features are being discussed in recent research. Sabor et al. [22] extended their previous work [13] to propose a severity prediction scheme that considers the similarity of stack traces and equivalence relationships of categorical features. Although their experimental results show that utilizing stack traces can improve prediction performance, their experiments only consider bug reports with at least one stack trace. Tan et al. [28] in response to the abundant discussions on software bugs in social media, proposed a prediction scheme using the logistic regression model. In their approach, bug reports are enhanced with sentences extracted by BM25 [29] from the Stack Overflow website. However, they do not discuss other features. In [23], an ensemble approach called Random Forest–Particle Swarm Optimization (RF-PSO) is proposed to train a Random Forest (RF) model with various features. A Particle Swarm Optimization (PSO) scheme is used to adjust the weights of the features. The experimental results show that RF-PSO achieves the highest prediction performance with the configuration of content-, quality-, and reporter-aspect features.
With the rapid development of deep learning technologies, prediction schemes for severity prediction have been proposed recently. In the work of Ramay et al. [20], a severity prediction scheme using a convolutional neural network (CNN) model is proposed to learn the emotion and textual information in historical bug reports. Their experimental results show that the CNN model can outperform a previous prediction model, EWD-Multinomial [16], which uses the MNB approach. However, this CNN model only considers emotion and textual features. In the work of Kukkar et al. [18], a prediction scheme called BCR is proposed that uses a CNN and Random Forest with boosting. As opposed to the CNN model used as a classifier in [20], the CNN model in the BCR scheme extracts feature vectors from n-gram data. It then uses the RF model with boosting processes to process the feature vectors for severity prediction. Compared with a hybrid scheme using the MNB model [15], BCR achieves significant improvements in prediction performance. However, BCR exploits only textual features.
Based on the above literature review, the deep learning technology shows a promising development trend in the severity prediction work. Considering multi-aspect features also plays an important role in helping the prediction model achieve higher performance. These observations motivate this work to design a deep learning approach considering multi-aspect features.
3. Research Methodology
3.1. Problem Definition
In this work, the severity prediction problem is modeled as a binary classification problem to sort an incoming bug report in a set of bug reports into one of two severity groups: Severe and Non-severe. We denote the class of bug reports by . Consequently, the severity prediction problem for a bug report is defined to predict the severity of with a classification model :
where and represents the parameter set of the classification model .
For this work, bug reports maintained by Bugzilla for various software projects are used to construct the learning model. In Bugzilla, the severity of each bug report is classified according to seven categories: Blocker, Critical, Major, Normal, Minor, Trivial, and Enhancement. Table 1 provides their definitions [30]. For this study, bug reports with the severity levels of Blocker, Critical, and Major are considered Severe. Bug reports with the severity levels of Minor and Trivial are considered Non-severe. The bug reports with the Enhancement level are ignored because these reports are requests for new functionalities. The bug reports with the Normal level are also neglected as in past studies [3,31,32] because the Normal level is the default option in bug reporting and requires further inspection to confirm its severity [33].

Table 1.
Severity levels used in Bugzilla.
3.2. Approach Overview
In this paper, a deep learning prediction model, MASP, is proposed that uses convolutional neural networks to predict the severity of a bug report . In MASP, various features are extracted from bug reports according to four features: the content-aspect feature , the sentiment-aspect feature , the quality-aspect feature , and the reporter-aspect feature . Therefore, the bug report is expressed as:
where represents the j-th word token in , is the emotion score from sentiment analysis, is the number of the steps to reproduce in , is the line number of the stack traces, is the number of attachments, is the line number of , and is the reporter importance score.
Figure 2 illustrates the prediction process of MASP. The features of the four aspects are extracted from training bug reports (Section 3.3). In MASP, the CNN prediction models are trained using these features (Section 3.4). Then, the multi-aspect features are also extracted from testing bug reports for severity prediction.
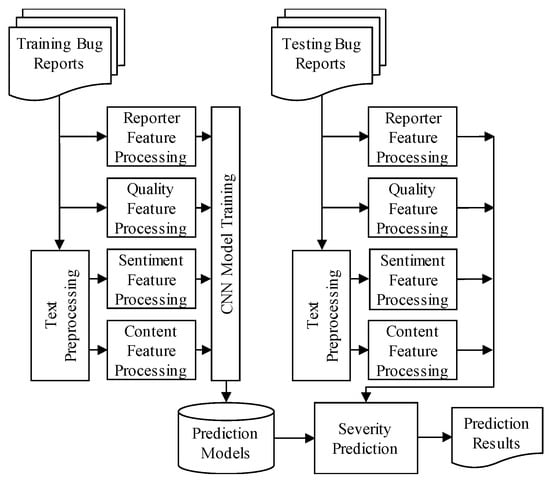
Figure 2.
Prediction process of MASP.
3.3. Feature Processing
Four aspects of features are extracted from the bug reports: content-aspect, sentiment-aspect, quality-aspect, and reporter-aspect. In this section, the processing steps for these features are described.
3.3.1. Content Feature Processing
In this work, the unstructured text data of the Summary field are extracted as the content-aspect information because they provide important descriptions about the problems encountered. In MASP, the text data are first processed through four steps to extract word tokens: tokenization, stopword removal, word inflection, and lemmatization. Table 2 illustrates the processing steps for Mozilla bug report #332186. Thereafter, word embedding vectors are used to represent these word tokens.
Table 2.
Text preprocessing in MASP.
- (1)
- Tokenization: The unstructured text data generally contain words, punctuation marks, and symbols. In this step, the symbols in “[ ] > < = * + − ( ) & \/# $ % ‘ ’ “ ” { } ˜ | ^” are removed because they do not convey meaningful information for severity prediction. The word tokens are also separated.
- (2)
- Stopword Removal: The second step is to remove the stopword tokens, including function words such as articles and prepositions that are mainly used in accordance with grammatical rules and common words that usually do not contribute to the main semantics of the document [34]. Since stopwords commonly appear in documents, they are not valuable for classification tasks. In this work, we use the English stopword list of the Natural Language Toolkit (NLTK) [35] to remove stopwords.
- (3)
- Word Inflection: The third step is to perform a simple inflection process by converting words from their plural form into their singular form. Otherwise, the same word will have different word vectors for its plural and singular forms.
- (4)
- Lemmatization: In this step, each word is converted to its base form. For example, “selecting” is converted to “select” as shown in Table 2. This step also converts the uppercase letters to lowercase letters.
To construct a CNN classification model, the content-aspect features are converted into word embedding vectors because word embedding is effective in representing the contextual semantic information [36,37]. In this work, Word2Vec [38] is used to generate word embedding vectors. In the Word2Vec model, there are two approaches for word vector generation: the Continuous Bag-of-Words (CBOW) model and the Skip-gram model [39]. In the CBOW model, the vector of the target word is calculated based on a window of the surrounding words. In the Skip-gram model, the target word is used to predict the surrounding words. Previous work [38,39] has shown that the Skip-gram model is slower than the CBOW model but provides better representation for infrequent words.
In this work, MASP uses the Skip-gram model to compute the word embedding vectors. The dimensionality of the word vectors is 100 and the window size is 5. The datasets constructed by Lamkanfi et al. [40] are used to train the word embedding vectors. The datasets contain bug reports of Eclipse and Mozilla from January 2006 to December 2013. The datasets do not include duplicate bug reports nor reports of severity level Enhancement. Bug reports of severity level Normal are discarded in this work. From the datasets, we choose bug reports of seven open-source products: CDT, JDT, Platform, Core, Firefox, Bugzilla, and Thunderbird. The bug reports of PDE are not considered because their number is less than 1000 after report removal. Table 3 shows the details of the datasets.
Table 3.
Datasets for word vector training and severity prediction.
3.3.2. Sentiment Feature Processing
In software engineering research, various sentiment analysis schemes, such as EmoTxt [41], SentiCR [42], SentiStrength-SE [43], and Senti4SD [44], have been proposed to perform polarity detection for software artifacts. In general, the emotion score of each text is calculated and the text is accordingly classified into one of three classes: positive, negative, or neutral.
In this work, we use Senti4SD to calculate the emotion score because it achieves superior performance over SentiCR and SentiStrength-SE, as shown in [44]. For each bug report, Senti4SD calculates the emotion score based on the textual information. For example, the sentiment polarity of Mozilla bug report #332186 is negative.
3.3.3. Quality Feature Processing
Quality-aspect features improve the performance of severity prediction [9,23] and provide important information on bug resolution for software maintenance [45,46,47,48]. We follow previous work [9,23] to extract four kinds of quality-aspect features for training CNN prediction models.
- (1)
- The number of the steps to reproduce : The steps needed to reproduce can provide important information for developers to reproduce the stated bug. In general, the Pearson Chi-square univariate tests in [23] show that this feature is statistically significant for the Severe decision in their study. MASP uses a parser to calculate the number of steps in each bug report.
- (2)
- The line number of stack traces : Stack traces reveal the execution information of call stacks. As studied in [48] for Eclipse, stack traces provide candidate locations for the resolution of almost 60% of bug reports with stack traces. In a study [23], the line number of the stack traces is statistically significant for the Severe decision if a considerable number of bug reports have stack traces. MASP uses a parser to calculate the line number of the stack traces.
- (3)
- The number of attachments : On the BTS, bug reporters may use attachments such as code segments or screenshots to explain the stated bugs. As shown in a study [23], the number of attachments is statistically significant for the Severe decision in most cases. In this work, MASP extracts this number as a quality-aspect feature.
- (4)
- The number of lines in the bug report : As shown in a study [23], a more severe bug report is generally longer. In this study, the line number of each bug report is calculated as a quality-aspect feature for MASP.
These four quality-aspect features are calculated from the content of bug reports. They are normalized in the range of 0 to 1 for further CNN model training and prediction.
3.3.4. Reporter Feature Processing
In a BTS, a bug report usually accumulates threads of comments or discussions about the stated bug and the possible resolutions. The interactions among the reporters can be modeled as a social network. Based on the social networking model, the importance of the reporter to the software development is calculated as a reporter-aspect feature. In this work, we adopt the Developer Prioritization (DP) model [8], an extension of LeaderRank [49], as the social networking model to calculate the reporter-aspect feature. As shown in [8,23], the reporter importance feature is beneficial for improving the performance of severity prediction.
Algorithm 1 illustrates the DP model. To construct a social network of n reporters, a pseudo-root node is added with bi-directional links to every reporter . The adjacency matrix denotes the comment relationships among the reporters, where is the number of comments from to . The score of is the node score at time , and is a constant to control the convergence time to a steady state. For node , the out-degree is .
| Algorithm 1 Importance scoring for reporter-aspect features. |
| Input: the adjacency matrix for reporters Output: the importance score for 1: Initialize , and 2: for t = 1 to do 3: 4: end for 5: Return for each . |
The importance score . shows the degree of influence of reporter in the social interactions. If is close to 1, reporter is very active in participating in the resolution activities and is also often involved in discussions of severe bug reports. In this work, the convergence constant is 85.
3.4. CNN-Based Prediction Model
In this work, we construct a prediction model using CNN [25,26,27] to learn the characteristics of multi-aspect features. Figure 3 depicts the CNN model. The content-aspect features are first converted to word vectors in the embedding layer. The embedding layer also converts the sentiment-aspect, quality-aspect, and reporter-aspect features to a one-dimensional vector to represent the meta-information of the bug report. Then, the word vectors are processed in a convolutional layer, and another convolutional layer is constructed to process the one-dimensional metadata vector. Both convolutional layers are constructed using a CNN model with 128 neurons of kernel size 1. The activation function is tanh. In the convolutional layers, the convolution filter (the kernel) is applied on the input data to generate feature maps. The main idea is to acquire the most important feature. Therefore, the important features can be identified.

Figure 3.
CNN prediction model.
The output of the convolutional layer is forwarded to a max-pooling layer to reduce its dimensionality. This is a down-sampling process to extract the most significant characteristics. The max-pooling layer can reduce the training time and decrease the overfitting effect. Then, a join layer is used to merge the output data of the max-pooling layers from feature representations together. A fully connected layer is used as the hidden layer to learn more knowledge. Finally, a 2-node fully connected layer is used as the output layer to derive the final prediction results.
4. Experiments
To validate the effectiveness of the proposed approach, this study follows the performance validation approach adopted in previous severity prediction studies [3,20] using datasets collected from real software projects. Experiments were conducted with bug reports from real software projects to evaluate the effectiveness of the proposed MASP model. This section first describes the setup of the experiments and then discusses the results in relation to the research questions.
4.1. Setup of Experiments
In the experiments, we use the datasets collected by Lamkanfi et al. [40] to evaluate MASP and other prediction schemes. Details of the datasets used in the experiments are given in Table 3. In the experiments, we follow the cross-product validation approach used in [20] for performance evaluation. The bug reports of six products are used as the training data, and the bug reports of the remaining product are used as the test data. The validation process is iterated 7 times and the 7 products are tested in rotation.
The MASP model is implemented with TensorFlow 2.2 and Keras 2.3.1. Table 4 shows the implementation parameters used in this work to construct the MASP model. We also implement two other prediction models for performance comparison: eCNN [20] and RF-PSO [23]. Since there are various configurations of the RF-PSO model using different features to train the Random Forest model, this work evaluates the RF-PSO model that achieves the highest prediction performance with the configuration of content-aspect, quality-aspect, and reporter-aspect features.
Table 4.
The implementation parameters of the MASP model.
In the experiments, the prediction models are evaluated with five metrics: Accuracy, Precision, Recall, F1-measure, and the Matthews Correlation Coefficient (MCC) [50]. The metrics Accuracy, Precision, Recall, and F1-measure are general performance metrics to evaluate classification models. As shown in [51], MCC has advantages over Accuracy and F1-measure in binary classification problems because MCC is a symmetric measure that considers all categories in the confusion matrix. The metrics are defined as follows:
where TP is the number of the correctly predicted severe reports, TN is the number of the correctly predicted non-severe reports, FP is the number of the bug reports that are incorrectly predicted as severe, and FN is the number of the bug reports that are incorrectly predicted as non-severe. Table 5 shows the confusion matrix.
Table 5.
The confusion matrix for severity prediction.
4.2. Results
Two research questions are studied in the experiments:
- (1)
- Does MASP outperform the state-of-the-art approaches in bug severity prediction?
- (2)
- How does each aspect feature influence the prediction performance?
To answer the first research question RQ1, we compare the MASP model against two severity prediction models: eCNN [20] and RF-PSO [23]. eCNN is a state-of-the-art severity prediction model that is constructed using CNN. Moreover, eCNN exploits content-aspect and sentiment-aspect features to achieve performance improvements over EWD-Multinomial [16] and a topic-enhanced prediction scheme [14]. The experimental results in [20] show that the CNN model can effectively achieve performance improvements over the MNB model used in EWD-Multinomial [16]. RF-PSO is an ensemble approach achieving high prediction performance using content-aspect, quality-aspect, and reporter-aspect features by adjusting their weights. However, the contextual information of content-aspect features is not considered in the Random Forest model. In this study, these two models are evaluated because they use features of multiple aspects.
4.2.1. RQ1: Performance Comparisons
Table 6, Table 7 and Table 8 show the performance results of the cross-product validation for MASP, eCNN, and RF-PSO with different datasets. From these tables, we see that MASP outperforms eCNN and RF-PSO on average in terms of Accuracy, Precision, F1-measure, and MCC. RF-PSO outperforms MASP and eCNN in terms of average Recall, but it has the lowest average Accuracy, Precision, and MCC scores. The results show that RF-PSO has more False-Positive (FP) results in the experiments. Therefore, although RF-PSO has the best average Recall score, programmers may need to spend more time in processing bug reports wrongly predicted as severe.
Table 6.
Prediction performance of MASP.
Table 7.
Prediction performance of eCNN.
Table 8.
Prediction performance of RF-PSO.
The significance of the performance differences was further statistically analyzed using t-tests on their results of Accuracy, F1-measure, and MCC. For MASP and eCNN, the null hypothesis is that there is no difference between MASP and eCNN. If , the null hypothesis is rejected. Similarly, the second null hypothesis is that there is no difference between MASP and RF-PSO. In the t-tests, the p-value is 0.00125 for and the p-value is 0.00326 for . Both null hypotheses are rejected. Moreover, the confidence interval for the average accuracy of MASP from cross-product validation is calculated. The 95% confidence interval is [0.743, 0.770]. This shows that the accuracy of MASP is satisfied.
The performance results and the statistical analysis results show that MASP effectively outperforms eCNN on average. The improvements mainly come from the quality-aspect and reporter-aspect features. These results show the promising effectiveness of MASP.
4.2.2. RQ2: Influence of Features
Various aspect features are used to train the CNN models in MASP. In RQ2, we investigate the influence of the content-aspect (C), sentiment-aspect (S), quality-aspect (Q), and reporter-aspect (R) features. MASP uses combinations of these features (CS, CQ, CR, CSQ, CSR, CQR, and CSQR) to perform severity predictions. Table 9 shows the performance results of these configurations.
Table 9.
Average prediction performance of various configuration of MASP.
The results show that CSQR outperforms other configurations in terms of Accuracy, Recall, and F1-measure. We also find that the quality-aspect and reporter-aspect features can be especially beneficial for improving prediction performance. For the configurations with only two kinds of multi-aspect features, CQ achieves the best performance in terms of average Accuracy, Recall, and F1-measure, while CR achieves the best performance in terms of average Precision and MCC. Although eCNN is a special case of MASP with configuration CS, we notice that eCNN achieves the lowest performance in terms of average Accuracy, Recall, F1-measure, and MCC. For the configurations with only three kinds of multi-aspect features, CQR achieves the best performance in terms of average Accuracy, Recall, and F1-measure, and CSR achieves the best performance in terms of average Precision and MCC.
The significance of the performance differences was further statistically analyzed using t-tests. In the statistical analysis, t-tests were conducted with three null hypotheses for the configurations with only two kinds of multi-aspect features on their results of Accuracy, F1-measure, and MCC. For CS and CQ, the null hypothesis is that there is no difference between CS and CQ. If , the null hypothesis is rejected. Similarly, the second null hypothesis is that there is no difference between CS and CR, and the third null hypothesis is that there is no difference between CQ and CR. In the t-tests, the p-value is 0.00020 for , the p-value is 0.04181 for , and the p-value is 0.74558 for . The results suggest that there is a significant performance difference for CS and CQ as for CS and CR. For CQ and CR, the null hypothesis is not rejected because CQ cannot consistently outperform CR in terms of Accuracy, F1-measure, and MCC.
From these results, the sentiment-aspect and reporter-aspect features show the benefits in improving Precision and MCC. The quality-aspect features are beneficial for improving Accuracy, Recall, and F1-measure.
5. Threats to Validity and Limitation
The proposed prediction model can help the triaging process in handling bug reports. The prediction results can be also applied to other tasks of mining software artifacts, such as code smell prediction [52] and developer recommendation [53]. However, there are some possible threats of this study. These factors include the construct validity, internal validity, and external validity.
- Construct Validity: The first threat to the construct validity is related to the suitability of our evaluation metrics: Accuracy, Precision, Recall, F1-measure, and MCC. Because these metrics have been used in many bug severity studies, this threat is limited by the research. Another threat to the construct validity is that we use Senti4SD to calculate the emotion scores of bug reports. Although Senti4SD is a state-of-the-art approach, it is constructed with Stack Overflow documents, not bug reports. However, the threat of using Senti4SD should be limited in performance comparisons because eCNN also uses Senti4SD to calculate emotion scores [20]. Another threat to the construct validity is related to the setting of hyperparameters for deep learning algorithms. In this work, we do not adopt an optimization algorithm to fine-tune the hyperparameters. Although the performance of MASP reported in this paper may not be the best, this threat should be limited for the generalizability of the proposed MASP model.
- Internal Validity: We implemented eCNN from scratch, based on paper [20]. Although we verified the implementation and the results, there could be some implementation differences and undiscovered bugs. Another threat to the internal validity is that the implementation details of text preprocessing for stopword removal, word inflection, and lemmatization also affect the performance. However, these threats should have limited effects on the performance comparisons.
- External Validity: We applied the sentiment-aspect, quality-aspect, and reporter-aspect features to the MASP model to predict the severity of bug reports for two projects, Eclipse and Mozilla. There is a threat that the results may not be generalizable to other projects. The second threat to the external validity is that we only consider bug reports managed by Bugzilla. However, the current results are promising.
The proposed prediction model has the following limitations. First, a large scale dataset is required because the deep learning model has the small data challenge [54]. Therefore, the performance of the proposed prediction model is limited if the number of bug reports of the software project is small. Second, the word embedding processing of the proposed prediction model also needs a large-scale text corpus to train high-quality word vectors. Therefore, the performance of the proposed prediction model is also limited if the text corpus for word vector training is small.
6. Conclusions
Severity prediction for bug reports has attracted much attention and many schemes have been proposed. In this study, we consider content-aspect, sentiment-aspect, quality-aspect, and reporter-aspect features to improve prediction performance. A CNN-based classification approach, MASP, is proposed for predicting the severity of bug reports.
To investigate the effectiveness of MASP, experiments were conducted using cross-product validation with bug reports collected from the Eclipse and Mozilla projects. The experimental results show that MASP outperforms the state-of-the-art CNN approach eCNN and outperforms another prediction model RF-PSO in most performance metrics. There are two main reasons for the effectiveness of MASP. Firstly, more types of aspect features are considered in MASP than in eCNN. Therefore, MASP achieves higher average F1 and MCC scores than eCNN. Secondly, the deep learning layers in MASP consider the contextual relationships existing in the multi-aspect features. However, the features are considered independent in RF-PSO. Therefore, MASP also achieves higher average F1 and MCC scores than RF-PSO.
Overall, the promising results of this work demonstrate that the CNN deep learning model can effectively learn the characteristics of multi-aspect features for handling the binary severity prediction problem. Considering features of many aspects is potentially beneficial for improving the prediction performance. Therefore, more distinctive features, such as the quality measures of software products [55], will be explored for further performance improvements. Moreover, the hyperparameter optimization problem issues will be investigated. A systematic scheme will be devised to fine-tune the hyperparameters of the deep learning CNN model. In the future, the performance of MASP on software projects maintained in different BTS systems will also be studied. These investigations will be beneficial for achieving more improvements in future severity prediction models.
Author Contributions
Conceptualization and methodology, A.-H.D. and C.-Z.Y.; software, A.-H.D.; validation, A.-H.D. and C.-Z.Y.; experiment analysis, A.-H.D.; investigation, A.-H.D. and C.-Z.Y.; writing—original draft preparation, A.-H.D.; writing—review and editing, C.-Z.Y.; supervision, C.-Z.Y.; project administration, C.-Z.Y.; funding acquisition, C.-Z.Y. All authors have read and agreed to the published version of the manuscript.
Funding
This research was supported in part by Ministry of Science and Technology, Taiwan under Grant No. MOST 109-2221-E-155-028.
Institutional Review Board Statement
Not applicable.
Informed Consent Statement
Not applicable.
Data Availability Statement
Publicly available datasets were adopted in this study. This data can be found here: https://github.com/ansymo/msr2013-bug_dataset (accessed on 25 May 2021).
Conflicts of Interest
The authors declare no conflict of interest. The funders had no role in the design of the study; in the collection, analyses, or interpretation of data; in the writing of the manuscript, or in the decision to publish the results.
References
- Herraiz, I.; German, D.M.; Gonzalez-Barahona, J.M.; Robles, G. Towards a simplification of the bug report form in Eclipse. In Proceedings of the 2008 International Workshop on Mining Software Repositories (MSR ’08), Leipzig, Germany, 10–11 May 2008; pp. 145–148. [Google Scholar] [CrossRef]
- Menzies, T.; Marcus, A. Automated severity assessment of software defect reports. In Proceedings of the 2008 IEEE International Conference on Software Maintenance, Beijing, China, 28 September–4 October 2008; pp. 346–355. [Google Scholar]
- Lamkanfi, A.; Demeyer, S.; Giger, E.; Goethals, B. Predicting the Severity of a Reported Bug. In Proceedings of the 7th IEEE Working Conference on Mining Software Repositories (MSR ’10), Cape Town, South Africa, 2–3 May 2010; pp. 1–10. [Google Scholar]
- Lamkanfi, A.; Demeyer, S.; Soetens, Q.D.; Verdonck, T. Comparing Mining Algorithms for Predicting the Severity of a Reported Bug. In Proceedings of the 15th European Conference on Software Maintenance and Reengineering, Oldenburg, Germany, 1–4 March 2011; pp. 249–258. [Google Scholar]
- Cavalcanti, Y.C.; Neto, P.A.D.M.S.; Machado, I.D.C.; Vale, T.F.; De Almeida, E.S.; Meira, S.R.D.L. Challenges and opportunities for software change request repositories: A systematic mapping study. J. Softw. Evol. Process. 2013, 26, 620–653. [Google Scholar] [CrossRef]
- Gomes, L.A.F.; Torres, R.D.S.; Côrtes, M.L. Bug report severity level prediction in open source software: A survey and research opportunities. Inf. Softw. Technol. 2019, 115, 58–78. [Google Scholar] [CrossRef]
- Yang, C.-Z.; Hou, C.-C.; Kao, W.-C.; Chen, I.-X. An Empirical Study on Improving Severity Prediction of Defect Reports Using Feature Selection. In Proceedings of the 2012 19th Asia-Pacific Software Engineering Conference, Hong Kong, China, 4–7 December 2012; Volume 1, pp. 240–249. [Google Scholar]
- Xuan, J.; Jiang, H.; Ren, Z.; Zou, W. Developer prioritization in bug repositories. In Proceedings of the 2012 34th International Conference on Software Engineering (ICSE), Zurich, Switzerland, 2–9 June 2012; pp. 25–35. [Google Scholar]
- Yang, C.-Z.; Chen, K.-Y.; Kao, W.-C.; Yang, C.-C. Improving Severity Prediction on Software Bug Reports using Quality Indicators. In Proceedings of the 2014 5th IEEE International Conference on Software Engineering and Service Science (ICSESS 2014), Beijing, China, 27–29 June 2014; pp. 216–219. [Google Scholar]
- Sharma, M.; Kumari, M.; Singh, R.K.; Singh, V.B. Multiattribute Based Machine Learning Models for Severity Prediction in Cross Project Context. In Proceedings of the Transactions on Petri Nets and Other Models of Concurrency XV; Springer: Berlin/Heidelberg, Germany, 2014; pp. 227–241. [Google Scholar]
- Xia, X.; Lo, D.; Shihab, E.; Wang, X.; Yang, X. ELBlocker: Predicting blocking bugs with ensemble imbalance learning. Inf. Softw. Technol. 2015, 61, 93–106. [Google Scholar] [CrossRef]
- Otoom, A.F.; Al-Shdaifat, D.; Hammad, M.; Abdallah, E.E. Severity prediction of software bugs. In Proceedings of the 2016 7th International Conference on Information and Communication Systems (ICICS), Irbid, Jordan, 5–7 April 2016; pp. 92–95. [Google Scholar]
- Sabor, K.K.; Hamdaqa, M.; Hamou-Lhadj, A. Automatic Prediction of the Severity of Bugs Using Stack Traces. In Proceedings of the 26th International Conference on Computer Science and Software Engineering (CASCON ’16), Toronto, ON, Canada, 31 October–2 November 2016; pp. 96–105. [Google Scholar]
- Zhang, T.; Chen, J.; Yang, G.; Lee, B.; Luo, X. Towards more accurate severity prediction and fixer recommendation of software bugs. J. Syst. Softw. 2016, 117, 166–184. [Google Scholar] [CrossRef]
- Zhou, Y.; Tong, Y.; Gu, R.; Gall, H. Combining text mining and data mining for bug report classification. J. Softw. Evol. Process. 2016, 28, 150–176. [Google Scholar] [CrossRef]
- Yang, G.; Baek, S.; Lee, J.-W.; Lee, B. Analyzing Emotion Words to Predict Severity of Software Bugs: A Case Study of Open Source Projects. In Proceedings of the Symposium on Applied Computing (SAC ’17), Marrakech, Morocco, 4–6 April 2017; pp. 1280–1287. [Google Scholar]
- Yang, G.; Zhang, T.; Lee, B. An Emotion Similarity Based Severity Prediction of Software Bugs: A Case Study of Open Source Projects. IEICE Trans. Inf. Syst. 2018, 2015–2026. [Google Scholar] [CrossRef] [Green Version]
- Kukkar, A.; Mohana, R.; Nayyar, A.; Kim, J.; Kang, B.-G.; Chilamkurti, N. A Novel Deep-Learning-Based Bug Severity Classification Technique Using Convolutional Neural Networks and Random Forest with Boosting. Sensors 2019, 19, 2964. [Google Scholar] [CrossRef] [PubMed] [Green Version]
- Abdallah, E.E.; Aljammal, A.; Otoom, A.F.; Hammad, M.; Al Shdaifat, D. Automated labelling and severity prediction of software bug reports. Int. J. Comput. Sci. Eng. 2019, 19, 330. [Google Scholar] [CrossRef]
- Ramay, W.Y.; Umer, Q.; Yin, X.C.; Zhu, C.; Illahi, I. Deep Neural Network-Based Severity Prediction of Bug Reports. IEEE Access 2019, 7, 46846–46857. [Google Scholar] [CrossRef]
- Sharma, M.; Kumari, M.; Singh, V.B. Multi-attribute dependent bug severity and fix time prediction modeling. Int. J. Syst. Assur. Eng. Manag. 2019, 10, 1328–1352. [Google Scholar] [CrossRef]
- Sabor, K.K.; Hamdaqa, M.; Hamou-Lhadj, A. Automatic prediction of the severity of bugs using stack traces and categorical features. Inf. Softw. Technol. 2020, 123, 106205. [Google Scholar] [CrossRef]
- Yang, C.-Z.; Chen, K.-Y.; Dao, A.-H. Bug Severity Assessment based on Weighted Multi-Facet Features with Particle Swarm Optimization. J. Inf. Sci. Eng. 2021, accepted. [Google Scholar]
- Tian, Y.; Lo, D.; Sun, C. Information Retrieval Based Nearest Neighbor Classification for Fine-Grained Bug Severity Prediction. In Proceedings of the 2012 19th Working Conference on Reverse Engineering, Washington, DC, USA, 15–18 October 2012; pp. 215–224. [Google Scholar]
- LeCun, Y.; Boser, B.; Denker, J.S.; Henderson, D.; Howard, R.E.; Hubbard, W.; Jackel, L.D. Backpropagation Applied to Handwritten Zip Code Recognition. Neural Comput. 1989, 1, 541–551. [Google Scholar] [CrossRef]
- LeCun, Y.; Bottou, L.; Bengio, Y.; Haffner, P. Gradient-based learning applied to document recognition. Proc. IEEE 1998, 86, 2278–2324. [Google Scholar] [CrossRef] [Green Version]
- Kim, Y. Convolutional neural networks for sentence classification. In Proceedings of the 2014 Conference on Empirical Methods in Natural Language Processing, Doha, Qatar, 25–29 October 2014; pp. 1746–1751. [Google Scholar]
- Tan, Y.; Xu, S.; Wang, Z.; Zhang, T.; Xu, Z.; Luo, X. Bug severity prediction using question-and-answer pairs from Stack Overflow. J. Syst. Softw. 2020, 165, 110567. [Google Scholar] [CrossRef]
- Robertson, S.E.; Walker, S.; Jones, S.; Hancock-Beaulieu, M.; Gatford, M. Okapi at TREC-3. In Proceedings of the 3rd Text REtrieval Conference (TREC-3), Gaithersburg, MD, USA, 2–4 November 1994; pp. 109–126. [Google Scholar]
- Williams, D. WTP/Conventions of Bug Priority and Severity. Available online: https://wiki.eclipse.org/WTP/Conventions_of_bug_priority_and_severity (accessed on 25 May 2021).
- Roy, N.K.-S.; Rossi, B. Towards an Improvement of Bug Severity Classification. In Proceedings of the 2014 40th EUROMICRO Conference on Software Engineering and Advanced Applications, Verona, Italy, 27–29 August 2014; pp. 269–276. [Google Scholar]
- Sharma, G.; Sharma, S.; Gujral, S. A Novel Way of Assessing Software Bug Severity Using Dictionary of Critical Terms. Procedia Comput. Sci. 2015, 70, 632–639. [Google Scholar] [CrossRef] [Green Version]
- Saha, R.K.; Lawall, J.; Khurshid, S.; Perry, D.E. Are These Bugs Really Normal? In Proceedings of the 2015 IEEE/ACM 12th Working Conference on Mining Software Repositories, Florence, Italy, 16–17 May 2015; pp. 258–268. [Google Scholar]
- Feldman, R.; Sanger, J. The Text Mining Handbook: Advanced Approaches in Analyzing Unstructured Data; Cambridge University Press: Cambridge, UK, 2006. [Google Scholar]
- Loper, E.; Bird, S. NLTK: The Natural Language Toolkit. In Proceedings of the ACL-02 Workshop on Effective Tools and Methodologies for Teaching Natural Language Processing and Computational Linguistics, Philadelphia, PA, USA, 7 July 2012; Volume 1, pp. 63–70. [Google Scholar]
- Kusner, M.; Sun, Y.; Kolkin, N.; Weinberger, K. From Word Embeddings to Document Distances. In Proceedings of the 32nd International Conference on Machine Learning, Lille, France, 7–9 July 2015; pp. 957–966. [Google Scholar]
- Liu, Y.; Liu, Z.; Chua, T.-S.; Sun, M. Topical Word Embeddings. In Proceedings of the 29th AAAI Conference on Artificial Intelligence (AAAI ’15), Austin, TX, USA, 25–30 January 2015; pp. 2418–2424. [Google Scholar]
- Mikolov, T.; Sutskever, I.; Chen, K.; Corrado, G.S.; Dean, J. Distributed Representations of Words and Phrases and their Compositionality. In Proceedings of the 26th International Conference on Neural Information Processing Systems (NIPS 2013), Lake Tahoe, NV, USA, 5–10 December 2013; pp. 3111–3119. [Google Scholar]
- Mikolov, T.; Chen, K.; Corrado, G.; Dean, J. Efficient estimation of word representations in vector space. arXiv 2013, arXiv:1301.3781v3. [Google Scholar]
- Lamkanfi, A.; Perez, J.; Demeyer, S. The Eclipse and Mozilla defect tracking dataset: A genuine dataset for mining bug information. In Proceedings of the 2013 10th Working Conference on Mining Software Repositories (MSR ’13), San Francisco, CA, USA, 18–19 May 2013; pp. 203–206. [Google Scholar]
- Calefato, F.; Lanubile, F.; Novielli, N. EmoTxt: A toolkit for emotion recognition from text. In Proceedings of the 2017 Seventh International Conference on Affective Computing and Intelligent Interaction Workshops and Demos (ACIIW), San Antonio, TX, USA, 23–26 October 2017; pp. 79–80. [Google Scholar]
- Ahmed, T.; Bosu, A.; Iqbal, A.; Rahimi, S. SentiCR: A Customized Sentiment Analysis Toolfor Code Review Interactions. In Proceedings of the 32nd IEEE/ACM International Conference on Automated Software Engineering (ASE 2017), Urbana-Champaign, IL, USA, 30 October–3 November 2017; pp. 106–111. [Google Scholar]
- Islam, R.; Zibran, M.F. SentiStrength-SE: Exploiting domain specificity for improved sentiment analysis in software engineering text. J. Syst. Softw. 2018, 145, 125–146. [Google Scholar] [CrossRef]
- Calefato, F.; Lanubile, F.; Maiorano, F.; Novielli, N. Sentiment Polarity Detection for Software Development. Empir. Softw. Eng. 2018, 23, 1352–1382. [Google Scholar] [CrossRef] [Green Version]
- Bettenburg, N.; Just, S.; Schröter, A.; Weiß, C.; Premraj, R.; Zimmermann, T. Quality of bug reports in Eclipse. In Proceedings of the 2007 OOPSLA Workshop on Eclipse Technology eXchange, Montreal, QC, Canada, 21 October 2007; pp. 21–25. [Google Scholar] [CrossRef]
- Bettenburg, N.; Premraj, R.; Zimmermann, T.; Kim, S. Extracting structural information from bug reports. In Proceedings of the 2008 International Workshop on Mining Software Repositories (MSR ’08), Leipzig, Germany, 10–11 May 2008; pp. 27–30. [Google Scholar]
- Zimmermann, T.; Premraj, R.; Bettenburg, N.; Just, S.; Schroter, A.; Weiss, C. What Makes a Good Bug Report? IEEE Trans. Softw. Eng. 2010, 36, 618–643. [Google Scholar] [CrossRef]
- Schroter, A.; Bettenburg, N.; Premraj, R. Do stack traces help developers fix bugs? In Proceedings of the 2010 7th IEEE Working Conference on Mining Software Repositories (MSR ’10), Cape Town, South Africa, 2–3 May 2010; pp. 118–121. [Google Scholar]
- Lü, L.; Zhang, Y.-C.; Yeung, C.H.; Zhou, T. Leaders in Social Networks, the Delicious Case. PLoS ONE 2011, 6, e21202. [Google Scholar] [CrossRef] [PubMed] [Green Version]
- Matthews, B. Comparison of the predicted and observed secondary structure of T4 phage lysozyme. Biochim. Biophys. Acta 1975, 405, 442–451. [Google Scholar] [CrossRef]
- Chicco, D.; Jurman, G. The advantages of the Matthews correlation coefficient (MCC) over F1 score and accuracy in binary classification evaluation. BMC Genom. 2020, 21, 1–13. [Google Scholar] [CrossRef] [Green Version]
- Gupta, A.; Suri, B.; Kumar, V.; Misra, S.; Blažauskas, T.; Damaševičius, R. Software Code Smell Prediction Model Using Shannon, Rényi and Tsallis Entropies. Entropy 2018, 20, 372. [Google Scholar] [CrossRef] [PubMed] [Green Version]
- Guo, S.; Chen, S.; Wang, S.; Zhang, D.; Liu, Y.; Guo, C.; Li, H.; Li, T. A Multi-Factor Approach for Selection of Developers to Fix Bugs in a Program. Appl. Sci. 2019, 9, 3327. [Google Scholar] [CrossRef] [Green Version]
- Qi, G.-J.; Luo, J. Small Data Challenges in Big Data Era: A Survey of Recent Progress on Unsupervised and Semi-Supervised Methods. IEEE Trans. Pattern Anal. Mach. Intell. 2020, 1. [Google Scholar] [CrossRef]
- Kumari, M.; Misra, A.; Misra, S.; Sanz, L.F.; Damasevicius, R.; Singh, V. Quantitative Quality Evaluation of Software Products by Considering Summary and Comments Entropy of a Reported Bug. Entropy 2019, 21, 91. [Google Scholar] [CrossRef] [Green Version]
Publisher’s Note: MDPI stays neutral with regard to jurisdictional claims in published maps and institutional affiliations. |
© 2021 by the authors. Licensee MDPI, Basel, Switzerland. This article is an open access article distributed under the terms and conditions of the Creative Commons Attribution (CC BY) license (https://creativecommons.org/licenses/by/4.0/).