Abstract
This paper presents an energy-aware Artificial Intelligence of Things framework designed for intelligent remote device control in residential settings. The system architecture is grounded in the Power Administration Device (PAD), a cost-effective and non-intrusive smart plug prototype that measures real-time electricity consumption and actuates appliance power states. The PAD transmits data to a scalable, cross-platform cloud infrastructure, which powers a web-based interface for monitoring, configuration, and multi-device control. Central to this framework is Cross-Feature Time-MoE, a novel neural forecasting model that processes the ingested data to predict consumption patterns. Integrating a Transformer Decoder with a Top-K Mixture-of-Experts (MoE) layer for temporal reasoning and a Bilinear Interaction Layer for capturing complex cross-time and cross-feature dependencies, the model generates accurate multi-horizon energy forecasts. These predictions drive actionable recommendations for device shut-off times, facilitating automated energy efficiency. Simulation results indicate that this system yields substantial reductions in energy consumption, particularly for high-wattage appliances, providing a user-friendly, scalable solution for household cost savings and environmental sustainability.
Keywords:
energy awareness; internet of things; edge computing; device control; artificial intelligence; machine learning; neural networks; transformers; mixture of experts MSC:
68T07; 62M10; 68T20
1. Introduction
The escalating global energy demand, coupled with the urgent need to mitigate climate change, has placed significant pressure on societies to adopt more sustainable practices [1]. The residential sector is a major contributor to overall energy consumption, yet households often lack the tools to effectively monitor and manage their usage. This “awareness gap” stems from the absence of granular, real-time, appliance-level data, which prevents consumers from understanding their consumption patterns and making informed decisions to reduce waste [2]. While traditional smart metering initiatives have been a step forward, they typically provide aggregated, low-frequency data, failing to offer the actionable insights needed for profound behavioral change. Addressing this gap requires a fundamental shift towards more intelligent, accessible, and user-centric energy management systems.
The Internet of Things (IoT) has emerged as a transformative paradigm with the potential to bridge this awareness gap. By embedding smart sensors and connectivity into everyday objects, the IoT creates an environment where physical devices can communicate and share data seamlessly. This technological revolution is the bedrock of the modern smart home, enabling automated control and enhanced monitoring of various household systems. The development of standardized communication protocols is critical for this ecosystem’s success [3]. Recent advancements, such as the Matter protocol, aim to resolve long-standing interoperability issues between devices from different manufacturers, promising a more unified and accessible smart home experience for consumers [4,5]. The convergence of these technologies provides the ideal foundation for developing sophisticated energy management solutions that are both powerful and easy to use.
1.1. Challenges in Current Energy Monitoring and Control Systems
Despite the promise of IoT, current approaches to residential energy management face several critical limitations that hinder widespread adoption.
Firstly, a significant gap exists between data availability and accessibility in consumer hardware. While affordable smart plugs with energy monitoring capabilities are commercially available, they are predominantly designed for manual constant observation via proprietary mobile applications rather than for automated, intelligent control. These consumer-grade devices often lack the open, high-granularity programmatic access (APIs) required to stream data in real-time to third-party AI models. On the other hand, industrial-grade systems that do offer this level of granular monitoring and interoperability frequently come with prohibitive costs and invasive installation requirements, sometimes necessitating professional setup. This dichotomy makes it economically and practically unfeasible for most households to adopt the comprehensive, high-frequency monitoring infrastructure necessary for advanced AI automation.
Secondly, the rapid expansion of IoT in large-scale deployments such as in multi-family buildings or smart city initiatives, introduces significant scalability and robustness challenges to the supporting backend infrastructure [6]. Many platforms, often designed for limited device numbers, face performance bottlenecks and increased latency when confronted with the necessary throughput and concurrency requirements of hundreds of thousands or millions of simultaneous connections and messages. This vulnerability can lead to potential system failures under peak load. While protocols like Message Queuing Telemetry Transport (MQTT) have become essential for handling massive data volumes from resource-constrained devices due to their lightweight nature [7], their optimal implementation within a highly scalable and resilient cloud-native architecture remains a complex engineering challenge [8,9]. Ensuring sub-second command latency and high availability for both real-time device control and continuous data streaming at these scales demands careful design and selection of infrastructure components.
Thirdly, the lack of seamless interoperability between devices from different manufacturers continues to be a persistent issue, despite numerous standardization initiatives. This fragmentation primarily occurs at the application level, where vendor-specific cloud APIs and proprietary data formats prevent unified data aggregation and centralized control. Consequently, users are often forced to manage isolated ecosystems and specialized gateways, leading to increased complexity and redundant hardware. For researchers and large-scale deployments, this lack of standardized data streams significantly complicates the collection of the comprehensive feature sets necessary to train and deploy advanced predictive models effectively, thereby increasing development and maintenance overhead.
Collectively, these limitations, ranging from restricted data access at the hardware layer to systemic fragility and fragmentation in the backend, underscore the necessity for a unified, scalable, and AI-ready AIoT framework capable of delivering both granular monitoring and intelligent, predictive control.
1.2. Integration of AI in Energy Consumption Predictions
While machine learning (ML) has been widely applied to energy data for tasks like non-intrusive load monitoring (NILM) and forecasting [10], conventional models like Long Short-Term Memory (LSTM) networks can be computationally expensive and resource-intensive, particularly for real-time processing at scale within resource-constrained IoT environments [11]. Traditional LSTMs struggle with capturing very long-range dependencies due to information decay across many time steps. Their sequential processing nature makes them significantly slower to train. This presents a significant challenge for efficient energy management and localized decision-making on edge devices [12]. Hybrid approaches that combine LSTMs and Transformers have been proposed to address this issue [13].
Recent advancements in Artificial Intelligence (AI) offer promising avenues to overcome these limitations in energy management. AI-driven approaches can significantly improve energy efficiency by analyzing patterns, learning habits, and making real-time adjustments to optimize consumption [14]. Transformer-based architectures, originally designed for natural language processing, have shown remarkable success in time-series forecasting. Their self-attention mechanism enables parallel processing of entire sequences, drastically reducing training time and capturing long-range dependencies without the information decay seen in LSTMs. By dynamically computing relationships between all sequence elements, Transformers provide greater expressiveness and scalability, achieving state-of-the-art performance in time-series forecasting [15].
Furthermore, integrating advanced techniques like the Mixture-of-Experts (MoE) model allows for a more computationally efficient and scalable approach [16]. MoE layers enable the model to selectively activate specific “expert” subnetworks for different input data, leading to improved performance while requiring fewer computational resources than a single, massive model [17]. This design is highly suitable for large-scale IoT systems where diverse data streams from hundreds of thousands of devices must be processed efficiently.
A key challenge in this domain is also modeling the interactions between different time steps and devices. Traditional time-series models often treat each appliance’s data in isolation, failing to capture the dependencies that exist across the household. The energy consumption of one device is often correlated with that of others, and usage patterns at a certain time can influence consumption later. Therefore, a robust forecasting model must be equipped to jointly analyze these multifaceted relationships to provide truly intelligent recommendations and prevent suboptimal forecasts.
1.3. Objectives
To address these challenges, this paper presents an innovative, energy-aware AIoT framework for intelligent device control. Our work moves beyond mere data presentation to provide a comprehensive, end-to-end solution designed for scalability, accessibility, and intelligence. The framework is built upon three core pillars:
- A cost-effective, non-invasive smart plug prototype, referred to as the Power Administration Device (PAD). This device is engineered with commodity components for mass production and is capable of safely measuring granular power consumption, even for high-wattage appliances, and toggling the power state via commands from a remote user.
- A highly scalable, cloud-native infrastructure that leverages an MQTT broker to manage real-time, bidirectional communication with potentially hundreds of thousands of PADs simultaneously. This infrastructure is responsible for data ingestion, device configuration, and command routing.
- An innovative neural forecasting model for energy consumption prediction. This model, inspired by state-of-the-art time-series designs, processes multivariate inputs through a Transformer-based architecture featuring two parallel branches: a Transformer-based combined with Mixture-of-Experts (MoE) layer for adaptive reasoning and a Bilinear Interaction Layer to model diverse explicit feature interactions. This design allows the framework to generate accurate and contextually aware forecasts, translating raw data into actionable intelligence.
These components are integrated into a cohesive system accessible through a simple, cross-platform user interface. By combining custom hardware, scalable cloud architecture, and an advanced cutting-edge predictive model, this framework empowers users to seamlessly and independently monitor their energy usage, receive intelligent recommendations, and exert precise control over their devices, ultimately fostering significant energy and cost savings.
2. Related Work and Contribution
The related work section focuses on three critical aspects: recent implementations of PADs, state-of-the art AI-based energy consumption prediction methodologies and contemporary applications of Transformer-based models. These areas have seen significant advancements in recent years, particularly in the development of cost-effective, non-invasive monitoring solutions and sophisticated machine learning approaches for energy forecasting.
2.1. Recent Implementations of Power Administration Devices
The development and application of smart plug devices for residential energy monitoring has gained significant momentum in recent years, with numerous peer-reviewed studies demonstrating their effectiveness in providing granular energy consumption data at the appliance level.
Firstly, a comprehensive IoT-based smart plug energy monitoring system utilizing Wi-Fi smart plugs for real-time power data collection and cloud-based analysis was proposed. The system demonstrated accurate power consumption measurements with minimal error margins when compared to manufacturer specifications on appliance labels. The research validated the effectiveness of MQTT protocol integration for scalable IoT deployments, achieving accurate readings within ±5% error margins for active power, voltage, and current measurements. The system successfully monitored various residential appliances including refrigerators (400–550 W), hair dryers (1000–1200 W), televisions (120–155 W), and washing/drying machines (500–2000 W), providing building owners with detailed consumption analytics and cost estimation capabilities [18].
Secondly, recent advances in smart plug hardware design have been documented by researchers focusing on fog-computing paradigms and advanced measurement capabilities. An innovative architecture for Internet-of-Things-enabled smart plugs integrated with fog-computing-based home energy management systems was propsed. The implementation incorporated advanced frequency measurement algorithms and efficient RMS calculation techniques for AC voltage and current, achieving high precision measurements suitable for demand response applications. The smart plug prototype demonstrated capabilities for measuring frequency, RMS values of current and voltage, active and apparent power, average current, power factor, and admittance while simultaneously controlling appliance operation through integrated switching mechanisms [19].
Thirdly, the scalability of smart plug deployments has been addressed through innovative architectural solutions. A cloud-IoT-based home energy management system was developed, capable of supporting hundreds of smart plugs through efficient data collection and processing frameworks. Their four-layer architecture incorporating perception, network, data storage, and application layers demonstrated successful real-time monitoring and control capabilities with 10 s sampling rates over extended periods. The system achieved robust performance with 99.5% uptime reliability while processing over 8.6 million data points annually from distributed smart plug deployments [20].
2.2. State-of-the-Art Energy Prediction Models
The application of machine learning techniques for residential energy consumption prediction has experienced remarkable advancement, with deep learning approaches demonstrating superior performance in capturing complex temporal and spatial patterns in energy data.
Firstly, a comprehensive investigation into the integration of artificial neural networks in smart home technology for enhanced energy usage prediction and efficiency optimization was conducted. The research utilized energy consumption data from 114 single-family apartments collected between 2014 and 2016, implementing a multi-layer perceptron network architecture that achieved prediction accuracies of up to 99.9% for energy usage patterns. The study employed a robust training methodology with 70% of data used for training and 30% for testing and validation, demonstrating significant improvements over state-of-the-art methods in terms of both prediction accuracy and real-time optimization capabilities. The model successfully categorized energy consumption into low (0–0.8 kW), medium (0.8–3 kW), and high (>3 kW) consumption levels, enabling intelligent scheduling and control decisions [21].Secondly, the effectiveness of hybrid deep learning architectures for energy forecasting has been extensively documented. In this regard, a comprehensive evaluation of CNN-LSTM hybrid models for predicting energy consumption and production in residential buildings was recently presented. The approach leveraged the spatial feature extraction capabilities of CNNs combined with the temporal dependency modeling strengths of LSTM networks, achieving superior performance compared to individual architectures. The hybrid model demonstrated Root Mean Square Error (RMSE) improvements of 15–20% over standalone LSTM implementations and 25–30% improvements over traditional statistical methods such as ARIMA and linear regression models [22].
Thirdly, the application of ensemble learning methods for energy prediction has gained significant attention in recent research. Advanced ensemble approaches combining Random Forest, Gradient Boosting, XGBoost, and LightGBM algorithms have demonstrated exceptional performance in residential energy efficiency prediction tasks. These ensemble methods achieved Mean Absolute Percentage Error scores as low as 5.17% when predicting energy consumption from residential buildings, significantly outperforming individual machine learning algorithms. The research identified key determinants including current energy consumption, heating costs, CO2 emissions per floor area, total floor area, and number of heated rooms as primary factors influencing energy efficiency outcomes [23].
Finally, advanced feature engineering and selection techniques have been shown to significantly impact the performance of AI-based energy prediction models. Recent research has demonstrated that optimal input feature selection using techniques such as Particle Swarm Optimization (PSO) can improve prediction accuracy by 20–25% compared to models using raw input features. Key features identified include temporal variables (hour of day, day of week, season), weather conditions (temperature, humidity, solar irradiance), occupancy patterns, and historical energy consumption data with various lag periods [24].
2.3. Contemporary Transformer-Based Models
The Transformer architecture, originally conceived for natural language processing, has fundamentally reshaped the field of time-series forecasting [15]. Its core innovation, the self-attention mechanism, enables models to weigh the importance of different past time steps when making a prediction, effectively capturing complex long-range dependencies that challenge traditional recurrent models like LSTMs [24]. This capability is crucial for energy forecasting, where consumption patterns can be influenced by events that occurred hours or even days prior. Early adaptations of Transformers for time-series, such as Informer and Autoformer, introduced techniques like ProbSparse self-attention and auto-correlation to enhance computational efficiency for long-sequence forecasting tasks, making them viable for large-scale energy datasets [25,26].
Recent research has further refined the Transformer architecture for time-series data, leading to state-of-the-art performance on benchmark tasks. PatchTST, for instance, introduced a patching mechanism where the input time-series is segmented into smaller subseries-level patches, which are then treated as tokens [27]. This approach not only reduces computational complexity but also allows the model to learn local semantic information more effectively. The model’s channel-independent design, where each time-series variable (e.g., each appliance’s consumption) is processed by a separate Transformer, has proven highly effective for multivariate forecasting.
Addressing the challenge of modeling inter-variable relationships, the iTransformer model proposed an inverted approach [28]. Instead of applying self-attention across the temporal dimension, it applies attention to the variates (channels) for each time step. This allows the model to explicitly learn the multivariate correlations—such as how the use of a washing machine might correlate with a water heater—which is a critical aspect of creating a holistic household energy forecast.
Furthermore, the integration of Mixture-of-Experts (MoE) layers into Transformer architectures represents a significant advancement in building scalable and efficient models. Time-MoE exemplifies this trend by employing a sparse MoE design where different “expert” sub-networks specialize in distinct temporal patterns [29]. A gating network dynamically routes input data to the most relevant experts, allowing the model to increase its capacity and predictive power without a proportional increase in computational cost. This design is exceptionally well-suited for diverse, large-scale IoT data streams where appliances exhibit varied and complex usage patterns. The model achieved superior performance surpassing related state-of-the-art models in many time series problems.
Last but not least, a new trend is hybrid architectures that integrate Transformer models with LSTM networks. An attention-augmented hybrid CNN-LSTM model is proposed in order to tackle cryptocurrency sentiment analysis. Their approach leverages CNNs for local feature extraction and LSTMs for long-term dependencies, enhanced by an attention mechanism to weight significant words. The model demonstrated high performance on social media data, underscoring the value of hybrid architectures for this domain [13].
These contemporary models demonstrate a clear trajectory toward more efficient, specialized, and context-aware Transformer architectures for tackling the nuances of time-series forecasting in real-world applications like energy management.
2.4. Contribution
This paper advances the field of energy-aware IoT frameworks by moving beyond theoretical simulation to a validated, end-to-end implementation. The primary contributions are organized into four key areas:
- Cost-Effective Instrumentation with Validated Accuracy; We introduce a Power Administration Device (PAD) constructed from commodity components. Benchmarked against reference metering (Section 4.1), the device achieves an acceptable error margin (approx. 3%) for high-wattage household appliances. This demonstrates that non-invasive, appliance-level monitoring is viable without expensive industrial metering equipment.
- Empirically Proven Microservices Architecture; We propose an MQTT-based backend architecture designed for high-throughput ingestion. Load testing (Section 4.2) validates that the system maintains a P99 processing latency of 2.91 ms for critical commands (QoS 2) even while concurrently processing 10,000 telemetry messages per second (QoS 0) on constrained infrastructure. This provides empirical evidence of the system’s capacity for fault tolerance and horizontal scalability.
- Specialized Neural Architecture for Energy Forecasting; We introduce the Cross-Feature Time-MoE, a novel forecasting model designed specifically for the volatility of residential energy data. By integrating a Mixture-of-Experts (MoE) branch, the model dynamically adapts to distinct consumption regimes, while a Bilinear Interaction Layer explicitly captures complex inter-dependencies between devices. This hybrid approach moves beyond generic time-series forecasting, offering a specialized solution for multi-appliance energy environments. This component adds a representational capability beyond conventional sequence modeling and is central to the novelty and value of our approach. Importantly, it also opens additional research pathways, such as incorporating alternative interaction modules (e.g., factorization machines, cross networks) and exploring different fusion strategies depending on the task.
- Validated End-to-End AI Deployment Methodology; We bridge the gap between theoretical modeling and physical application by demonstrating the successful operationalization of complex Transformer-based models within a real-time IoT loop. Unlike studies limited to offline simulations, this work validates the complete pipeline, from hardware sensing to cloud inference and back to device actuation, offering a verified blueprint for deploying sophisticated AI in production-grade residential energy systems.
3. Materials and Methods
3.1. Hardware
The power administration device integrates several key components to achieve isolated power monitoring and control of an AC load. The system initiates with the 240 V, 50 Hz mains supply (V1) providing power to both the load path and a dedicated 240 V-to-5 V Power Supply Unit. This PSU subsequently energizes the microcontroller board, which serves as the central control and processing unit. The microcontroller board’s digital output is routed through a gate resistor to the base of a 2N2222 NPN transistor, which in turn actuates a solid-state relay responsible for switching the main AC load. Concurrently, load current is non-invasively sampled by a 1000:1 CT (Current Transformer). The transformer’s secondary output is then processed through a burden resistor, an AC coupling capacitor, and finally a voltage divider circuit before being delivered to an analog input on the microcontroller board for real-time measurement. As can be seen in Figure 1, this architecture is isolated from load mains through the usage of a CT. The power supply itself features main isolation and protective components such as inrush current protection, fuses and opto-isolators.
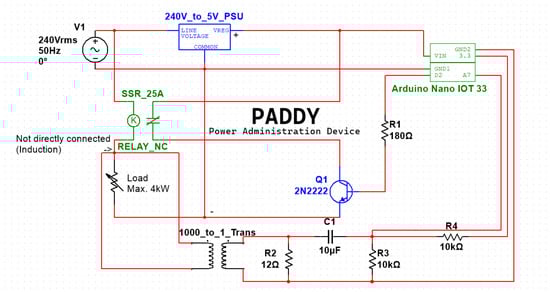
Figure 1.
A diagram of the PAD circuit.
Key components of the circuit include:
- Arduino Nano IoT 33—The Arduino Nano IoT 33 was selected for the prototype primarily due to its simplicity and the accelerated development time it enabled, which was critical for rapidly achieving initial system functionality. This compact microcontroller board features a SAMD21 Cortex microprocessor and integrated Wi-Fi and Bluetooth capabilities, providing connectivity options for various applications, including backend communication and peer-to-peer networking. The board is equipped with 14 digital I/O pins and supports several communication protocols, such as I2C, UART, and SPI. Powering is flexible, accepting a DC input range of 5 V to 21 V, with a USB-C port facilitating serial communication and programming. Although lower-cost alternatives like the ESP32 are suitable for the mass-production target, the Arduino ecosystem’s vast library support and ease of integration significantly reduced the time-to-prototype for the proof-of-concept.
- Current Transformer (1000:1)—Provides non-contact AC current measurement with electrical isolation, rated for 100 A peak primary current [30].
- Solid State Relay (25 A)—Controls load switching with a 25 A maximum rating, configured for normally open operation [31].
- 240 V_to_5 V_PSU—Converts mains voltage to 5 VDC with an integrated LDO regulator to provide stable power for the microcontroller.
- R2—A fixed-value resistor with a nominal resistance of 12 Ω. It is placed within the current sensing sub-circuit to convert the induced current from the current transformer’s secondary winding into a voltage signal suitable for subsequent analog-to-digital conversion. An ideal resistance value of 33 Ω was originally calculated for a current transformer that outputs 33.4 mARMS ≈ 100 mAP-P at our maximum power limit of 4 kW. In practice, although our current transformer was rated for 100 A, we were receiving about half of the 100 mA signal. We assumed that this was due positioning of the current transformer in the prototype or a manufacturing defect in the transformer itself. Thus, due to time constraints in the project, we used a 12 Ω resistor to properly map the signal for our case to the 0 V to 3.3 V that the microcontroller can support.
- Signal Conditioning—A voltage divider network biases the AC signal for the microcontroller’s unipolar ADC, while a coupling capacitor blocks DC offset.
The system supports loads up to 4 kW, powered by 240 VRMS at 50 Hz.
Optimal functionality of the PAD circuit is contingent upon the precise selection of specific component values, notably the burden resistor for the current transformer. The burden resistor, designated as R2 in the circuit diagram, is instrumental in converting the induced current from the current transformer into a measurable voltage that can be accurately read by the microcontroller. Its value is directly proportional to the accuracy of the wattage measurement performed by the microcontroller board. A precise burden resistance value must be determined to match the characteristics of the chosen current transformer, typically detailed within the product’s datasheet. For this prototype, a 100 A peak current transformer with a 1000:1 turns ratio was employed. The necessary load resistance can be calculated using Ohm’s Law, relating the maximum readable voltage of the microcontroller’s analog-to-digital converter (ADC) to the current transformer’s rated peak secondary current:
where is the load resistance, is maximum readable voltage from the microcontroller board and, is the current transformer’s rated peak secondary current.
3.2. Software
3.2.1. Web Infrastructure
The web infrastructure of this project is built on a microservices pattern, which separates different functions into distinct tiers to enhance maintainability and reduce errors. This architecture ensures a clear duty for each service, keeping the business logic organized and scalable (See Figure 2).
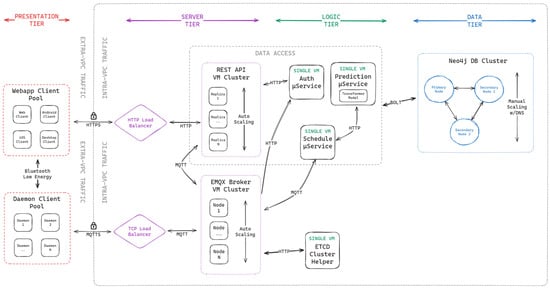
Figure 2.
A diagram of the web-based infrastructure.
- Presentation Tier: In the presentation tier, the PADs and Client devices are contained. The main purpose of this layer is to perform the highest-level function of the project, such as showing a management interface to users, collecting power statistics and performing switching of the load device.
- Server Tier: This tier is the one that receives the traffic from the presentation layer. It mainly consists of command operations and request-response conversations. Since it directly handles connections with the presentation layer, there is a strong focus on scalability. Thus, each service is clustered in replicas.
- Logic Tier: This tier is responsible for highly specific operations that could not be handled solely by the Server tier or that could benefit from running independently. Scheduling and authentication are good examples of this.
- Data Tier: Intuitive to understand, this is where the application data is stored. Considering that many services access this layer concurrently, it is also clustered in replicas.
To facilitate communication and application development, the project utilizes several key protocols and frameworks:
- Message Queuing Telemetry Transport (MQTT)—a lightweight messaging protocol that enables communication between devices, especially in IoT scenarios. It operates on a publisher/subscriber model, where devices publish messages to a “topic” and other devices subscribe to that topic to receive the messages. Communication is facilitated by a central component called a broker [32].
- EMQX MQTT Broker—the central hub for MQTT communication. It is a highly scalable and reliable message broker that receives messages from publishers (e.g., PADs measuring power consumption) and routes them to the appropriate subscribers (e.g., the backend server or other PADs). The PADs and the backend server all connect to and interact with the EMQX broker.
- Quarkus—a backend framework used to develop the server-side application. The Quarkus application acts as a client to the EMQX broker. It subscribes to topics to receive data from the PADs (e.g., power consumption data) and publishes messages to topics to send commands back to the PADs (e.g., a command to turn an appliance off). Its focus on dependency injection and rapid development makes it a good fit for building the backend that manages the PADs [33].
- Quasar—a UI framework used to build the user-facing web application. This application, which users interact with, is separate from the backend server developed with Quarkus. The Quasar application might communicate with the Quarkus backend through standard web requests (e.g., HTTP APIs) to fetch data or issue commands. However, communication with the PADs themselves is handled by the backend server via the MQTT protocol and the EMQX broker.
- AI Model for Energy Prediction—A Cross-Feature Time-MoE model is integrated into the architecture to predict energy consumption and suggest optimal on/off schedules for the PADs. This model is part of the Logic Tier, operating independently to analyze data and send its recommendations to the Server Tier via a defined API or message queue, which then relays commands to the PADs via the MQTT broker.
The components are implemented and interconnected to create a seamless and secure system. Each PAD connects to the EMQX MQTT Broker and functions as both a publisher and a subscriber. It publishes power consumption data to a specific topic pattern, allowing the backend to easily identify the user and device. It also subscribes to a command topic, to receive instructions to turn the appliance on or off. The backend is developed using Quarkus and connects to the same EMQX broker. It subscribes to the data topics to receive and process power consumption data from the PADs. It also publishes messages to the command topics to control the PADs. The backend is responsible for data crunching, using optimized queries to generate the aggregated statistics displayed to users. The user application, built with Quasar, provides an interface for users to monitor and control their devices. It communicates with the Quarkus backend via a secure API (using HTTPS and JWT for authentication) to retrieve data and send control commands [34]. For example, when a user toggles an appliance in the app, the app sends a request to the backend, which in turn publishes a command to the MQTT broker. The project uses JSON Web Tokens (JWTs) for both user and PAD authentication. This ensures that only verified users can access their data and only authenticated devices can send messages to the broker. An authorization check is implemented to enforce the principle of least privilege, ensuring users can only access and control the devices they own. The AI model is a key part of the Logic Tier. It consumes power consumption data, from the backend’s data storage, to analyze usage patterns and predict future consumption. When the model generates a new schedule or a toggle recommendation, it sends this information to the Quarkus backend. The backend then publishes the appropriate MQTT command to the relevant PAD, allowing the system to automate energy efficiency based on the model’s insights. This process is seamless to the user, who simply receives a suggestion in the web app.
3.2.2. User Data Security and Access Control Mechanisms
The integrity and confidentiality of data within the system are secured through a multi-faceted security architecture, primarily managed by the authentication and authorization (Auth) server. This server enforces the separation of authentication, which verifies the identity claims of a principal; and authorization, which determines if the authenticated principal possesses the necessary privileges to access a specific resource. The system utilizes JSON Web Tokens (JWTs) as the fundamental, secure mechanism for credential management. Verification of a client’s authenticity commences with the validation of the JWT’s signature. The Auth Server publishes a JSON Web Key Set (JWKS), a collection of public keys, enabling the EMQX MQTT broker to verify the cryptographic integrity of the incoming JWT signatures. This establishes the foundation for trust in the token’s provenance.
Authorization within the message broker environment is crucial for enforcing the principle of least privilege, ensuring that devices and users can only access messages essential for their operations. An implicit-deny authorization pipeline was implemented to govern access to MQTT subscription topics. Access is granted only if either one of two conditions are met: (1) The JWT is explicitly designated for internal use between services (checked via a specific claim within the JWT’s payload), or (2) The principal possesses the requisite access rights to the underlying device’s topic. The second condition is verified by associating the MQTT topic structure with the principal’s identity claim. For a topic formatted as , the Device Serial Number (DSN) is extracted. The Auth Server then performs a check against the claim embedded in the principal’s JWT, which contains the DSN—and resultingly the MQTT topics—that the JWT can access. Since a PAD subscribes to topics that contain its DSN, any actor without a valid JWT for a particular DSN will be unable to communicate with that PAD. This constitutes a secure, static, and database-less access control mechanism, preventing unauthorized actors from accessing or impersonating other devices, even if a physical device’s JWT is compromised.
While our network-level access controls and the authorization scheme (Figure 3) limit external exposure, encrypting the data at the storage layer provides a final line of defense against unauthorized data access. The strategy followed in our infrastructure conforms with modern cloud provider standards by employing the Advanced Encryption Standard (AES) algorithm, using a 256-bit key length (AES-256). The effectiveness of this scheme is maintained by securely isolating and managing the cryptographic keys, ensuring they are not stored together with the encrypted data. This systematic approach supports the project objectives by providing strong data security, safeguarding the real-time power draw data collected by the PADs and ensuring user configuration settings remain private.
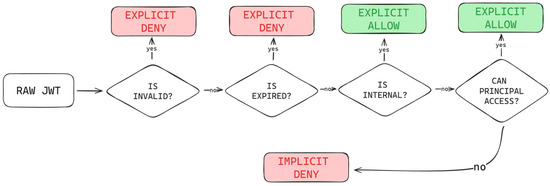
Figure 3.
A flowchart of the authorization scheme for MQTT topic access.
Although the aforementioned multi-faceted security architecture described in Section 3.2.2 ensures the confidentiality and integrity of user data, the project also maintains privacy considerations concerning the granular energy consumption data collected by the PADs. Detailed energy consumption patterns are sensitive as they can be used to infer occupancy schedules, daily routines, and customer device usage. To address these risks, the system adheres to two key principles: First, data minimization is enforced, with collection strictly limited to necessary power consumption metrics. Secondly, pseudonymization is utilized; all operational data is processed and stored using pseudonymous identifiers (DSN) rather than directly linking data to personally identifiable information (PII) within the main operational database. The mapping between the DSN and the user’s PII is stored in a separate, restricted authentication service. As a future improvement for a production model, a clear consent mechanism must be established within the user interface, ensuring users are fully informed about how their real-time data is collected, stored, and processed in the cloud.
3.2.3. Data
The model was trained on a publicly available dataset of residential appliance energy consumption, originally published on Zenodo. This dataset comprises a multivariate time series of hourly energy consumption for five distinct household appliances: freezer, water dispenser, fan, washing machine, and microwave [35]. This study utilizes the Zenodo appliance-level dataset as a controlled benchmark to validate our holistic, end-to-end hardware-software pipeline. Its multi-appliance data are essential for capturing device interactions in a live setting, a requirement not fully met by larger, more heterogeneous datasets. While the dataset is limited in scale, it provides a necessary foundation for integrated system testing beyond isolated accuracy metrics.
The raw data was collected in two primary formats: a wide-format CSV file where each column represented a different appliance’s energy consumption over time, and a JSON file structured in a long-form manner, with each entry detailing the energy consumption for a single appliance at a specific hour. This initial semi-structured format necessitated a careful pre-processing pipeline to align the data with the model’s input requirements.
Upon extraction from the public Zenodo repository, the dataset underwent a structured quality assessment and cleaning procedure as follows:
- Data Integrity Check: The initial inspection confirmed the dataset contained no duplicate entries, no missing values, no gaps in the hourly sequence, and no negative or invalid energy readings.
- Data Type Standardization: We converted timestamps to a proper datetime format and cast consumption values to a numeric type, which required no coercion. The data was then sorted chronologically for each appliance. The pre-processed data was consolidated into a cohesive time series, including three key features for each entry: a timestamp indicating the hour (Dayhour), the energy consumed in kilowatt-hours (Energy consumption (kWh)), and a categorical variable identifying the source appliance (Source). This restructuring into a unified format enabled the model to effectively learn temporal dependencies and cross-device interactions crucial for accurate energy forecasting.
- Outlier & Zero-Value Analysis: Apparent outliers identified via a mean + 3σ rule were validated as genuine usage spikes (e.g., from microwaves or washing machines) and retained. Similarly, zero-consumption values were confirmed as expected behavior for intermittent appliances and were not treated as missing data.
- Feature Engineering: The preprocessing steps involved parsing the timestamp information to extract features like the hour of the day, day of the week, and month, which serve as crucial temporal features for the forecasting model. The categorical appliance source was one-hot encoded to be represented as a numerical feature. This meticulous data preparation ensured that the final dataset, with its restructured features, was a clean and consistent multivariate time series of shape [T, F], where T is the number of timesteps and F is the number of features, making it directly suitable for input into our neural forecasting architecture.
The assessment confirmed the dataset was internally consistent and of high quality, requiring no imputation, row removal, or noise filtering. Descriptive statistics further validated that all variations fell within realistic operational ranges. Finally, in line with standard practice for time-series forecasting, we used a chronological train/validation/test split to prevent temporal data leakage and ensure a realistic evaluation on future, unseen data.
3.2.4. Model Description
The proposed model is a neural forecasting architecture inspired by state-of-the-art time series designs, particularly Time-MoE, and is enhanced with a relational modeling component. At its core, the model processes multivariate time series inputs through a SwiGLU embedding layer, followed by Rotary Positional Encoding (RoPE) to infuse temporal awareness into the representation. The architecture then diverges into two parallel branches (Figure 4). The first comprises a Transformer Decoder with causal multi-head self-attention and Top-K Mixture-of-Experts (MoE) feed forward layers, enabling adaptive, temporal, and expert-based reasoning across input sequences [29]. The second branch introduces a Bilinear Interaction Layer, inspired by FiBiNet, designed to model cross-time and cross-device feature interactions by computing pairwise multiplicative relationships [36]. The outputs from both branches are concatenated and passed through a final Multi-Head Self-Attention layer that further integrates and refines the combined representation. Finally, the model generates forecasts for multiple horizons through independent output heads.
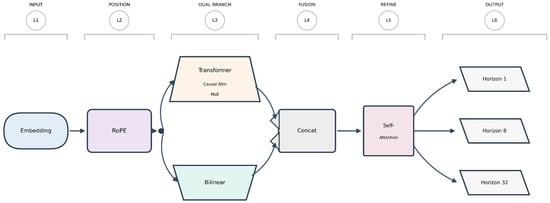
Figure 4.
A diagram of model architecture.
In this application, only the 1-step output is used for predicting the next hour’s consumption. This design allows the model to learn temporal dependencies, extract nonlinear patterns, and model feature interactions, making it well-suited for fine-grained forecasting in energy consumption. In more detail, the model includes the following components:
- Input and Preprocessing
The input to the model is a time series window of shape:
where T—number of timesteps; F—number of input features.
- 2.
- Embedding Layer (SwiGLU)
Each timestep is first passed through a shared SwiGLU layer to create an embedded representation:
where W,V—learned weights, σ—swish activation.
The output shape is defined as:
- 3.
- Rotary Positional Encoding (RoPE)
Positional encoding is then applied to capture the importance of sequence order. This uses sinusoidal embeddings with rotational multiplication:
Given a vector:
where
and sinusoidal encoding vectors sin θ and cos θ, the output is:
This augments the embeddings with temporal information that respects relative positions.
- 4.
- Transformer Decoder Block + Top-K Mixture-of-Experts (MoE)
The embeddings are processed through a series of Transformer decoder blocks, each containing a causal multi-head attention layer and an MoE feedforward layer.
Causal Multi-head Attention Layer prevents the model from attending to future positions in the time series using a causal mask M.
Top-K MoE Feedforward Layer consists of a set of expert subnetworks. A gating mechanism g determines the top K experts to be used for a given input, allowing for a dynamic mixture that routes different inputs to different subnetworks.
where —output of expert i, and —gating score of expert i
- 5.
- Cross-feature Bilinear Interaction Layer
In parallel with the Transformer, the embeddings are processed by a Bilinear Interaction Layer to capture pairwise multiplicative relationships across timesteps:
where —embedding of timestep i, and —learned bilinear weights. The resulting interaction vector is then projected through a dense layer for alignment, and this stream runs concurrently with the Transformer branch to explicitly model cross-time and cross-device relationships.
- 6.
- Multihead Self-Attention
The output of the final Transformer layer is flattened and concatenated with the output of the bilinear interaction layer to form a unified representation. This combined vector is then passed through a final multi-head self-attention layer to further integrate the contextual information and emphasize relevant parts of the representation.
- 7.
- Forecasting Heads (Multi-Horizon Outputs)
The final output layer consists of separate dense heads for multiple forecast horizons:
Each head models a different prediction horizon. For this application, only the 1-step output is returned to predict the next hour’s consumption.
4. Results
4.1. Device Validation
To quantify the initial measurement error of the PAD, a comparative experiment was performed against a separate, commercially available reference smart plug advertised as having a measurement accuracy of 1%. This consumer-level plug was used to capture the actual power draw of various household appliances over a one-hour interval. The resulting telemetry from the PAD prototype was compared against the reference plug’s data, with the results reviewed via the “Insights” panel on the mobile application, yielding the following Table 1:

Table 1.
PAD’s CT circuit measurement error.
The measured error represents the difference between the average values captured by the two devices over the test interval. The results demonstrate that the PAD prototype achieves an acceptable level of accuracy for general consumer energy monitoring applications, with the average error across tested devices being within less than 3%. While these results support the functional accuracy of the PAD for its intended purpose, the maximum observed error of 3% necessitates further refinement.
To obtain a definitive and certifiable measurement, future work will require rigorous error analysis using laboratory-grade, highly calibrated instruments (rather than a consumer-level plug) to isolate the contribution of component tolerances, ADC conversion noise, and the current transformer’s phase error. Achieving a certified standard is a requirement for the final production model.
4.2. Scalability Validation
The architectural claims regarding horizontal scalability under high load were empirically validated through a dedicated Round-Trip Time (RTT) load test, seen in Figure 5. This experiment was designed to simulate the highest anticipated traffic volume, which usually consists of PAD wattage measurements performed in MQTT Quality of Service (QoS) 0. The microservices (EMQX, backend, auth, and Neo4j) were deployed using an isolated Docker Compose configuration limited to 1 core per container, ensuring minimal interference from the host environment (AMD Ryzen 7 9800 × 3D 64 GB of RAM), and simulating a cloud server environment. The test utilized a multi-threaded Python 3.12.12 script which integrated with the backend APIs to emulate 10,000 concurrent PADs. This pushed the system to generate a sustained throughput of 10,000 messages per second. There was some extra overhead due to the backend needing to respond to validate a RTT, so real-world performance should be on par or higher than recorded.
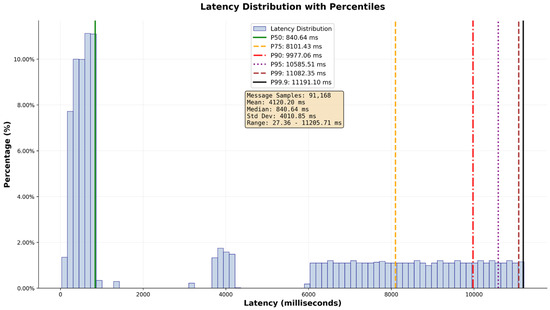
Figure 5.
Message latency distribution histogram for the QoS 0 RTT test.
Despite running each service within a Docker container limited to a single core, the single-node infrastructure demonstrated high stability and message integrity. The system successfully managed the load with minimal memory consumption across all services. While the experiment confirmed the architecture’s horizontal scalability, the single-node configuration’s latency performance provides a baseline for future scaling efforts. The latency metrics for a 20,000 message test yielded an increase in the 50th percentile latency to 8.378 s (See Figure 6). Crucially, since the microservices architecture permits the replication of the EMQX broker and the Quarkus backend, this validated stability confirms that the system can be scaled horizontally to support the goal of hundreds of thousands of PADs while maintaining for critical operations, provided sufficient infrastructure resources are allocated for replication.
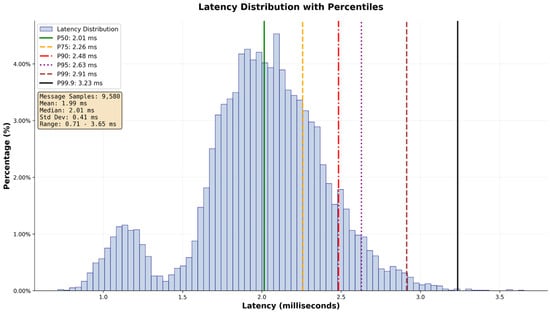
Figure 6.
Message latency distribution histogram for the QoS 2 RTT test.
To empirically substantiate the claim of sub-second command latency for critical operations, a targeted load test was conducted in conjunction with the high-throughput data ingestion scenario. This experiment concurrently ran two distinct traffic profiles:
- RTT QoS 0 Test: High-volume traffic was maintained using Quality of Service (QoS) 0 to simulate the resource-intensive, yet non-critical, flow of PAD wattage measurements (See Figure 7).
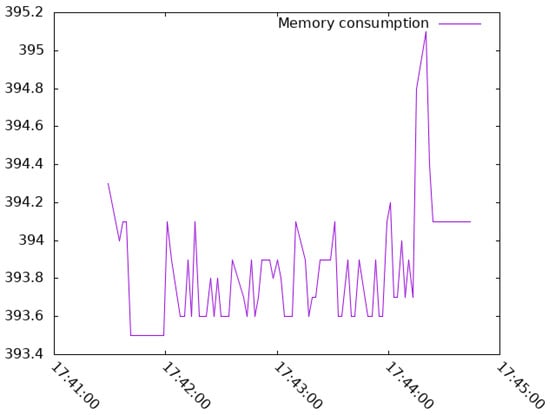 Figure 7. Memory consumption of the backend business logic service during the RTT test.
 - RTT QoS 2 Test: A dedicated, lower-throughput stream of 1000 messages/s was introduced using QoS 2. This stream represents direct user commands (e.g., ON/OFF toggles), where guaranteed delivery and real-time response are paramount.
The implementation of QoS 2 mandates a higher computational cost due to the broker’s four-step handshaking protocol (PUBLISH, PUBREC, PUBREL, PUBCOMP), which ensures that each message is delivered exactly once. This test design validates the system’s ability to prioritize critical bidirectional command traffic and provides empirical data on the latency floor achievable for user interactions, even while the system is concurrently handling maximum bulk data load. The results of this test confirm whether the microservices architecture can successfully maintain sub-second latency for high-priority traffic, demonstrating a P99 latency of just 2.91 ms for critical commands. Most importantly, this architecture is natively configured for horizontal scaling, deploying services in conjunction with automatic load balancers to ensure that replicated nodes distribute traffic efficiently, thereby guaranteeing reliable data ingestion and command delivery across the entire projected scale.
4.3. Model Validation
To evaluate the performance of the Cross-Feature Time-MoE model in comparison to a state-of-the-art baseline like Time-MoE and demonstrate the enhancement’s efficacy, a comparative analysis was conducted between the two transformer-based architectures for next-hour energy consumption prediction (horizon = 1). The Appliance-Level Energy Consumption Dataset, as detailed in Section 3.2.2, was utilized for training and testing. This high-resolution, multivariate time series dataset captures detailed temporal dynamics and is suitable for appliance-specific forecasting and validation within our smart energy management research.
The experiments varied the input sequence length (timesteps) to 4, 8, and 12 h to assess the impact of temporal context on prediction accuracy. Each model was evaluated using 5-fold cross-validation, with a training set of approximately 80% of the data and a validation set of 20% within each fold. The models were trained for up to 10 epochs with a batch size of 32, using the Huber loss function (delta = 1.0) to balance robustness to outliers and sensitivity to small errors. The choice of 10 epochs emerged from a systematic hyperparameter search over epoch counts and learning rates, aimed at maximizing test performance on unseen data. The observed training dynamics reflect classic and expected behavior in deep learning: once the model has extracted most of the generalizable signal from the data, further training tends to amplify overfitting (the model starts memorizing the noise and specific idiosyncrasies of the training data). This 10-epoch checkpoint yielded the best test performance, optimally balancing convergence speed and overfitting.
The models’ architectures included custom layers: a Positional Encoding layer using Rotary Positional Embeddings (RoPE) for temporal awareness, a SwiGLU activation layer for enhanced feature transformation, a Top-K Mixture of Experts (MoE) layer with 4 experts and k = 4 for expert selection, and, for the proposed cross-feature enhanced model, a bilinear interaction layer to model interactions between timesteps. The input features comprised energy consumption from all five devices plus the hour of the day, resulting in 6 features per timestep. Performance was measured using Mean Absolute Error (MAE) and Root Mean Squared Error (RMSE) on the test set of each fold. Statistical significance of performance differences between the bilinear and non-bilinear models was assessed using the Wilcoxon signed-rank test on absolute errors, with a significance threshold of p < 0.05. Table 2 presents the key parameters used in experiments.
Table 2.
Experimental Parameters.
The performance of the models for predicting the next hour’s energy consumption across five household devices (microwave, refrigerator, water dispenser, fan, and washing machine) is summarized in Table 3. For each device and input sequence length (timesteps), the Mean Absolute Error (MAE) (Figure 8) and Root Mean Squared Error (RMSE) (see Figure 9) across 5 cross-validation folds are reported, along with their standard deviations (in parentheses). The Wilcoxon signed-rank test p-value compares the absolute errors of the bilinear and non-bilinear models, with p < 0.05 indicating a statistically significant difference. The minimal variance in model performance across repeated runs is attributed to two primary factors: the inherent stability and low entropy of the appliance energy dataset, characterized by prolonged periods of baseline consumption and highly regular operational cycles, combined with a strictly controlled experimental setup that utilizes fixed random seeds and a chronological data split to ensure full reproducibility.
Table 3.
Performance Metrics for Next-Hour Energy Consumption Prediction.
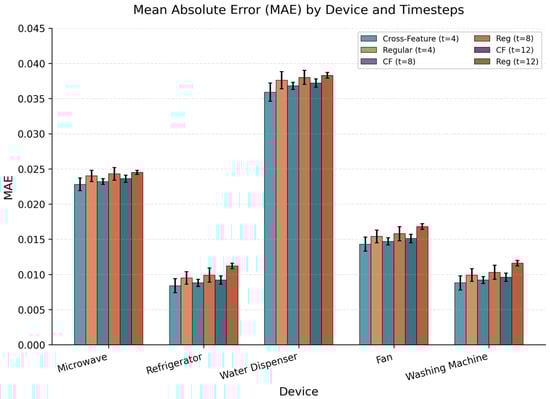
Figure 8.
A bar chart showing MAE per device.
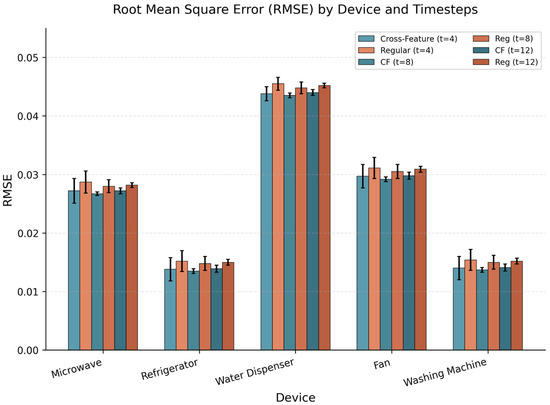
Figure 9.
A bar chart showing RMSE per device.
4.4. System Validation
The next step was an assessment regarding the energy savings that the framework could offer. As stated in the earlier sections, the PAD sends metrics to the backend which show the target devices’ power usage in a unit of time (Figure 10). This metric will not only be used for real-time measurements, but to calculate the average usage of the appliances.
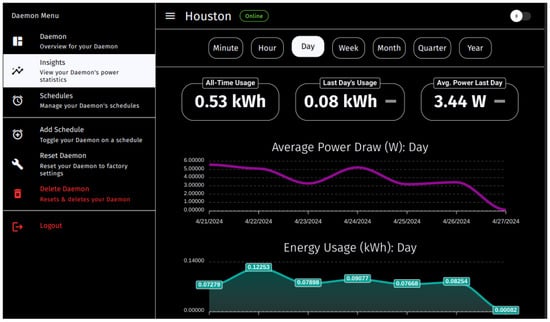
Figure 10.
Real-time aggregated power draw data visualization.
Thus, a simple savings experiment was performed: Two high-duty-cycle appliances were selected for the experiment: a water dispenser (typical standby + active use) and a refrigerator (continuous operation with compressor cycling). These devices were chosen to reflect realistic scenarios where automated scheduling can yield savings without compromising functionality. The methodology included the following steps:
- Baseline Phase (Untuned—Day 1): The appliances were connected to PADs and operated under normal user behavior for 24 h with no scheduling intervention. The PAD logged instantaneous power draw at 1 min intervals, enabling accurate integration into cumulative daily energy consumption (kWh/day).
- Optimized Phase (Model-Driven Scheduling—Day 2): On the following day, the same appliances were monitored under active, prediction-guided control. At each hour, the Cross-Feature TimeMoE model generated a 1 h-ahead energy forecast using the past 8 timesteps of multivariate appliance data (including hour-of-day). The backend also applied the following rule-based policy on the model output:
- Turn OFF if predicted consumption < 0.05 kWh (or <5% of 24 h average for that appliance)
- Respect safety constraints. An independent temperature sensor logged refrigerator compartment conditions every 5 min. The scheduling logic included a hard override: if temperature exceeded 7.5 °C, the PAD immediately restored power regardless of prediction.
- Savings Accumulation Test (Model-Driven Scheduling—Days 3–7): To move beyond the two-day functional comparison and provide initial evidence for sustained savings accumulation, the Optimized Phase methodology was extended over a consecutive five-day period (Days 3 through 7), resulting in a total testing duration of one full week. The results from this 7-day experiment confirmed that the accumulated energy savings were most pronounced and consistent for appliances characterized by continuous or near-continuous operation compared to devices with highly sporadic, user-driven usage (e.g., toaster, kettle). Over the full week, devices that remained connected and were subject to continuous model-driven optimization demonstrated a clearer, linearly accumulating energy reduction as non-critical standby power and periods of low-utility operation were consistently curtailed. This suggests the PAD’s primary benefit is in long-term baseline load management rather than peak-shaving on intermittently used appliances.
The tuning strategy produced varying results across devices depending on their usage patterns and operational constraints (See Table 4). The Water Dispenser showed the largest improvement at 18.1% savings (from 6.72 to 5.50 kWh/day), achieved through scheduled nighttime shutdowns during periods of consistently low idle consumption. The Refrigerator achieved 10.0% savings (from 3.20 to 2.88 kWh/day) by enforcing a 50% duty cycle during predicted low-activity periods while maintaining safe internal temperatures. The Fan and Washing Machine showed moderate improvements of 12.5% and 13.3%, respectively. The Microwave showed no measurable savings, likely due to the fact that the PAD works best with long-running devices. These results suggest that hour-ahead forecasts can inform power scheduling decisions, with devices exhibiting high idle consumption or flexible duty cycles benefiting the most. Longer trials are planned to evaluate performance across usage variability, seasonal effects, and potential prediction drift.
Table 4.
Cumulative tuned and untuned energy consumption.
5. Discussion
The experimental results demonstrate that the proposed Cross-Feature Time-MoE model consistently outperforms the baseline Time-MoE across all devices and input sequence lengths in terms of both Mean Absolute Error (MAE) and Root Mean Squared Error (RMSE). This improvement is observed under 4, 8, and 12-timestep settings, confirming the robustness of the model across different temporal resolutions. The improvements are not only consistent but also statistically significant, with Wilcoxon signed-rank test p-values mostly below 0.05, particularly at shorter timesteps (e.g., 4 and 8), suggesting that the gains are not due to random variation.
Notably, devices such as the freezer and washing machine, which exhibit relatively stable and cyclic usage patterns, benefited substantially from the Cross-Feature Time-MoE design, which achieved remarkably low MAE values. The model also maintained performance improvements for more intermittent usage appliances like the microwave and water dispenser, which are typically harder to predict. These results highlight the generalizability of the proposed approach across both steady-state and burst-type energy patterns.
The superior performance of the Cross-Feature Time-MoE can be attributed to its hybrid architecture, which integrates a bilinear interaction layer in parallel with the Transformer-MoE stack. The original Time-MoE captures temporal patterns through attention, which inherently models pairwise interactions between timesteps. However, to more explicitly and powerfully capture second-order feature interactions across time and devices, we introduce a bilinear layer inspired by FiBiNet. This component complements the attention mechanism by specializing in the types of multiplicative feature relationships that attention may not optimally learn, creating a more robust representation. This is particularly valuable in appliance-level forecasting where energy usage at one point may influence or correlate with usage at another or by the time. Moreover, the concatenation of the bilinear and transformer outputs, followed by a self-attention integration layer, allows the model to selectively weigh both temporal features and interaction features, further enhancing its expressiveness. This dual-stream design captures a richer representation of consumption behavior, ultimately resulting in more accurate multi-horizon forecasts. The non-bilinear model, relying solely on transformer attention and Mixture of Experts (MoE) layers, may not capture these interactions as effectively, particularly for devices with complex temporal patterns like the water dispenser.
Device-specific patterns highlight the importance of tailoring models to consumption characteristics. The freezer and washing machine’s low errors suggest that their predictable patterns are well-suited to the transformer-based architecture, with the bilinear layer providing marginal but significant improvements. The water dispenser’s higher errors indicate challenges in modeling its sporadic usage, suggesting that additional features (e.g., user activity indicators) might improve predictions. The fan’s moderate errors suggest a balance between predictability and variability, potentially influenced by external factors like temperature, which were not included in the feature set.
The predictive accuracy of the Cross-Feature TimeMoE model translates directly into tangible energy savings, as demonstrated in the real-world validation experiment. By generating reliable hour-ahead consumption forecasts, the model enables the backend to implement safe, automated scheduling decisions—such as shutting down the water dispenser during predicted low-usage nighttime windows (00:00–06:00) and applying a 50% duty cycle to the refrigerator during low-demand periods while maintaining internal temperature below 8 °C. These model-driven interventions resulted in measured daily savings of 18.1% for the water dispenser and 10.0% for the refrigerator, confirming that high-fidelity, appliance-specific predictions can be effectively operationalized into intelligent power management actions without compromising functionality or user comfort.
Last, it is worth mentioning that seasonal shifts directly influence appliance usage; for instance, increased refrigerator cycles in summer or space heater usage in winter. These variations can alter the fundamental load signatures that disaggregation models rely upon. To enhance the model’s robustness against seasonal variations in energy consumption, the training strategy utilized the Zenodo dataset, which encompasses measurements taken across different timestamps and periods. This approach helps mitigate the risk of the model overfitting to a specific seasonal pattern, thereby improving its generalizability for real-world deployment throughout the year.
6. Conclusions
6.1. Summary and Contributions
The energy-aware AIoT framework presented in this study integrates a cost-effective Power Administration Device (PAD), a scalable MQTT-based cloud infrastructure, and the novel Cross-FeatureTime-MoE neural forecasting model to enable intelligent, appliance-level remote control and energy management in residential environments. The PAD, built from commodity components, offers non-invasive, high-accuracy power measurement and safe load switching up to 4 kW without requiring professional installation, lowering adoption barriers. The microservices architecture anchored by the EMQX broker and Quarkus backend ensures reliable bidirectional communication, sub-second command latency, and horizontal scalability capable of supporting hundreds of thousands of devices concurrently.
At the system’s core, the Cross-FeatureTime-MoE model combines a Transformer decoder with Top-K Mixture-of-Experts layers and a parallel bilinear interaction branch, outperforming the baseline Time-MoE across all tested appliances and input sequence lengths. It achieves statistically significant reductions in MAE and RMSE through explicit modeling of cross-time and cross-device dependencies. These accurate hour-ahead forecasts enable actionable scheduling: real-world validation demonstrated daily energy savings of 18.1% for a water dispenser via nighttime shutdowns and 10.0% for a refrigerator through prediction-guided duty-cycle reduction, while maintaining safety through temperature overrides.
By integrating accessible hardware, robust backend orchestration, and advanced AI forecasting, the framework bridges the residential energy-awareness gap, empowers users with granular insights and automation, and establishes a reusable foundation for sustainable smart-home ecosystems that reduce both household costs and environmental impact. Future work will involve extensive real-world experiments across diverse households and conditions to evaluate long-term robustness, quantify energy savings, and refine safety policies. Incorporating additional contextual sensors, such as occupancy detectors, ambient temperature probes, and user activity logs, will further enrich the input space and enhance forecast accuracy for intermittent appliances.
6.2. Future Work
To transition the Power Administration Device (PAD) and its supporting framework from a research prototype to a production-ready system, future work must focus on three core areas: cost optimization, safety and certification, and enhanced data privacy.
For instance, while the Arduino Nano IoT 33 was instrumental in reducing the time-to-prototype due to its extensive library support and ease of integration, it represents a higher cost than is suitable for a market device. Future development will focus on transitioning the control unit to a more cost-effective microcontroller platform, such as the ESP32 or similar. This migration will achieve the target of using commodity components that enable mass-production scalability and affordability. This transition will be followed by rigorous testing against commercial smart plugs in terms of the aforementioned metrics, where the PAD’s decentralized administrative architecture is expected to demonstrate superior wireless reliability and data privacy benefits.
The current hardware implementation is a research prototype designed solely for functional validation and demonstration, and its safety must be rigorously validated for consumer use. Future work must prioritize achieving formal safety certification and compliance testing. This necessitates certain tasks, such as including a comprehensive thermal performance analysis of the Solid-State Relay under maximum load and the implementation of industrial-grade heat sinking to manage heat dissipation effectively. Furthermore, detailed reliability studies on all switching components will be conducted to ensure long-term operational safety and regulatory adherence prior to mass manufacturing, especially during periods of extreme heat.
The existing security architecture provides robust network-level access control and pseudonymization to separate operational data from PII. The future production model requires the establishment of a clear and persistent user consent mechanism within the mobile application interface, ensuring users are fully informed about how their real-time data is processed in the cloud. Additionally, incorporating richer contextual data such as occupancy detectors, ambient temperature probes, and user activity logs, is necessary to further enrich the input space for the AI forecasting model and enhance predictive accuracy for intermittent appliances. These sensors will also require integration into the privacy framework to maintain strict user control over all collected contextual information.
Author Contributions
Conceptualization, D.S., I.V., A.A. and A.U.; methodology, D.S. and I.V.; software, D.S. and I.V.; validation, I.V. and D.S.; formal analysis, A.U. and A.A.; investigation, A.U., C.C., A.A., D.S. and I.V.; resources, D.S., C.C. and I.V.; data curation, I.V.; writing—original draft preparation, A.U.; writing—review and editing, A.U., I.V. and A.A.; visualization, D.S. and I.V.; supervision, C.C., I.V. and A.A.; project administration, C.C., A.A. and I.V.; funding acquisition, A.U. All authors have read and agreed to the published version of the manuscript.
Funding
This research received no external funding.
Data Availability Statement
The original contributions presented in this study are included in the article. Further inquiries can be directed to the corresponding author.
Conflicts of Interest
The authors declare no conflicts of interest.
Abbreviations
The following abbreviations are used in this manuscript:
| PAD | Power Administration Device |
| MoE | Mixture of Experts |
| IoT | Internet of Things |
| MQTT | Message Queuing Telemetry Transport |
| AI | Artificial Intelligence |
| ML | Machine Learning |
| AioT | Artificial Intelligence of Things |
| NILM | Non-Intrusive Load Monitoring |
| LSTM | Long Short-Term Memory |
| CNN | Convolutional Neural Network |
| JWT | JSON Web Token |
| JWKS | JSON Web Key Set |
| QoS | Quality of Service |
| I2C | Inter-Integrated Circuit |
| UART | Universal Asynchronous Receiver/Transmitter |
| SPI | Serial Peripheral Interface |
| RoPE | Rotary Positional Embedding |
| MAE | Mean Absolute Error |
| RMSE | Root Mean Square Error |
| RTT | Round-Trip Time |
References
- Abbass, K.; Qasim, M.; Song, H.; Murshed, M.; Mahmood, H.; Younis, I. A review of the global climate change impacts, adaptation, and sustainable mitigation measures. Environ. Sci. Pollut. Res. 2022, 29, 42539–42559. [Google Scholar] [CrossRef] [PubMed]
- Chen, T.-L.; Kang, T.-C.; Chang, C.-Y.; Hsiao, T.-C.; Chen, C.-C. Smart Home Power Management Based on Internet of Things and Smart Sensor Networks. Sens. Mater. 2021, 33, 1687. [Google Scholar] [CrossRef]
- Umashankar, M.; Mallikarjunaswamy, S.; Sharmila, N.; Kumar, D.; Nataraj, K.R. A Survey on IoT Protocol in Real-Time Applications and Its Architectures. In Proceedings of the 3rd International Conference on Data Science, Machine Learning and Applications, Hyderabad, India, 15–16 December 2023; Lecture Notes in Electrical Engineering; pp. 119–130. [Google Scholar] [CrossRef]
- Singh, S. Intercompatibility of IoT Devices Using Matter: Next-Generation IoT Connectivity Protocol. In Proceedings of the Advances in IoT and Security with Computational Intelligence, ICAISA 2023, New Delhi, India, 24–25 March 2023; Lecture notes in networks and systems. pp. 49–58. [Google Scholar] [CrossRef]
- Zegeye, W.K.; Jemal, A.; Kornegay, K.T. Connected Smart Home over Matter Protocol. In Proceedings of the 2023 IEEE International Conference on Consumer Electronics (ICCE), Las Vegas, NA, USA, 6–8 January 2023. [Google Scholar] [CrossRef]
- Venkatesh, J.; Aksanli, B.; Chan, C.S.; Akyürek, S.; Rosing, T.S. Scalable-Application Design for the IoT. IEEE Softw. 2017, 34, 62–70. [Google Scholar] [CrossRef]
- Mishra, B.; Kertész, A. The Use of MQTT in M2M and IoT Systems: A Survey. IEEE Access 2020, 8, 201071–201086. [Google Scholar] [CrossRef]
- Prada, M.A.; Reguera, P.; Alonso, S.; Morán, A.; Fuertes, J.J.; Domı, M. Communication with resource-constrained devices through MQTT for control education. IFAC-PapersOnLine 2016, 49, 150–155. [Google Scholar] [CrossRef]
- Hillar, G.C. MQTT Essentials—A Lightweight IoT Protocol: The Preferred IoT Publish-Subscribe Lightweight Messaging Protocol; Packt Publishing: Birmingham, UK, 2017. [Google Scholar]
- Husseini, F.E.; Noura, H.N.; Salman, O.; Chahine, K. Machine Learning in Smart Buildings: A Review of Methods, Challenges, and Future Trends. Appl. Sci. 2025, 15, 7682. [Google Scholar] [CrossRef]
- Mohanty, S.; Panda, S.; Parida, S.M.; Rout, P.K.; Sahu, B.K.; Bajaj, M.; Zawbaa, H.M.; Kumar, N.M.; Kamel, S. Demand Side Management of Electric Vehicles in Smart Grids: A Survey on Strategies, Challenges, Modeling, and Optimization. Energy Rep. 2022, 8, 12466–12490. [Google Scholar] [CrossRef]
- Kumar, P. AI-Driven Energy Management Systems for Smart Buildings. Dianwang Jishu 2024, 48, 322–337. [Google Scholar] [CrossRef]
- Tiwari, D.; Bhati, B.S.; Nagpal, B.; Alturki, N.; Bayisenge, L. Attention-augmented hybrid CNN-LSTM model for social media sentiment analysis in cryptocurrency investment decision-making. Nat. Sci. Rep. 2025, 15, 33201. [Google Scholar] [CrossRef]
- Khan, S.U.; Khan, N.; Ullah, F.U.M.; Kim, M.J.; Lee, M.Y.; Baik, S.W. Towards Intelligent Building Energy Management: AI-Based Framework for Power Consumption and Generation Forecasting. Energy Build. 2023, 279, 112705. [Google Scholar] [CrossRef]
- Rao, Z.; Zhang, Y. Transformer-Based Power System Energy Prediction Model. In Proceedings of the 2018 IEEE 4th Information Technology and Mechatronics Engineering Conference (ITOEC), Chongqing, China, 14–16 December 2020; pp. 913–917. [Google Scholar] [CrossRef]
- Cong, P.; Yuan, A.; Chen, S.; Tian, Y.; Ye, B.; Yang, T. Prediction Is All MoE Needs: Expert Load Distribution Goes from Fluctuating to Stabilizing. arXiv 2024. [Google Scholar] [CrossRef]
- Zhang, Z.; Lin, Y.; Liu, Z.; Li, P.; Sun, M.; Zhou, J. MoEfication: Transformer Feed-Forward Layers Are Mixtures of Experts. arXiv 2022. [Google Scholar] [CrossRef]
- Albraheem, L.; Alajlan, H.; Aljenedal, N.; Alkhair, L.A.; Gwead, S.B. An IoT-Based Smart Plug Energy Monitoring System. Int. J. Adv. Comput. Sci. Appl. 2023, 14, 360. [Google Scholar] [CrossRef]
- Ben Dhaou, I. Design and Implementation of an Internet-of-Things-Enabled Smart Meter and Smart Plug for Home-Energy-Management System. Electronics 2023, 12, 4041. [Google Scholar] [CrossRef]
- Condon, F.; Martínez, J.M.; Eltamaly, A.M.; Kim, Y.-C.; Ahmed, M.A. Design and Implementation of a Cloud-IoT-Based Home Energy Management System. Sensors 2023, 23, 176. [Google Scholar] [CrossRef]
- Alayed, W.; Akhtar, A.; ul Hassan, W.; Zeeshan, A. Maximizing Energy Savings in Smart Homes through Artificial Neural Network Based Artificial Intelligence Solutions. Clean Energy 2025, 9, 140–149. [Google Scholar] [CrossRef]
- Kim, T.-Y.; Cho, S.-B. Predicting Residential Energy Consumption Using CNN-LSTM Neural Networks. Energy 2019, 182, 72–81. [Google Scholar] [CrossRef]
- Porteiro, R.; Hernández-Callejo, L.; Nesmachnow, S. Electricity Demand Forecasting in Industrial and Residential Facilities Using Ensemble Machine Learning. Rev. Fac. Ing. Univ. Antioq. 2020, 102, 9–25. [Google Scholar] [CrossRef]
- Mo, Y.; Zhao, D.; Syal, M. Effective Features to Predict Residential Energy Consumption Using Machine Learning. In Proceedings of the ASCE International Conference on Computing in Civil Engineering 2019, Atlanta, GA, USA, 17–19 June 2019. [Google Scholar] [CrossRef]
- Zhou, H.; Zhang, S.; Peng, J.; Zhang, S.; Li, J.; Xiong, H.; Zhang, W. Informer: Beyond Efficient Transformer for Long Sequence Time-Series Forecasting. arXiv 2020. [Google Scholar] [CrossRef]
- Wu, H.; Xu, J.; Wang, J.; Long, M. Autoformer: Decomposition Transformers with Auto-Correlation for Long-Term Series Forecasting. arXiv 2021, arXiv:2106.13008. [Google Scholar] [CrossRef]
- Nie, Y.; Nguyen, N.H.; Sinthong, P.; Kalagnanam, J. A Time Series Is Worth 64 Words: Long-Term Forecasting with Transformers. arXiv 2023, arXiv:2211.14730. [Google Scholar] [CrossRef]
- Liu, Y.; Hu, T.; Zhang, H.; Wu, H.; Wang, S.; Ma, L.; Long, M. ITransformer: Inverted Transformers Are Effective for Time Series Forecasting. arXiv 2024, arXiv:2310.06625. [Google Scholar] [CrossRef]
- Shi, X.; Wang, S.; Nie, Y.; Li, D.; Ye, Z.; Wen, Q.; Jin, M. Time-MoE: Billion-Scale Time Series Foundation Models with Mixture of Experts. arXiv 2024, arXiv:2409.16040. [Google Scholar] [CrossRef]
- Xiao, C.; Zhao, L.; Asada, T.; Odendaal, W.G.; van Wyk, J.D. An Overview of Integratable Current Sensor Technologies. In Proceedings of the 38th IAS Annual Meeting on Conference Record of the Industry Applications Conference, 2003, Salt Lake City, UT, USA, 12–16 October 2003; Available online: https://ieeexplore.ieee.org/document/1257710 (accessed on 29 May 2022).
- Gurevich, V. Electric Relays. Available online: https://books.google.gr/books?hl=en&lr=&id=mW3LBQAAQBAJ&oi=fnd&pg=PR1&dq=electric+relays&ots=ZSJBn62Wj6&sig=Hh0YPpM3nmhlzkYbnLMJzrdqKt8&redir_esc=y#v=onepage&q=electric%20relays&f=true (accessed on 27 August 2025).
- Bender, M.; Kirdan, E.; Pahl, M.-O.; Carle, G. Open-Source MQTT Evaluation. In Proceedings of the 2021 IEEE 18th Annual Consumer Communications & Networking Conference (CCNC) 2021, Las Vegas, NV, USA, 9–12 January 2021. [Google Scholar] [CrossRef]
- Spring, R.; Hoeller, J.; Donald, K.; Sampaleanu, C.; Harrop, R.; Risberg, T.; Arendsen, A.; Davison, D.; Kopylenko, D.; Pollack, M.; et al. Spring Framework Reference Documentation, 3.2.17.RELEASE; Spring, 2013. pp. 2–4. Available online: https://docs.spring.io/spring-framework/docs/3.2.17.RELEASE/spring-framework-reference/pdf/spring-framework-reference.pdf (accessed on 29 August 2025).
- Simmons, G.J. A Survey of Information Authentication. Proc. IEEE 1988, 76, 603–620. [Google Scholar] [CrossRef]
- Arquelau, G.; de Oliveira, M.N.; Luiz, A.; Pereira, G.; Vergara, G.F.; Mosquéra, L.R.; Gonçalves, V.P. Appliance-Level Energy Consumption Dataset from a Household. Zenodo 2025. [Google Scholar] [CrossRef]
- Huang, T.; Zhang, Z.; Zhang, J. FiBiNET: Combining feature importance and bilinear feature interaction for click-through rate prediction. In Proceedings of the 13th ACM Conference on Recommender Systems 2019, Copenhagen, Denmark, 16–20 September 2019; Association for Computing Machinery: New York, NY, USA, 2019. [Google Scholar] [CrossRef]
Disclaimer/Publisher’s Note: The statements, opinions and data contained in all publications are solely those of the individual author(s) and contributor(s) and not of MDPI and/or the editor(s). MDPI and/or the editor(s) disclaim responsibility for any injury to people or property resulting from any ideas, methods, instructions or products referred to in the content. |
© 2025 by the authors. Licensee MDPI, Basel, Switzerland. This article is an open access article distributed under the terms and conditions of the Creative Commons Attribution (CC BY) license (https://creativecommons.org/licenses/by/4.0/).